Abstract
Static voltage stability (SVS) is a critical aspect of the safe and efficient operation of electrical power systems (EPS), as it reflects the system’s ability to maintain adequate voltage levels in the face of progressive increases in demand under steady-state conditions. Traditionally, improving SVS has been addressed by compensating reactive power using FACTS devices. However, this research introduces an alternative methodology based on the hybridization of transmission technologies, integrating HVAC and HVDC links in parallel, to increase the stability margin and optimize performance in the event of contingencies. The proposed methodology is based on the resolution of the optimal AC power flow (OPF-AC) and the analysis of P-V curves to evaluate the displacement of the critical collapse point. The validity of the approach was verified through simulations in the Generation-Infinite Busbar and IEEE 9-busbar models, using the DIgSILENT PowerFactory environment. The results obtained show significant improvements in the SVS margin: an increase of 4.6% in the infinite busbar generation system, 9.5% in the critical busbar of the IEEE 9-busbar system, and 7.6% in the critical busbar of the IEEE 30-busbar system. In addition, the hybrid scheme showed a 17.1% reduction in real power losses and a more efficient redistribution of energy flows, which translates into a decrease in line load capacity. It should be noted that, under an N-1 contingency scenario, the hybrid system showed a 13.3% improvement in maximum power transfer before collapse, confirming its effectiveness under critical conditions. These findings position HVAC/HVDC hybridization as a robust and scalable alternative for strengthening voltage stability in modern electrical systems subject to operational variability.
1. Introduction
One of the main challenges in EPS is maintaining voltage stability in the face of factors such as transmission line (TL) overload, progressive increases in demand, and variable weather conditions, all of which negatively affect system performance, generating imbalances between generation and demand and causing voltage drops [1].
The EPS operates in three main stages. First, in the generation stage, various forms of energy—thermal, kinetic, wind, or potential—are transformed into electricity. The energy generated is then transported through the transmission system to substations, where it is finally distributed and sold to meet energy demand [2]. In this context, the transmission system plays an important role, as it must operate under conditions that ensure voltage stability, particularly in the event of load increases.
However, the growing penetration of renewable sources introduces new challenges, as these technologies have different dynamic characteristics compared to conventional generation plants, which can compromise the security of the electricity supply [3].
Voltage instability events usually manifest initially as slow variations in the voltage profile, followed by a sharp drop as the system approaches critical conditions. This behavior can be evaluated by a static analysis, known as static voltage stability. For this purpose, P-V and Q-V curves are commonly used. The P-V curve shows how voltage varies as a function of different load levels. This representation allows the maximum permissible real power load margin to be identified before the system reaches an unstable operating point, which is known as the static stability margin [4,5].
Voltage instability can trigger the disconnection of equipment, transmission lines, or loads, activating system protection mechanisms. This phenomenon can lead to cascading disconnection events [6]. This problem has been identified as one of the leading historical causes of large-scale blackouts, posing a serious risk to the safe operation of the EPS. For this reason, the system must be able to maintain stable voltage levels, which depend on coordination between generation and transmission to meet demand [7,8]. Consequently, rigorous EPS planning is required to ensure generation-demand balance, minimize operating costs, and preserve voltage stability [9].
Likewise, external factors, particularly weather conditions, significantly influence system stability. Variables such as ambient temperature, wind speed, and altitude directly affect the behavior of transmission lines, especially in highly variable scenarios. For example, in Asian regions with freezing climates or areas of the western United States with high temperatures, severe tensions between generations and demand have been recorded. Recent studies have shown that considering the thermal behavior of TLs under environmental conditions improves the accuracy of power flow calculations and the determination of transmission limits [10].
1.1. Literature Review
Hybrid HVAC/HVDC systems offer substantial technical and economic advantages for modern transmission planning. These configurations enable increased power transfer capability, reduced electrical losses, and improved integration of intermittent renewable energy sources. These benefits are particularly significant in long-distance corridors or in systems with high renewable penetration, where stability and power-flow control become more critical [11,12,13,14,15]. Multiple case studies in regions such as Europe, the Middle East, and Africa have demonstrated the technical and economic feasibility of hybrid networks. These projects indicate that combining HVAC and HVDC can accelerate the energy transition and modernize aging power systems while maintaining high levels of reliability and efficiency [12,14,15].
On the other hand, several methods for improving SVS can be found in scientific literature. In [16], a voltage source converter (VSC)-based HVDC transmission system was modeled and simulated on Nigeria’s 330 kV transmission network to evaluate the reliability and stability of the Nigerian transmission system, which experiences frequent outages and weak voltage levels. The study identified the weakest buses as points of interest for the HVDC system simulation; the main objective was to evaluate the SVS of the network under existing conditions and determine the impact of the HVDC system. The analysis was performed by comparing the real power-voltage (P-V) curves with and without the HVDC line, demonstrating that the HVDC system improves SVS and increases load capacity.
In a related study, ref. [17] analyzed the variables that affect SVS in HVDC-VSC systems and proposed control mechanisms to mitigate their effects. The research highlights that the system offers operational advantages in terms of voltage stability, reducing overvoltages and risks of instability.
A strategy that improves SVS in modern electrical systems under normal, contingency, and stress operating conditions is presented by [18], where a multi-objective formulation is adapted within the classic OPF problem, considering generation costs, transmission losses, and a voltage collapse proximity index (VCPI) as a stability metric. To analyze the different scenarios, studies were carried out on the 30- and 57-bus IEEE systems in MATPOWER, where it was demonstrated that multi-objective optimization improves voltage stability by 28.13% and reduces losses by 14.69% compared to the initial case. Furthermore, optimization showed improvements in the line outage contingency scenario, where voltage stability improved by 13.6% and losses were reduced by 23.19%. However, under stress conditions, the multi-objective model is more effective, as it enhances stability by 8.77% and reduces losses by 6.97%, making it an effective proposal for preventing voltage collapses in electrical systems.
It should be noted that most of the proposed methodologies for improving SVS are implemented using FACTS, which are devices that control electrical parameters such as power flows, voltage, and LV impedance, helping to maintain system stability. Among the main FACTS devices are static synchronous compensators (STATCOM), series synchronous compensators (SSSC), static VAR compensators (SVC), thyristor-controlled series capacitors (TCSC), on-load tap-changing transformers (OLTC), and unified power flow controllers (UPFC), which are discussed in detail in [19,20]. The objective of these devices is to improve power flows through LVs by minimizing problems such as overloads, voltage instability, transmission capacity losses, etc. [19].
The use of FACTS devices is a viable alternative for improving voltage stability. In [21], a study is presented for implementing a STATCOM in a transmission system and improving the SVS. The results demonstrated that STATCOM improves voltage performance under both normal and adverse conditions. On the other hand, in [22], a methodology for the optimal location of FACTS is used based on voltage sensitivity analysis; the method is used to locate these devices in the weakest busbars of the system, improving the limits of the SVS and reducing real power losses.
In [23], a study was developed that uses genetic algorithms to determine the optimal location of STATCOM devices by identifying critical points in the system; it was demonstrated that the proper installation of these FACTS devices improves the voltage profile. Similarly, in [24], adaptive techniques are used for voltage control using STATCOM to counteract voltage drops. In addition, optimization algorithms improve the SVS, as demonstrated in [25,26].
As mentioned above, load variation significantly affects voltage levels in the system buses. To mitigate this effect, various studies have proposed the use of on-load tap-changing transformers (OLTCs) to improve voltage stability or maximize its compliance rate [27,28].
On the other hand, constant monitoring of voltage stability is considered important. To this end, a comprehensive effort has been made to review more than 40 voltage stability indices, performing a detailed comparative analysis that shows the similarities, formulations, and strengths of each index to facilitate their study and application [29]. Some indices are used as objective functions [1] to solve optimal power flows [18,30], reactive power dispatch [31], or the optimal location of reactive compensation [32]. Another study proposes a systematic SVS index that facilitates the analysis of the impact of distributed generation backed by inverters. The index reflects the system’s SVS and shows an intrinsic relationship between the SVS coefficients and the drop coefficients of distributed generators [33].
1.2. Importance and Main Contributions
The literature review shows that, although there are numerous methods for improving SVS in electrical power systems, most focus on FACTS devices—such as STATCOM, SVC, TCSC, and UPFC—to control power flows, compensate for reactive power, and improve voltage profiles under various operating conditions [19,21,22].
Likewise, strategies based on multi-objective optimization have been explored to improve stability and economic efficiency [18], and techniques have been proposed for the optimal location of these devices, with favorable results in reducing losses and increasing the stability margin [23,24]. On the other hand, recent work has evaluated the integration of HVDC systems, especially those based on VSC, showing significant improvements in voltage stability and load capacity, even under adverse conditions and contingencies [16,17]. However, most of this research does not consider static evaluation using P-V curves or the combined impact of HVAC-HVDC hybridization on stability under normal conditions and contingencies.
In this context, the present study provides a methodology based on optimal AC power flows to improve static voltage stability through the hybridization of transmission systems, using P-V curve analysis to identify the shift in the critical collapse point and the increase in the power transfer margin. The analysis is also performed under N-1 contingency scenarios. The main contribution of this work is to demonstrate that the hybridization of transmission systems improves voltage stability in the steady state.
1.3. Organization
This study is organized as follows: Section 1 presents the introduction along with a literature review that identifies the gap that motivates this research. Section 2 is devoted to related work that supports the study. Section 3 details the formulation of the problem and the proposed methodology for evaluating voltage stability. Section 4 presents the analysis and interpretation of the results, and finally, Section 5 presents the conclusions of the study.
2. Background
2.1. Static Voltage Stability
The voltage stability of the EPS is its ability to maintain optimal voltage levels close to the nominal value under stable operating conditions or after being subjected to a disturbance [1,6].
Several studies have addressed this issue using P-V curve analysis (shown in Figure 1), which allows the behavior of the system in a steady state to be evaluated as the load on a specific busbar is progressively increased until a voltage collapse point is reached. This curve establishes the relationship between the real power (P) transferred and the voltage (V) at the receiving node, providing information on the stability margin of the system [34,35].
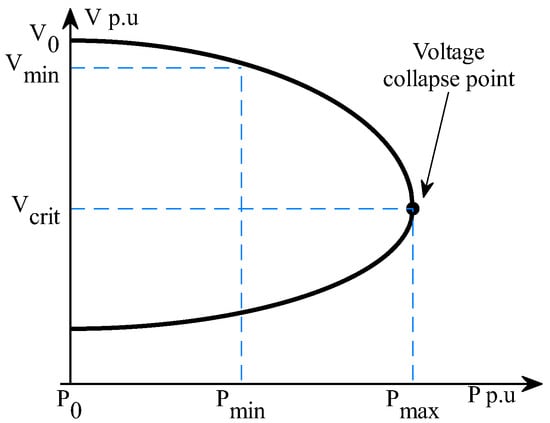
Figure 1.
PV curve analysis: voltage behavior under incremental real power loading.
As a complement to the static analysis, the initial delta angle () of the synchronous generator is evaluated in the infinite bus generation model, which represents the initial conditions of the system before and after hybridization. The electrical power for a predominantly inductive system is described by (1), while for a system with resistive-inductive impedance, Equation (2) [36] is used. Figure 2 illustrates the P– curve, which helps to contextualize the steady state of the system and its behavior in response to changes in the power grid configuration.
where:
- : Electrical power transferred from the generator to the infinite busbar.
- : Maximum transferable power.
- E: Internal voltage of the synchronous machine.
- V: Voltage at the infinite busbar.
- : Equivalent reactance.
- : Angular difference between E and V.
- : Susceptance of element i-j of the busbar admittance matrix ().
- : Admittance angle of element i-j of the matrix .

Figure 2.
Representation of the P- relationship used to determine the maximum power transfer point.
2.2. Optimal Power Flows AC (OPF-AC)
In this study, OPF-AC is used to identify the critical link within the system. This mathematical tool integrates power flow analysis with economic dispatch, seeking to optimize an objective function subject to various constraints, such as limits on power flow, voltages, and operating costs [37]. The objective of the AC-OPF is to solve an optimization problem that maximizes or minimizes the objective function, ensuring compliance with equality and inequality constraints. In this way, an operating point is determined that satisfies the technical and economic requirements for the safe operation of the EPS [35,36].
To solve the OPF-AC, the minimization of generation costs, expressed in (3), is considered. Equation (4) represents the real power balance, establishing that, for each bus i, the real power generated is equal to the power demanded plus the sum of the powers exchanged with the rest of the system. Similarly, (5) imposes the reactive power balance. These equations constitute the fundamental constraints that guarantee the real and reactive power balance at each busbar of the EPS. Finally, (6) and (7) describe the real and reactive power flow through the transmission lines [38,39].
- O.F.:
- F: Objective function to be minimized.
- : Number of generators in the system.
- : Unit generation cost.
- : Set of all buses in the system.
- : Real power generated by generator g.
- : Real power generated at bus i.
- : Real power demand at bus i.
- : Real power transferred between buses i and j.
- : Reactive power transferred between buses i and j.
- : Reactive power generated at bus i.
- : Reactive power demand at bus i.
- : Voltage magnitude at bus i in p.u.
- : Voltage magnitude at bus j in p.u.
- : Conductance of element i-j of matrix .
- : Susceptance of element i-j of matrix .
- : Admittance angle of element i-j of matrix .
In addition, inequalities constitute constraints that delimit the operating ranges within which the EPS variables must be maintained. The superscript min indicates the lower limit, while the superscript max indicates the upper limit. Equations (8) and (9) define the limits for real and reactive power generation, respectively; Equations (10) and (11) establish the limits for real and reactive power through the transmission lines. Equation (12) sets the permissible voltage limits at each busbar, while the restriction on the voltage phase angle is given by (13), and the angular difference between busbars is represented in (14). Finally, (15) defines the maximum apparent capacity of the transmission lines, denoted by [39].
Furthermore, in the OPF-AC study, transmission line losses, given in (16), are a highly significant factor that must be taken into account [40]:
2.3. HVDC System Modeling
HVDC transmission allows large blocks of energy to be transferred over longer distances with fewer losses compared to high-voltage alternating current (HVAC) transmission. it also offers multiple technical advantages such as no reactive power consumption, high control capability, and cost-effectiveness in large-scale applications [9,41].
In HVDC-LCC (line-commutated converter) systems, the main devices in the power circuit comprise the converters responsible for converting energy between alternating current (AC) and direct current (DC), DC TL to interconnect the conversion terminals, coupling transformers, reactive power compensators, and harmonic filters, as shown in Figure 3 [41,42].
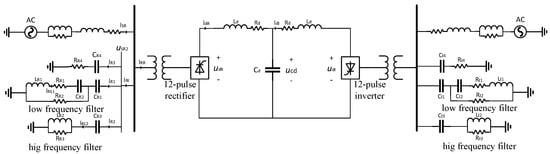
Figure 3.
Schematic representation of the main components of an HVDC-LCC power conversion system.
The converters located at each end of the HVDC system have a 12-pulse configuration, connected via a Y-Y and Y-Δ topology to the AC networks. The converter circuit includes a DC capacitor, reactors, AC filters, thyristor bridges, and the transformer winding.
Within the set of elements considered, the DC line is represented by a concentrated parameter model described in (17), where the subscript “R” in each variable denotes the rectification side of the system, while the subscript “I” denotes the inversion side. In (18) represents the modeling of the rectifier converter [41]:
where:
- : DC capacitor.
- : Voltage across the DC capacitor.
- : DC voltage.
- : DC current.
- : DC resistance.
- R: AC resistance.
- : Equivalent switching reactance.
- : AC voltage on the rectifier side.
- x: x-axis component.
- y: y-axis component.
- : Current to the converter station.
- : Rectifier firing angle.
- : Rectifier output voltage.
- , : x and y components of the AC voltage.
- , : x and y components of the current to the rectifier.
The filter located on the rectifier side is modeled by (19), which is configured by three distinct branches shown in Figure 3, where the first branch corresponds to capacitive compensation, the second is a low-frequency filter, and the third is a high-frequency filter designed to attenuate specific harmonics and stabilize the waveform.
where:
- C: AC capacitor
- L: AC inductor
- : Voltage across the AC capacitor
- : Voltage across the AC inductor
- : Voltage across the AC resistor
- : Current in the AC inductor
- : Current to the low-frequency filter
- : Current to the high-frequency filter
- : Current to the reactive compensator
3. Problem Statement and Methodology
To solve the SVS problem, a transmission system is hybridized using simulation. Algorithm 1 summarizes the proposed methodology, which is based on solving an AC optimal power flow to minimize generation costs and identify the critical transmission branch. The HVDC link is subsequently modeled in parallel with this branch to form the hybrid HVAC/HVDC configuration.
As a first step, the infinite bus generation electrical system is parameterized with the data shown in Figure 4, and the 9-bus IEEE (whose data is shown in the tables in the Appendix A). Then, the OPF-AC is calculated considering Equations (3)–(16), and the results are saved for comparison with the hybrid system. With these results, the critical link corresponding to the TL with the highest load capacity is identified, in which the hybrid system is modeled by adding an HVDC line (the HVDC line model is shown in Figure 3) in parallel to the existing HVAC line with the electrical parameters of the existing AC line. Next, the AC OPF is recalculated to obtain the hybrid system data for the results analysis.
| Algorithm 1 Methodology for Evaluating Hybrid HVAC/HVDC Transmission Schemes |
|
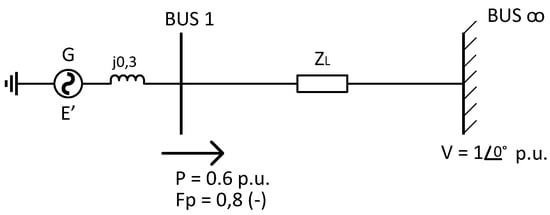
Figure 4.
Single-machine infinite-bus model.
Case Studies
This work was developed based on simulations carried out using DIgSILENT PowerFactory software. The proposed methodology was tested on the infinite busbar generation system (Figure 4) and on the IEEE 9-bus model (Figure 5).
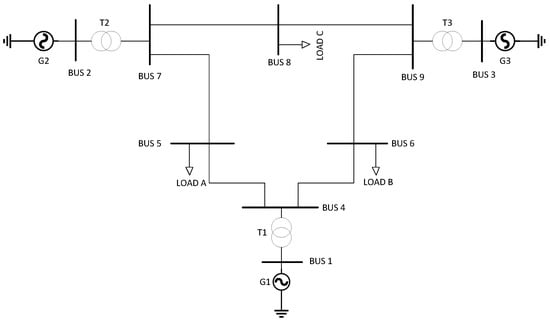
Figure 5.
9-bar IEEE system.
In the first case, the OPF-AC and the P-V curve of the buses with loads from the original model are calculated without modifications. From this, the results are obtained that will serve as a starting point for validating the proposed methodology. In addition, these results are used to identify the critical link in the system for simulating the other cases.
In the second case, the HVAC line of the critical link is replaced with the HVDC system and the results are saved for later analysis. In the third case study, the hybrid HVAC/HVDC system is simulated and its behavior is evaluated by comparing the results with the first two case studies.
Additionally, the P- curve is evaluated in the infinite bus generation model to show the behavior of the initial angle considering case 1 and case 3. To perform the calculations, the same of the critical link is assumed, considering the base power of 100 MVA and base voltage of 230 kV. In addition, the IEEE 9-bus system was tested with and without the hybrid transmission system in the event of an N-1 contingency, specifically, the output of an TL.
4. Results Analysis
The results of the proposed methodology for each EPS considered and each case study are shown below:
4.1. Infinite Busbar Generation System
Figure 6 compares the P-V curve of the HVAC system and the hybrid transmission system, analyzing the voltage behavior as a function of the real power demand at the load bus. The collapse point in the HVAC system was recorded at 258.2 MW, while in the hybrid system, this limit extends to 270 MW, representing an improvement of 11.8 MW over the initial case; this indicates a better response of the hybrid system to transfer more power to the load before reaching voltage collapse.
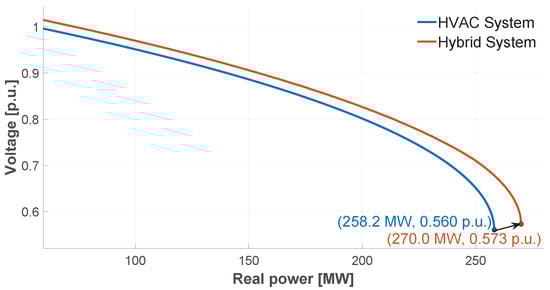
Figure 6.
Comparative P-V curve analysis of voltage stability for HVAC and Hybrid systems.
The initial angle of the generator in the P- curve for both scenarios is shown in Figure 7. The initial delta value of the HVAC system is 0.188 radians, while in the hybrid system it is 0.17 radians. This decrease in the initial delta is due to the existence of the parallel DC line, which reduces the equivalent impedance. In addition, a reduced delta angle indicates a better response of the hybrid system to maintain stability.
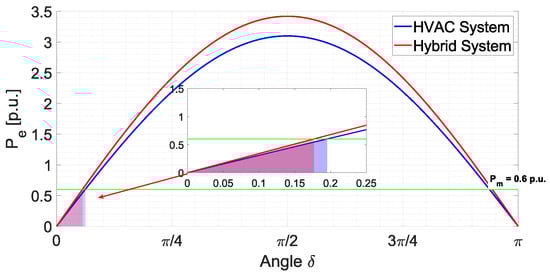
Figure 7.
Comparative rotor angle stability analysis of HVAC and Hybrid systems at constant mechanical power. The colors is to differentiate the acceleration areas by modifying the stability point.
4.2. IEEE 9-Busbar Test System
The OPF-AC results for the first case study show that the most demanding link in the system is line 4–5, as it has the highest load capacity among all the sections analyzed. The OPF-AC solution in the three case studies shows the allocation of real power generation in the HVAC, HVDC, and hybrid transmission schemes shown in Figure 8. In all scenarios, generator G1 provides the largest share of generation, which is explained by the direct connection of the transmission link to the high-voltage side of the transformer coupled to G1, extending to busbar 5, which acts as the main load node.
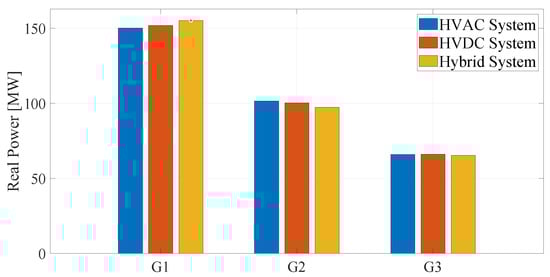
Figure 8.
Real power dispatch per generator across HVAC, HVDC, and hybrid system configurations.
In the second case study, there is greater reactive power generation compared to the other scenarios. This is because the HVDC link does not provide reactive power support, forcing the system generators to compensate for both the reactive demand of the network and the consumption associated with the converter on the rectification side. This condition is reflected in the behavior shown in Figure 9.
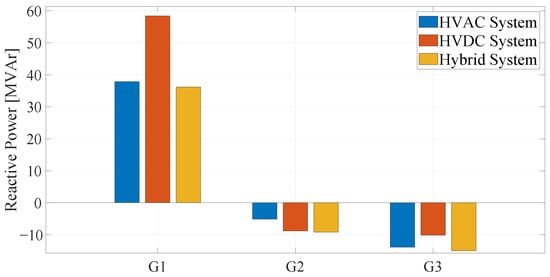
Figure 9.
Reactive power dispatch per generator across HVAC, HVDC, and hybrid system configurations.
Figure 10 shows the voltage magnitude at each busbar, expressed in p.u. A slight improvement in the voltage profile can be observed with the HVDC system and the hybrid transmission configuration, especially at busbar 5. In this busbar, the initial voltage was 0.989 p.u.; with the HVDC system, it increased to 0.998 p.u. and with the hybrid system to 0.997 p.u. In the other busbars, the voltage levels remain within the established operating limits, as a result of the restrictions imposed in the formulation of the OPF-AC.
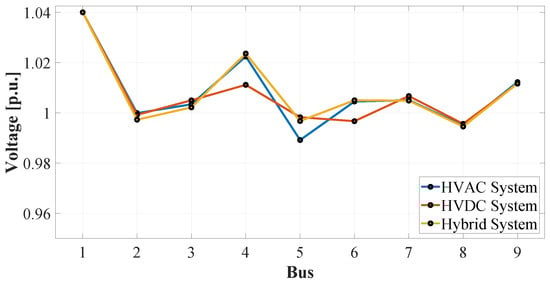
Figure 10.
Voltage profiles across the network buses for HVAC, HVDC, and Hybrid configurations.
Figure 11 illustrates the voltage angle at each busbar. There is a phase shift of approximately 150° between busbars 4 and 9 with respect to the previous busbars, attributable to the connection group of the transformers, configured in delta on the low-voltage side and star with neutral on the high-voltage side (connection group 5).
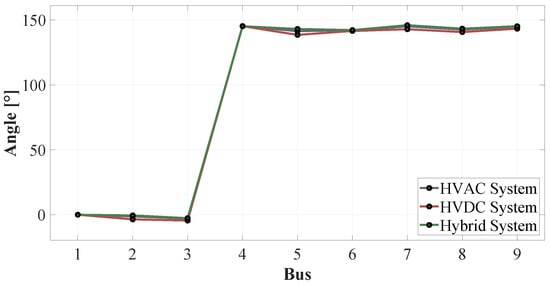
Figure 11.
Voltage angle across the network buses for HVAC, HVDC, and Hybrid configurations.
The hybrid system shows better overall performance in terms of load capacity and power losses in the lines, as can be seen in Figure 12 and Figure 13. Both graphs show a reduction in both line load and losses. In contrast, the HVDC system operating independently has lower performance, with higher load levels and line losses compared to the other two scenarios. This situation highlights the importance of implementing reactive power compensation mechanisms at the ends of the HVDC link, especially when load is connected to one of its terminals.
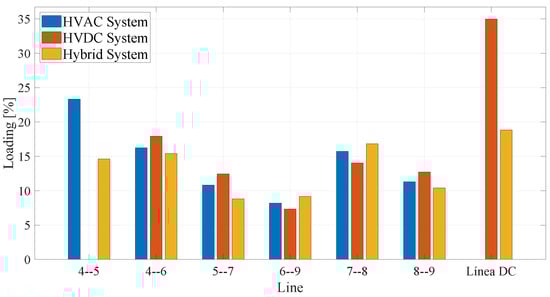
Figure 12.
Transmission line loading percentage across HVAC, HVDC, and hybrid system configurations.
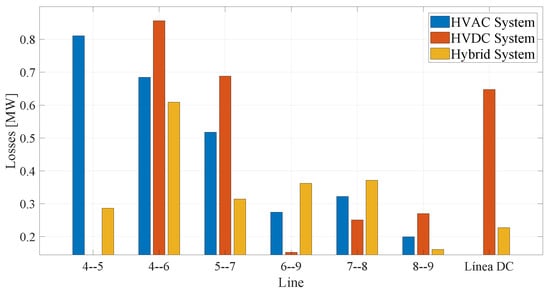
Figure 13.
Real power losses per transmission line across HVAC, HVDC, and Hybrid system configurations.
Figure 14 shows the distribution of power flow through the transmission lines for the three case studies. In case 1, corresponding to the HVAC system, line 4–5 carries the highest power. In cases 2 and 3, the flow is redistributed due to the incorporation of the HVDC link. Particularly in case 3, there is a balanced division of power flow between the AC and DC lines associated with link 4–5.
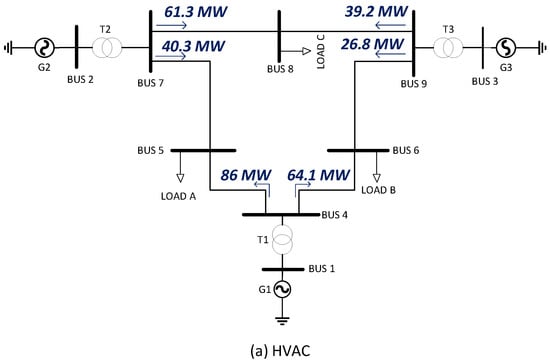
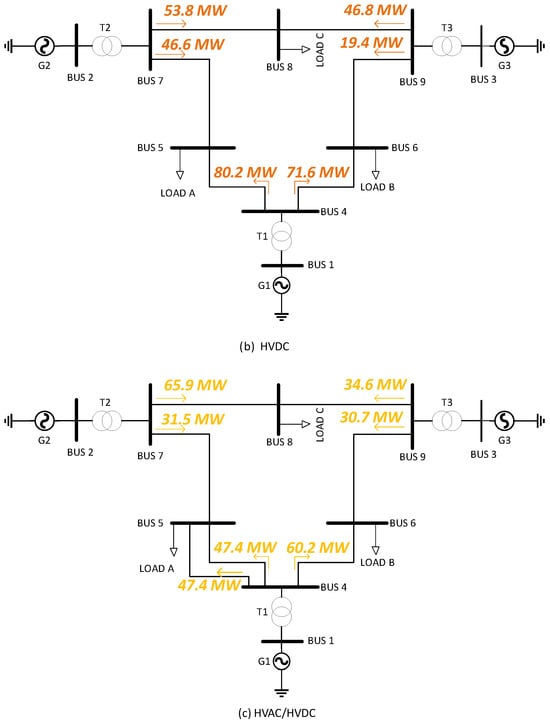
Figure 14.
Real power flow through transmission lines for HVAC, HVDC, and Hybrid system configurations. Different colors were used to differentiate each study shown.
The results of the P-V curves for the first case study show the voltage collapse point on busbar 5 (Figure 15), which occurs with a power transfer of 405.9 MW and a minimum voltage of 0.63 p.u. In the case of the HVDC system, the absence of reactive power compensation causes a sharp drop in voltage at that busbar, significantly limiting its ability to transfer power as demand increases. This limitation is critical, as the HVDC link is the main power supply route to bus 5 from the Slack generator.
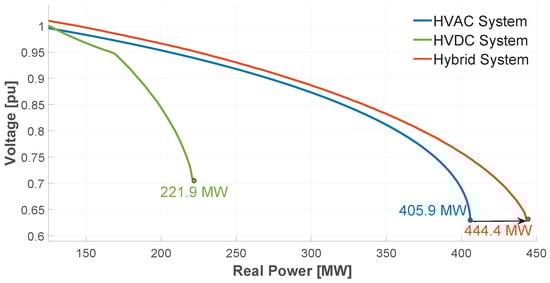
Figure 15.
Enhanced voltage stability margin of the hybrid system revealed by P-V curve analysis against HVAC and HVDC benchmarks.
As a result, the maximum power transferred before the collapse is reduced to 221.9 MW. In contrast, the hybrid system allows for a favorable shift of the critical point, reaching a maximum transfer capacity of 444.4 MW, which represents an improvement of 38.5 MW over the original HVAC system. These results, as in case 1, confirm that the hybrid system offers greater robustness against load increases, delaying voltage collapse and improving the stability margin of the system.
In the event of an N-1 contingency, corresponding to the disconnection of line 8–9, the behavior of the P-V curve in bus 5 (Figure 16) is analyzed. In this condition, the power transfer capacity in the base case is 374.7 MW, while in the hybrid system it increases to 424.4 MW, representing an improvement of 49.7 MW.
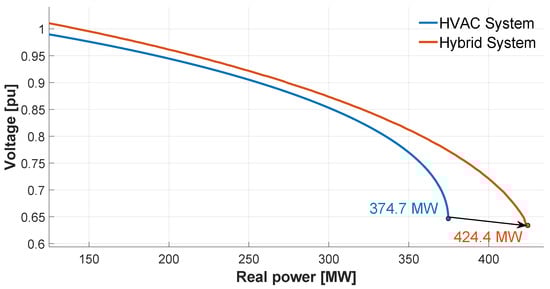
Figure 16.
P-V curve of bar 5 in response to contingency N-1.
4.3. IEEE 30-Busbar Test System
In addition to the proposal, the methodology was tested on the 30-bus IEEE test system (the system parameters are shown in Appendix B). Table 1 shows the results of the optimal power flow for the HVAC and Hybrid systems, comparing the voltage magnitudes and angles of each bus.

Table 1.
Voltage magnitude and angle comparison between HVAC and Hybrid Systems for 30-bus IEEE test system.
Likewise, Table 2 shows the load capacity of the transmission lines for both systems. Here, the high-voltage transmission lines are shown, excluding those with a voltage level of 33 kV. A reduction in load capacity is observed in transmission lines 6–7, given that the hybrid transmission system was modeled on this link. It should be noted that the TLs that interconnect the busbars with voltage-controlled generators were not considered for hybridization.
Table 2.
Comparison of transmission line loading between HVAC and hybrid systems.
The analysis of the P-V curve indicates an improvement in system stability with the hybrid system, as shown in Figure 17; in this case, the collapse point increases from 430.5 MW to 463.2 MW, i.e., an improvement of 32.7 MW. On the other hand, Figure 18 shows the response of both systems to the output of lines 5–7, where there is an improvement in power transfer of 22.3 MW for the hybrid system compared to the HVAC system.
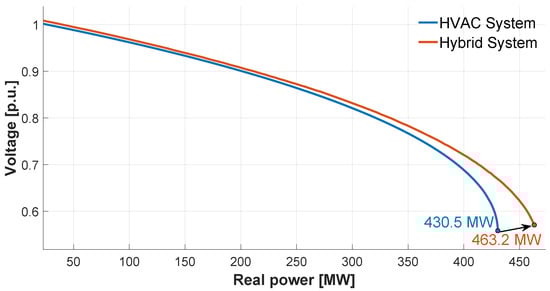
Figure 17.
Enhanced voltage stability margin of the hybrid system revealed by P-V curve analysis against HVAC benchmark.
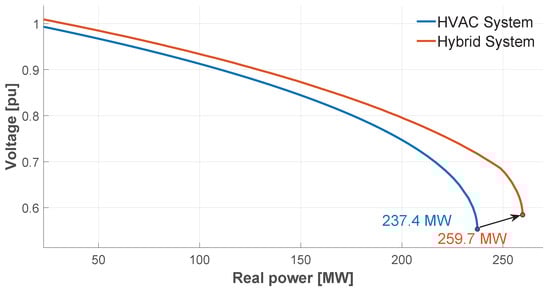
Figure 18.
P-V curve of bar 7 in response to contingency N-1.
5. Conclusions
This paper presented a methodology for improving static voltage stability in the EPS through the hybridization of transmission systems. The work demonstrated that operating an HVDC transmission system in parallel with an HVAC system is an effective solution for improving power transfer as the load increases before reaching a voltage collapse point.
The hybridization of the transmission system in the Generation-Infinite Bus model showed an improvement in the voltage collapse point in the P-V curve in Figure 6, representing an additional margin of 4.6% in the SVS compared to the initial case. In contrast, in the P-V curve of Figure 15 of the IEEE 9-bus model, power transfer increased by 38.5 MW, representing a 9.5% increase in the SVS. In addition, losses in the transmission lines in the first case were 2.81 MW, and with the hybrid model, 2.33 MW, i.e., a reduction of 17.1%.
The second case study showed that the HVDC system, without a reactive power compensation supplement, is not capable of improving static stability conditions, so it is necessary to consider reactive control to help maintain system stability when there is an increase in power flow on the DC line.
The evaluation of the hybrid system in the event of an N-1 contingency (Figure 16) indicates a better response compared to the initial case, where the power transferred before the collapse was 374.7 MW. At the same time, in the hybrid system, it was 424.4 MW, representing an improvement of 13.3%.
Finally, the methodology was tested on the 30-bus IEEE system, showing a 7.6% improvement in stability compared to the initial case; likewise, the hybrid system had a 9.4% increase in stability margin in the event of an N-1 contingency.
Author Contributions
Conceptualization, D.C.; Methodology, D.C. and J.V.; Formal analysis, J.V.; Data curation, D.C.; Writing original draft, J.V.; Writing review & editing, D.C. and J.V.; Supervision, D.C.; Project administration, D.C.; Funding acquisition, D.C. All authors have read and agreed to the published version of the manuscript.
Funding
Salesian Polytechnic University and GIREI-Smart Grid Research Group supported this work.
Data Availability Statement
The original contributions presented in this study are included in the article. Further inquiries can be directed to the corresponding author.
Conflicts of Interest
The authors declare no conflicts of interest.
Appendix A. Technical and Economic Data Used in the Analysis of the IEEE 9-Busbar Test System
Table A1.
Lines data.
Table A1.
Lines data.
| Line | R [] | X [] | B [μS] | SIL [MW] |
|---|---|---|---|---|
| 4–5 | 5.29 | 44.97 | 332.7 | 143.9 |
| 4–6 | 8.99 | 48.67 | 298.69 | 131.1 |
| 5–7 | 16.93 | 85.17 | 578.45 | 137.9 |
| 6–9 | 20.63 | 89.93 | 676.45 | 145.1 |
| 7–8 | 4.50 | 38.09 | 281.66 | 143.9 |
| 8–9 | 6.30 | 53.32 | 395.08 | 144.1 |
Table A2.
Loads data.
Table A2.
Loads data.
| Load | Bus | P [MW] | Q [MVAr] |
|---|---|---|---|
| A | 5 | 125 | 50 |
| B | 6 | 90 | 30 |
| C | 8 | 100 | 35 |
Table A3.
Generator data.
Table A3.
Generator data.
| Generator | Bus | Dispatch [MW] | V [p.u.] | a | b | c |
|---|---|---|---|---|---|---|
| G1 | 5 | 125 | 1.040 | 0.1100 | 5.00 | 150 |
| G2 | 6 | 163 | 1.025 | 0.0850 | 1.20 | 600 |
| G3 | 8 | 85 | 1.025 | 0.1225 | 1.00 | 335 |
Appendix B. Technical and Economic Data Used in the Analysis of the IEEE 30-Busbar Test System
Table A4.
Lines data.
Table A4.
Lines data.
| Line | R [p.u.] | X [p.u.] | B [p.u.] |
|---|---|---|---|
| 1–2 | 0.0192 | 0.0575 | 0.0528 |
| 1–3 | 0.0452 | 0.1652 | 0.0408 |
| 2–4 | 0.0570 | 0.1737 | 0.0368 |
| 3–4 | 0.0132 | 0.0379 | 0.0084 |
| 2–5 | 0.0472 | 0.1983 | 0.0418 |
| 2–6 | 0.0581 | 0.1763 | 0.0374 |
| 4–6 | 0.0119 | 0.0414 | 0.0090 |
| 5–7 | 0.0460 | 0.1160 | 0.0204 |
| 6–7 | 0.0267 | 0.0820 | 0.0170 |
| 6–8 | 0.0120 | 0.0420 | 0.0090 |
| 6–9 | 0.0000 | 0.2080 | 0.0000 |
| 6–10 | 0.0000 | 0.5560 | 0.0000 |
| 9–11 | 0.0000 | 0.2080 | 0.0000 |
| 9–10 | 0.0000 | 0.1100 | 0.0000 |
| 4–12 | 0.0000 | 0.2560 | 0.0000 |
| 12–13 | 0.0000 | 0.1400 | 0.0000 |
| 12–14 | 0.1231 | 0.2559 | 0.0000 |
| 12–15 | 0.0662 | 0.1304 | 0.0000 |
| 12–16 | 0.0945 | 0.1987 | 0.0000 |
| 14–15 | 0.2210 | 0.1997 | 0.0000 |
| 16–17 | 0.0524 | 0.1923 | 0.0000 |
| 15–18 | 0.1073 | 0.2185 | 0.0000 |
| 18–19 | 0.0639 | 0.1292 | 0.0000 |
| 19–20 | 0.0340 | 0.0680 | 0.0000 |
| 10–20 | 0.0936 | 0.2090 | 0.0000 |
| 10–17 | 0.0324 | 0.0845 | 0.0000 |
| 10–21 | 0.0348 | 0.0749 | 0.0000 |
| 10–22 | 0.0727 | 0.1499 | 0.0000 |
| 21–22 | 0.0116 | 0.0236 | 0.0000 |
| 15–23 | 0.1000 | 0.2020 | 0.0000 |
| 22–24 | 0.1150 | 0.1790 | 0.0000 |
| 23–24 | 0.1320 | 0.2700 | 0.0000 |
| 24–25 | 0.1885 | 0.3292 | 0.0000 |
| 25–26 | 0.2544 | 0.3800 | 0.0000 |
| 25–27 | 0.1093 | 0.2087 | 0.0000 |
| 28–27 | 0.0000 | 0.3960 | 0.0000 |
| 27–29 | 0.2198 | 0.4153 | 0.0000 |
| 27–30 | 0.3202 | 0.6027 | 0.0000 |
| 29–30 | 0.2399 | 0.4533 | 0.0000 |
| 8–28 | 0.0636 | 0.2000 | 0.0428 |
| 6–28 | 0.0169 | 0.0599 | 0.0130 |
Table A5.
Loads data.
Table A5.
Loads data.
| Bus | P [MW] | Q [MVAR] |
|---|---|---|
| 2 | 21.7 | 12.7 |
| 3 | 2.4 | 1.2 |
| 4 | 7.6 | 1.6 |
| 5 | 94.2 | 19.0 |
| 7 | 22.8 | 10.9 |
| 8 | 30.0 | 30.0 |
| 10 | 5.8 | 2.0 |
| 12 | 11.2 | 7.5 |
| 14 | 6.2 | 1.6 |
| 15 | 8.2 | 2.5 |
| 16 | 3.5 | 1.8 |
| 17 | 9.0 | 5.8 |
| 18 | 3.2 | 0.9 |
| 19 | 9.5 | 3.4 |
| 20 | 2.2 | 0.7 |
| 21 | 17.5 | 11.2 |
| 23 | 3.2 | 1.6 |
| 24 | 8.7 | 6.7 |
| 26 | 3.5 | 2.3 |
| 29 | 2.4 | 0.9 |
| 30 | 10.6 | 1.9 |
Table A6.
Generator data.
Table A6.
Generator data.
| Generator | Bus | Dispatch [MW] | V [p.u.] | a | b | c |
|---|---|---|---|---|---|---|
| G1 | 1 | 260.2 | 1.060 | 0.00375 | 2.00 | 0 |
| G2 | 2 | 40 | 1.043 | 0.01750 | 1.75 | 0 |
| G3 | 5 | 0 | 1.010 | 0.06250 | 1.00 | 0 |
| G4 | 8 | 0 | 1.010 | 0.00834 | 3.25 | 0 |
| G5 | 11 | 0.0 | 1.082 | 0.02500 | 3.00 | 0 |
| G6 | 13 | 0.0 | 1.071 | 0.02500 | 3.00 | 0 |
References
- Ismail, B.; Wahab, N.I.A.; Othman, M.L.; Radzi, M.A.M.; Vijayakumar, K.N.; Rahmat, M.K.; Naain, M.N.M. New Line Voltage Stability Index (BVSI) for Voltage Stability Assessment in Power System: The Comparative Studies. IEEE Access 2022, 10, 103906–103931. [Google Scholar] [CrossRef]
- Santos, E.; Jiménez, E.; Acosta, E.; Pérez, C.; León, M.; Viveros, C.; Ruiz, P.; Tovar, H. Analysis of Sensitivity Formulations for Voltage Stability and Reactive Power Control. In Proceedings of the 2020 IEEE International Autumn Meeting on Power, Electronics and Computing (ROPEC), Ixtapa, Mexico, 4–6 November 2020; Volume 4, pp. 1–6. [Google Scholar] [CrossRef]
- Wang, T.; Wang, S.; Ma, S.; Guo, J.; Zhou, X. An Extended Continuation Power Flow Method for Static Voltage Stability Assessment of Renewable Power Generation-Penetrated Power Systems. IEEE Trans. Circuits Syst. II Express Briefs 2024, 71, 892–896. [Google Scholar] [CrossRef]
- Krismanto, A.U.; Sulistiawati, I.B.; Limpraptono, F.Y.; Priyadi, A.; Setiadi, H.; Abdillah, M. Impact of large-scale wind power penetration on dynamic voltage stability of interconnected power system: An Indonesia case study. Int. J. Intell. Eng. Syst. 2021, 14, 251–263. [Google Scholar] [CrossRef]
- Sultan, H.M.; Diab, A.A.Z.; Kuznetsov, O.N.; Ali, Z.M.; Abdalla, O. Evaluation of the impact of high penetration levels of PV power plants on the capacity, frequency and voltage stability of Egypt’s unified grid. Energies 2019, 12, 552. [Google Scholar] [CrossRef]
- Hatziargyriou, N.; Milanovic, J.; Rahmann, C.; Ajjarapu, V.; Canizares, C.; Erlich, I.; Hill, D.; Hiskens, I.; Kamwa, I.; Pal, B.; et al. Definition and Classification of Power System Stability – Revisited & Extended. IEEE Trans. Power Syst. 2021, 36, 3271–3281. [Google Scholar] [CrossRef]
- Mokred, S.; Wang, Y.; Chen, T. A Novel Collapse Prediction Index for Voltage Stability Analysis and Contingency Ranking in Power Systems. Prot. Control Mod. Power Syst. 2023, 8, 1–27. [Google Scholar] [CrossRef]
- Moradi, R.A.; Zeinali Davarani, R. Introducing a new index to investigate voltage stability of power systems under actual operating conditions. Int. J. Electr. Power Energy Syst. 2022, 136, 107637. [Google Scholar] [CrossRef]
- Villacrés, R.; Carrión, D. Optimizing Real and Reactive Power Dispatch Using a Multi-Objective Approach Combining the ϵ-Constraint Method and Fuzzy Satisfaction. Energies 2023, 16, 8034. [Google Scholar] [CrossRef]
- Jia, X.; Dong, X.; Xu, B.; Qi, F.; Liu, Z.; Ma, Y.; Wang, Y. Static Voltage Stability Assessment Considering Impacts of Ambient Conditions on Overhead Transmission Lines. IEEE Trans. Ind. Appl. 2022, 58, 6981–6989. [Google Scholar] [CrossRef]
- Moradi-Sepahvand, M.; Amraee, T. Hybrid AC/DC Transmission Expansion Planning Considering HVAC to HVDC Conversion Under Renewable Penetration. IEEE Trans. Power Syst. 2021, 36, 579–591. [Google Scholar] [CrossRef]
- Wu, H.; Solida, L.; Huang, T.; Bompard, E. Allowing Large Penetration of Concentrated RES in Europe and North Africa via a Hybrid HVAC-HVDC Grid. Energies 2023, 16, 3138. [Google Scholar] [CrossRef]
- Javed, U.; Mughees, N.; Jawad, M.; Azeem, O.; Abbas, G.; Ullah, N.; Chowdhury, M.S.; Techato, K.; Zaidi, K.; Tahir, U. A Systematic Review of Key Challenges in Hybrid HVAC–HVDC Grids. Energies 2021, 14, 5451. [Google Scholar] [CrossRef]
- Saadeh, O.; Sba, B.A.; Dalala, Z.M. Power System Analysis of Moving from HVAC to HVDC in the Presence of Renewable Energy Resources. J. Electr. Comput. Eng. 2023, 2023, 8527308. [Google Scholar] [CrossRef]
- Hussein, I.; Essallah, S.; Khedher, A. Improvement of the Iraqi Super Grid Performance Using HVDC/HVAC Links by the Integration of Large-Scale Renewable Energy Sources. Energies 2022, 15, 1142. [Google Scholar] [CrossRef]
- Olasunkanmi, O.G.; Barron, A.R.; White, A.O.; Todeschini, G. Evaluation of a HVDC Interconnection to Improve the Voltage Stability of the Nigerian Transmission Network. J. Electron. Electr. Eng. 2024, 31, 88–106. [Google Scholar] [CrossRef]
- Mohammadi, F.; Azizi, N.; Moradi CheshmehBeigi, H.; Rouzbehi, K. Stability and control of VSC-based HVDC systems: A systematic review. e-Prime-Adv. Electr. Eng. Electron. Energy 2024, 8, 100503. [Google Scholar] [CrossRef]
- Kyomugisha, R.; Muriithi, C.M.; Edimu, M. Multiobjective optimal power flow for static voltage stability margin improvement. Heliyon 2021, 7, e08631. [Google Scholar] [CrossRef] [PubMed]
- Tarafdar Hagh, M.; Jabbary Borhany, M.A.; Taghizad-Tavana, K.; Zare Oskouei, M. A comprehensive review of flexible alternating current transmission system (FACTS): Topologies, applications, optimal placement, and innovative models. Heliyon 2025, 11, e41001. [Google Scholar] [CrossRef] [PubMed]
- Samara, N. Flexible AC Transmission Systems (FACTS); Springer Nature Switzerland AG: Paris, France, 2022. [Google Scholar] [CrossRef]
- Diab, A.; Fawzy, I.; El-Sawy, A.; El-Magd, A.A. Voltage Stability Enhancement in Electrical Transmission Networks Using STATCOM with Two Different Controllers: Case Study in Middle Egypt Electricity Zone. J. Adv. Eng. Trends 2025, 44, 315–343. [Google Scholar] [CrossRef]
- Amin, D. Enhancement of Voltage Stability by Using SVC for 30-Bus Power System. Kurd. J. Appl. Res. 2019, 4, 128–136. [Google Scholar] [CrossRef]
- Chourasia, S.; Pahariya, Y. Optimal placement of STATCOM in IEEE 14 and IEEE 30 bus systems using genetic algorithm to improve voltage stability index. Int. J. Manag. (IJM) 2019, 10, 56–63. [Google Scholar]
- Eltamaly, A.M.; Mohamed, Y.S.; El-Sayed, A.H.; Elghaffar, A.N. Adaptive static synchronous compensation techniques with the transmission system for optimum voltage control. Ain Shams Eng. J. 2020, 11, 35–44. [Google Scholar] [CrossRef]
- Dawood Salman, M.S.; Sultan, A.J.; Booneya, M.F. Voltage stability enhancement based optimal reactive power control. In Proceedings of the 2023 Second International Conference on Trends in Electrical, Electronics, and Computer Engineering (TEECCON), Bangalore, India, 23–24 August 2023; pp. 184–191. [Google Scholar] [CrossRef]
- Shokouhandeh, H.; Latif, S.; Irshad, S.; Ahmadi Kamarposhti, M.; Colak, I.; Eguchi, K. Optimal Management of Reactive Power Considering Voltage and Location of Control Devices Using Artificial Bee Algorithm. Appl. Sci. 2022, 12, 27. [Google Scholar] [CrossRef]
- Alkahdely, S.; Alsammak, A. Normal operation and reverse action of on-load tap changing transformer with its effect on voltage stability. Bull. Electr. Eng. Inform. 2023, 12, 650–658. [Google Scholar] [CrossRef]
- Lim, H.; Jo, J.; Chun, K.H. Optimal On-Load Tap Changer Tap Control Method for Voltage Compliance Rate Improvement in Distribution Systems, Based on Field Measurement Data. Energies 2025, 18, 439. [Google Scholar] [CrossRef]
- Danish, M.S.S.; Senjyu, T.; Danish, S.M.S.; Sabory, N.R.; Narayanan, K.; Mandal, P. A Recap of Voltage Stability Indices in the Past Three Decades. Energies 2019, 12, 1544. [Google Scholar] [CrossRef]
- Kiani, E.; Doagou-Mojarrad, H.; Razmi, H. Multi-objective optimal power flow considering voltage stability index and emergency demand response program. Electr. Eng. 2020, 102, 2493–2508. [Google Scholar] [CrossRef]
- ElSayed, S.K.; Elattar, E.E. Slime Mold Algorithm for Optimal Reactive Power Dispatch Combining with Renewable Energy Sources. Sustainability 2021, 13, 5831. [Google Scholar] [CrossRef]
- Babu, R.; Raj, S.; Dey, B.; Bhattacharyya, B. Optimal Reactive Power Planning Using Oppositional Grey Wolf Optimization by Considering Bus Vulnerability Analysis. Energy Convers. Econ. 2022, 3, 38–49. [Google Scholar] [CrossRef]
- Li, Y.; Fu, L.; Meng, K.; Dong, Z.Y. Assessment and Enhancement of Static Voltage Stability With Inverter-Based Generators. IEEE Trans. Power Syst. 2021, 36, 2737–2740. [Google Scholar] [CrossRef]
- Quinchimbla Lluglluna, B.G. Estabilidad de Voltaje en Sistemas de Transmisión Considerando la Operación de Transformadores con TAPS. Grado Thesis, Universidad Politécnica Salesiana, Quito, Ecuador, 2019. [Google Scholar]
- Tirira-Chulde, R.D.; Barrera-Singaña, C.A. Estabilidad de Voltaje de Largo Plazo en Sistemas Eléctricos de Potencia Usando Modelos de Carga. Iteckne 2022, 19, 15–25. [Google Scholar]
- Saadat, H. Power System Analysis, 3rd ed.; PSA Publishing: New York, NY, USA, 2010. [Google Scholar]
- Babiker, A.; Ahmad, S.S.; Ahmed, I.; Khalid, M.; Abido, M.A.; Saleh Al-Ismail, F. Optimal Power Flow: A Review of State-of-the-Art Techniques and Future Perspectives. IEEE Access 2025, 13, 60012–60039. [Google Scholar] [CrossRef]
- Charles, P.; Mehazzem, F.; Soubdhan, T. A Review on Optimal Power Flow Problems: Conventional and Metaheuristic Solutions. In Proceedings of the 2020 2nd International Conference on Smart Power & Internet Energy Systems (SPIES), Bangkok, Thailand, 15–18 September 2020; pp. 577–582. [Google Scholar] [CrossRef]
- Orbea, D.; Carrión, D.; Jaramillo, M. Minimization of Transmission Line Losses Through System Topology Reconfiguration. Energies 2025, 18, 2063. [Google Scholar] [CrossRef]
- Ali, M.A.; Kamel, S.; Hassan, M.H.; Ahmed, E.M.; Alanazi, M. Optimal Power Flow Solution of Power Systems with Renewable Energy Sources Using White Sharks Algorithm. Sustainability 2022, 14, 6049. [Google Scholar] [CrossRef]
- Wang, Y.; Wu, L.; Chen, S. A Simplified Model of the HVDC Transmission System for Sub-Synchronous Oscillations. Sustainability 2023, 15, 7444. [Google Scholar] [CrossRef]
- Han, M.; Gole, A.M. Modeling and Simulation of HVDC Transmission; The Institution of Engineering and Technology: London, UK, 2021. [Google Scholar] [CrossRef]
Disclaimer/Publisher’s Note: The statements, opinions and data contained in all publications are solely those of the individual author(s) and contributor(s) and not of MDPI and/or the editor(s). MDPI and/or the editor(s) disclaim responsibility for any injury to people or property resulting from any ideas, methods, instructions or products referred to in the content. |
© 2025 by the authors. Licensee MDPI, Basel, Switzerland. This article is an open access article distributed under the terms and conditions of the Creative Commons Attribution (CC BY) license.