Abstract
To address the fluctuation and instability of renewable power generation and the steady-state demands of chemical processes, a single-channel, non-isothermal computational fluid dynamics 3D model was developed. This model explicitly incorporates the coupling effects of electrochemical reactions, two-phase flow, and heat transfer. Subsequently, the influence of key operating parameters on proton exchange membrane water electrolyzer (PEMWE) system performance was investigated. The model accurately predicts the current–voltage polarization curve and has been validated against experimental data. Furthermore, the CFD model was employed to investigate the coupled effects of several key parameters—including operating temperature, cathode pressure, membrane thickness, porosity of the porous transport layer, and water inlet rate—on the overall electrolysis performance. Based on the numerical simulation results, the evolution of the ohmic polarization curve under temperature gradient, the block effect of bubble transport under high pressure, and the influence mechanism of the microstructure of the multi-space transport layer on gas–liquid, two-phase flow distribution are mainly discussed. Operational strategy analysis indicates that the high-efficiency mode (4.3–4.5 kWh/Nm3) is suitable for renewable energy consumption scenarios, while the economy mode (4.7 kWh/Nm3) reduces compression energy consumption by 23% through pressure–temperature synergistic optimization, achieving energy consumption alignment with green ammonia synthesis processes. This provides theoretical support for the optimization design and dynamic regulation of proton exchange membrane water electrolyzers.
1. Introduction
The rapid deployment of renewable energy sources (RESs), particularly wind and solar power, has increasingly strained grid absorption capacity, creating a major barrier to the widespread adoption of green electricity. This challenge is compounded by a geographical disconnect: abundant renewable resources are often located far from demand centers, necessitating large-scale energy storage solutions [1]. However, conventional storage methods—including electrochemical, electromagnetic, and physical systems—remain limited in scalability and applicability. Meanwhile, the inherent intermittency, unpredictability, and anti-peak-shaving nature of wind and solar power lead to highly variable generation patterns, which test the flexibility and peak-shaving capabilities of existing power grids. As a result, efficiently integrating and managing fluctuating renewable generation has become a crucial issue [2]. In response, water electrolysis powered by renewable energy has seen rapid technological advancement and capacity growth. Green hydrogen, in particular, holds substantial promise for decarbonizing the chemical industry. Progress in chemical conversion technologies for green hydrogen can therefore facilitate the large-scale uptake of renewables, aligning energy transition goals with industrial structure and demand [3].
Computational fluid dynamics (CFD), an interdisciplinary field, fundamentally employs numerical discretization techniques on high-performance computing platforms to solve mathematical models governing fluid flow behavior. CFD research aims to elucidate the fundamental mechanisms of fluid motion by analyzing distributions of key physical quantities—such as velocity, pressure, and temperature—within flow fields. Integrating fluid mechanics theory, computer technology, and numerical methods, CFD has evolved into a vital tool for addressing practical engineering problems, demonstrating considerable potential within chemical reaction engineering [4]. Theoretically, CFD demonstrates robust capabilities in solving nonlinear partial differential equations, offering novel approaches to complex theoretical fluid dynamics problems. Practically, compared to traditional experimental methods, CFD dramatically reduces research costs and duration while providing detailed visualization of flow characteristics. Its capacity to simulate realistic conditions or construct idealized models thereby serves as a viable alternative for complex problems constrained by experimental limitations [5,6].
CFD technology plays a pivotal role in optimizing PEMWE, where flow field configuration is critical for achieving efficient and safe operation [7,8]. An optimal PEMWE flow field requires a uniform gas–liquid distribution, minimal pressure drop, and efficient charge transfer. Numerous studies have employed CFD simulations to optimize PEMWE flow field geometry. For example, Olesen et al. [9] developed a CFD model to elucidate the flow and temperature distributions within a circular, high-pressure PEM water electrolyzer. In another study, Nie et al. [10] conducted three-dimensional, mixture-based multiphase CFD simulations, analyzing the anode flow field’s hydrodynamics and revealing the profiles of pressure, velocity, and oxygen concentration across different operating conditions. Ruiz et al. [11] investigated high-temperature PEMWEs employing serpentine, multi-serpentine, and parallel flow channel designs. Their results demonstrated that the multi-serpentine configuration yielded superior performance in hydrogen production and temperature uniformity. In a comparative study of five flow channel patterns, Toghyani et al. [12] identified the double-path serpentine design as the most effective for a PEM water electrolyzer, demonstrating improved pressure and temperature uniformity as well as enhanced hydrogen generation. Upadhyay et al. [8] investigated the hydrodynamic behavior within circular-anode porous transport layers (PTLs) across multiple flow field configurations.
Driven by the need to streamline hydrogen storage and transport, high-pressure operation has become a major focus in the development of water electrolysis technologies. Although hydrogen possesses a high energy density, its volumetric density at ambient pressure is low, complicating storage. High-pressure PEMWE operation enhances hydrogen production efficiency and storage density by pressurizing the cathode compartment. This approach streamlines system design, reduces energy consumption, and enables intermittent storage. Typically, PEMWEs maintain atmospheric pressure on the anode side while elevating cathode pressure for simplicity. The elevated pressure facilitates water vapor removal via condensation—reducing drying costs—and decreases gas-phase relative volume. Nevertheless, high-pressure PEMWE operation suffers from hydrogen/oxygen crossover, which not only increases explosion risk but also reduces efficiency (increasing cell voltage) and accelerates membrane degradation [13]. Airtightness requirements also make electrolytic cell design more complex. Grigoriev et al. [14] demonstrated that increased pressure intensifies both the gas crossover through the membrane and solubility in it, compromising gas purity in both the anode and cathode circuits and potentially leading to explosive mixture formation. Olesen et al. [9] performed a numerical study on a circular high-pressure PEM water electrolyzer, developing both a single-phase model to analyze the electrolyzer geometry and a multiphase model to capture the gas–liquid distribution. Their CFD simulations revealed optimized flow and temperature uniformity within the system. In subsequent work, Olesen et al. [15] enhanced the model by integrating electrochemical and heat transfer phenomena, specifically examining three circular-anode flow field configurations under a cathode pressure of 100 kPa and a current density of 5 A/cm2. Grigoriev et al. [16] established a PEM water electrolyzer model specifically designed for elevated-pressure conditions. Their results indicated reduced efficiency in the low-current-density region, leading to the recommendation that the electrolyzer be operated above 0.6 A/cm2 to achieve acceptable faradaic yields, and within 1–2 A/cm2 when considering power costs. Separately, Afshari et al. [17] constructed a mathematical model to analyze voltage losses in PEM water electrolyzers. Toghyani et al. [18] employed three-dimensional CFD modeling to evaluate electrochemical hydrogen compression (EHC) performance, coupled with exergy and economic analyses, to assess the impacts of temperature and pressure, efficiency, and hydrogen production cost. In their subsequent study [19], they investigated the thermodynamics and electrochemical kinetics of the cell, reporting that increased temperature enhanced high-current-density performance, whereas elevating the pressure from 1 to 20 bar lowered the total cell voltage by approximately 24%.
Operating PEM water electrolyzers at elevated temperatures improves overall efficiency by lowering the thermodynamic energy barrier, enhancing electrode kinetics, and enabling heat recovery integration [20]. However, elevated temperatures impose significant challenges to the corrosion resistance of PEMEC components, notably flow plates and porous transport layers (PTLs) [21]. Moreover, operating a PEM water electrolyzer at atmospheric pressure and temperatures above 373 K can lead to membrane dehydration, which reduces ionic conductivity and may even cause membrane degradation [22]. In related studies, one-dimensional models have often been employed to assess performance under elevated temperatures. Although several experimental investigations on high-temperature PEM water electrolysis exist, three-dimensional (3-D) CFD studies remain relatively limited. Ruiz et al. [21] conducted a 3-D single-domain CFD simulation of a high-temperature PEM electrolyzer, first reproducing the polarization curve from Hansen’s experimental data as part of their validation. Toghyani et al. [23,24] developed a 3-D finite volume-based model incorporating electrochemical relations. Their model was validated using experimental data from Debe et al. [25], which were obtained with electrode areas of 1 cm2 and 5 cm2, respectively.
Despite progress in fluid dynamics modeling for single-device studies, significant limitations persist, particularly within the context of coupling with fluctuating renewable energy sources and green ammonia production systems:
Critical Gap in Dynamic Equipment Modeling: PEMWEs are recognized for their rapid response and adaptability—particularly in high-pressure hydrogen production and high-temperature operation—making them well-suited to fluctuating renewable power. However, existing PEMWE research predominantly focuses on coupled electrochemical–thermodynamic analysis under static conditions [26,27], crucially lacking granular characterization of the interplay between three-dimensional flow field structures, such as porosity gradients within the proton transport layer, and dynamic parameters, such as temperature and pressure fluctuations under high-temperature, high-pressure operation.
Research Gap in Renewable Energy Adaptability: Flexible co-operation between electrolyzers and the downstream reactor is crucial for managing fluctuating renewable energy. Yet for PEMWE, existing research lacks multi-parameter models, including pressure, temperature, and current density dynamic coordination models to adapt to intermittent renewable power inputs.
Lag in Cross-Scale Simulation Technology: Despite efforts to couple CFD simulations with electrochemical models for PEMWE [22,23,28,29,30,31,32,33,34,35,36,37], systematic assessment of the integrated effects—of key parameters, such as temperature, pressure, membrane thickness, proton transport layer porosity, and feed flow rates [38,39,40,41,42]—on system performance remains inadequate. Quantifying parameter sensitivities and identifying optimal operating conditions are therefore essential for enhancing hydrogen production efficiency and cost-effectiveness.
The main innovation of this CFD model lies in its ability to tightly couple electrochemical reactions, gas–liquid two-phase flow, and heat transfer processes within a fully three-dimensional, non-isothermal framework, and to achieve a refined simulation of the dynamic interaction effects of operating temperature and pressure [8].
The subsequent part of this article is structured as follows: Section 2 will provide a detailed introduction to the established three-dimensional, non-isothermal, multiphase CFD model, including the geometric structure, governing equations, and numerical methods. Through grid independence verification and comparison with experimental data, the accuracy and reliability of the model will be ensured. Section 3 will systematically analyze the influence mechanisms of operating conditions and key components (membrane thickness, porosity of the porous transport layer) on the performance of the electrolyzer, evaluate hydrogen production efficiency, and on this basis propose two collaborative operation strategies for renewable energy absorption and green ammonia synthesis processes—efficient mode and economic mode. Finally, Section 4 will summarize the main findings of this study, summarize the influence laws and optimization intervals of parameters such as temperature, pressure, membrane thickness, and porosity, and point out the limitations of the current model and the prospects for future dynamic operation and cross-scale coupling research.
2. Simulation and Optimization of PEMWE Based on CFD Calculation
2.1. Three-Dimensional CFD Model of PEMWE
2.1.1. Geometric Mode
As depicted in Figure 1, the simulated system is a commercially developed single-cell PEM electrolyzer (Elchemtech Ltd., Seoul, Republic of Korea) featuring a 314 cm2 electrode area, Nafion 117 membrane, IrO2/Pt/C anode/cathode catalysts, and nickel foam porous transport layers.
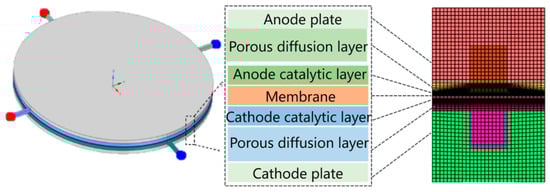
Figure 1.
Schematic diagram of the PEMWE.
Figure 2 illustrates the computational domain (single-channel configuration) of the developed 3D multiphase PEMWE model, comprising the proton exchange membrane (MEM), catalyst layers (CLs), porous transport layers (PTLs), flow channels (CHs), and bipolar plates (BPs). Liquid water enters through the anode inlet, with oxygen generated at the anode exiting alongside water through the anode outlet under applied current. The cathode employs a dead-end configuration, where generated hydrogen exits through the cathode outlet. The geometric dimensions and physical parameters are summarized in Table 1.
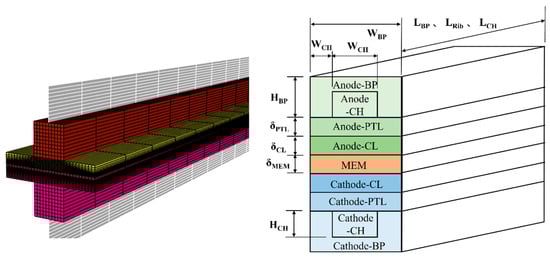
Figure 2.
The geometric model and computational domain of PEME.

Table 1.
The geometric dimensions of PEMEC.
The 3D multiphase PEMWE model incorporates the following essential assumptions for investigating internal heat/mass transfer and electrochemical reactions:
- (1)
- Steady-state operation with time-invariant variables;
- (2)
- Laminar flow regime dominated by viscous forces;
- (3)
- Negligible water evaporation in the anode due to liquid saturation;
- (4)
- Ideal gas behavior governed by the ideal gas law;
- (5)
- Homogenized porous transport layers (PTLs) characterized by macroscopic properties, such as porosity and permeability;
- (6)
- Fully hydrated membrane maintaining optimal proton conductivity;
- (7)
- Exclusive proton permeability through the membrane, preventing gas crossover and electrical shorting.
2.1.2. Numerical Mode
The cell voltage for hydrogen production by PEM water electrolysis is the actual voltage applied across the electrolyzer during the electrolysis process to drive the chemical reaction, and it consists of four components, which can be expressed as follows:
In the formula, is the open-circuit voltage; is the activation overpotential; is the ohmic overpotential; and is the diffusion overpotential.
Considering that changes in temperature and pressure have a certain impact on the voltage, the Nernst equation is used to calculate the open-circuit voltage [43].
In the formula, is the gas constant, 8.314 J/(mol·K); F is the Faraday constant; is the operating temperature of the electrolyzer, K; represents the equilibrium pressure of each component, where is , , , Pa; and is the molar number of electron transfer.
The Butler–Volmer equation [43].
In the formula, is the active specific surface area, 1/m; , are the exchange current densities of the anode and cathode, A/cm2; , are the charge transfer coefficients of the anode and cathode; , are the concentrations of oxygen and hydrogen, mol/m3; and , are the reference concentrations of oxygen and hydrogen, mol/m3.
As electrons travel through the flow field plate, catalyst layer, and diffusion layer while protons conduct through the membrane, the associated electrical and ionic resistances lead to ohmic losses. The transport equations for electrons and protons are as follows [43]:
In the formula,, are the current densities of the solid phase and the membrane; , are the effective electrical conductivities of the solid phase and the membrane, S/m; is the electrolyte potential; is the electron potential; , are source terms, representing the gain and loss rates of electrons and protons in the electrochemical reaction.
The conductivity of the proton exchange membrane is calculated using an empirical formula [43]:
The total ohmic overpotential is
The diffusion overpotential is
The mass transfer law of the gas–liquid, two-phase mixture in the electrolyzer is described by the mass conservation and momentum conservation equations:
In the formula, is the porosity of the porous medium; is the average density of the mixture; is the average volume velocity of the mixture; is the viscosity of the mixture; is the partial pressure; is the mass source term; and is the momentum loss.
In the electrolyzer, liquid water enters the diffusion layer and catalyst layer through the electrolyzer flow channel, and the generated gas is discharged outward through the catalyst layer and diffusion layer. Therefore, the convective diffusion phenomenon of gas–liquid, two-phase flow in the flow channel is usually described by the Maxwell–Stefan equation [43]:
In the formula: is the concentration of substance k, mol/m3; is the effective diffusion coefficient of substance k; is the flow velocity of substance k.
Both the catalyst layer and the diffusion layer inside the electrolyzer belong to porous medium regions, and the flow velocity of each component inside them is approximately calculated using Darcy’s law [21]:
In the formula, , are the flow velocities of the gas phase and liquid phase; is the permeability of the porous medium; , are the viscosities of the gas phase and liquid phase, Pa·s; and , are the relative permeabilities of the gas phase and liquid phase, calculated using the liquid saturation .
The thermal balance of the PEM electrolyzer is governed by multiple heat sources and sinks. Heat input primarily originates from the enthalpy of the incoming reactants and the irreversible heat generated by electrochemical reactions [23]. Conversely, heat is dissipated from the system through several pathways: convective and radiative heat transfer to the surroundings, as well as sensible heat carried away by the product gases and the unreacted water stream. Its heat balance can be described by the energy equation:
In the formula, is the effective density, kg/m3; is the effective specific heat capacity, J/(kg·K); is the effective thermal conductivity, W/(m·K); and is the heat source term, including the irreversible activation heat, entropy heat generated by electrochemical reaction, ohmic heat, and concentration difference heat.
In the formula, , are the densities of the solid phase and fluid, kg/m3; , are the specific heat capacities of the solid phase and fluid, J/(kg·K); and , are the effective thermal conductivities of the solid phase and fluid, W/(m·K).
By assuming symmetric charge transfer coefficients, the Butler–Volmer equation is simplified and employed to model the activation overpotential.
where are the charge transfer coefficients, and are the roughness factors for the ACL and CCL, respectively, and and are the exchange current densities for the OER and HER, respectively. The roughness factors—representing the actual-to-geometric surface area ratio of the catalyst layers—were determined by fitting the experimental PEMEC performance data. While kinetic modeling could employ the full Butler–Volmer equation, Equations (23) and (24) offer the advantage of being analytically solvable for overpotential. Finally, the exchange current densities, representing intrinsic reaction kinetics, were taken from the literature.
where and are defined by the equilibrium state of the system, usually corresponding to the measurement conditions of the exchange current density. The local species concentrations, and are from the solution of Equation (5).
The ohmic overpotential is caused by the total cell resistance, which sums the individual electronic and ionic resistances in series from the current collectors through all cell components. This overpotential was computed using Ohm’s law based on the total resistance and the operating current density.
Following Marangio et al. [43], the total electronic resistance through the cell components was calculated using an equivalent circuit that sums the individual resistances from the catalyst layer, PTL, and flow plate, given by the following equation:
The ionic resistance accounts for the proton conduction loss across the membrane and is modeled by the following expression involving membrane conductivity [14]:
A stable thermal-flow field was first established by initializing the computational domain without the electrochemical model. Once achieved, the electrochemical equations were solved through a custom UDF that computed the residual of Equation (21) based on the formulation in Equation (33).
The current density distribution was resolved numerically using Newton’s method, with the applied voltage V serving as the input under each operational point. The governing equations were tightly integrated with an electrochemical UDF, which was executed per iteration for every element in the electrodes. Thereby, the current density-dependent source terms were updated simultaneously throughout the solution process. This iterative coupling captures the progressive development of the spatial current profile along the flow channel.
The three-dimensional PEMEC conservation equations were solved using the Fluent solver. Pressure–velocity coupling employed the SIMPLE algorithm with first-order upwind discretization for all transport equations, while second-order upwind discretization enhanced solution accuracy. Convergence was accelerated using the BCGSTAB method with algebraic multigrid (AMG) cycling for all equations. Solution accuracy was ensured by requiring the average current density to stabilize within 200 iterations and scaled residuals to reach 10−8.
2.2. Model Validation
2.2.1. Grid Independence Verification
The single-cell PEMWE model was developed in ANSYS Fluent (2024 R2) with physical dimensions matching the active area of an industrial unit. The component thicknesses (bipolar plates/PTLs/catalyst layers/membrane) correspond to actual specifications, forming a 314 cm2 active area geometry. The discretized domain in Figure 3 comprises bipolar plates (BPs), porous transport layers (PTLs), catalyst layers (CLs), proton exchange membrane (MEM), and flow channels (CH). The geometric and physical parameters are provided in Table 1.
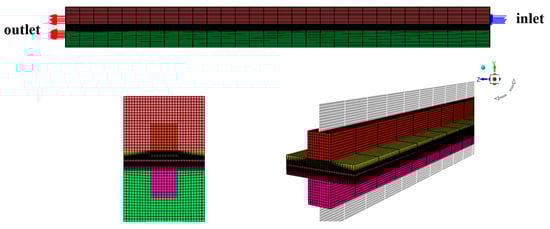
Figure 3.
Meshing for the PEMEC model.
The PEMEC physical model was discretized using a structured grid comprising 75,600 cells, 232,740 faces, and 81,685 nodes. A grid quality assessment confirmed compliance with solution accuracy requirements. A grid independence study rigorously increased the total cell count from 50,000 to 210,000. As Table 2 indicates, the operating voltage at identical current density—selected as the criterion—showed negligible variation (<1%) beyond 75,600 cells. Grid 2 (75,600 cells) was thus determined to be optimal, with further refinement yielding convergent solutions.
Table 2.
Result of grid independence verification.
2.2.2. Verification of CFD Model with Experimental Data
The CFD-derived polarization curve was validated against experimental data obtained at 328.15 K and 101 kPa [18]. Figure 4 compares model predictions with experimental current–voltage curves across 0.25–1.5 A/cm2. The close agreement between simulations and measurements validates the model’s predictive capability for flow field variations in the unitized PEMWE.
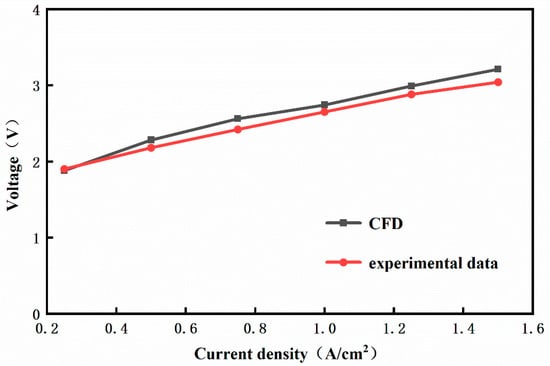
Figure 4.
Comparison of polarization curves between simulation results and experimental data.
3. Results and Discussion
3.1. Influence of Operating Conditions
Figure 5 presents polarization curves of the PEMWE at various operating temperatures under constant atmospheric pressure (101 kPa). As the temperature increased from 323 K to 373 K, higher current densities required progressively elevated cell voltages due to intensified reaction kinetics. Crucially, elevated temperatures significantly reduced the voltage required for identical current densities, attributed to decreased proton transfer activation energy and enhanced ion mobility. This yielded lower ohmic losses and improved electrochemical activity.
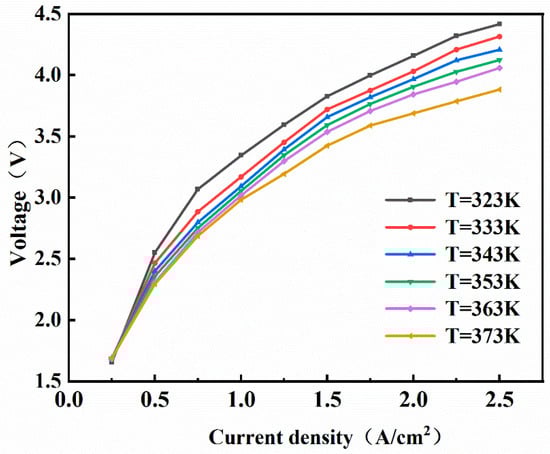
Figure 5.
Comparison of PEMEC performance at different temperatures.
In low-current-density regions (0–0.5 A/cm2), the temperature minimally influenced cell voltage, where activation polarization dominated. Conversely, above 1.5 A/cm2, temperature effects became pronounced as ohmic polarization prevailed—voltage differentials increased from 0.3 V at 0.5 A/cm2 to 0.95 V at 2.5 A/cm2, corresponding to 12% and 20% voltage reductions at 373 K versus 323 K. This highlights the superior high-current performance at elevated temperatures through membrane–electrode synergy.
Notably, sustained operation >363 K risks material degradation: Nafion membrane dehydration (reduced mechanical strength and proton conductivity, microcrack formation), noble metal catalyst agglomeration (active surface loss), and polymer seal thermal failure. Consequently, the optimal operating temperature ranges between 353 and 363 K, balancing performance gains against material stability constraints.
Figure 6 illustrates the gas-phase mass fraction distribution in the catalyst–membrane region, revealing temperature’s significant regulatory effect (323–373 K) on gas–liquid transport and electrochemical processes under constant power input. While the reaction characteristics remain similar across temperatures, distinct patterns emerge: water enters the anode flow channel, diffusion, catalyst layers, generating oxygen (anode) and hydrogen (cathode). The gas-phase (Phase-1) mass fraction accumulates axially along the flow path and increases radially, exhibiting higher centerline concentrations near the membrane–electrode interface—indicating reaction confinement to the central catalyst zone.
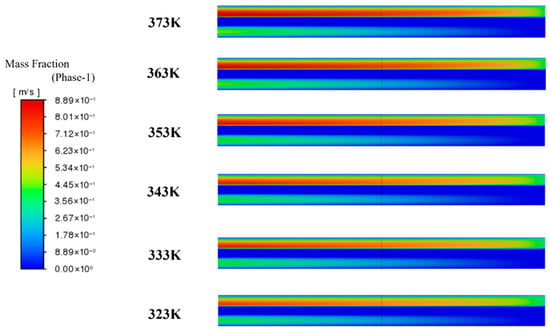
Figure 6.
Concentration distribution map of the electrolytic cell at different temperatures.
The quality fraction reaches its peak at 373 K (40% higher than at 323 K), which is mainly attributed to two aspects: firstly, the increase in temperature significantly enhances the electrochemical reaction kinetics and proton conductivity, promoting the electrochemical generation of gas; secondly, high temperature reduces the solubility of gas in the liquid phase and increases its diffusion coefficient, thereby significantly improving the desorption–transport efficiency of gas leaving the catalyst surface and entering the flow channel. This temperature sensitivity stems from enhanced proton conductivity: elevated temperatures intensify water molecule activity within the membrane, boosting electrochemical reaction rates and ionic conductivity. The reduced internal resistance consequently improves electrolyzer efficiency and hydrogen production.
Future work should integrate multi-physics simulations with long-term durability testing to quantify the temperature–lifetime–cost trilemma, establishing theoretical frameworks for industrial-scale electrolyzer design.
Given downstream hydrogen storage requirements in green hydrogen production, pressurized PEMWE operation is widely regarded as a beneficial strategy. This study examines cathode pressure effects (100–3000 kPa) on performance. Figure 7 shows polarization curves at 100, 1000, 2000, and 3000 kPa. Elevated pressures increase the voltage required for identical current densities—indicating greater energy input for electrolysis—aligning with Toghyani et al. [19] where performance declines with pressure. At a low current density of 0.25 A/cm2, when the operating pressure increased from 100 kPa to 1000 kPa, the working voltage increased by 2.9%; when it increased from 100 kPa to 2000 kPa, the working voltage increased by 6.8%; and when it increased from 100 kPa to 3000 kPa, the working voltage increased by 10.6%. While at a high current density of 2.5 A/cm2, when the operating pressure increased from 100 kPa to 1000 kPa, the working voltage increased by 3.2%; when it increased from 100 kPa to 2000 kPa, the working voltage increased by 7.2%; and when it increased from 100 kPa to 3000 kPa, the working voltage increased by 12.9%. This pressure-induced performance degradation intensifies at high current densities. Operational pressures of 1000–2000 kPa are recommended, balancing power requirements against sealing constraints while enabling direct hydrogen storage (≥30 bar) without secondary compression.
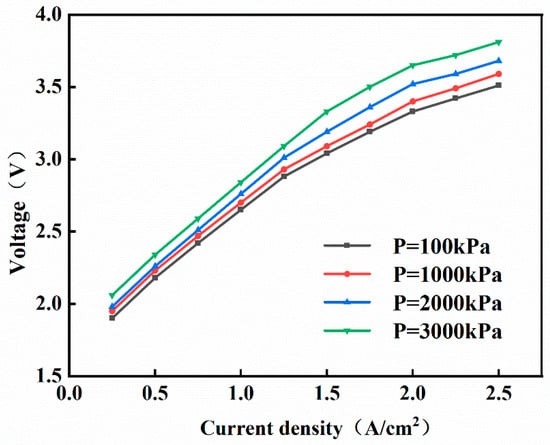
Figure 7.
Comparison of PEMEC performance under different cathode pressures (T—328.15 K).
3.2. Influence of Equipment Component
Figure 8 illustrates the impact of proton exchange membrane thickness on PEMWE performance. Membrane thickness exhibited negligible voltage effects at low current densities (0.25–1.25 A/cm2). In contrast, pronounced voltage increases occurred at higher current densities: 0.1 V at 0.25 A/cm2 and 0.4 V at 2.5 A/cm2, when the thickness increased from 50 to 360 μm. Thicker membranes elevate ion transport resistance, reducing current density and efficiency. Conversely, excessively thin membranes compromise mechanical integrity and operational stability. Increased thickness also augments ohmic overpotential due to elongated ion transfer paths. Optimal membrane thickness must therefore balance ion transport resistance against mechanical integrity to maximize efficiency, stability, and cost-effectiveness.
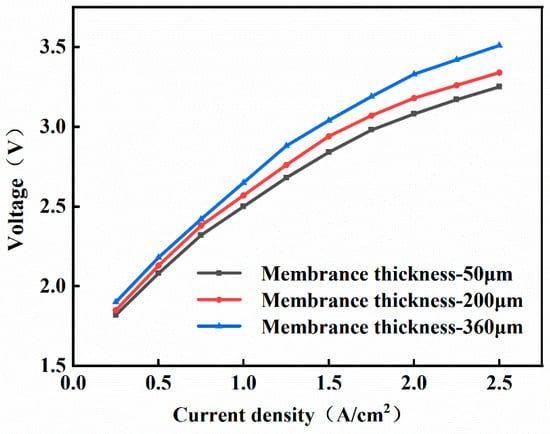
Figure 8.
Comparison of PEMEC performance under different membrane thicknesses (T-328.15 K, P-101 kPa).
The porosity of the porous transport layer (PTL) critically governs liquid/gas transport efficiency. While conventional PEMWEs employ uniformly distributed high-porosity metal foams, spatially graded PTLs have emerged to enhance performance. This study investigates porosity effects (0.3–0.8) as a key sensitivity parameter. Figure 9 shows polarization curves at ε = 0.3, 0.5, and 0.8. At lower current densities, the influence of PTL porosity on voltage is not significant. When the current density increases from 0.25 A/cm2 to 1.25 A/cm2, the increase in working voltage is not obvious. Compared to the low-current-density region, at higher current densities, the influence of PTL porosity on the working voltage becomes more significant. When the current density is 1.25 A/cm2, increasing the PTL porosity from 0.3 to 0.8 results in a 8.5% increase in working voltage. When the current density is 2.5 A/cm2, the working voltage increases by approximately 0.4 V, which indicates performance degradation with rising porosity. Higher porosity increases ionic resistance through extended conduction paths, yet facilitates reactant diffusion. Structural instability risks also arise at extreme porosity. Optimal porosity must therefore balance ionic resistance against mass transport efficiency and mechanical stability. In practical engineering applications, the determination of the optimal operating point requires a trade-off between instantaneous efficiency and long-term durability. Future work should combine the performance optimization framework of this paper with the physical membrane degradation model to conduct a full life cycle cost analysis.
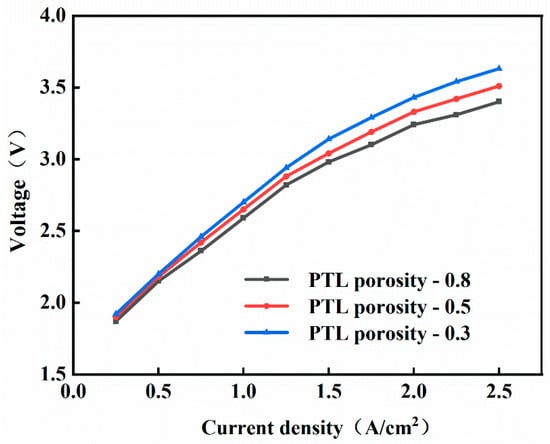
Figure 9.
Comparison of PEMEC performance under different porosity of porous layers (T-328.15 K, P-101 kPa).
3.3. Hydrogen Production Analysis and Efficiency Evaluation
As shown in Table 3,under high-temperature operating conditions, as the temperature is progressively increased from 353 K to 363 K, a notable phenomenon is the decreasing trend observed in the PEMEC operating voltage. Although no significant change was observed in hydrogen production output—with both temperature conditions maintaining a stable hydrogen production rate—the system efficiency significantly increased from 82.3% to 84.7%. This leap in efficiency is primarily attributed to the weakening of the ohmic polarization effect under high temperatures, which facilitates smoother current transmission through the electrolyte and consequently reduces energy loss.
Table 3.
Hydrogen production and energy efficiency of PEMEC under different production scenarios.
Switching to low-temperature operating conditions, taking 323 K as an example, although the hydrogen production rate remained high at 252.0 g/h, the current density reached as high as 2.5 A/cm2, while the energy efficiency dropped substantially to 62.1%. This phenomenon occurs because, in low-temperature environments, the concentration polarization effect intensifies significantly. This leads to an increased concentration gradient of reactants near the electrode surface, which in turn adversely affects the reaction rate and energy conversion efficiency. Concentration polarization acts as a major bottleneck in low-temperature operation, severely constraining the energy efficiency performance of the PEMEC.
In high-pressure operation scenarios, using 3000 kPa as an example, although the hydrogen production rate is relatively low at only 151.2 g/h, the hydrogen gas produced under these conditions holds potential for direct use in downstream processes such as ammonia synthesis. High-pressure operation not only benefits hydrogen storage and transportation but can also significantly reduce the integrated energy consumption of the entire green ammonia production system, thereby enhancing overall energy utilization efficiency.
Furthermore, the thickness of the proton exchange membrane also significantly impacts the hydrogen production and efficiency of the PEMEC. Experimental results indicate that using a thinner proton exchange membrane can effectively enhance both the hydrogen production rate and energy efficiency. This benefit mainly stems from the reduced ionic transport resistance offered by the thinner membrane structure, which promotes the rapid diffusion of reactants and products, thereby improving the overall performance of the electrolyzer.
During the optimization of operating parameters, under conditions of low porosity, especially during high-current-density operation, the concentration polarization phenomenon is effectively mitigated, allowing energy efficiency to be maintained at a high level. However, it is noteworthy that in the low-current-density region, limitations in mass transfer may lead to insufficient local reactant concentration, which can subsequently affect the hydrogen production rate and energy efficiency.
3.4. Operational Strategy Optimization
The operating temperature and pressure of a Proton Exchange Membrane Electrolyzer Cell (PEMEC) significantly impact hydrogen production efficiency, system energy consumption, and compatibility with downstream processes. Based on the simulation results from Figure 3, Figure 4 and Figure 5 and Figure 3, Figure 4, Figure 5, Figure 6 and Figure 7, the following two synergistic operational control strategies are proposed:
- (1)
- High-Efficiency Mode (Yellow): The temperature control range is 353–363 K, and the pressure control range is 1000–1500 kPa. The advantage of a high temperature lies in the exponential increase in membrane proton conductivity with temperature. When T = 363 K, the conductivity is 2.3 times higher than that at 323 K. The activation overpotential decreases with increasing temperature, and the Arrhenius equation indicates that for every 10 K temperature increase, the exchange current density increases by approximately 30%. According to Henry’s law, low pressure reduces gas solubility, minimizing bubble blockage at the flow channel and porous transport layer interface. The concentration polarization voltage decreases by 0.15–0.2 V. Furthermore, regarding integration with the overall green ammonia production system, a hydrogen output pressure of 1000 kPa allows for direct connection to medium-pressure storage tanks (10–15 bar), eliminating one compression stage and reducing compression energy consumption.
- (2)
- Economy Mode (Purple): The temperature control range is 333–343 K, and the pressure control range is 2000–3000 kPa. Reducing the temperature to 333–343 K slows the dehydration rate of the Nafion membrane, thereby extending its service life. High-pressure hydrogen can be fed directly into multi-stage compressors to raise the pressure to the levels required for green ammonia synthesis (15–25 MPa), reducing the number of compression stages and consequently lowering energy consumption, resulting in higher techno-economic feasibility.
Figure 3, Figure 4, Figure 5, Figure 6, Figure 7, Figure 8, Figure 9 and Figure 10 show the energy consumption comparison for the synergistic temperature–pressure control under these two strategies. It can be observed from the figure that when the economy mode operates at 2000 kPa and 343 K, the PEMEC operating voltage is 2.02 V, with a hydrogen production energy consumption of 4.7 kWh/Nm3, which is 9.3% higher than that of the high-efficiency mode. Under the high-efficiency control strategy, the PEMEC operates in a low-energy-consumption range (4.3–4.5 kWh/Nm3), making it suitable for operation during periods of abundant renewable energy. Under the economy control strategy, the PEMEC energy consumption is slightly higher (4.7–5.0 kWh/Nm3), but the compression costs are lower, making it suitable for direct coupling with green ammonia synthesis processes.
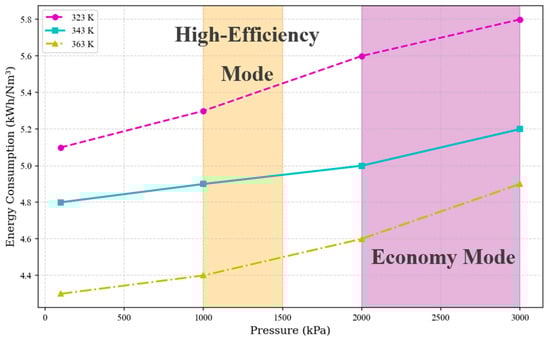
Figure 10.
Comparison of energy consumption of temperature–pressure coupling in PEMEC in high-efficiency mode and economy mode.
4. Conclusions
High-pressure hydrogen production and high-temperature operation represent key research frontiers in PEMWE technology. This study employs 3D CFD simulations to investigate PEMWE performance under harsh operational conditions. Using this verified framework, we systematically evaluated the impact of operational parameters and component design on electrolyzer efficiency, yielding the following conclusions:
- (1)
- A comprehensive assessment quantified the influence of temperature, pressure, membrane thickness, and PTL porosity on system performance. The optimal operating conditions were established to enhance hydrogen production efficiency and cost-effectiveness.
- (2)
- While performance improves with temperature, membrane stability constraints limit the optimal range to 353–363 K. Elevated cathode pressures increase voltage requirements; 1000–2000 kPa balances power demands with sealing integrity while enabling direct hydrogen storage.
- (3)
- When the current density is 2.5 A/cm2, increasing the thickness of the proton exchange membrane leads to an increase in the working voltage by approximately 0.4 V. The increase in the thickness of the proton exchange membrane reduces the performance of PEMEC; compared to the low-current-density region, at higher current densities, the porosity of PTL has a more significant impact on the working voltage. At a current density of 2.5 A/cm2, the working voltage increases by approximately 11.7 V, and the increase in the porosity of PTL reduces the performance of PEMEC; moreover, an insufficient water inlet rate significantly increases system energy consumption.
- (4)
- Through quantitative sensitivity analysis, it can be found that temperature is the most sensitive parameter, but due to the risk of membrane dehydration, Nafion proton exchange membranes are prone to brittleness when the temperature is greater than 363 K; there is great potential for optimizing the thickness of the PEM, but it is necessary to balance mechanical strength. In practical engineering applications, a composite reinforced membrane can be considered. The pressure sensitivity is relatively low, but operating at high pressure can reduce subsequent compression energy consumption.
- (5)
- Operational strategy analysis indicates that the high-efficiency mode (4.3–4.5 kWh/Nm3) is suitable for renewable energy consumption scenarios, while the economy mode (4.7 kWh/Nm3) reduces compression energy consumption by 23% through pressure–temperature synergistic optimization, achieving energy consumption alignment with green ammonia synthesis processes.
The original intention of this research was to provide certain theoretical guidance for industrial production through CFD analysis. By simulating the controllable processes and predicting the performance, hydrogen production volume, and ammonia production volume of the reactor, it can provide reliable operation plans for different load levels. This requires analyzing the fluid flow state inside the reactor after the load changes. Therefore, the stable production state after the completion of the load change operation was selected as the research object. How to handle the fluctuations of unstable conditions during the transitional period is also an urgent problem for the green ammonia synthesis process to solve. Therefore, in future research, on the one hand, the CFD method should continue to be used to deeply study how the flow field of key equipment is dynamically adjusted to achieve stability during load switching. On the other hand, simulation methods such as CFD should be utilized to conduct dynamic research on load changes and fluid behavior changes, and to identify the fundamental reasons behind the changes in control schemes as theoretical support.
Author Contributions
Conceptualization, G.H. and X.Z.; methodology, D.Y., G.L. and X.Z.; software, G.L.; validation, F.R. and J.Z.; formal analysis, X.J. and J.L.; data curation, X.J.; writing—original draft preparation, X.Z.; writing—review and editing, G.H.; visualization, D.Y.; project administration, X.J.; funding acquisition, X.J. All authors have read and agreed to the published version of the manuscript.
Funding
This research was funded by the National Key Research and Development Program of China, grant number 2021YFB40005, and the APC was funded by G.H. and X.J.
Data Availability Statement
The data presented in this study are available on request from the corresponding author.
Conflicts of Interest
Authors Dexue Yang, Jianpeng Li, Fengwei Rong and Jiang Zhu were employed by the company CNNP Rich Energy Corporation Limited. The remaining authors declare that the research was conducted in the absence of any commercial or financial relationships that could be construed as a potential conflict of interest.
References
- Xu, R.; Zhang, S.; Rong, F.; Fan, W.; Zhang, X.; Wang, Y.; Zan, L.; Ji, X.; He, G. Physics-Informed Neural Network Enhanced CFD Simulation of Two-Dimensional Green Ammonia Synthesis Reactor. Processes 2025, 13, 2457. [Google Scholar] [CrossRef]
- Jiang, L.; Hu, C.; Ji, S.; Zhao, H.; Chen, J.; He, G. Generating comprehensive lithium battery charging data with generative AI. Appl. Energy 2025, 377, 124604. [Google Scholar] [CrossRef]
- He, G.; Dang, Y.; Zhou, L.; Dai, Y.; Que, Y.; Xu, J. Architecture model proposal of innovative intelligent manufacturing in the chemical industry based on multi-scale integration and key technologies. Comput. Chem. Eng. 2020, 141, 106967. [Google Scholar] [CrossRef]
- Jiang, Y.; Khadilkar, M.R.; Al-Dahhan, M.H.; Dudukovic, M.P. CFD of multiphase flow in packed-bed reactors: II. Results and applications. AIChE J. 2004, 48, 716–730. [Google Scholar] [CrossRef]
- Barth, T.J.; Griebel, M.; Keyes, D.E.; Nieminen, R.M.; Roose, D.; Schlick, T. (Eds.) Uncertainty Quantification in Computational Fluid Dynamics; Springer: Berlin/Heidelberg, Germany, 2013; Volume 14, pp. 274–282. [Google Scholar]
- Chai, S.; Ren, Z.; Ji, S.; Zheng, X.; Zhou, L.; Zhang, L.; Ji, X. Exploring the Influence of Solvation on Multidimensional Particle Size Distribution Based on the Spiral Growth Model and the Lattice Boltzmann Method. Ind. Eng. Chem. Res. 2024, 63, 20633–20650. [Google Scholar] [CrossRef]
- Saba, S.M.; Müller, M.; Robinius, M.; Stolten, D. The investment costs of electrolysis—A comparison of cost studies from the past 30 years. Int. J. Hydrogen Energy 2018, 43, 1209–1223. [Google Scholar] [CrossRef]
- Upadhyay, M.; Lee, S.; Jung, S.; Choi, Y.; Moon, S.; Lim, H. Systematic assessment of the anode flow field hydrodynamics in a new circular PEM water electrolyser. Int. J. Hydrogen Energy 2020, 45, 20765–20775. [Google Scholar] [CrossRef]
- Olesen, A.C.; Rømer, C.; Kær, S.K. A numerical study of the gas-liquid, two-phase flow maldistribution in the anode of a high pressure PEM water electrolysis cell. Int. J. Hydrogen Energy 2016, 41, 52–68. [Google Scholar] [CrossRef]
- Nie, J.; Chen, Y. Numerical modeling of three-dimensional two-phase gas–liquid flow in the flow field plate of a PEM electrolysis cell. Int. J. Hydrogen Energy 2010, 35, 3183–3197. [Google Scholar] [CrossRef]
- Ruiz, D.D.H.; Sasmito, A.P.; Shamim, T. Numerical Investigation of the High Temperature PEM Electrolyzer: Effect of Flow Channel Configurations. ECS Trans. 2013, 58, 99–112. [Google Scholar] [CrossRef]
- Toghyani, S.; Afshari, E.; Baniasadi, E.; Atyabi, S.A. Thermal and electrochemical analysis of different flow field patterns in a PEM electrolyzer. Electrochim. Acta 2018, 267, 234–245. [Google Scholar] [CrossRef]
- Inaba, M.; Kinumoto, T.; Kiriake, M.; Umebayashi, R.; Tasaka, A.; Ogumi, Z. Gas crossover and membrane degradation in polymer electrolyte fuel cells. Electrochim. Acta 2006, 51, 5746–5753. [Google Scholar] [CrossRef]
- Grigoriev, S.A.; Millet, P.; Korobtsev, S.V.; Porembskiy, V.I.; Pepic, M.; Etievant, C.; Puyenchet, C.; Fateev, V.N. Hydrogen safety aspects related to high-pressure polymer electrolyte membrane water electrolysis. Int. J. Hydrogen Energy 2009, 34, 5986–5991. [Google Scholar] [CrossRef]
- Olesen, A.C.; Frensch, S.H.; Kær, S.K. Towards uniformly distributed heat, mass and charge: A flow field design study for high pressure and high current density operation of PEM electrolysis cells. Electrochim. Acta 2019, 293, 476–495. [Google Scholar] [CrossRef]
- Grigoriev, S.A.; Kalinnikov, A.A.; Millet, P.; Porembsky, V.I.; Fateev, V.N. Mathematical modeling of high-pressure PEM water electrolysis. J. Appl. Electrochem. 2009, 40, 921–932. [Google Scholar] [CrossRef]
- Afshari, E.; Khodabakhsh, S.; Jahantigh, N.; Toghyani, S. Performance assessment of gas crossover phenomenon and water transport mechanism in high pressure PEM electrolyzer. Int. J. Hydrogen Energy 2021, 46, 11029–11040. [Google Scholar] [CrossRef]
- Toghyani, S.; Baniasadi, E.; Afshari, E.; Javani, N. Performance analysis and exergoeconomic assessment of a proton exchange membrane compressor for electrochemical hydrogen storage. Int. J. Hydrogen Energy 2020, 45, 34993–35005. [Google Scholar] [CrossRef]
- Toghyani, S.; Afshari, E.; Baniasadi, E. Parametric study of a proton exchange membrane compressor for electrochemical hydrogen storage using numerical assessment. J. Energy Storage 2020, 30, 101469. [Google Scholar] [CrossRef]
- Nikiforov, A.V.; Tomás García, A.L.; Petrushina, I.M.; Christensen, E.; Bjerrum, N.J. Preparation and study of IrO2/SiC–Si supported anode catalyst for high temperature PEM steam electrolysers. Int. J. Hydrogen Energy 2011, 36, 5797–5805. [Google Scholar] [CrossRef]
- Hansen, M.K.; Aili, D.; Christensen, E.; Pan, C.; Eriksen, S.; Jensen, J.O.; von Barner, J.H.; Li, Q.; Bjerrum, N.J. PEM steam electrolysis at 130 °C using a phosphoric acid doped short side chain PFSA membrane. Int. J. Hydrogen Energy 2012, 37, 10992–11000. [Google Scholar] [CrossRef]
- Chandesris, M.; Médeau, V.; Guillet, N.; Chelghoum, S.; Thoby, D.; Fouda-Onana, F. Membrane degradation in PEM water electrolyzer: Numerical modeling and experimental evidence of the influence of temperature and current density. Int. J. Hydrogen Energy 2015, 40, 1353–1366. [Google Scholar] [CrossRef]
- Toghyani, S.; Afshari, E.; Baniasadi, E.; Atyabi, S.A.; Naterer, G.F. Thermal and electrochemical performance assessment of a high temperature PEM electrolyzer. Energy 2018, 152, 237–246. [Google Scholar] [CrossRef]
- Toghyani, S.; Baniasadi, E.; Afshari, E. Numerical simulation and exergoeconomic analysis of a high temperature polymer exchange membrane electrolyzer. Int. J. Hydrogen Energy 2019, 44, 31731–31744. [Google Scholar] [CrossRef]
- Debe, M.K.; Hendricks, S.M.; Vernstrom, G.D.; Meyers, M.; Brostrom, M.; Stephens, M.; Chan, Q.; Willey, J.; Hamden, M.; Mittelsteadt, C.K.; et al. Initial Performance and Durability of Ultra-Low Loaded NSTF Electrodes for PEM Electrolyzers. J. Electrochem. Soc. 2012, 159, K165–K176. [Google Scholar] [CrossRef]
- Harrison, K.W.; Hernández-Pacheco, E.; Mann, M.; Salehfar, H. Semiempirical Model for Determining PEM Electrolyzer Stack Characteristics. J. Fuel Cell Sci. Technol. 2006, 3, 220–223. [Google Scholar] [CrossRef]
- Weber, A.Z.; Newman, J. Modeling Transport in Polymer-Electrolyte Fuel Cells. Chem. Rev. 2004, 104, 4679–4726. [Google Scholar] [CrossRef] [PubMed]
- Ito, H.; Maeda, T.; Nakano, A.; Kato, A.; Yoshida, T. Influence of pore structural properties of current collectors on the performance of proton exchange membrane electrolyzer. Electrochim. Acta 2013, 100, 242–248. [Google Scholar] [CrossRef]
- Espinosa-López, M.; Darras, C.; Poggi, P.; Glises, R.; Baucour, P.; Rakotondrainibe, A.; Besse, S.; Serre-Combe, P. Modelling and experimental validation of a 46 kW PEM high pressure water electrolyzer. Renew. Energy 2018, 119, 160–173. [Google Scholar] [CrossRef]
- Barbir, F. PEM electrolysis for production of hydrogen from renewable energy sources. Sol. Energy 2005, 78, 661–669. [Google Scholar] [CrossRef]
- Kang, Z.; Mo, J.; Yang, G.; Li, Y.; Talley, D.A.; Han, B.; Zhang, F.-Y. Performance Modeling and Current Mapping of Proton Exchange Membrane Electrolyzer Cells with Novel Thin/Tunable Liquid/Gas Diffusion Layers. Electrochim. Acta 2017, 255, 405–416. [Google Scholar] [CrossRef]
- Bromberger, K.; Ghinaiya, J.; Lickert, T.; Fallisch, A.; Smolinka, T. Hydraulic ex situ through-plane characterization of porous transport layers in PEM water electrolysis cells. Int. J. Hydrogen Energy 2018, 43, 2556–2569. [Google Scholar] [CrossRef]
- van der Merwe, J.; Uren, K.; van Schoor, G.; Bessarabov, D. Characterisation tools development for PEM electrolysers. Int. J. Hydrogen Energy 2014, 39, 14212–14221. [Google Scholar] [CrossRef]
- Rakousky, C.; Reimer, U.; Wippermann, K.; Carmo, M.; Lueke, W.; Stolten, D. An analysis of degradation phenomena in polymer electrolyte membrane water electrolysis. J. Power Sources 2016, 326, 120–128. [Google Scholar] [CrossRef]
- Mohamed, B.; Alli, B.; Ahmed, B. Using the hydrogen for sustainable energy storage: Designs, modeling, identification and simulation membrane behavior in PEM system electrolyser. J. Energy Storage 2016, 7, 270–285. [Google Scholar] [CrossRef]
- Sartory, M.; Wallnöfer-Ogris, E.; Salman, P.; Fellinger, T.; Justl, M.; Trattner, A.; Klell, M. Theoretical and experimental analysis of an asymmetric high pressure PEM water electrolyser up to 155 bar. Int. J. Hydrogen Energy 2017, 42, 30493–30508. [Google Scholar] [CrossRef]
- Arbabi, F.; Kalantarian, A.; Abouatallah, R.; Wang, R.; Wallace, J.S.; Bazylak, A. Feasibility study of using microfluidic platforms for visualizing bubble flows in electrolyzer gas diffusion layers. J. Power Sources 2014, 258, 142–149. [Google Scholar] [CrossRef]
- Carmo, M.; Fritz, D.L.; Mergel, J.; Stolten, D. A comprehensive review on PEM water electrolysis. Int. J. Hydrogen Energy 2013, 38, 4901–4934. [Google Scholar] [CrossRef]
- Weber, A.Z.; Borup, R.L.; Darling, R.M.; Das, P.K.; Dursch, T.J.; Gu, W.; Harvey, D.; Kusoglu, A.; Litster, S.; Mench, M.M.; et al. A Critical Review of Modeling Transport Phenomena in Polymer-Electrolyte Fuel Cells. J. Electrochem. Soc. 2014, 161, F1254–F1299. [Google Scholar] [CrossRef]
- Abdin, Z.; Webb, C.J.; Gray, E.M. Modelling and simulation of a proton exchange membrane (PEM) electrolyser cell. Int. J. Hydrogen Energy 2015, 40, 13243–13257. [Google Scholar] [CrossRef]
- Gostick, J.T.; Weber, A.Z. Resistor-Network Modeling of Ionic Conduction in Polymer Electrolytes. Electrochim. Acta 2015, 179, 137–145. [Google Scholar] [CrossRef]
- Schmidt, O.; Gambhir, A.; Staffell, I.; Hawkes, A.; Nelson, J.; Few, S. Future cost and performance of water electrolysis: An expert elicitation study. Int. J. Hydrogen Energy 2017, 42, 30470–30492. [Google Scholar] [CrossRef]
- Springer, T.E.; Zawodzinski, T.A.; Gottesfeld, S. Polymer Electrolyte Fuel Cell Model. J. Electrochem. Soc. 2019, 138, 2334–2342. [Google Scholar] [CrossRef]


Disclaimer/Publisher’s Note: The statements, opinions and data contained in all publications are solely those of the individual author(s) and contributor(s) and not of MDPI and/or the editor(s). MDPI and/or the editor(s) disclaim responsibility for any injury to people or property resulting from any ideas, methods, instructions or products referred to in the content. |
© 2025 by the authors. Licensee MDPI, Basel, Switzerland. This article is an open access article distributed under the terms and conditions of the Creative Commons Attribution (CC BY) license.