Abstract
The growing importance of environmental technologies in a circular economy requires the use of tools that allow a realistic assessment of their economic efficiency. Classical investment indicators, such as NPV or IRR, are proving inadequate in the case of installations whose main objective is not to maximise profit but to reduce waste and emissions. There is a lack of tools in the literature that would allow for an unambiguous assessment of the unit cost of waste treatment, taking into account the life cycle of the installation and market conditions. This study aims to assess the feasibility of using the Levelised Cost of Waste (LCOW) indicator, modelled on the Levelised Cost of Energy (LCOE) from the energy sector, as a planning and decision-making tool in the waste management sector. In this study, an LCOW calculation model was developed and applied to analyse textile waste pyrolysis technology. Simulations were conducted for three plant scales (1000, 5000, and 10,000 Mg/year), and a sensitivity analysis was performed to examine the relationship between the LCOW and by-product prices, energy costs, capital expenditures, and CO2 emissions. The results confirm that the LCOW is a helpful tool for determining tariffs, identifying subsidy thresholds and comparing technology options. Its application is particularly well suited to small-scale environmental investments where classical approaches fail.
1. Introduction
Globally, the amount of municipal waste (MSW) generated is reaching alarming levels, posing a serious challenge to waste management systems. The amount of waste generated worldwide is steadily increasing. In 2023, 13.4 million tons of municipal waste were generated in Poland [1]. On average, there was 356.7 kg of collected municipal waste per capita, which was an increase compared to the previous year. In Poland 47.5% of municipal waste was sent for recovery, a significant decrease compared to 2022, when 61.1% of waste was sent for recovery [2]. Only 15.8% of municipal waste was sent for recycling, compared to almost twice as much (26.7%) in 2022. These data suggest that there is a need for further action to enhance Poland’s waste management system, particularly in the context of textile waste, which is becoming a growing component of municipal waste.
Year after year, all over the world, including in Poland, people buy more and more clothes, which are thrown away in increasing quantities. A significant contributor to the growing amount of textile waste is the phenomenon of fast fashion [3]. This is a model of clothing production that involves the rapid introduction of new collections, changing every season, which causes consumers to increasingly replace their clothes with new ones, even if the old ones are still in good condition. This phenomenon leads to an accelerated increase in textile waste.
The textile industry is one of the key pillars of the global economy, employing millions of people and supplying vast quantities of products to the international market. Global textile production in 2017 exceeded 105 million tons, and it is estimated that this figure could rise to more than 145 million tons by 2030 [4]. In Europe, the average person generates approximately 11 kg of textile waste per year, with 87% of it being sent directly to landfills or incinerated [5]. Only a small percentage is made from recycled materials or reused. In Australia, around 200,000 tons of textiles are sent to landfills each year, equivalent to 250 million pairs of jeans [6]. This behaviour not only contributes to environmental pollution but also involves a waste of resources, as textile waste, particularly that based on natural fibres, has significant potential for recovery as secondary raw materials. In the European Union, under Directive 2018/851, separate collection of textile waste has been made compulsory from 2025 to increase the recycling and reuse of these materials [7]. Consequently, there is an urgent need to develop innovative methods for managing textile waste and transforming it into value-added products, including chars, oils, and gases. Such an approach will not only contribute to reducing the amount of waste sent to landfills but also align with the concept of a circular economy, promoting the sustainable use of resources. One promising direction for managing textile waste is to subject it to pyrolysis, a process that involves the thermal decomposition of organic material under anaerobic conditions. Pyrolysis has been widely studied not only for textiles but also for other waste streams. Previous research has demonstrated its applicability to plastics [8,9], paper [10,11], RDF [12], and biomass wastes [13]. These studies highlight the flexibility of pyrolysis in treating heterogeneous materials and producing valuable products such as oils, gases, and chars. Including textile waste in this context underlines that the technology is part of a broader research field and allows for meaningful comparisons of yields, product quality, and economic feasibility across different feedstocks.
Pyrolysis enables waste materials to be efficiently transformed into valuable products: a solid fraction (char), a liquid fraction (pyrolysis oil), and a gaseous fraction, which can be used as fuel, filter materials, or intermediates in the chemical industry. In the context of implementing waste treatment technologies, the question of how to reliably assess their economic efficiency is becoming increasingly important.
Municipal solid waste (MSW) management plays a crucial role in the transition towards low-carbon development. The treatment and valorisation of waste fractions, particularly those of biogenic origin, can significantly reduce greenhouse gas emissions by displacing fossil-based resources and by enabling carbon-neutral or even carbon-negative pathways [14]. In this context, the efficiency of waste systems must be assessed not only in terms of environmental burden but also through their contribution to decarbonisation strategies. Classical investment methods, such as net present value (NPV) or internal rate of return (IRR), despite their widespread use, are not always suitable for environmental projects where revenues are limited or difficult to value, and targets are often off-market. In such cases, alternative tools are needed to assess the profitability of the investment not only from a financial perspective but also from a system and cost perspective.
The purpose of this article is to present and evaluate the usefulness of the Levelised Cost of Waste (LCOW) indicator as a decision-support tool for investment planning, tariffs and support mechanisms in waste management. This indicator, modelled on an analogous tool used in the energy sector (LCOE), enables the estimation of the total cost of treating one tonne of waste over the entire life cycle of an installation, taking into account capital expenditure, operating costs, recovery revenues, and environmental costs. The article focuses on the example of textile pyrolysis technology as a representative case of an environmental investment with material and energy potential. Technological assumptions, cost structure and an LCOW calculation model are presented. The main part of the paper is devoted to analysing the results obtained for different operational variants, including the impact of operational scale, by-product prices, and economic parameters on the LCOW level. Particular emphasis is placed on assessing the possibility of using the LCOW in planning treatment tariffs, determining the level of subsidy and selecting technologies based on local and market conditions.
2. Overview of Textile Waste Pyrolysis
2.1. Sources and Characteristics of Textile Waste
Textile waste is one component of municipal waste. It is a fraction with considerable variability in characteristics. This is influenced by the origin of the different types of fibres and differences in the production process [15]. Clothing and textile waste consists of synthetic materials (acrylic, nylon, and polyester fibres), which account for approximately 70% of textile waste, and natural materials (wool, linen, leather, silk, and cotton), which account for approximately 30% of all textile waste. Natural fibres consist mainly of cellulose (more than 60%), hemicellulose and smaller amounts of lignin. Their properties will, therefore, not contribute significantly to increased toxic emissions. Synthetic fabrics are made from polymers, so their properties can be considered similar to plastics. They are not biodegradable. According to the regulations, only energy generated from the combustion of biodegradable waste fractions can be counted as renewable energy. In Poland, the biodegradable fraction factor for used textiles is assumed to be 50%. On the other hand, for textiles of plant origin (e.g., flax, cotton), the share will be 100% [16]. The textile industry can release toxic gases, formaldehyde, nitrogen oxides, sulphur, volatile compounds, particulates, and odorous dust into the atmosphere [17]. Additionally, the fabric dyeing process at the manufacturing stage has a significant environmental impact, as it involves the use of around ten thousand different dyes to print and/or dye various types of fabrics, from which heavy metals can be released [18].
2.2. Composition and Physicochemical Properties of Textile Waste
Compared to other solid fuels [19], textiles are characterised by a low ash content (about 0.5%), moisture content (about 5%) and a relatively high calorific value, at 20 MJ/kg [20,21]. Except for wool, textiles have a low sulphur content (0.01–0.59%). In wool, the sulphur content is at the level of a few per cent and can reach up to 4 per cent [22]. This is due to the chemical structure of wool, which is composed of proteins derived from the creatine group. Their chemical structure is formed by sulphur [23]. The high sulphur content can be a limiting parameter for the use of wool as fuel.
The heavy metal content is also a significant concern [24]. The content of heavy metals in textile waste is relatively low. This is mainly due to current legislation that restricts the use of hazardous substances in the clothing industry [25], and the fact that textile fibres—both natural and synthetic—do not inherently contain high concentrations of these elements. Mercury, although it may be present in trace amounts in textiles, usually comes from residues from textile dyeing, bleaching and finishing processes, where chemical compounds of varying degrees of purity are used. Studies have shown that the mercury content in clothing samples was below 20 µg Hg/kg, which implies a low level of potential exposure through dermal contact [11,17]. These results confirm that the European regulations, such as REACH and the Oeko-Tex guidelines, have effectively limited the presence of mercury and other heavy metals in textiles intended for daily use. The authors confirm that regulations in the European Union have effectively reduced the presence of mercury and other heavy metals in everyday use textiles.
Chlorine in textiles primarily originates from technological processes, including the bleaching of fabrics, the use of dyes containing chlorinated organic compounds, and the impregnation of fabrics with fire retardants. Depending on the type of material and how it is processed, the content of total chlorine in textiles can range from 0.04 to even 1.00% [26,27] For example, in some synthetic materials, such as PVC or technical textiles, chlorine levels can be significantly higher [28]. The presence of chlorine in textile waste poses a significant challenge to its thermal conversion processes, including pyrolysis. Under high-temperature and oxygen-limited conditions, toxic by-products such as dioxins (PCDD/Fs) or polychlorinated biphenyls (PCBs) can form, which are highly detrimental to both the environment and human health [29,30]. In addition, the presence of chlorine can adversely affect the quality of pyrolysis products and lead to corrosion of industrial installations [31]. Therefore, accurate determination of the chlorine content and the possible application of purification and neutralisation techniques for pyrolysis products is important in the thermal utilisation of textiles.
2.3. Pyrolysis Treatment of Textile Waste
The pyrolysis method is an innovative technology for the thermal transformation of municipal waste under anaerobic conditions, gaining increasing recognition as one of the solutions supporting the concept of a closed-loop economy. This process enables the decomposition of complex organic compounds into solid, liquid, and gaseous fractions while reducing their negative environmental impact. As a result of the process, it is possible to increase the calorific value of the products obtained while also reducing the content of harmful elements such as chlorine or mercury, which can cause emissions during the combustion of traditional waste fuels. One of the main advantages of the pyrolysis process is the possibility of using both homogeneous and complex materials, transforming them into fractions that can be modified depending on the operating parameters, including temperature [32], heating rate, holding time, pressures [33], use of catalytic converters [34,35], and type of reactor [36]. The most commonly used reactors in pyrolysis are batch reactors [37], fixed-bed reactors and fluidised bed reactors [38].
No full-scale industrial installation for pyrolysis of textiles or other solid fractions of municipal waste is currently in operation in Poland. Technologies of this type remain at the research and demonstration stage. An example is the pilot installation for pyrolysis of RDF (Refuse-Derived Fuel) fractions located at the Waste Disposal Plant in Elbląg. Its task is to test the efficiency of the process and the energy parameters of the products obtained. In contrast to the situation in Poland, several pyrolysis installations are already operating on an industrial scale in Western European and Asian countries (e.g., Germany, The Netherlands, France, Sweden, and Japan). They process a variety of waste fractions, including plastics and textiles. The presence of these installations abroad indicates greater technological sophistication and a higher level of financial and legislative support for such solutions.
The pyrolysis process of textile waste leads to three main products: a solid fraction (char), a liquid fraction (pyrolysis oil), and a gas fraction. The proportions and properties of the individual products depend on several factors, including the composition of the raw material, process conditions (temperature, residence time, and atmosphere), and the type of reactor or condensation system used. In the case of textiles, due to the variety of raw materials (natural fibres, synthetic fibres, mixed fibres), the products obtained may differ significantly in their properties compared to the pyrolysis of other types of waste.
The char resulting from the pyrolysis of textile waste is characterised by varying physical and chemical properties, which are closely dependent on the type of raw material, the process temperature and the holding time. The process of pyrolysis of textile waste significantly improves the properties of the chars obtained, making them more valuable from the perspective of their subsequent use for energy or materials. Thermal treatment under anaerobic conditions concentrates organic carbon, resulting in an increase in total carbon content and a marked increase in calorific value. At the same time, pyrolysis thermally removes moisture, volatile parts and elements such as sulphur, chlorine or mercury, which improves the fuel quality and reduces its environmental impact in the event of further combustion. The study by Dziok [39] showed that the char produced by textile pyrolysis had significantly improved properties, making it a potential alternative fuel. An increase in the elemental carbon content and a decrease in the hydrogen content were observed, which directly translated into an increase in the calorific value of the char, reaching approximately 30 MJ/kg. In addition, the pyrolysis process enabled the reduction in undesirable elements such as sulphur, chlorine, and mercury. This suggests the potential for utilising waste textile materials as a solid fuel with enhanced physicochemical properties. Chars derived from textile waste exhibit significant potential as effective sorbents for both organic and inorganic contaminants. In particular, char produced from cotton waste has textural properties that make it a suitable material for adsorption applications [40]. In a study conducted by Sun [41], the production of activated cotton fibres was described, which showed a high absorption capacity for oils and organic solvents, such as olive oil, gasoline, and chloroform. Additionally, the pyrolysis of textile waste containing synthetic fibres can produce interesting carbon sorbent precursors [42]. The activation of char from textile waste with carbon dioxide and steam at 900 °C was described, which yielded carbon sorbents with BET surface areas of 487 and 974 m2/g. Other studies have shown that the conversion of textile waste containing polyester (PET) and polyurethane (PU) into microporous carbons through pyrolysis also yields promising results. The materials obtained showed a high adsorption capacity for dyes such as methylene blue and orange II [43]. The produced sorbents can also be used in water and wastewater treatment processes. Studies by Mazur [44] demonstrate that carbonates from textile waste effectively adsorb pharmaceuticals such as diclofenac and carbamazepine. On the other hand, Fito [45] showed that the same materials can effectively remove dyes from industrial wastewater. The use of textile waste chars in environmental treatment processes is, therefore, a promising alternative for sustainability and waste recycling, contributing to the treatment of water and wastewater, as well as the removal of organic and inorganic pollutants.
During the pyrolysis of different types of textiles, such as cotton waste, synthetic waste (e.g., polyester, polyurethane) and textile blends, part of the matter is decomposed into various liquid products. This fraction can contain several chemical compounds that depend on the type of starting material and the conditions of the pyrolysis process (temperature, holding time). The liquid fraction from the pyrolysis of textiles is primarily composed of aqueous solutions, oils, hydrocarbons, organic acids, and other chemical compounds that can be utilised in various industries, such as fuel production, chemical manufacturing, or environmental cleanup. So:
- Cotton pyrolysis: Studies have shown that the pyrolysis of pure cotton leads to a liquid fraction rich in naphtha, accounting for more than 45% of the total oil weight. The primary organic compound identified in this fraction was D-glucosamine, accounting for more than 50% of the oils obtained from cotton samples at various temperatures [40].
- In the case of cotton–polyester blends, the primary organic compound was D-allose, accounting for approximately 49.6% of the oil content [40].
- Textile waste with different compositions: A study by Sina Ogundaini & Monsurat Osobamiro [46] identified the liquid fraction compounds such as carbamate (7.69%), silicic acid (4.73%), cyclotrisiloxane (4.09%), cyclohexane (7.47%), phenol (5.95%) and other organic compounds.
The gas fraction produced during the pyrolysis of textile waste is a significant by-product that contains a mixture of light hydrocarbons, inorganic gases, and volatile organic compounds. Its composition and energy properties are strongly dependent on the type of raw material (e.g., cotton, polyester, polyurethane) and the process conditions (temperature, heating rate). The detailed composition of the main flammable and non-flammable gases generated during textile waste pyrolysis is summarised in Table 1.

Table 1.
Pyrolysis gas composition.
The gas fraction from textile pyrolysis has energy potential; it can be burned to maintain the pyrolysis temperature (achieving energy self-sufficiency in the process) or to produce heat or electricity (e.g., in co-generation). The typical calorific value of the gas fraction can be 15–25 MJ/m3—depending on the proportion of methane, hydrogen and unsaturated hydrocarbons [21,47].
3. Materials and Methods
3.1. Conceptual Framework
In the process of planning investments in waste treatment technologies, particularly in the context of increasing environmental requirements and regulatory pressures, a thorough economic efficiency analysis is crucial. In practice, the classical financial tools—net present value (NPV) and internal rate of return (IRR)—remain the dominant approaches. These methods require the estimation of future net cash flows, which involves making assumptions about investment income. In the case of rendering projects, these revenues typically come from gate fees and, to a limited extent, from the eventual sale of process products, such as in the case of pyrolysis, char or pyrolysis oil. However, the literature is increasingly highlighting the limitations of traditional investment analysis methods, especially in the context of public investments with strong social and environmental dimensions. As Escamilla-García [48] point out, the use of classical financial methods in Waste-to-Energy projects can lead to erroneous conclusions, particularly in cases of low volumes, where the IRR and NPV can show negative values despite the project’s social necessity. Similarly, Nubi et al. [49] analysed a municipal waste treatment system in Nigeria. They found that classic metrics indicated that the project was uneconomic despite being cost-effective per unit of waste treated. Subsequent studies, including those by Abdeljaber et al. [50] and Hadidi & Omer [51], highlight that classical approaches overlook the aspects of per-unit cost-effectiveness and non-financial impacts (such as emission reductions and sanitation improvements), which are crucial in environmental infrastructure investments.
NPV and IRR are based on projected cash flows, which, in the case of public investments, are difficult to value or deliberately ignored, limiting their usefulness as decision-making tools. This approach means that to obtain the analysis result, the investor must assume a specific price for the disposal service in advance. In practice, this translates into a situation where the outcome of the efficiency analysis is entirely dependent on the arbitrarily adopted rate. With a low utilisation price assumed, the project may appear uneconomic, while with a high price, it may appear artificially beneficial. Meanwhile, in economic reality, especially in the public sector, the key question is not “Does the project pay off?” but “How much does it cost per unit of waste treatment, and can we afford it?”. In response to these limitations, alternative approaches are increasingly being used in which unit cost—rather than financial profitability—becomes the primary output parameter of the analysis. One such tool is the Levelised Cost of Waste (LCOW) indicator discussed in this article, which is modelled on the Levelised Cost of Energy (LCOE) indicator widely used in the energy industry. LCOE has become widely recognised in the analysis of the cost of energy from different sources (e.g., photovoltaics, wind power, nuclear power), enabling solutions to be compared regardless of their technological nature or scale. Similarly, LCOW enables the determination of the averaged, discounted cost of treating one tonne of waste over the life cycle of an installation without making arbitrary assumptions about service prices. For example, Hossain [52], in a case study of Bangladesh, demonstrated that LCOW provides more reliable data for decision-makers, thereby eliminating the risk of underestimating costs in analyses based solely on NPV/IRR. A similar approach is presented by Abushammala & Qazi [53] in their analysis of waste-to-energy systems in Oman, where LCOW served as the overarching comparator between technologies. Further confirmation of the effectiveness of LCOW is provided by Mabalane [54], who utilised both LCOW and LCOE to evaluate anaerobic digestion and gasification technologies in South Africa. This study demonstrated that an analysis based on unit rates more effectively captures the actual costs and cost-effectiveness of infrastructure investments, particularly when the returns are non-financial. Additionally, Ahmadi [55] propose extending classical analyses to LCOW in the context of circular economy strategies for waste-based energy projects in Spain. According to this work, this indicator facilitates a more equitable comparison of technologies, regardless of their profitability, and aligns more closely with the Sustainable Development Goals (SDGs). In practice, this means that instead of assuming, for example, that it costs €400 to dispose of a tonne of waste and checking whether the investment ‘pays off’, it is possible to determine the actual cost of treating one tonne under given technical and organisational conditions. For example, for a pyrolysis plant with a given capacity and lifetime, you can calculate that the unit cost is €100 per tonne—and only then decide whether such technology is within the available financial framework or needs to be subsidised or optimised.
3.2. Mathematical Formulation
The LCOW is calculated based on a model based on the discounted cash flow (DCF) method, according to the formula proposed in this work:
where
LCOW—updated unit cost of textile disposal,
n—cost averaging period (economic life of the project),
CAPEX—capital expenditure in year t,
OPEX—operating costs in year t,
REV—revenue from sales of char, oil and gas in year t,
WASTE—quantity of textile waste processed in year t,
r—discount rate,
t—year.
It is worth noting that the LCOW indicator differs significantly from a simple operating cost, understood as the annual cost divided by the weight of waste treated. The key difference is that the LCOW takes into account the full life-cycle costs of the installation, including capital expenditure (CAPEX), operating costs (OPEX), recovery revenues (REV) and investment risk, expressed by applying a discount rate (r). In this way, the LCOW indicator reflects the real, discounted value of the unit cost over time, taking into account the project’s financing structure and long-term sustainability.
In the context of textile waste pyrolysis, the model considers the potential for generating revenue from the sale of by-products, such as char, pyrolysis oil, or combustible gases. The inclusion of revenues (REV) in the calculations reduces the net value of costs per unit of waste, allowing a more realistic and flexible assessment of economic efficiency. It also allows for an analysis of the investment’s profitability threshold depending on the market and operating conditions—e.g., the price level of carbonisation or the possibility of using gases to cover the plant’s energy needs.
3.3. Data and Assumptions
The subject of further analysis study is the application of the LCOW index to the cost assessment of a textile waste pyrolysis process under conditions similar to actual industrial operations. A technology based on a horizontal tube reactor with external heating and a dry feed system was adopted for modelling. This system assumes pretreatment of the textile waste stream by mechanical shredding and separation of metal elements and other impurities not intended for thermal treatment. The input fraction was assumed to have a maximum moisture content of 15%, eliminating the need for an additional drying step. For the purpose of modelling, a 100% polyester feedstock was assumed as a representative synthetic textile waste fraction, due to its prevalence in municipal textile streams and the availability of reliable reference pyrolysis data. This simplification allows for a clear presentation of the LCOW methodology under controlled input conditions. However, the general LCOW framework is fully applicable to mixed textile streams containing both synthetic and natural fibres, as described in the section above. In practice, the actual product yields, energy balances and emission profiles may vary depending on the composition of the input material (e.g., cotton, polyester, blended fabrics, wool or technical textiles). These variations can be accounted for by adjusting the process parameters and economic inputs, without altering the overall structure of the cost analysis.
The process is carried out in an anaerobic atmosphere at temperatures ranging from 500 to 550 °C and at atmospheric pressure. The heat required for the reaction is supplied from an external source. The model assumes that the pyrolysis gases generated during the process are completely recycled and used as fuel to feed the reactor burner, thus ensuring the autogenic nature of the heating system and the energy self-sufficiency of the plant. The thermal decomposition of the material produces three main fractions: char (solid), pyrolytic oil (condensable liquid) and pyrolytic gases. These products are then separated and recovered in appropriate systems: the char is separated in a cyclone separator, the oil is condensed in a tube condenser, while the non-condensable gases are directed to a combustion chamber and serve as heat source. The entire system is equipped with gaseous emission treatment elements, such as a ceramic filter and an acid gas absorber, enabling it to meet the environmental requirements for thermal waste treatment installations. The assumed product yields are, respectively, 30% by weight of the feedstock in the form of char, 40% in the form of pyrolytic oil and 30% in the form of combustible gases, which corresponds to the typical range observed for a mixture of cotton and polyester textiles. It should be noted that the analytical assumptions and baseline data adopted in this study are primarily based on the work of Dziok et al. [21]. Their research provided the reference values for textile waste pyrolysis efficiency and product distribution, which served as the foundation for the subsequent LCOW-based economic assessment.
To determine the possible operational scale of the analysed technology, a unit textile waste generation rate of 12 kg/person/year was assumed. This value was estimated based on available literature data covering the average collection levels of the textile fraction in municipal waste in European Union countries, as well as national reports. It should be emphasised that the amount of textile waste available depends on several factors, including the level of clothing consumption, the economic model (linear vs. circular), the efficiency of separate collection, and the degree of implementation of extended producer responsibility. Three representative scales of installation were adopted for the analysis:
- 1000 Mg/year—equivalent to serving a population of approximately 83,000 inhabitants, which can be related to medium-sized cities such as Heerlen (The Netherlands), Tarnów (Poland) or Lugo (Spain);
- 5000 Mg/year—allowing up to 417,000 inhabitants to be served, typical of larger agglomerations such as Graz (Austria), Nice (France) or Ljubljana (Slovenia);
- 10,000 Mg/year—dedicated to metropolitan areas with more than 830,000 inhabitants, such as Marseille (France), Naples (Italy) or Łódź (Poland).
The economic analysis of textile waste pyrolysis technology utilised literature data, market benchmarks, and engineering estimates of construction and operating costs for plants of varying scales of operation. Both capital expenditures and operating costs are subject to significant fluctuations depending on local conditions (e.g., energy prices, labour, and product management costs). For the analysis, valuation in real prices (excluding inflation) was assumed, and all values are expressed in euros. The time scope of the analysis was set at 20 years, which corresponds to the typical lifetime of technological installations used for thermal waste conversion. It includes both the payback phase of the investment and the long-term operating costs, as well as the possible revenue from the process products. The analysis was carried out at honest prices, i.e., excluding the impact of inflation. This means that all cash flows have been expressed in constant money value, which requires the use of a real discount rate. The analysis employed a real discount rate of 4%, in line with the European Commission’s recommendations for infrastructure and environmental projects [56]. Such a value reflects a moderate level of investment risk and the opportunity cost of capital in the public or private sector, depending on the investor’s perspective.
To estimate the investment costs associated with implementing textile waste pyrolysis technology, an approach based on the methodology developed by the U.S. Department of Energy (DOE) and the National Energy Technology Laboratory (NETL) was employed, following the classification presented by Gerdes et al. [57]. This methodology is widely used in capital cost analyses in the energy sector and is currently one of the most recognised sources for estimating the costs of industrial installations. Calculations were carried out at the Total Overnight Cost (TOC) level, which includes the full expenditures associated with project preparation, equipment procurement, construction, and plant commissioning, excluding financing costs and inflation. All cost data used in the analysis has been updated to 2025 conditions using the Chemical Engineering Plant Cost Index (CEPCI) and then converted into euros at the average exchange rate prevailing in the first quarter of 2025. This ensured that the comparisons were consistent and in line with current price levels in the European market. However, the purpose of this paper is not to develop a full valuation of pyrolysis technology but to present the application of the LCOW index in the cost analysis of this technology. Therefore, all economic data used in the model are estimates and serve only to illustrate cost relationships in the current technical and market context. Due to the lack of sufficient source input data for plants at the assumed textile waste treatment scales, TOC values were estimated by extrapolating data from the literature [Figure 1] for similar technologies in other capacity ranges [58,59]. Complementarily, unit cost data for the purchase of basic plant components, such as the pyrolytic reactor, condensation system, gas combustion system, feedstock feeders, and solid fraction separators, were also used [57,60]. On this basis, according to the adopted cost structure factors, the share of ancillary costs was determined, including construction and installation works, ancillary infrastructure, and a contingency reserve.
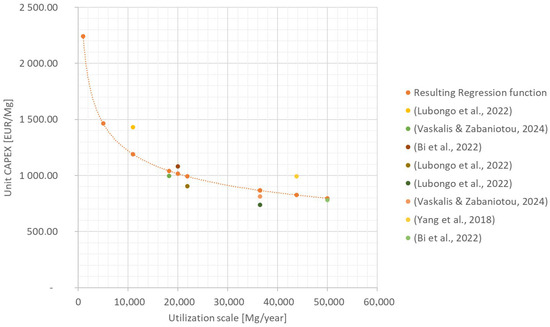
Figure 1.
Extrapolation of literature data on capital expenditure [58,59,60,61].
Based on this, the analysis adopted three investment scenarios, depending on the operational scale. The estimated values of the total investment expenditure were, respectively:
- 1000 Mg/year: EUR 2.2 million
- 5000 Mg/year: EUR 7.3 million
- 10,000 Mg/year: EUR 12.2 million
The textile pyrolysis plant analysed was adopted with the assumption of energy self-sufficiency through the use of pyrolysis gas as the primary heat energy carrier in the process. This enables a significant reduction in the costs associated with purchasing external fuels and an improvement in the economic efficiency of the system [62]. The cost analysis adopted a breakdown of operating costs (OPEX) into two main groups: variable costs, which depend on the size of the raw material stream being processed, and fixed costs, which are incurred regardless of the plant utilisation rate. The OPEX structure was developed based on literature data, process simulation results, and estimation standards for industrial installations [57,62,63,64]. The main variable costs included consumption of energy utilities, preparation of the raw material for pyrolysis and CO2 emissions. The preparation of the raw material (grinding, sorting, and possible drying) involves costs in the range of 10–30 EUR/Mg, depending on the moisture content and type of input material [62]. For simplicity, this analysis assumes an average preparation cost of €20 per tonne. Electricity consumption includes powering the shredding equipment, feeders, control systems and pumps. A unit consumption of 30 kWh/Mg was assumed [63]. None of the sources analysed directly considered the costs associated with carbon dioxide emissions from the combustion of pyrolysis gas, although technically, such emissions do occur in the process. Under the terms of the European Emissions Trading Scheme (EU ETS), these emissions can generate tangible operating costs, particularly for installations not covered by sectoral exemptions. For this analysis, an indicative value of 80 kg CO2/GJ was assumed for the emissivity of pyrolysis gas. This is intermediate between the characteristic emissivity of natural gas (approx. 56 kg CO2/GJ) and gases with higher CO and hydrocarbon content [65].
Fixed costs relate to the technical and administrative operation of the installation, including:
- Wages and labour costs—taken as 3% of TPC per annum,
- Management and administration costs—2.5% of TPC per annum,
- Local taxes and insurance—a total of 2.5% of TPC per annum.
Aggregate fixed costs were estimated at 8% of the total plant construction cost (TPC) per annum, following the approach used in techno-economic analyses for the energy and chemical sectors [57,64].
The economic analysis also made assumptions regarding the possible monetisation of pyrolysis products (REV), i.e., char and pyrolysis oil. Their potential sale can significantly affect the final LCOW, providing a source of revenue that partially offsets operating costs. For the analysis, three variants for the valuation of char were adopted:
- conservative scenario: EUR 0/Mg (no market),
- moderate scenario: EUR 80/Mg, as substitute fuel,
- optimistic scenario: EUR 150/Mg, as a product with properties similar to biochar or low-grade industrial activated carbon.
Pyrolysis oil primarily consists of aromatics, ketones, and olefins. For the calculation, its market value was assumed to be in the range of EUR 100–350/Mg, depending on the scenario and purification level.
4. Results and Discussion
Figure 2 and Table 2 present the results of the Levelized Cost of Waste (LCOW) indicator analysis conducted for textile waste pyrolysis technology at three operational scales: 1000, 5000, and 10,000 Mg/year. The horizontal axis of the graph represents the nominal scale of plant utilisation (expressed in Mg/year). The vertical axis shows the calculated LCOW value (in EUR/Mg), understood as the averaged discounted cost of processing one tonne of waste over the plant’s life cycle. The chart presents six resultant variants, differing in the assumed market value of the two main pyrolysis products: pyrolysis oil (€100 or €350/Mg) and char (€0, €80 or €150/Mg). The colouring of the points and curves illustrates the impact of these values on the level of LCOW depending on the scale of the technology.
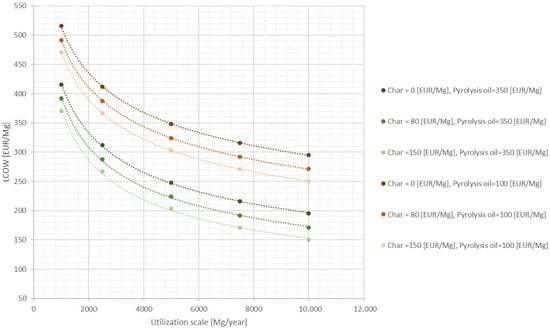
Figure 2.
Results of the LCOW analysis.
Table 2.
Results of the LCOW analysis.
Each curve represents a different price combination, ranging from the most conservative scenario (no value of char and low value of oil) to the most optimistic option (high value of both products). The curves are descending, indicating the economies of scale typical of industrial installations. An analysis of the graph shows that the level of LCOW is strongly dependent on the operating scale and assumptions regarding by-product valorisation. For the smallest of the analysed installations (1000 Mg/year), the unit cost of waste treatment can exceed €470/Mg in the pessimistic scenario, making this scale potentially unviable under market conditions without external support. At a large scale (10,000 Mg/year), even with moderate product pricing (e.g., oil = €350/Mg, char = €80/Mg), the LCOW drops to around €180/Mg, which may already be competitive with other forms of municipal waste treatment.
To put these results into a broader context, it is worth noting that no studies have been identified in the literature that report LCOW values specifically for textile waste pyrolysis. Most existing techno-economic assessments apply the levelised cost of waste concept to other waste-to-energy technologies such as incineration, gasification, or anaerobic digestion (AD). For instance, Abushammala and Qazi [53] examined these options for municipal solid waste management in Oman and reported LCOW values of 22.98 USD/t for anaerobic digestion, 42.67 USD/t for incineration, and 92.33 USD/t for gasification, all associated with positive net present values. Likewise, Mabalane et al. [54] analysed comparable configurations in South Africa and obtained 62.8 ZAR/t (≈3 EUR/t) for AD, 459 ZAR/t (≈24 EUR/t) for gasification, and 44 ZAR/t (≈2 EUR/t) for a hybrid AD–gasification system.
It should be emphasised that these studies calculated LCOW exclusively on the basis of investment and operating costs, without considering revenues from energy or product recovery. The observed differences thus stem not only from variations in feedstock characteristics and technological configuration, but also from differences in economic system boundaries. This underlines the need to interpret LCOW values in relation to the scope of cost and revenue components included, as well as to the specific waste streams analysed.
These results should therefore be interpreted not only in terms of the absolute values of the LCOW but also in terms of its function as an analytical tool. This indicator enables the identification of the so-called technological profitability threshold, i.e., the minimum scale of operation at which a given technology can achieve a competitive unit cost. In the case under analysis, it can be assumed that such a threshold for textile pyrolysis approaches the range of 5000–6000 Mg/year—a further increase in scale already brings a relatively small reduction in LCOW, which indicates that scale efficiency has been achieved (inflexion point of the economies of scale curve). The advantage of the LCOW—especially when compared to classic investment indicators such as NPV or IRR—is its direct interpretability in the context of the tariff system. Unlike previous LCOW studies that applied a strict cost-only definition, here, revenues are included to approximate the net system cost relevant for tariff planning and policy design. This indicator directly addresses the question of what the minimum charge for processing a tonne of waste should be to cover the costs of the technology at an assumed level of product valorisation. For public policy makers and municipal system operators, this means that they can quickly assess whether a technology is within an acceptable cost range for a given financing scheme. In addition, LCOW analysis enables the determination of the financing gap, i.e., the difference between the current level of unit cost and the level of tariffs that can be financed. Where the LCOW exceeds the acceptable cost of treatment (e.g., €200–250/Mg in a municipal system), this difference can form the basis for determining the amount of subsidies required. Analogous to the use of LCOE in the energy sector [66], LCOW can serve as a reference cost indicator in the design of investment support mechanisms, such as investment subsidies, feed-in tariffs, or auction models. It is worth noting that the level of LCOW is highly dependent on assumptions about the market value of process outputs. Scenarios based on a high pyrolysis oil valuation (€350/Mg) show a significantly lower LCOW across the range analysed, highlighting the need to consider market conditions and by-product management strategies when planning deployments. This analysis is complemented by the results of the sensitivity analysis of the LCOW to selected input parameters, as shown in Figure 3 (for the 10,000 Mg/year plant) and Figure 4 (for the 1000 Mg/year plant). The graphs show the relative changes in LCOW (in percentage) in response to ±20% changes in variables such as total capital cost (TPC), product prices (oil and char), electricity prices, operating costs (OPEX), and CO2 emissions costs.
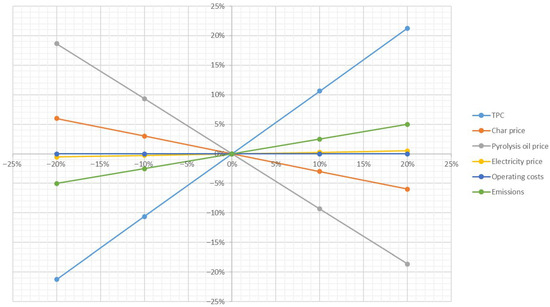
Figure 3.
LCOW sensitivity analysis for a scale of 10,000 Mg/year oil price €350 char price €150.
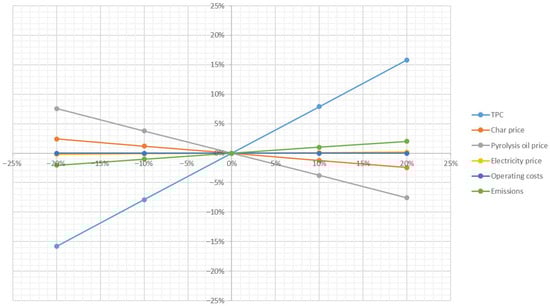
Figure 4.
LCOW sensitivity analysis for a scale of 1000 Mg/year oil price €350 char price €150.
For large-scale installations (10,000 Mg/year, Figure 3), the LCOW value is most influenced by:
- The value of capital investment (TPC)—a change of ±20% results in a change in LCOW of approximately ±21%, indicating the crucial importance of capital costs for large infrastructure projects,
- Pyrolysis oil value—almost symmetrical impact, within ±20%,
- Char prices—moderate impact, of the order of ±6–7%,
- Operating and electricity costs—have a relatively small impact (<5%),
- Emission costs—a 20% increase in the ETS price results in an increase in the LCOW of around 5%.
In the case of small-scale plants (1000 Mg/year, Figure 3), the same variables have a weaker effect on the LCOW, which seems inconsistent with expectations for indicators such as NPV, where any increase in unit cost is proportionally more significant in small units. However, in the context of LCOW, we observe the opposite situation. For this scale:
- A 20% increase in TPC could increase LCOW by 16%,
- A ± 20% change in the price of oil results in a corresponding decrease or increase in the LCOW of approximately 8%,
In the case of small-scale installations, the key factors for economic efficiency are primarily the capital expenditure and the possibility of stable product sales, i.e., precisely the LCOW. The high sensitivity to TPC indicates that without additional investment support (e.g., subsidies or preferential financing), the commissioning of such installations can be fraught with high economic risk. The LCOW in this variant, therefore, serves not only as a profitability indicator but also as a tool for analysing cost resilience and planning investment boundary conditions.
A sensitivity analysis of the LCOW indicator carried out for two extreme technological scales (1000 and 10,000 Mg/year) allows important conclusions to be drawn about its role in investment decisions. Unlike the classic sensitivity analysis carried out for indicators such as NPV or IRR, where the focus is on how changes in factors affect profitability, in the case of LCOW, the key question is: is the unit cost within an acceptable level for the system—and if not, what is its structure and how can it be managed? For small-scale plants (1000 Mg/year), the analysis showed the sensitivity of the LCOW only to changes in capital expenditure (TPC) and the price of pyrolysis oil. This means that in such projects, the LCOW plays a key role—it is not only an indicator of cost-effectiveness but the main decision criterion. A slight change in any of the key assumptions can cause the unit cost to exceed the threshold of tariff acceptability; therefore, the proper design of the charging system, as well as support or subsidy mechanisms, becomes a prerequisite for technology deployment. In contrast, for larger installations (10,000 Mg/year), although the LCOW remains a valuable planning indicator, its importance in direct decision-making is relatively less. This is because a lower LCOW characterises larger units, but at the same time, they are more sensitive to most economic parameters. In summary, the LCOW not only enables the valuation of technologies per unit mass of waste but also provides tools for identifying the scale efficiency threshold, assessing the tariff gap and determining the conditions necessary for self-financing of installations. As an indicator that combines interpretative simplicity with methodological rigour, LCOW can perform a key function in benchmarking, planning tariff schemes and constructing support policies in the waste management sector.
To highlight the novelty of the LCOW approach, it is useful to contrast it with the classical investment indicators commonly applied in waste management. Table 3 provides a concise comparison. While Net Present Value (NPV) and Internal Rate of Return (IRR) measure profitability based on projected revenues, their results are highly sensitive to tariff assumptions and discount rates. Simple unit cost calculations, in turn, neglect the role of capital expenditures and financing over time. LCOW overcomes these limitations by incorporating both capital and operating costs over the lifetime of the facility, expressed as the average cost per unit of waste treated. This feature allows LCOW to serve as a technology-neutral benchmark for decision-making, complementing rather than replacing classical metrics.
Table 3.
Added value of LCOW.
5. Conclusions
The Levelised Cost of Waste (LCOW) indicator, analogous to the Levelised Cost of Energy (LCOE) indicator commonly used in the energy sector, can play a crucial role as a tool to support rational investment and informed regulatory decision-making in the waste management sector. According to the authors, it is particularly applicable to the design of waste management tariffs, the determination of subsidy rules and the comparative evaluation of waste technologies. In line with the experience of the energy market, LCOE is now a standard method for the cost assessment of energy generation technologies, allowing different investment options to be compared in a standardised manner, regardless of their power, input structure or time horizon. The advantage of this approach is, among other things, the possibility of assessing the impact of support scenarios (e.g., auction systems, feed-in tariffs, individual premiums) and dynamic changes in the market environment (e.g., fluctuations in energy, emissions, and fuel prices) on investment profitability. While LCOW is inspired by the LCOE framework, its role in waste management differs: it provides a decision-support tool tailored to cost–revenue structures of waste treatment systems, rather than a pure technology comparison metric. Similarly, the application of LCOW in waste management enables the determination of the average cost of treating one tonne of waste over the life cycle of the installation, taking into account capital expenditure, operating costs, investment risk (through discounting), and possible recovery revenues. Unlike simple unit operating cost analyses (e.g., PLN/Mg), LCOW allows for:
- a realistic estimate of the final cost over the entire economic horizon,
- identification of profitability thresholds and cut-off points (analogous to so-called “clearing prices” in power auctions),
- analysis of cost sensitivity to market and technology variables.
In the context of tariff planning, LCOW can provide a reference cost value for designing waste management tariffs, comparable to the role of LCOE in setting reference prices for electricity. Unlike the classical cost-only definition of LCOW, our extended formulation incorporates potential revenues in order to approximate the net system cost relevant for real-world tariff planning and subsidy mechanisms. It can also indicate at what level of tariffs financial support, such as investment subsidies, operating subsidies, or tax credits, would be necessary.
In the area of subsidies, as in the case of the co-generation bonus mechanism in the power sector, the LCOW can be used as a reference for determining the so-called ‘financial gap’, which defines the level of support necessary to achieve the economic neutrality of the project (NPV = 0). In contrast to the arbitrary determination of the subsidy level, the LCOW approach enables a link between the amount of support and the actual techno-economic parameters of the investment. Finally, in terms of comparative technology assessment, the LCOW enables a transparent comparison of different disposal methods, such as pyrolysis, anaerobic digestion, composting, or incineration, in uniform cost units (e.g., €/Mg). This enables an objective assessment of technological alternatives, also in terms of local conditions (raw material availability, energy prices, population scale) and environmental objectives (emission reduction, material recovery).
The use of LCOW in a manner analogous to LCOE—as a benchmark for planning, subsidisation and technological optimisation—promotes the development of a coherent, data-driven waste management policy, especially in the context of the transformation towards a closed-loop economy. As LCOW can be externally benchmarked against contemporary gate-fee surveys and landfill charges, and its drivers are validated by sensitivity analysis, we consider the indicator a robust and transparent planning metric under parameter uncertainty.
In the specific context of Polish waste policy, our results suggest that small-scale pyrolysis plants (≈1000 Mg/year) would require targeted support instruments to remain competitive with incineration and landfilling tariffs, whereas medium- and large-scale facilities could approach cost levels consistent with current municipal gate fees. Nevertheless, our LCOW framework has limitations, as the modelling was based on simplified feedstock assumptions (100% polyester), average cost estimates, and deterministic sensitivity rather than full probabilistic uncertainty analysis. Future research should extend the LCOW methodology to mixed textile streams, integrate stochastic modelling, and perform comparative evaluations against alternative waste treatment technologies. These steps would strengthen the robustness of the indicator and its policy relevance.
Author Contributions
Conceptualization, J.F. and M.B.; methodology, R.K. and M.B.; software, R.K.; validation, M.B., J.F. and R.K.; formal analysis, R.K.; investigation, M.B.; resources, J.F.; data curation, R.K.; writing—original draft preparation, R.K. and M.B.; writing—review and editing, J.F.; visualisation, R.K.; supervision, M.B.; project administration, J.F.; funding acquisition, J.F. All authors have read and agreed to the published version of the manuscript.
Funding
Research project supported by programme “Excellence initiative—research university” for the AGH University of Krakow (IDUB 16371).
Data Availability Statement
The original contributions presented in this study are included in the article. Further inquiries can be directed to the corresponding author.
Conflicts of Interest
The authors declare no conflicts of interest.
References
- GUS Environment. 2024. Available online: https://stat.gov.pl/en/topics/environment-energy/environment/environment-2024,1,16.html (accessed on 26 June 2025).
- Municipal Waste Statistics. Available online: https://ec.europa.eu/eurostat/statistics-explained/index.php?title=Municipal_waste_statistics (accessed on 20 June 2025).
- Bailey, K.; Basu, A.; Sharma, S. The Environmental Impacts of Fast Fashion on Water Quality: A Systematic Review. Water 2022, 14, 1073. [Google Scholar] [CrossRef]
- Stanescu, M.D. State of the Art of Post-Consumer Textile Waste Upcycling to Reach the Zero Waste Milestone. Environ. Sci. Pollut. Res. 2021, 28, 14253–14270. [Google Scholar] [CrossRef]
- Materials Market Report 2023. Textile Exchange. 2025. Available online: https://textileexchange.org/knowledge-center/reports/materials-market-report-2023 (accessed on 26 June 2025).
- Australian Fashion Council and Consortium Seamless Scheme Design Summary Report 2023. Available online: https://ausfashioncouncil.com/wp-content/uploads/2023/06/Seamless-Scheme-Design-Summary-Report.pdf (accessed on 28 September 2025).
- Directive—2018/851—EN—EUR-Lex. Available online: https://eur-lex.europa.eu/eli/dir/2018/851/oj/eng (accessed on 28 September 2025).
- Maqsood, T.; Dai, J.; Zhang, Y.; Guang, M.; Li, B. Pyrolysis of Plastic Species: A Review of Resources and Products. J. Anal. Appl. Pyrolysis 2021, 159, 105295. [Google Scholar] [CrossRef]
- Anuar Sharuddin, S.D.; Abnisa, F.; Wan Daud, W.M.A.; Aroua, M.K. A Review on Pyrolysis of Plastic Wastes. Energy Convers. Manag. 2016, 115, 308–326. [Google Scholar] [CrossRef]
- Wu, C.-H.; Chang, C.-Y.; Tseng, C.-H. Pyrolysis Products of Uncoated Printing and Writing Paper of MSW. Fuel 2002, 81, 719–725. [Google Scholar] [CrossRef]
- Charusiri, W. Fast Pyrolysis of Residues from Paper Mill Industry to Bio-Oil and Value Chemicals: Optimization Studies. Energy Procedia 2015, 74, 933–941. [Google Scholar] [CrossRef]
- Efika, E.C.; Onwudili, J.A.; Williams, P.T. Products from the High Temperature Pyrolysis of RDF at Slow and Rapid Heating Rates. J. Anal. Appl. Pyrolysis 2015, 112, 14–22. [Google Scholar] [CrossRef]
- Ethaib, S.; Omar, R.; Kamal, S.M.M.; Awang Biak, D.R.; Zubaidi, S.L. Microwave-Assisted Pyrolysis of Biomass Waste: A Mini Review. Processes 2020, 8, 1190. [Google Scholar] [CrossRef]
- Wang, C.; Zhang, W.; Qiu, X.; Xu, C. Hydrothermal Treatment of Lignocellulosic Biomass towards Low-Carbon Development: Production of High-Value-Added Bioproducts. EnergyChem 2024, 6, 100133. [Google Scholar] [CrossRef]
- Gerassimidou, S.; Velis, C.A.; Williams, P.T.; Komilis, D. Characterisation and Composition Identification of Waste-Derived Fuels Obtained from Municipal Solid Waste Using Thermogravimetry: A Review. Waste Manag. Res. 2020, 38, 942–965. [Google Scholar] [CrossRef]
- Wasielewski, R.; Bałazińska, M. Energy Recovery from Waste in the Aspect of Qualifications of Electricity and Heat as Coming from Renewable Energy Sources and to Participate in the Emissions Trading System. Polityka Energetyczna—Energy Policy J. 2018, 21, 129–142. [Google Scholar] [CrossRef][Green Version]
- Slama, H.B.; Chenari Bouket, A.; Pourhassan, Z.; Alenezi, F.N.; Silini, A.; Cherif-Silini, H.; Oszako, T.; Luptakova, L.; Golińska, P.; Belbahri, L. Diversity of Synthetic Dyes from Textile Industries, Discharge Impacts and Treatment Methods. Appl. Sci. 2021, 11, 6255. [Google Scholar] [CrossRef]
- Fried, R.; Oprea, I.; Fleck, K.; Rudroff, F. Biogenic Colourants in the Textile Industry—A Promising and Sustainable Alternative to Synthetic Dyes. Green Chem. 2022, 24, 13–35. [Google Scholar] [CrossRef]
- Kijo-Kleczkowska, A.; Gnatowski, A.; Tora, B.; Kogut, K.; Bytnar, K.; Krzywanski, J.; Makowska, D. Research on Waste Combustion in the Aspect of Mercury Emissions. Materials 2023, 16, 3213. [Google Scholar] [CrossRef] [PubMed]
- Dziok, T.; Bury, M.; Adamczak, J.; Palka, J.; Borovec, K. Utilization of Used Textiles for Solid Recovered Fuel Production. Environ. Sci. Pollut. Res. 2024, 31, 28835–28845. [Google Scholar] [CrossRef]
- Dziok, T.; Grycova, B.; Grzywacz, P.; Janus, R.; Wądrzyk, M.; Matejova, L.; Lestinsky, P.; Bury, M.; Soprych, P.; Klemencova, K.; et al. Studies on the Changes in the Characteristics of Co-Pyrolysis Products of Discarded Car Tires with Cotton and Polyester Textile Waste. J. Anal. Appl. Pyrolysis 2025, 189, 107090. [Google Scholar] [CrossRef]
- Galaska, M.L.; Sqrow, L.D.; Wolf, J.D.; Morgan, A.B. Flammability Characteristics of Animal Fibers: Single Breed Wools, Alpaca/Wool, and Llama/Wool Blends. Fibers 2019, 7, 3. [Google Scholar] [CrossRef]
- Xiao, X. Animal Fibers: Wool. In Handbook of Fibrous Materials; Hu, J., Kumar, B., Lu, J., Eds.; Wiley: Hoboken, NJ, USA, 2020; pp. 37–74. ISBN 978-3-527-34220-4. [Google Scholar]
- Lam, C.H.K.; Ip, A.W.M.; Barford, J.P.; McKay, G. Use of Incineration MSW Ash: A Review. Sustainability 2010, 2, 1943–1968. [Google Scholar] [CrossRef]
- OEKO-TEX® STANDARD 100. Available online: https://www.oeko-tex.com/en/our-standards/oeko-tex-standard-100 (accessed on 20 June 2025).
- Stelmach, S. Piroliza Odpadów jako Element Gospodarki o Obiegu Zamkniętym; Monografia/[Politechnika Śląska]; Wydawnictwo Politechniki Śląskiej: Gliwice, Poland, 2019; ISBN 978-83-7880-604-2. [Google Scholar]
- Özuysal, A.; Akıncı, G. The Assessment of Refuse Derived Fuel (RDF) Production from Textile Waste. Eurasian J. Environ. Res. 2019, 3, 27–32. [Google Scholar]
- Ma, W.; Wenga, T.; Frandsen, F.J.; Yan, B.; Chen, G. The Fate of Chlorine during MSW Incineration: Vaporization, Transformation, Deposition, Corrosion and Remedies. Progress Energy Combust. Sci. 2020, 76, 100789. [Google Scholar] [CrossRef]
- Lu, P.; Huang, Q.; Bourtsalas, A.C.; Themelis, N.J.; Chi, Y.; Yan, J. Review on Fate of Chlorine during Thermal Processing of Solid Wastes. J. Environ. Sci. 2019, 78, 13–28. [Google Scholar] [CrossRef]
- Weber, R.; Sakurai, T. Formation Characteristics of PCDD and PCDF during Pyrolysis Processes. Chemosphere 2001, 45, 1111–1117. [Google Scholar] [CrossRef]
- Jiang, G.; Sanchez Monsalve, D.A.; Clough, P.; Jiang, Y.; Leeke, G.A. Understanding the Dechlorination of Chlorinated Hydrocarbons in the Pyrolysis of Mixed Plastics. ACS Sustain. Chem. Eng. 2021, 9, 1576–1589. [Google Scholar] [CrossRef]
- Gao, J.; Jin, Z.; Pan, Z. Depolymerization of Poly(Trimethylene Terephthalate) in Hot Compressed Water at 240–320 °C. Polym. Degrad. Stab. 2012, 97, 1838–1843. [Google Scholar] [CrossRef]
- Murata, K.; Sato, K.; Sakata, Y. Effect of Pressure on Thermal Degradation of Polyethylene. J. Anal. Appl. Pyrolysis 2004, 71, 569–589. [Google Scholar] [CrossRef]
- He, Y.; Hou, Y.; Wang, C.; Wang, S.; Wei, Y. Removal of Tar from Waste Textiles by Molten Carbonates Pyrolysis in Bubbling Reactor. Fuel 2023, 350, 128823. [Google Scholar] [CrossRef]
- López, A.; De Marco, I.; Caballero, B.M.; Adrados, A.; Laresgoiti, M.F. Deactivation and Regeneration of ZSM-5 Zeolite in Catalytic Pyrolysis of Plastic Wastes. Waste Manag. 2011, 31, 1852–1858. [Google Scholar] [CrossRef] [PubMed]
- Joo, J.; Kwon, E.E.; Lee, J. Achievements in Pyrolysis Process in E-Waste Management Sector. Environ. Pollut. 2021, 287, 117621. [Google Scholar] [CrossRef]
- Hassibi, N.; Quiring, Y.; Carré, V.; Aubriet, F.; Vernex-Loset, L.; Mauviel, G.; Burklé-Vitzthum, V. Analysis and Control of Products Obtained from Pyrolysis of Polypropylene Using a Reflux Semi-Batch Reactor and GC-MS/FID and FT-ICR MS. J. Anal. Appl. Pyrolysis 2023, 169, 105826. [Google Scholar] [CrossRef]
- Choi, Y.; Wang, S.; Yoon, Y.M.; Jang, J.J.; Kim, D.; Ryu, H.-J.; Lee, D.; Won, Y.; Nam, H.; Hwang, B. Sustainable Strategy for Converting Plastic Waste into Energy over Pyrolysis: A Comparative Study of Fluidized-Bed and Fixed-Bed Reactors. Energy 2024, 286, 129564. [Google Scholar] [CrossRef]
- Dziok, T.; Bury, M.; Burmistrz, P. Mercury Release from Municipal Solid Waste in the Thermal Treatment Process. Fuel 2022, 329, 125528. [Google Scholar] [CrossRef]
- Arjona, L.; Barrós, I.; Montero, Á.; Solís, R.R.; Pérez, A.; Martín-Lara, M.Á.; Blázquez, G.; Calero, M. Pyrolysis of Textile Waste: A Sustainable Approach to Waste Management and Resource Recovery. J. Environ. Chem. Eng. 2024, 12, 114730. [Google Scholar] [CrossRef]
- Sun, H.; Zhu, Z.; Liang, W.; Yang, B.; Qin, X.; Zhao, X.; Pei, C.; La, P.; Li, A. Reduced Graphene Oxide-Coated Cottons for Selective Absorption of Organic Solvents and Oils from Water. RSC Adv. 2014, 4, 30587. [Google Scholar] [CrossRef]
- Wasielewski, R.; Tomaszewicz, G. Badania Termochemicznej Konwersji Odpadów Tekstylnych Zawierających Włókna Syntetyczne. Przetwórstwo Tworzyw 2016, 22, 570–580. [Google Scholar]
- Anceschi, A.; Trotta, F.; Zoccola, M.; Caldera, F.; Magnacca, G.; Patrucco, A. From Waste to Worth: Innovative Pyrolysis of Textile Waste into Microporous Carbons for Enhanced Environmental Sustainability. Polymers 2025, 17, 341. [Google Scholar] [CrossRef]
- Mazur, M.; Shirvanimoghaddam, K.; Paul, M.; Naebe, M.; Klepka, T.; Sokołowski, A.; Czech, B. From Waste to Water Purification: Textile-Derived Sorbents for Pharmaceutical Removal. Materials 2024, 17, 3684. [Google Scholar] [CrossRef] [PubMed]
- Fito, J.; Abewaa, M.; Mengistu, A.; Angassa, K.; Ambaye, A.D.; Moyo, W.; Nkambule, T. Adsorption of Methylene Blue from Textile Industrial Wastewater Using Activated Carbon Developed from Rumex Abyssinicus Plant. Sci. Rep. 2023, 13, 5427. [Google Scholar] [CrossRef]
- Sina Ogundaini, R.; Monsurat Osobamiro, T. Textile Waste Pyrolysis: An Innovative Method for Petrochemicals Generation for Sustainable Economic, Technological and Environmental Advancement. Environ. Sci. Pollut. Res. 2024, 31, 65627–65637. [Google Scholar] [CrossRef]
- Czajczyńska, D.; Nannou, T.; Anguilano, L.; Krzyżyńska, R.; Ghazal, H.; Spencer, N.; Jouhara, H. Potentials of Pyrolysis Processes in the Waste Management Sector. Energy Procedia 2017, 123, 387–394. [Google Scholar] [CrossRef]
- Escamilla-García, P.E.; Camarillo-López, R.H.; Carrasco-Hernández, R.; Fernández-Rodríguez, E.; Legal-Hernández, J.M. Technical and Economic Analysis of Energy Generation from Waste Incineration in Mexico. Energy Strategy Rev. 2020, 31, 100542. [Google Scholar] [CrossRef]
- Nubi, O.; Morse, S.; Murphy, R.J. Prospective Life Cycle Costing of Electricity Generation from Municipal Solid Waste in Nigeria. Sustainability 2022, 14, 13293. [Google Scholar] [CrossRef]
- Abdeljaber, A.; Mostafa, O.; Abdallah, M. Applications of Life Cycle Costing in Waste-to-Energy Projects. In Life Cycle Costing; Muthu, S.S., Ed.; Environmental Footprints and Eco-design of Products and Processes; Springer Nature: Cham, Switzerland, 2023; pp. 77–115. ISBN 978-3-031-40992-9. [Google Scholar]
- Hadidi, L.A.; Omer, M.M. A Financial Feasibility Model of Gasification and Anaerobic Digestion Waste-to-Energy (WTE) Plants in Saudi Arabia. Waste Manag. 2017, 59, 90–101. [Google Scholar] [CrossRef]
- Hossain, M.M.; Shahriar, T.; Inan, M.N.; Habib, M.A.; Hasanuzzaman, M.; Hossain, M.M. Techno-Economic Impact of Incineration-Based Waste to Energy Generation Technology in Bangladesh: A Short Review and A Case Study. ChemRxiv, 2025; preprint. [Google Scholar]
- Abushammala, M.F.M.; Qazi, W.A. Financial Feasibility of Waste-to-Energy Technologies for Municipal Solid Waste Management in Muscat, Sultanate of Oman. Clean Technol. Environ. Policy 2021, 23, 2011–2023. [Google Scholar] [CrossRef]
- Mabalane, P.N.; Oboirien, B.O.; Sadiku, E.R.; Masukume, M. A Techno-Economic Analysis of Anaerobic Digestion and Gasification Hybrid System: Energy Recovery from Municipal Solid Waste in South Africa. Waste Biomass Valor. 2021, 12, 1167–1184. [Google Scholar] [CrossRef]
- Ahmadi, F.; Shirmohammadi, R.; Llovell, F.; Amidpour, M. Technoeconomic Feasibility of a Waste-to-Energy (Wte) Polygeneration System Implementing Circular Carbon Strategies: A Case Study for Spain 2025. Renew. Energy 2025, 253, 123597. [Google Scholar] [CrossRef]
- Inforegio—Guide to Cost-Benefit Analysis of Investment Projects for Cohesion Policy 2014–2020. Available online: https://ec.europa.eu/regional_policy/en/information/publications/guides/2014/guide-to-cost-benefit-analysis-of-investment-projects-for-cohesion-policy-2014-2020 (accessed on 20 June 2025).
- Gerdes, K.; Summers, W.M.; Wimer, J. Estimation Methodology for NETL Assessments of Power Plant Performance DOE/NETL-2011/1455; NETL: Pittsburgh, PA, USA, 2010. Available online: https://www.osti.gov/servlets/purl/1513278 (accessed on 26 June 2025).
- Lubongo, C.; Congdon, T.; McWhinnie, J.; Alexandridis, P. Economic Feasibility of Plastic Waste Conversion to Fuel Using Pyrolysis. Sustain. Chem. Pharm. 2022, 27, 100683. [Google Scholar] [CrossRef]
- Yang, Y.; Wang, J.; Chong, K.; Bridgwater, A.V. A Techno-Economic Analysis of Energy Recovery from Organic Fraction of Municipal Solid Waste (MSW) by an Integrated Intermediate Pyrolysis and Combined Heat and Power (CHP) Plant. Energy Convers. Manag. 2018, 174, 406–416. [Google Scholar] [CrossRef]
- Vaskalis, I.; Zabaniotou, A. Comparative Feasibility and Environmental Life Cycle Assessment of Cotton Stalks Gasification and Pyrolysis. Biomass 2024, 4, 23–48. [Google Scholar] [CrossRef]
- Bi, R.; Zhang, Y.; Jiang, X.; Yang, H.; Yan, K.; Han, M.; Li, W.; Zhong, H.; Tan, X.; Xia, L.; et al. Simulation and Techno-Economical Analysis on the Pyrolysis Process of Waste Tire. Energy 2022, 260, 125039. [Google Scholar] [CrossRef]
- Kodera, Y.; Yamamoto, T.; Ishikawa, E. Energy- and Economic-Balance Estimation of Pyrolysis Plant for Fuel-Gas Production from Plastic Waste Based on Bench-Scale Plant Operations. Fuel Commun. 2021, 7, 100016. [Google Scholar] [CrossRef]
- Ansah, E. Experimental Investigation and Aspen Plus Simulation of the Msw Pyrolysis Process. Master’s Thesis, North Carolina Agricultural & Technical State University, Greensboro, NC, USA, 2013. Available online: https://digital.library.ncat.edu/theses/104 (accessed on 20 June 2025).
- Laghezza, M.; Papari, S.; Fiore, S.; Berruti, F. Techno-Economic Assessment of the Pyrolysis of Rubber Waste. Energy 2023, 278, 127841. [Google Scholar] [CrossRef]
- Karczewski, M.; Chojnowski, J.; Szamrej, G. A Review of Low-CO2 Emission Fuels for a Dual-Fuel RCCI Engine. Energies 2021, 14, 5067. [Google Scholar] [CrossRef]
- Zamasz, K.; Kapłan, R.; Kaszyński, P.; Saługa, P.W. An Analysis of Support Mechanisms for New CHPs: The Case of Poland. Energies 2020, 13, 5635. [Google Scholar] [CrossRef]


Disclaimer/Publisher’s Note: The statements, opinions and data contained in all publications are solely those of the individual author(s) and contributor(s) and not of MDPI and/or the editor(s). MDPI and/or the editor(s) disclaim responsibility for any injury to people or property resulting from any ideas, methods, instructions or products referred to in the content. |
© 2025 by the authors. Licensee MDPI, Basel, Switzerland. This article is an open access article distributed under the terms and conditions of the Creative Commons Attribution (CC BY) license (https://creativecommons.org/licenses/by/4.0/).