Abstract
Abandoned mines represent an innovative and under-exploited resource to meet current energy challenges, particularly because of their geothermal potential. Flooded open-pits, such as those located in the Thetford Mines region (Eastern Canada), provide large, thermally stable water reservoirs, ideal for the use of geothermal cooling systems. Thermal short-circuiting that can impact the system performance affected by both free and forced convective heat transfer is hard to evaluate in these large water reservoirs subject to various heat sink and sources. Thus, this study’s objective was to evaluate the impact of natural heat transfer mechanisms on the performance of an open-loop geothermal system that could be installed in a flooded open-pit mine. Energy needs of an industrial plant using water from the flooded Carey Canadian mine were considered to develop a 3D numerical finite element model to evaluate the thermal impact associated with the operation of the system considering free and forced convection in the flooded open-pit, the natural flow of water into the pit, climatic variations at the surface and the terrestrial heat flux. The results indicate that the configuration of the proposed system meets the plant cooling needs over a period of 50 years and can provide a cooling power of approximately 2.3 MW. The simulations also demonstrated the importance of understanding the hydrological and hydrogeological systems impacting the performance of the geothermal operations expected in a flooded open-pit mine.
1. Introduction
Mining sites often feature large excavations that fill with water after abandonment [,,,,,]. Harnessing geothermal energy from this water offers a sustainable and straightforward path to economic development by repurposing former mining sites to meet the energy needs of nearby communities [,]. As demand for geothermal energy grows, various methods have emerged to assess the potential of abandoned, flooded mines using advanced analytical and numerical models [,,,]. In Canada, nearly 10,000 orphaned and abandoned mines have been identified, with roughly half being open-pit mines, leaving a significant footprint on the landscape and devaluing the land in and around the mines []. However, these open-pit sites filled with surface water are largely overlooked as geothermal resources compared to underground mines, whose potential is better studied and documented, primarily due to their greater depths and higher temperatures. Yet, these open-pit lakes hold substantial water volumes, with stable low temperatures, that can be used with heat pumps to provide space heating and cooling or direct cooling without a heat pump []. Due to their thermal inertia, such bodies of water are warmer than the surrounding air in winter and cooler in summer, making them suitable for heating and cooling applications in many regions [,,,,]. In fact, the average water temperature of deep pit lakes is typically close to the mean annual atmospheric air temperature, providing ideal sinks for heat rejection of cooling systems.
An open-loop geothermal system can experience thermal short-circuiting (TSC), where forced convection between injection and pumping wells reduces efficiency and long-term viability []. TSC typically occurs in aquifers when the hydraulic conductivity is too high relative to system flow rates, but this phenomenon is even amplified in open water, like an open-pit lake, where free and forced convection enhance thermal exchange.
Typically, the geothermal potential of flooded open-pits depends on the thermal inertia of its water, which exchanges heat with the atmosphere, hydrosphere, and lithosphere []. Pit lakes act as rechargeable thermal batteries, influenced by solar radiation, evaporation, precipitation, wind, and groundwater interactions []. Ngoyo Mandemvo [] used numerical simulations to evaluate the geothermal potential of the abandoned King-Beaver mine (Quebec), incorporating pit geometry and rock-water thermal interactions but omitting groundwater flow dynamics and pumping effects. Understanding these interactions is key to minimizing TSC [] and advancing geothermal development in flooded open-pit mines.
Société Asbestos Limitée, in Thetford Mines (Quebec, Canada), seeks to repurpose mine sites for geothermal energy. Lacombe et al. [] initially proposed an analytical approach to estimate geothermal resources in the region’s open-pit lakes, considering energy contributions from host rock and the watershed supply, varying the order of magnitude of key parameters to better quantify their influence on the resource. While useful for a first-order assessment, this analytical resource quantification based on the volumetric method did not model pumping–injection interactions. Further numerical simulations were required to support the potential development of KSM Fertilizers’ plant planned at the mine site, which would require substantial cooling of chemical processes. KSM aims to assess the Carey Canadian mine’s geothermal potential and TSC risk before implementing a system [,]. This current study addressed this problem, with the objective of evaluating the impact of natural heat transfer mechanisms, including free and forced convection, on the performance of an open-loop geothermal cooling system that could be installed in a flooded open-pit mine, which is related to the TSC risk. This represents a significant challenge since surface and groundwater flow needs to be fully coupled with heat transfer in a numerical model that can simulate the geothermal system operations. The success criteria to reach the set goal were to report a model calibrated with short-term observations that can accurately predict the long-term operation of the system considering TSC between the pumping and injection points. The Carey Canadian mine thus provides a useful example to develop similar numerical models at other sites and complete advanced numerical simulations of pit lakes cooling potential. The model presented is a first of its kind for geothermal resource assessment at a flooded open-pit mine, and this manuscript offers key insights into site characterization, system design, and resource estimation, with direct water use for industrial cooling.
2. Study Area
The Carey Canadian open-pit mine is located near the southwest boundary of the municipality of Tring-Jonction (Figure 1).
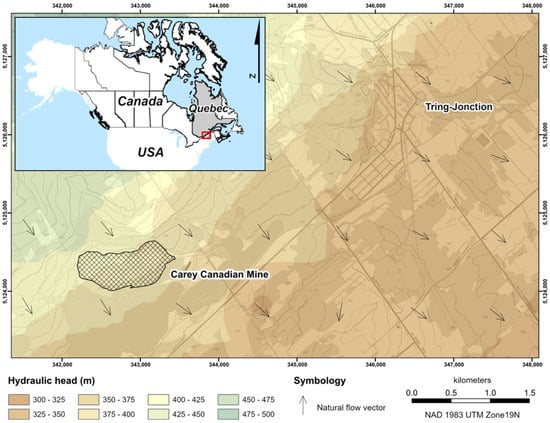
Figure 1.
Piezometric map showing the direction of groundwater flow for the Tring-Jonction region [,].
The climate of the study area was analyzed using climate data compiled by the Government of Canada between 1981 and 2010. The Saint-Séverin meteorological station, located approximately 9 km from the mine, reports an average annual temperature of 3.6 °C and total annual precipitation of 1221 mm, including approximately 915 m of rain and 306 mm of snow [].
In 1958, Carey Canadian Mines Limited began mining asbestos deposits located in a sheet of serpentinized peridotite dipping at approximately 30 degrees, consistent with the surrounding metasediments and schists [,]. The operation created a pit approximately 1000 m long and 400 m wide (Figure 2), generating approximately 41 million metric tons of mine tailings. In 1986, the global economic recession and the bad reputation of asbestos, due to its harmful effects on health, led to the definitive cessation of the exploitation of the deposits by the company ([] consulted from [,]).
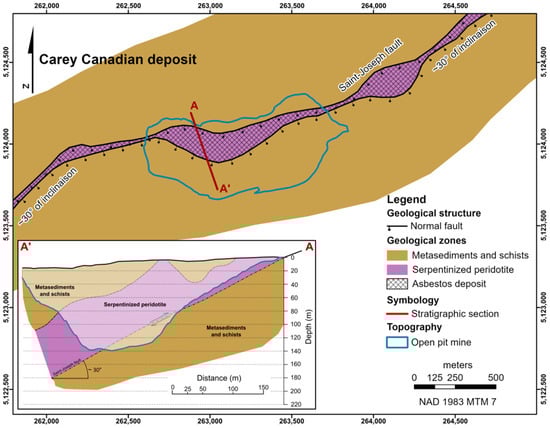
Figure 2.
Bedrock geology of the Carey Canadian mine (adapted from Riordon [] and Lacombe et al. [].
The transmissivity and hydraulic conductivity of bedrock were statistically estimated using data from the “Projets d’Acquisition de Connaissance des Eaux Souterraines” (PACES) []. Due to the lack of direct data on the transmissivity and hydraulic conductivity of the fractured rock aquifer, these parameters were evaluated using the specific capacity. This parameter corresponds to the ratio between the constant pumping rate of a well and its drawdown []. Based on a compilation of 4966 datasets, the median transmissivity and hydraulic conductivity of the fractured rock in the geological area were estimated to be 10−4.95 m2s−1 and 10−6.46 ms−1, respectively. These values represent the hydraulic properties of the fractured rock aquifer at a median depth of 38.1 m. According to Lefebvre et al. [], the hydraulic conductivity of the fractured rock aquifer is more influenced by depth than by regional geology. It can be described by a nonlinear function developed by Jiang et al. []. According to this relationship, the hydraulic conductivity of the rock aquifer decreases by approximately two orders of magnitude over the first 100 m depth. Thus, it is estimated at 10−5 ms−1 at the surface and around 10−7.4 ms−1 beyond 100 m depth.
The direction of groundwater flow for the Tring-Jonction area was estimated using the Government of Canada terrain elevation models and data from “Système d’Information Hydrogéologique” (SIH), compiled over a 10 km radius around the Carey Canadian mine site. According to a linear interpolation carried out with 287 hydraulic head data, the local topography favours preferential flow in a southeast direction (Figure 1). Additionally, the direction of groundwater flow at the Carey Canadian mine site was estimated using water-level measurements taken in observation wells embedded in the till deposits []. Thus, the piezometry of the sector confirms groundwater flow oriented towards the southeast with an average hydraulic gradient of 0.037.
The open-pit mine is now flooded with 23,174,512 m3 of water []. A ditch drains the pit lake, and the water level located at 378 m above the sea level is constant all year long.
3. Numerical Modeling Methodology
3.1. Governing Equations
The numerical model developed in this study was made with the COMSOL Multiphysics software version 6.3, enabling the simulation of surface and groundwater flow as a function of density and viscosity, through the finite element method, while coupling heat transfer mechanisms []. The 3D geological model comprises two distinct domains: open water and the surrounding rock, which is considered an equivalent porous medium allowing groundwater flow to be simulated according to Darcy’s law. In contrast, free flow of surface water is simulated according to Navier–Stokes laws. In order to deal with the coupling of these two types of flows, Darcy’s law was incorporated into the Navier–Stokes equations using the Brinkman equations, which establish a mathematical link between these two relationships [].
The velocity and pressure fields were resolved simultaneously in the free flow zones and in the porous zones. This implies that the pressure in the free fluid and the pressure of the porous medium are equivalent at the interface between these two flow zones. This also means that continuity is ensured between the speed of the fluid in free flow and the Darcy speed in the porous medium. The continuity of the flow speed and pressure implies a discontinuity of stresses at the interface between the free flow domain and that of the porous medium. The difference corresponds to the stress absorbed by the rigid porous matrix, which is an implicit consequence in the formulations of the Navier–Stokes and Brinkman equations []. The Navier–Stokes laws are used to describe the behaviour of a viscous fluid in a domain where the flow is laminar. They are based on the conservation of mass (Equation (1)) and momentum (Equation (2)) []. These general equations can be described as follows:
where (kgm−3) corresponds to the density of the fluid, (ms−1) is the velocity vector, is the identity matrix, (Pa) is the viscous stress tensor, and (Nm−3) is the volume force vector. For a Newtonian fluid, where the relationship between stress and strain is linear, Stokes formulated the following equation:
where (Pas) corresponds to the dynamic viscosity and (K) is the absolute temperature.
The use of Darcy’s law in porous media assumes laminar flow. Due to frictional resistance present in the pores, the fluid loses considerable energy, resulting in generally low flow velocities in the porous media. It is also assumed that the porous medium is completely saturated, presenting homogeneous and isotropic hydraulic properties over the entire domain []. Darcy’s law describes the velocity field (: ms−1) according to the following relationship:
In this equation, (m2) represents the permeability of the porous medium and (Pa) is the pore pressure. Darcy’s law, combined with the conservation of mass equation, provides a comprehensive mathematical model suitable for many applications involving flows in porous media, where the pressure gradient is the primary driving force []:
In this equation, represents porosity and (kgm−3s−1) is the mass source term.
The Brinkman equations are used to describe the rapid movements of fluids in porous media. They extend Darcy’s law to describe the dissipation of kinetic energy by viscous shear, like the Navier–Stokes equations. These equations are suitable for describing transitions between slow flow in porous media governed by Darcy’s law and fast flow described by the Navier–Stokes equations. They depend on the flow speed described by Darcy’s law and the pressure. Flow in the porous medium is governed by the combination of equations for the conservation of mass (Equation (5)) and the conservation of momentum (Equation (6)), which together constitute the Brinkman equations []:
The COMSOL Multiphysics software makes it possible to simulate heat exchanges by conduction and convection between free flow and in a porous medium. It is assumed that chemical reactions are neglected, as there is no evidence of exothermic or endothermic reactions taking place in the pit lake, and that thermal properties are homogeneous and isotropic. Ground properties are likely anisotropic but this simplification should not greatly affect simulations that are mainly influenced by flow and heat transfer mechanisms taking place in the free surface water body. Furthermore, by assuming a thermal equilibrium between the solid and liquid phases, COMSOL Multiphysics solves this equation, which considers a common temperature to characterize heat transfer in the porous medium []:
In these equations, (Jkg−1K−1) is the specific heat capacity of the fluid, (Wm−2) is a conductive heat flux, (Wm−3) is a heat source, and, finally, (Wm−1K−1) corresponds to the effective thermal conductivity. The parameters (Jm−3K−1) represent the effective heat capacity for a constant pressure, described by this relation:
where represents the volume fraction of the solid matrix, (kgm−3) corresponds to the density of the solids and (Jkg−1K−1) corresponds to the specific heat capacity of the solids. Like heat transfer in a porous medium, heat transfer in a free medium is described by this relation, in which the thermal properties of the solid are no longer considered []:
3.2. Simulation Context and Conceptual Model
As part of the construction of its plant, KSM plans to use the former infrastructure of the Carey Canadian mine, located on the southeast edge of the pit lake. The water from the open-pit lake would be extracted at the old ramp located at the east end of the pit, at approximately 100 m from the bank, to reach a maximum depth of approximately 10 m. After use, the water would be reintroduced to the surface of the pit lake, approximately 300 m south of the pumping point (Figure 3).
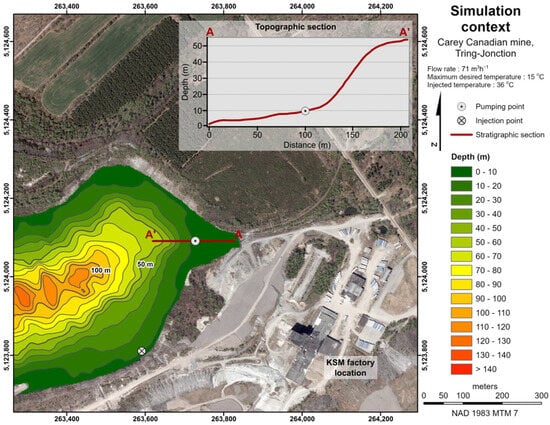
Figure 3.
Configuration of the Carey Canadian pit water pumping and injection system, illustrating the simulation context.
To meet the cooling needs of the industrial plant, KSM requires a continuous inlet temperature below 15 °C and a flow rate of 71 m3h−1. The reinjected water is estimated to reach a temperature of around 36 °C. The geometry of the model has been simplified to facilitate calculations, maintaining the total volume and maximum depth while representing its shape with a half-ellipsoid having a maximum depth of 140 m. Its surface area is estimated at approximately 250,000 m2, which corresponds to a volume of free water of approximately 23,000,000 m3 (Figure 4).
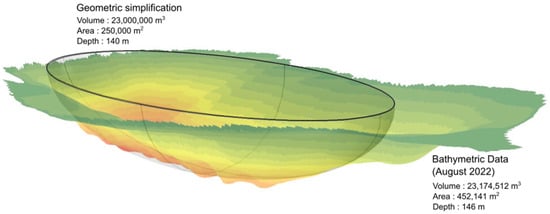
Figure 4.
Simplified geometry of the Carey Canadian mine based on bathymetric data collected in August 2022 by Lacombe et al. []. (For colour legend, see Figure 3).
This half-ellipsoid representing the pit lake was then integrated into a rectangle representing the surrounding equivalent porous medium, with dimensions of 250 m high, 1100 m wide and 600 m deep (Figure 5). These dimensions were chosen after several simulations aimed at optimizing the size of the model, thereby reducing calculation time while preserving the propagation of the thermal plume away from its boundaries. Pumping is represented by a circular surface located on the surface of the pit lake, with a radius of 5 m. The injection is represented by a 10 m long line, centered at a depth of 55 m in the open-pit lake. It is important to note that these configurations were selected with numerical stability in mind. The 3D numerical model is designed to include preferential flow in the y-axis direction, to best represent the effect of regional flow on a possible plume, in agreement with the configuration proposed by KSM. In addition, annual water inputs are integrated into the model, as well as the effect of variations in ambient air temperature by convective flow and the effect of the terrestrial heat flux (Figure 5).
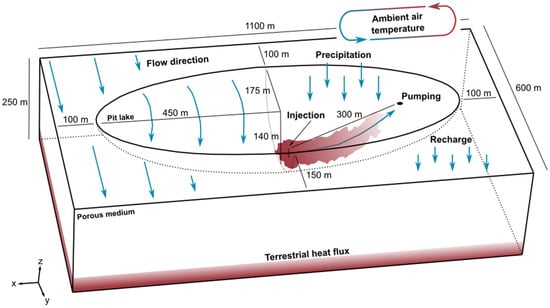
Figure 5.
Conceptual model of the numerical simulations integrating natural flow and heat transfer phenomena with the COMSOL Multiphysics software.
The simulation requires the implementation of three distinct steps to integrate the different flow and heat transfer phenomena considered. The first step of the simulation aims to achieve a steady state, by establishing a balance between natural flow, water inputs, and thermal stabilization between free water and the porous medium. The second step consists of simulating the variations of the ambient air temperature on the surface of the model in transient mode until reaching stability and reproducing observed temperature conditions. Finally, still in transient mode, the third and final step consists of the simulation of heat injection and pumping over a period of 50 years. Table 1 includes the hydraulic and thermal properties of the porous medium selected for the numerical model.

Table 1.
Hydraulic and thermal properties of the porous medium selected for the numerical model.
The thermal properties of the porous medium are derived from values determined in the laboratory using a thermal conductivity scanner with samples for the Carey Canadian mining site []. Concerning the hydraulic properties of the porous medium, they differ from the typical values of the area, as indicated in the PACES report []. These values were retained because rock is expected to be fractured and therefore permeable around the open-pit and to ensure numerical stability between the porous medium and free water. Simulations tried with a low hydraulic conductivity resulted in flow velocity contrasts and numerical convergence problems.
To compensate for the high hydraulic conductivity of the model, the regional hydraulic gradient was allowed to depart from observations to maintain the estimated inflow of 381,019 m3yr−1, which was imposed as a boundary condition at the back side of the model. This flow rate represents the quantity of water entering the pit annually by recharge of the water table, established from a hydrogeological assessment of the open-pit []. Zero pressure is applied to the front of the model to induce flow in the y-axis direction of the 3D model. Next, a zero-flow velocity is imposed on the left and right faces as well as at the base of the model to prevent water flow through these lateral and bottom surfaces. On the surface of the porous medium, a recharge rate of 385 mmyr−1 is imposed to represent the quantity of water contributing annually to the recharge of the regional aquifer, according to a hydrogeological balance calculated by Lacombe et al. []. Additionally, a flux of 1221 mmyr−1 is imposed on the surface of the pit lake to represent total annual precipitation in the region. Since the pumping point is represented by a circular area on the surface of the model, boundary conditions must be imposed, and they differ depending on the simulation step. During the steady-state simulation, a zero-flow velocity is imposed on this surface, while a model output flow rate, equivalent to 71 m3h−1, is imposed for the following simulation steps. The same input flow rate is attributed to the line inside the model representing the injection point at depth.
On all lateral faces surrounding the model, a boundary condition of zero temperature gradient is imposed, meaning that no heat exchange occurs on these surfaces. However, at the base of the model, a terrestrial heat flux of 0.044 Wm−2 is imposed []. To reach the stationary state, the surface of the porous medium is temporarily maintained at a temperature of 3.6 °C, in accordance with the average daily temperature determined on an annual basis from the ambient air measurements, evaluated from meteorological data of the Saint-Séverin weather station. To accelerate convergence towards thermal equilibrium, the initial temperature imposed on the porous medium gradually increases as a function of depth, following the local geothermal gradient of 15.8 °C km−1 [,]. A temperature of 4 °C is defined at the surface of the pit lake and is used as the initial temperature over the entire domain representing the water contained in the pit lake. This value was chosen because it corresponds to the temperature where the density of water is highest. However, during transient simulations, the fixed temperatures imposed on the surfaces of the porous media and free water are replaced by a convective heat flux. This new boundary condition makes it possible to adjust the surface temperature of the model as a function of the ambient air temperature, based on meteorological data from the Thetford Mines station integrated into the COMSOL Multiphysics software. The convective heat flow depends on a heat transfer coefficient which is calibrated manually to obtain the most representative temperature of the pit lake prior to the simulation of geothermal operations. In addition, a zero-temperature gradient is imposed on the circular surface representing the pumping point.
3.3. Meshing and Time Step
The mesh of the 3D model was defined to meet the requirements of fluid dynamics using an optimization carried out by the COMSOL Multiphysics software. This was then manually refined in the injection and pumping zones to discern variations in speed and temperature more precisely (Figure 6).
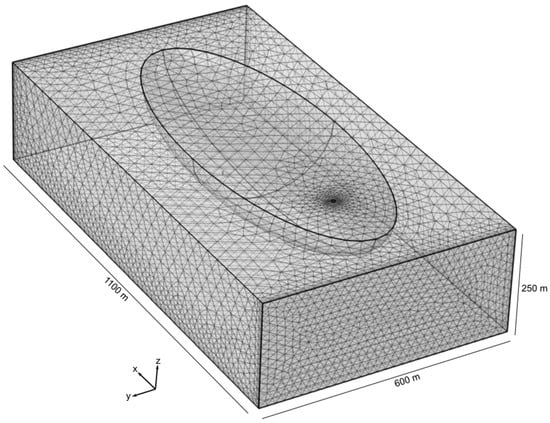
Figure 6.
Mesh of selected numerical simulations comprising a total of 113,713 elements, whose sizes vary between 3.8 m and 38.7 m.
The model is composed of a total of 113,713 elements, constructed mainly of tetrahedral shapes, with maximum and minimum dimensions of 38.7 m and 3.8 m, respectively. The presented mesh is considered the most appropriate to represent the simulation context after numerous convergence tests and careful adjustment of the configuration of the elements. The overall quality of the mesh elements was assessed using the Skewness measurement integrated into the COMSOL Multiphysics software. This measurement makes it possible to evaluate the quality of the elements according to equiangular obliquity. The general principle is to penalize elements having angles that are either too large or too small compared to the angles of an ideal element []. Mesh quality is a dimensionless value between 0 and 1, where 1 represents a perfectly regular element and 0 represents a degenerate element that may cause convergence problems. In general, elements with quality below 0.1 are considered bad for many applications. The meshing algorithms in COMSOL Multiphysics software aim to avoid the creation of poor-quality elements, but depending on the complexity of the geometry, these algorithms do not always achieve the quality required to ensure convergence. It is therefore essential to check the minimum and average quality of the elements of the numerical model. The overall quality of the numerical model was optimized using a manual refinement of the mesh at the injection and pumping points. The elements of the numerical model have an average quality of 0.70 with a minimum quality of 0.11, which ensures convergence and stability in the numerical simulations.
The geothermal system operation simulation extends over a continuous period of 50 years, with a daily output time generating a total of 18,250 simulated days. Transient simulations in COMSOL Multiphysics were solved with an adaptive time step. This means that the software automatically adjusted the time step size to maintain the desired relative tolerance. Reducing the relative tolerance to smaller numbers of results in smaller time steps increased the reliability of the solution. A relative tolerance of 0.05 was imposed on the model to ensure numerical stability while allowing the effects of ambient air temperature variations to be clearly identified on the surface of the numerical model.
3.4. Calibration
During the summer period, deep-water masses are characterized by depth-dependent temperature stratification caused by subsurface flow regimes and seasonal temperature variations [,]. Thermal stratification is characterized by three distinct zones differentiated by their contrast in temperature and density. The epilimnion generally represents the warmer surface zone and rests on a layer of cold water whose temperature is relatively undisturbed, namely, the hypolimnion. These two sections are separated by a thermal transition zone within which the temperature fluctuates greatly. The latter is known as the metalimnion [,,].
The characterization of the thermal behaviour of the water contained in the Carey Canadian mine was made with the installation of a series of submersible temperature sensors with data loggers dispersed along a cable supported and vertically stabilized by a system of buoys (Figure 7).
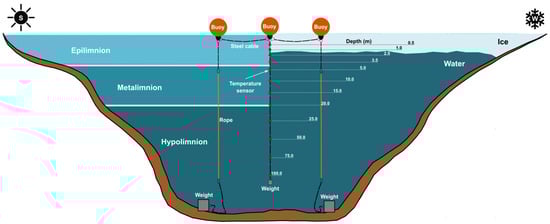
Figure 7.
Conceptual model of thermal stratification within a flooded open-pit during the summer and winter periods and diagram of the installation allowing recording of the water temperature at different depths throughout the year (adapted from []).
This installation allowed the establishment of a profile of the water temperature in the open-pit as a function of depth over a period of several years, to assess the impact of seasonal variations on the water temperature and to better quantify the available geothermal resource. In total, 12 temperature data loggers were distributed vertically over a depth of 100 m. The spacing between the logger is closer in the first 25 m to characterize thermal fluctuations with better spatial resolution. Data were collected hourly for an entire year, providing a total of 8760 temperature data points for each sensor.
Water temperature measured over a full year was used for the calibration of the numerical model, which consisted of adjusting model inputs so that it can satisfactorily reproduce annual water fluctuations under ambient temperature changes. Differences in observed versus simulated water temperature prior to geothermal system operation were used to evaluate model errors. This increased confidence in the model’s ability to reproduce the behaviour of the natural system studied. The calibration aimed to best reproduce the observed effect of seasonal variations on the water temperature in the pit lake. Integrating seasonal variations in water temperature into numerical simulations improves the estimation of available geothermal potential and the impacts associated with thermal use over an extended period [,]. To do this, the convective heat flux (; Wm−2) applied to the surface of the numerical model, represented by the following equation, was mainly adjusted:
In this relationship, (°C) represents the ambient air temperature based on the ASHRAE climate normals of the Thetford Mines station integrated into the COMSOL Multiphysics software, (°C) corresponds to the temperature of the water in the pit lake, and (Wm−2K−1) is the heat transfer coefficient. Using meteorological data, the software automatically adjusted the convective heat flux based on variations in ambient air temperature, thereby representing seasonal thermal effects and making simulations more realistic. However, the heat transfer coefficient is an unknown parameter that acts as an amplifier of the effect of ambient air temperature on the model surface. In other words, the higher the heat transfer coefficient, the greater the heat flux is at the surface of the domains of the numerical model. At the end, this parameter was manually adjusted to best reproduce the effect of variations in ambient air temperature on the observed water temperature in the pit lake.
3.5. Geothermal Potential
The thermal energy (MJ) injected in the flooded open-pit mine by the geothermal system mainly depends on the operating flow rate and the pumping and injection temperature. To correctly evaluate the thermal energy injected by the proposed system configuration, it is essential to predict the evolution of these parameters over time. With the operating flow rate maintained at 71 m3h−1 and the injection temperature (°C) kept constant at 36 °C, only the pumping temperature has an impact on the quantity of thermal energy injected by the geothermal system. Thus, this temperature was evaluated daily over a period of 50 years using an observation point located at a depth of 10 m, below the pumping zone of the numerical model. It was therefore possible to calculate the thermal power (MW) injected by the system after 50 years of simulation using the following relationship:
In this equation, the variable (s) represents the operating time and (°C) corresponds to the temperature evaluated at the observation point, where the days are represented by the exponent . This summation included 18,250 pumping temperature data, which corresponds to the number of days over a 50-year period. In addition, the parameter (m3d−1) represents the volume of water extracted and injected daily by the geothermal system.
3.6. Sensitivity Analysis
The sensitivity of the input parameters used for the numerical model was evaluated to quantify the impact of their variations on the simulation results. This allowed the determination of the parameters which have a significant influence on the results, as well as those which can have a negligible influence. This analysis contributed to improving the robustness and reliability of the numerical model by verifying the consistency of the results according to the variation of the input parameters. The sensitivity analysis was made by varying each parameter by ±10% of the initial values to identify those which have the most influence on the pumping temperature (Table 2).
Table 2.
Variations in initial parameters subject to sensitivity analysis of the numerical model.
The sensitivity analysis includes two variations of values for each of the parameters presented in Table 2. The goal was to compare the impact of these variations on the results with respect to the initial values. It should be noted, however, that the hydraulic conductivity of the porous medium was not subject to the sensitivity study. The hydraulic conductivity was chosen to ensure numerical stability between the domain of the porous medium and the free water of the model. Modification of the hydraulic conductivity could lead to flow velocity contrast and thus numerical instability compromising the reliability of the sensitivity analysis results. As explained above, the modelling strategy consisted of specifying the incoming flow rather than the hydraulic heads, and this incoming flow was subject to the sensitivity analysis to evaluate the impact of varying groundwater flow across the model.
4. Results
4.1. Calibration
The measurement of the pit lake temperature began on 13 November 2021 and was made until 25 October 2022 (Figure 8).
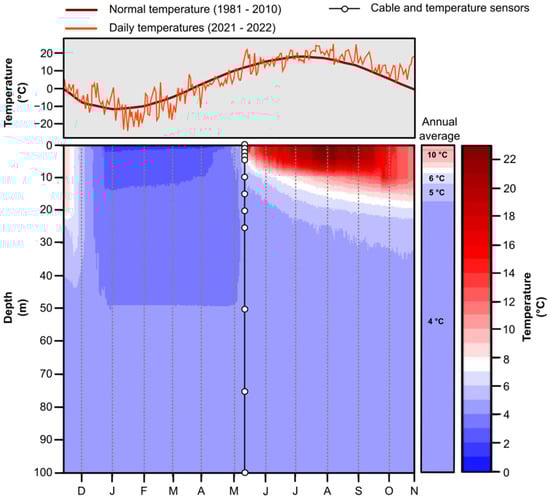
Figure 8.
Variation of water temperature in the Carey Canadian mine as a function of depth from 13 November 2021 to 25 October 2022.
The water at the surface (~0.5 m depth) of the Carey Canadian mine reaches a minimum temperature of 0.5 °C in January before reaching its maximum temperature of 22.9 °C during July. The water temperature undisturbed by seasonal variations at the Carey Canadian mine is estimated at 4.5 °C, which is reached beyond 40 m depth.
The air temperatures recorded by the Saint-Séverin meteorological station (Figure 8) are given for the duration of monitoring. These data are superimposed to climate normals for comparison. It can be concluded that the variations in water temperature recorded during the monitoring reflects the general trend of the effects of ambient air temperature variations over the pit lake.
The heat transfer coefficient () integrated in Equation (12) was modelled as a sinusoidal function whose value varies as a function of time (; s) to effectively represent the effect of variations in ambient air temperature with the numerical simulations:
The objective of the calibration was to maintain thermal stability at depth while considering seasonal influences on the open-pit water temperature. A fixed value of the heat transfer coefficient does not allow reproduction of the observed water temperatures. When the heat transfer coefficient is low, water temperatures are too low during the summer, while high values of the coefficient result in simulated temperatures below 0 °C during the winter. To reduce the impact of convective heat transfer during the winter when ice forms and the pit lake becomes insulated from ambient temperature changes at the surface, a minimum value of 5 Wm−2K−1 was imposed on the sinusoidal function. This value prevented simulated water temperatures from falling below 0 °C, while remaining close to field observations. The heat transfer coefficient was also set to a maximum value of 15 Wm−2K−1, allowing a greater increase of the pit lake temperature during the hot summer period with extended daylight. This gradual increase of the heat transfer coefficient following a wave similar to the air temperature reported in climate normals aimed to vary the effect of the convective heat transfer at the surface, thus adjusting the influence of the ambient temperature and reasonably reproducing complex heat transfer processes taking place at the pit lake surface (Figure 9).
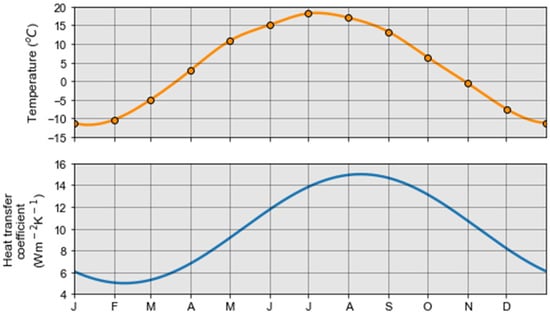
Figure 9.
Correlation between air temperature reported in climate normals from the Thetford Mines meteorological station [] and the sinusoidal function of the heat transfer coefficient.
As a result, the propagation effects of simulated ambient air temperature are mainly perceived above the depth limit of 40 m, which is consistent with field observations. Additionally, periods of temperature transition occur during May and June, as evidenced by field records. The simulated temperatures during the winter period agree well with the recorded data, whose minimum temperature reached is approximately 0.7 °C at the surface of the pit lake. However, a greater temperature difference is observed during the summer. Despite the increase in the heat transfer coefficient during the summer months, the simulated temperature does not exceed 12 °C. It is important to mention that, even when applying a higher heat transfer coefficient, the simulated water temperature could not exceed 18.2 °C, since this value corresponds to the upper limit of the climate normals of the Thetford Mines meteorological station. Heat transfer coefficient values between 5 and 15 Wm−2K−1 were nevertheless retained because the sinusoidal function makes it possible to maintain thermal equilibrium in the numerical model as a function of time (Figure 10).
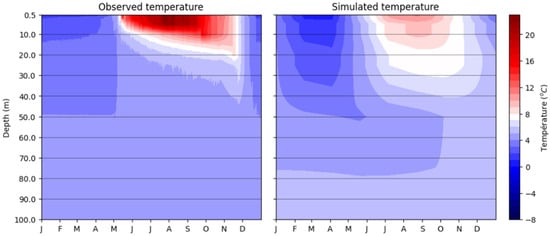
Figure 10.
Correlation between water temperature observed in the Carey Canadian mine and simulated with the numerical model, based on climate normals from Thetford Mines meteorological station and the sinusoidal function for the heat transfer coefficient (Equation (13)).
4.2. Geothermal Operation Simulations
A steady state simulation was made afterward to determine flow and temperature conditions in the porous medium and the open water body before the operation of the geothermal system (Figure 11). As a result, the temperature at the surface of the pit lake remains stable at 4 °C and shows a slight increase with depth. The difference in hydrostatic pressure causes a movement of the flow vectors from the porous medium towards the open water, where the flow velocity is higher. Furthermore, the interaction between the incoming water and the water inputs imposed on the surface of the numerical model results in a slight downward trend in the flow lines along the y-axis.
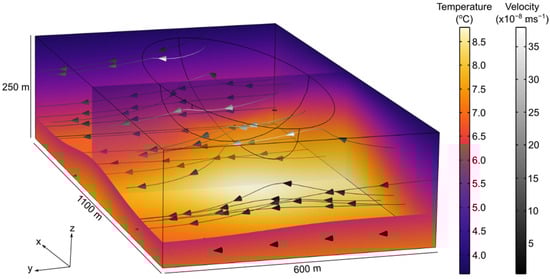
Figure 11.
Steady state temperature and velocity vectors used as initial conditions for the transient simulations of the geothermal system operation.
The effect of injection and pumping at the start of the simulation is shown in Figure 12. The interaction between injection and pumping is mainly concentrated in the first half of the pit lake. In the second half, the natural flow is preserved, and the temperature is not affected by the operation of the geothermal system. Many injection flow lines reach the pumping zone, but some of these flow lines pass through the porous medium. Some of the water entering the pit lake is captured by the pumping zone, causing the temperature of the sampled water to mix. As illustrated in Figure 12, thermal plume propagation is mainly influenced by flow lines related to injection and pumping.

Figure 12.
Propagation of the thermal plume over 50 years of continuous operation simulation of the geothermal cooling system.
During the first 30 years of continuous operation, the thermal plume propagates and amplifies rapidly. However, between 30 and 50 years of operation, the expansion of the thermal plume inside the pit lake slows down considerably, reaching thermal equilibrium with the natural environment. The thermal plume propagates along the limit of the pit lake, between the injection zone and the pumping zone, and penetrates inside the porous medium over a maximum distance of approximately 100 m after 50 years of operation. Injection and pumping temperature data extracted from COMSOL Multiphysics software are shown in Figure 13.
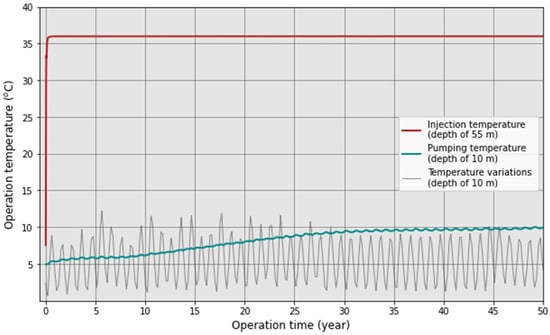
Figure 13.
Injection and pumping temperature simulated over 50 years of continuous operation of the geothermal system and impact of ambient air temperature variation on the water of the pit lake at 10 m depth in a zone non-disturbed by the operation of the system.
The injection temperature corresponds to the average of the temperatures along the injection line of the numerical model. It increases rapidly during the first year of operation, then reaching a constant injection temperature of 36 °C throughout the duration of the simulation. The temperature at the pumping point is evaluated with an observation point in the circular pumping zone at 10 m depth. This graphical representation clearly highlights the increase in temperature at the pumping point due to the extent of the thermal plume. The pumped temperature remains relatively stable during the first 10 years of operation, then increases linearly between 10 and 30 years of simulation. Subsequently, the temperature stabilizes at the pumping point between 30 and 50 years of simulation, reaching a final temperature of approximately 9.9 °C. The pumped temperature curve shows small oscillations caused by the effect of ambient air temperature variations. To better visualize this effect, an additional observation point was added to the numerical model, located at a depth of 10 m outside the zone influenced by injection and pumping. This allows showing of the effect of seasonal variations on the water temperature of the pit lake over a period of 50 years. Thus, the graphical representation of the temperature variations confirms that the progressive increase in temperature at the pumping point is directly linked to the propagation of the thermal plume and not to a general increase in the temperature of the open-pit water due to poor calibration of the model. It is also interesting to note that the amplitude of the oscillations caused by variations in ambient air temperature is significantly reduced at the pumping point compared to the values simulated outside the zone influenced by the geothermal system. This reduction in amplitude is mainly associated with the operation of the geothermal system, which generates a rapid circulation of water compared to the natural flow. Therefore, due to the high speed of the flow velocity vectors, variations in ambient air temperature have a reduced effect. This is due to the phenomenon of forced convection, which promotes better homogenization of the pumped water temperature.
The thermal power injected by free cooling is calculated by summing the energy injected at each simulation time step. The fixed parameters necessary for this calculation are listed in Table 3 and the pumping temperature is obtained from the numerical simulation (Figure 13).
Table 3.
Parameters and geothermal potential of the proposed configuration in free cooling mode.
The proposed pumping and injection configuration for the geothermal system in free-cooling mode resulted in an average thermal power injected in the pit lake of approximately 2.29 MW over a continuous operation period of 50 years. Remember that this is the thermal power determined under the operating conditions considered by KSM and that, under these conditions, the thermal plume affects less than half of the volume of the pit lake.
4.3. Sensitivity Analysis
A variation of ±10% was chosen in the sensitivity analysis to maintain the stability of the numerical simulations, particularly when modifying parameters linked to water inputs such as precipitation, recharge, and inflow. When too large a variation was applied to these input parameters, it could disrupt the numerical stability and make the analysis inconclusive. Furthermore, as explained in Section 4.1, the surface heat transfer coefficient is represented by a sinusoidal function whose intensity depends mainly on the amplitude of this function. Thus, a variation of ±10% applied to the initial amplitude of −5 of the sinusoidal function in Equation (13) was considered in the sensitivity analysis (Figure 14).
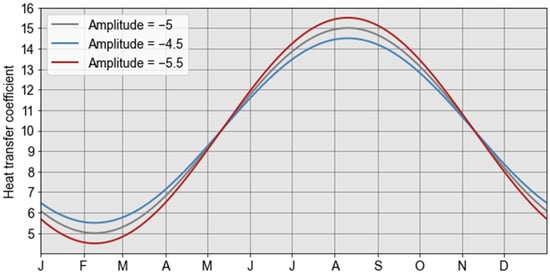
Figure 14.
Effect of a variation of ±10% in the amplitude of the sinusoidal function of the heat transfer coefficient.
Figure 15 illustrates the impact of parameter variations on the simulated temperature at the pumping point throughout the operation of the geothermal system.
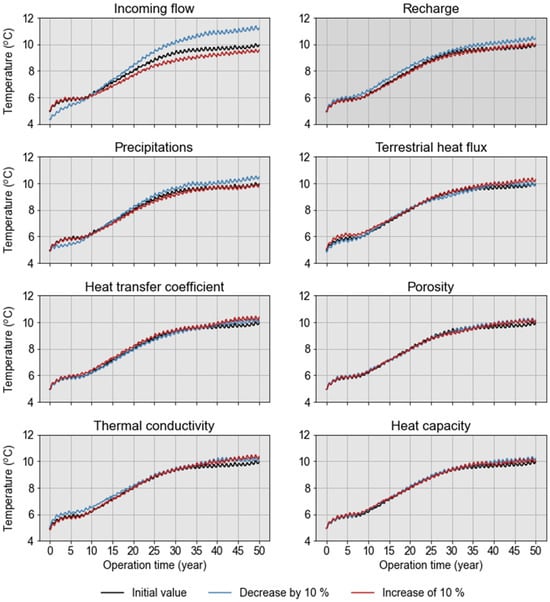
Figure 15.
Effect of a variation of ±10% of the input parameters on the result of the simulated temperature at the pumping point.
The parameters with the greatest impact on the temperature at the pumping point are mainly, in decreasing order of impact, the incoming flow, the precipitation, and the recharge, which all influence water inputs into the model. For example, a reduction of 10% of the initial incoming flow value leads to an increase in the temperature at the pumping point because less water enters the model, thus reducing the thermal recharge potential of the resource. Parameters related to heat transfer boundary conditions (terrestrial heat flux and heat transfer coefficient at the surface) have a smaller impact than the parameters related to the flow boundary conditions, while parameters related to the properties of the porous medium surrounding the pit lake (porosity, thermal conductivity, and heat capacity) have a negligible impact.
5. Discussion
A complex model is often considered complete and representative of natural phenomena to simulate. When a numerical model does not match observations perfectly, the modeller tends to add more parameters to the model (making it more complex) until a correlation is deemed sufficient between the simulated and observed values []. However, it is important that modellers recognize that numerical models are not able to represent all the phenomena, for example, those that govern the flow of surface and groundwater in a natural environment [], especially for a pit lake subject to heat transfer. It is important to note that a model that is too complex does not necessarily make it possible to distinguish the sensitivity of the different input parameters involved [,]. It is therefore preferable to fully understand the dominant phenomena and to effectively eliminate any superfluous information which tends to unnecessarily complicate the numerical simulations []. In other words, creating a numerical model should not aim at incorporating all existing natural physical processes, but rather at filtering the information to construct a simplified model representing all the main governing processes [].
The effects of water volume changes and energy inputs from precipitation, runoff, groundwater recharge, and the host rock were previously assessed using a first-order volumetric approach through a resource assessment []. However, water level variation at the Carey Canadian mine is minimal—less than 1% seasonally—with excess water discharged through an outlet, making volume change a negligible factor. Since pumping–injection dynamics were not modelled, further simulations were needed to evaluate the feasibility of a geothermal system.
The results of these numerical simulations carried out as part of this study confirm that the pumping and injection configuration proposed by KSM presents a viable option to meet the cooling needs of their industrial plant, and this during the lifespan of a geothermal system (50 years). During this period, the simulated ambient air temperature fluctuated through seasons but remained the same year after year, neglecting the impact of atypical temperature years or climate change and global warming. Indeed, the KSM plant requires a maximum pumping temperature of 15 °C. Despite model assumptions and simplifications, simulation results suggest that this maximum temperature should not be reached. The proposed location of the pumping and injection point achieved thermal stability with a pumping temperature of around 10 °C after 50 years of simulation. However, it is important to note that injection and pumping points in the model have been positioned to ensure numerical stability, and this does not accurately represent the exact configuration desired by KSM. The pumping point should be positioned at 100 m from the bank and at a depth of 10 m, while the water injection would be performed directly at the surface of the pit lake and not at a depth of 55 m. Surface injection would allow the temperature to dissipate easily into the atmosphere, contrary to what was simulated by the model. In fact, the numerical model does not allow simulating the complex heat transfer processes taking place at the pit lake surface influenced by radiation, wind speed, ice, and snow cover but captures the effect of ambient air temperature variations through a sinusoidal heat transfer coefficient adequately reproducing seasonal heat exchanges, and maintaining stable temperatures below 40 m, consistent with our water temperature measurements. In addition, the model does not consider buoyancy effects, which are associated with gravitational force. The equations used in the model allow only laminar flow to be simulated, which neglects the thermal mixing effect favoured by the turbulence of the forced convection. These simplifications resulted in conservative simulation results, favouring a wide propagation of the thermal plume.
Many questions require a thorough understanding of the interaction between groundwater and surface water. This interaction helps explain various phenomena, such as predicting how a pollutant moves in streams, lakes, and rivers, as well as solving problems related to filtration []. However, these situations raise mathematical challenges when coupling equations yielding velocity vectors of different orders of magnitude at their interface [,,]. The main limitation of this numerical model lies in its numerical instability when varying the hydraulic conductivity of the porous media, where reconciliation of flow vectors between the free water and groundwater domains remained critical. As mentioned in Section 2, the hydraulic conductivity of the ground in the area varies with values of approximately 1 × 10⁻⁵ ms−1 at the surface, decreasing to 1 × 10⁻⁷ ms−1 beyond 100 m depth. The high hydraulic conductivity attributed in the numerical model generates a more efficient infiltration capacity than that expected according to the PACES studies []. Although the influx of groundwater was adjusted in the model to compensate for this limitation, the high hydraulic conductivity of the porous medium had a significant impact on the propagation of the thermal plume generated by the operation of the geothermal system. Indeed, the propagation of the thermal plume inside the medium was favoured by advective transport due to the high hydraulic conductivity of the porous medium. This has the effect of reducing the extent of the plume inside the free flow domain, because part of the heat is transported outside the pit lake.
On the other hand, the rock surrounding the open-pit can have a higher hydraulic conductivity than that reported in the PACES studies [] due to surface weathering and blasting associated with mining activities, thereby promoting fracture propagation [,,,]. Enhanced advective transport in the surrounding rock over the first metres of distance around the open-pit is therefore possible, especially where the rock is strongly fractured []. However, a high surface permeability does not necessarily guarantee effective control of water flow over large distances, contrary to what the model simulates [,]. At greater distances, the expected hydraulic conductivity would decrease, and heat transfer could be dominated by conduction. This mode of transport would limit the propagation of the thermal plume inside the fractured rock and more heat in the open water would be retained, thus promoting an increase in the temperature of the pit lake.
Another limitation of the model is that the temperature simulated on the surface of the pit lake does not reach values as high as those observed in the field during the summer period. Additionally, since the maximum simulated temperatures are approximately 12 °C, this results in a further decrease in the model thermal plume temperature compared to the observed temperature effect, which is up to 22.9 °C. As noted in Section 4.1, it is impossible to obtain such a high surface temperature using the heat transfer coefficient approach based on climate normals. It is important to understand the difference between the effect of ambient air temperature and that of solar radiation. In fact, the temperatures recorded in the field mainly result from the interaction between variations in air temperature and solar radiation on the water surface. By neglecting the effect of solar radiation in the numerical model, it therefore becomes difficult to reach a temperature as high as that observed in the field. This also explains why the simulated temperatures during the winter period are more representative, because the effect of solar radiation on the water surface is significantly reduced due to the presence of an ice and snow cover []. This is why we chose to adjust the heat transfer coefficient to maintain stable temperatures below 40 m, in line with our field measurements.
In any case, the sensitivity analyses demonstrated that the most significant parameters to consider in the evaluation of the geothermal resource of a pit lake are linked to the flow boundary conditions of the hydrological and hydrogeological systems. It is essential to consider the flow dynamics of the pit lake when designing a geothermal system using flooded mine water. Indeed, the propagation of the thermal plume is mainly controlled by the flow rate induced by pumping and injection, but the flow rate of the natural system can influence the flow vectors and promote thermal short circuits under inadequate design. Thus, an optimal and sustainable configuration of the geothermal system should be based on a good understanding of the site hydrological and hydrogeological characteristics. Further field work could be conducted to better evaluate the water inputs and outputs of the pit lake, which would ultimately reduce uncertainty in the geothermal potential estimate.
6. Conclusions
Abandoned mining sites offer an opportunity to respond to current energy challenges. Among these, abandoned open-pit mines constitute a currently underestimated geothermal resource, offering voluminous water reservoirs at stable temperatures, especially suitable to fulfilling cooling needs. The undesirable phenomenon of TCS is influenced by free and forced convective heat transfer between pumping and injection wells, which is complex to simulate in these vast water reservoirs because of the variety of natural heat sources and sinks to consider. The aim of this study was to analyze the interaction between the various natural heat transfer mechanisms and their potential impact on the operation of an open-loop geothermal cooling system to be installed in an abandoned and flooded open-pit mine.
Unlike analytical approaches, numerical approaches have the capacity to consider the potential spatial and temporal effects of the geothermal system configuration. This study described the use of numerical simulations based on a 3D pit lake model of the Carey Canadian mine (Quebec). The simulations, carried out for a period of 50 years using the finite element method, aimed to better understand the interactions between the different natural heat transfer mechanisms likely to influence the performance of a geothermal system to be installed in a pit lake. The model developed for the Carrey Canadian mine allowed simulation of the operation of a geothermal system by considering free and forced-convective heat transfer effects of pumping and injection. Additionally, the model considered the dynamics of natural water flow, variations in ambient air temperature and terrestrial heat flux. These simulations were made to assess the cooling potential needed for the cooling process of a fertilizer plant that could be constructed beside the Carey Canadian mine. The cooling process of this plant requires a maximum water inlet temperature of 15 °C and the injection temperature was set at 36 °C, with an operating flow rate of 71 m3d−1.
Results of the numerical simulations confirmed that the configuration proposed by the plant operator has viable geothermal potential to satisfy cooling needs over a period of 50 years. It should be noted that simplifications were made to the model and resulted in conservative pumping temperature and geothermal potential estimates, knowing that these simplifications tend to limit surface heat dissipation while favouring propagation of the thermal plume. Injection and pumping points in the model were placed to ensure numerical stability, which does not accurately reflect a real geothermal system layout; a pilot test would help assess the practical impacts of their configuration. Furthermore, this numerical simulation study highlighted the importance of considering the flow dynamics of the natural system when designing a geothermal system fed with mine water taken in an open-pit. A thorough understanding of the hydrology and hydrogeology of the area allowed the proposal of a sustainable configuration for the geothermal systems, showing limiting propagation of the thermal plume between pumping and injection points.
In summary, this study highlighted the viable geothermal potential of flooded open-pit mines that can be used for cooling purposes. Restoring these sites with the exploitation of a sustainable energy source requires a multidisciplinary approach and continued collaboration between the research community and industry. Despite progress in the development of new simulation approaches, technical barriers remain regarding the implementation of these unconventional geothermal systems in Quebec and elsewhere. To overcome these challenges, it is essential to provide simulation examples such as that of the Carrey Canadian Mine. This will help reduce the perception of risks and uncertainties among future stakeholders interested in the geothermal resource potential of flooded open-pit mines.
Author Contributions
Conceptualization, S.L., F.-A.C. and J.R.; Methodology, S.L., F.-A.C. and J.R.; Software, S.L.; Validation, S.L. and F.-A.C.; Formal Analysis, S.L.; Investigation, S.L. and F.-A.C.; Resources, J.R.; Data Curation, S.L.; Writing—Original Draft Preparation, S.L.; Writing—Review and Editing, F.-A.C. and J.R.; Visualization, S.L.; Supervision, J.R. and F.-A.C.; Project Administration, F.-A.C. and J.R.; Funding Acquisition, J.R. and F.-A.C. All authors have read and agreed to the published version of the manuscript.
Funding
This research was supported by the Fonds de recherche du Québec—Nature et technologies (Grant No. 2022-0MN-300470) and the Natural Sciences and Engineering Research Council of Canada through the Graduate Scholarships—Master’s program.
Data Availability Statement
The original contributions presented in this study are included in the article. Further inquiries can be directed to the corresponding author(s).
Acknowledgments
We thank Société Asbestos for providing access to their mine site and supporting field activities, David Lemieux (KSM) for his time and valuable data contributions to numerical modeling, and Michel Carreau (Hatch Ltd.) for his participation in team meetings and insightful feedback on our work.
Conflicts of Interest
The authors declare the following financial interests or personal relationships that could be perceived as potential competing interests: Jasmin Raymond acknowledges financial support from the Fonds de Recherche du Québec—Nature et Technologies. All other authors confirm that they have no known competing financial interests or personal relationships that could have influenced the work presented in this paper.
Nomenclature
| Abbreviations | |
| 3D | Three-dimensional |
| PACES | ‘’Projets d’Acquisition de Connaissance des Eaux Souterraines’’ |
| SIH | ‘’Système d’Information Hydrogéologique’’ |
| TSC | Thermal Short Circuit |
| Measurement units | |
| % | Percentage |
| °C | Degree Celsius |
| d | Day |
| h | Hour |
| J | Joule |
| K | Kelvin |
| kg | Kilogram |
| km | Kilometer |
| m | Meter |
| m2 | Square meter |
| m3 | Cubic meter |
| mm | Milimeter |
| MJ | Megajoule |
| MW | Megawatt |
| N | Newton |
| Pa | Pascal |
| s | Second |
| W | Watt |
| yr | Year |
| Symbols and Greek letters | |
| ± | More or less (-) |
| Difference (-) | |
| Divergence or gradient (-) | |
| Porosity (%) | |
| Volume fraction of the solid matrix (-) | |
| Number of Pi (-) | |
| Dynamic viscosity (Pas) | |
| Density (kgm−3) | |
| Thermal conductivity (Wm−1K−1) | |
| Permeability of the porous medium (m2) | |
| Vectors | |
| Volume force vector (Nm−3) | |
| Identity matrix (-) | |
| Viscous stress tensor (Pa) | |
| Mass source (kgm−3s−1) | |
| Heat source (Wm−3) | |
| Conductive heat flux (Wm−2) | |
| Velocity (ms−1) | |
| Variables | |
| Specific heat capacity (Jkg−1K−1) | |
| Thermal energy (J) | |
| Heat transfer coefficient (Wm−2K−1) | |
| Pore pressure (Pa) | |
| Thermal power (W) | |
| Temperature (°C or K) | |
| Time (s) | |
| Volume (m3) | |
| Subscripts | |
| amb | Ambiant |
| eff | Effective |
| inj | Injection |
| pump | Pumping |
| s | Solid |
| w | Water |
References
- Al-Habaibeh, A.; Athresh, A.P.; Parker, K. Performance Analysis of Using Mine Water from an Abandoned Coal Mine for Heating of Buildings Using an Open Loop Based Single Shaft GSHP System. Appl. Energy 2018, 211, 393–402. [Google Scholar] [CrossRef]
- Loredo, C.; Roqueñí, N.; Ordóñez, A. Modelling Flow and Heat Transfer in Flooded Mines for Geothermal Energy Use: A Review. Int. J. Coal Geol. 2016, 164, 115–122. [Google Scholar] [CrossRef]
- Preene, M.; Younger, P.L. Can You Take the Heat?—Geothermal Energy in Mining. Min. Technol. 2014, 123, 107–118. [Google Scholar] [CrossRef]
- Grasby, S.E.; Allen, D.M.; Bell, S.; Chen, Z.; Ferguson, G.; Jessop, A.M.; Kelman, M.C.; Ko, M.; Majorowicz, J.; Moore, M.; et al. Geothermal Energy Resource Potential of Canada; Public Report 6914; Natural Resources Canada: Ottawa, ON, Canada, 2012. [CrossRef]
- Hall, A.; Scott, J.A.; Shang, H. Geothermal Energy Recovery from Underground Mines. Renew. Sustain. Energy Rev. 2011, 15, 916–924. [Google Scholar] [CrossRef]
- Raymond, J.; Therrien, R.; Gosselin, L. Low-Temperature Geothermal Energy in Mining Environments. CIM J. 2010, 1, 11. [Google Scholar]
- Menéndez, J.; Ordóñez, A.; Álvarez, R.; Loredo, J. Energy from Closed Mines: Underground Energy Storage and Geothermal Applications. Renew. Sustain. Energy Rev. 2019, 108, 498–512. [Google Scholar] [CrossRef]
- Monaghan, A.A.; Starcher, V.; Barron, H.F.; Shorter, K.; Walker-Verkuil, K.; Elsome, J.; Kearsey, T.; Arkley, S.; Hannis, S.; Callaghan, E. Drilling into Mines for Heat: Geological Synthesis of the UK Geoenergy Observatory in Glasgow and Implications for Mine Water Heat Resources. Q. J. Eng. Geol. Hydrogeol. 2022, 55, qjegh2021-033. [Google Scholar] [CrossRef]
- Banks, D.; Steven, J.; Black, A.; Naismith, J. Conceptual Modelling of Two Large-Scale Mine Water Geothermal Energy Schemes: Felling, Gateshead, UK. Int. J. Environ. Res. Public Health 2022, 19, 1643. [Google Scholar] [CrossRef]
- Banks, D.; Athresh, A.; Al-Habaibeh, A.; Burnside, N. Water from Abandoned Mines as a Heat Source: Practical Experiences of Open- and Closed-Loop Strategies, United Kingdom. Sustain. Water Resour. Manag. 2019, 5, 29–50. [Google Scholar] [CrossRef]
- Chu, Z.; Dong, K.; Gao, P.; Wang, Y.; Sun, Q. Mine-Oriented Low-Enthalpy Geothermal Exploitation: A Review from Spatio-Temporal Perspective. Energy Convers. Manag. 2021, 237, 114123. [Google Scholar] [CrossRef]
- Bao, T.; Meldrum, J.; Green, C.; Vitton, S.; Liu, Z.; Bird, K. Geothermal Energy Recovery from Deep Flooded Copper Mines for Heating. Energy Convers. Manag. 2019, 183, 604–616. [Google Scholar] [CrossRef]
- Government of Canada, Natural Resources Canada, Lands and Minerals Sector. National Inventory of Orphaned and Abandoned Mines. Natural Resources Canada, Federal Geospatial Platform. Available online: https://osdp-psdo.canada.ca/dp/en/search/metadata/NRCAN-FGP-1-330ec960-cc52-47d9-840b-d93470347ab4 (accessed on 12 April 2025).
- Comeau, F.-A.; Raymond, J.; Ngoyo Mandemvo, D.D. Évaluation du Potentiel géothermique des Mines Désaffectées de Société Asbestos Limitée à Thetford Mines; Research report; Institut National de la Recherche Scientifique (INRS): Québec, QC, Canada, 2019. [Google Scholar]
- Carcamo-Medel, M.; Fuentes, R.; Narsilio, G. Decommissioned Open-Pit Mines Are Potential Geothermal Sources of Heating or Cooling for Nearby Population Centres. Commun. Earth Environ. 2024, 5, 292. [Google Scholar] [CrossRef]
- Schultze, M.; Vandenberg, J.; McCullough, C.D.; Castendyk, D. The Future Direction of Pit Lakes: Part 1, Research Needs. Mine Water Environ. 2022, 41, 533–543. [Google Scholar] [CrossRef]
- McCullough, C.D.; Schultze, M.; Vandenberg, J. Realizing Beneficial End Uses from Abandoned Pit Lakes. Minerals 2020, 10, 133. [Google Scholar] [CrossRef]
- Gaudard, A.; Wüest, A.; Schmid, M. Using Lakes and Rivers for Extraction and Disposal of Heat: Estimate of Regional Potentials. Renew. Energy 2019, 134, 330–342. [Google Scholar] [CrossRef]
- McCullough, C.D.; Lund, M.A. Opportunities for Sustainable Mining Pit Lakes in Australia. Mine Water Environ. 2006, 25, 220–226. [Google Scholar] [CrossRef]
- Galgaro, A.; Cultrera, M. Thermal Short Circuit on Groundwater Heat Pump. Appl. Therm. Eng. 2013, 57, 107–115. [Google Scholar] [CrossRef]
- Lacombe, S.; Comeau, F.-A.; Raymond, J. A Thermal Power Budget Approach to Evaluate the Geothermal Potential of a Flooded Open-Pit Mine: Case Studies from the Carey Canadian and King-Beaver Mines (Canada). Renew. Energy 2025, 241, 122324. [Google Scholar] [CrossRef]
- Ngoyo Mandemvo, D.D. Potentiel Géothermique des Mines Abandonnées de Société Asbestos Limitée (SAL) à Thetford Mines au Québec, Canada: Cas de la mine King Beaver. Master’s Thesis, Université de Mons, Mons, Belgium, 2019. [Google Scholar]
- KSM Fertilizers Inc. Available online: https://ksmfertilizers.com/fr/a-propos/ (accessed on 17 June 2023).
- Courriel Frontenac. Le Projet de Fertilisants Agricoles Bientôt Sur Les Rails. Available online: https://www.courrierfrontenac.qc.ca/actualites/le-projet-de-fertilisants-agricoles-bientot-sur-les-rails/ (accessed on 22 November 2022).
- MELCC (Ministère de l’Environnement et de la Lutte contre les Changements Climatiques). Système D’information Hydrogéologique (SIH). Available online: https://www.environnement.gouv.qc.ca/eau/souterraines/sih/index.htm (accessed on 30 September 2021).
- Government of Canada. GeoGratis. Available online: https://geogratis.gc.ca/ (accessed on 14 October 2021).
- Riordon, P.H. Géologie des gîtes D’amiante du sud-est Québécois; Public Report ES 018; Ministère de l’Énergie et des Ressources Naturelles: Québec, QC, Canada, 1975.
- Hébert, Y. Géologie des gîtes et Indices de talc de la Région de Thetford Mines; Public Report ES 018; Ministère de l’Énergie et des Ressources Naturelles: Québec, QC, Canada, 1975.
- Gaudard, S. Voyage Au Coeur Des Appalaches: Guide Des Curiosites Minerales de Ia MRC de L’Amiante; Musée Minéralogique et Minier de Thetford Mines: Thetford Mines, QC, Canada, 1993. [Google Scholar]
- MCC, (Ministère de la Culture et de la Communication). Répertoire Du Patrimoine Culturel Du Québec: Mine Carey. Available online: https://www.patrimoine-culturel.gouv.qc.ca/rpcq/detail.do?methode=consulter&id=200848&type=bien (accessed on 8 December 2021).
- Villeneuve, M. Rapport de Caractérisation des Résidus Miniers Région de Thetford Mines; Public Report 6212-02–009; Ministère de l’Environnement et de la Lutte Contre les Changements Climatiques: Québec, QC, Canada, 2013.
- Lefebvre, R.; Ballard, J.-M.; Carrier, M.-A.; Vigneault, H.; Beaudry, C.; Berthot, L.; Légaré-Couture, G.; Parent, M.; Laurencelle, M.; Malet, X.; et al. Portrait Des Ressources En Eau Souterrain En Chaudière-Appalaches, Québec, Canada; Programme d’acquisition de connaissances sur les eaux souterraine (PACES) R-1580; Institut National de la Recherche Scientifique (INRS), Institut de Recherche et Développement en Agroenvironnement (IRDA) et REGROUPEMENT des Organismes de Bassins Versants de la Chaudière-Appalaches (OBV-CA): Québec, QC, Canada, 2015. [Google Scholar]
- Jiang, X.-W.; Wang, X.-S.; Wan, L. Semi-Empirical Equations for the Systematic Decrease in Permeability with Depth in Porous and Fractured Media. Hydrogeol. J. 2010, 18, 839–850. [Google Scholar] [CrossRef]
- SNC-Lavalin. Étude Hydrogéologique Fosse Ennoyée—Ancien Site Carey; Public Report 688807–4E-L01-00; SNC-Lavalin: Quebec, QC, Canada, 2022. [Google Scholar]
- COMSOL Multiphysics. Available online: https://www.comsol.com/ (accessed on 14 November 2023).
- COMSOL Multiphysics. Subsurface Flow Module Users Guide. Available online: https://doc.comsol.com/5.4/doc/com.comsol.help.ssf/SubsurfaceFlowModuleUsersGuide.pdf (accessed on 6 September 2023).
- COMSOL Multiphysics. Heat Transfer Module Users Guide. Available online: https://doc.comsol.com/6.1/doc/com.comsol.help.heat/HeatTransferModuleUsersGuide.pdf (accessed on 17 April 2023).
- Misener, A.D.; Thompson, L.G.D.; Uffen, R.J. Terrestrial Heat Flow in Ontario and Quebec. Trans. Am. Geophys. Union 1951, 32, 729. [Google Scholar] [CrossRef]
- Misener, A.D.; Thompson, L.G.D. Temperature Gradients in Ontario and Quebec. Can. Min. Metall. Trans 1950, 380–383. [Google Scholar]
- Kuyuk, A.; Ghoreishi-Madiseh, S.; Sasmito, A.; Hassani, F. Designing a Large-Scale Lake Cooling System for an Ultra-Deep Mine: A Canadian Case Study. Energies 2019, 12, 811. [Google Scholar] [CrossRef]
- Gammons, C.H.; Harris, L.N.; Castro, J.M.; Cott, P.A.; Hanna, B.W. Creating Lakes from Open Pit Mines: Processes and Considerations—With Emphasis on Northern Environments; Canadian Technical Report of Fisheries and Aquatic Sciences; Fisheries and Oceans Canada: Nanaimo, BC, Canada, 2009; Volume 2826, pp. 9–106.
- Kindaichi, S.; Nishina, D.; Wen, L.; Kannaka, T. Potential for Using Water Reservoirs as Heat Sources in Heat Pump Systems. Appl. Therm. Eng. 2015, 76, 47–53. [Google Scholar] [CrossRef]
- Wetzel, R.G. Limnology—Lake and River Ecosystems, 3rd ed.; Academic Press: Cambridge, MA, USA, 2001; p. 850. [Google Scholar]
- RAPPEL, (Experts-conseils en environnement et en gestion de l’eau). Composantes d’un lac. Available online: https://rappel.qc.ca/fiches-informatives/composantes-dun-lac/ (accessed on 25 October 2021).
- Park, D.K.; Lee, Y. Numerical Simulations on the Application of a Closed-Loop Lake Water Heat Pump System in the Lake Soyang, Korea. Energies 2020, 13, 762. [Google Scholar] [CrossRef]
- Government of Canada. Normales Climatiques Canadiennes—Climat—Environnement et Changement Climatique Canada. Available online: https://climat.meteo.gc.ca/climate_normals/index_f.html (accessed on 29 November 2021).
- Voss, C.I. Editor’s Message: Groundwater Modeling Fantasies—Part 1, Adrift in the Details. Hydrogeol. J. 2011, 19, 1281–1284. [Google Scholar] [CrossRef]
- Schwartz, F.W.; Liu, G.; Aggarwal, P.; Schwartz, C.M. Naïve Simplicity: The Overlooked Piece of the Complexity-Simplicity Paradigm. Groundwater 2017, 55, 703–7011. [Google Scholar] [CrossRef]
- Hill, M.C. The Practical Use of Simplicity in Developing Ground Water Models. Ground Water 2006, 44, 775–781. [Google Scholar] [CrossRef]
- Layton, W.J.; Schieweck, F.; Yotov, I. Coupling Fluid Flow with Porous Media Flow. SIAM J. Numer. Anal. 2002, 40, 2195–2218. [Google Scholar] [CrossRef]
- Haque, A.; Salama, A.; Lo, K.; Wu, P. Surface and Groundwater Interactions: A Review of Coupling Strategies in Detailed Domain Models. Hydrology 2021, 8, 35. [Google Scholar] [CrossRef]
- Kubacki, M. Higher-Order, Strongly Stable Methods for Uncoupling Groundwater-Surface Water Flow. Ph.D. Thesis, University of Pittsburgh, Pittsburgh, PA, USA, 2014. [Google Scholar]
- Dong, Q.; Liu, X.; Gong, H.; Luo, Y.; Li, X.; Wang, L. The Damage Induced by Blasting Excavation and Seepage Characteristics of Deep Rock under High Seepage Pressure. Geofluids 2023, 2023, 9159098. [Google Scholar] [CrossRef]
- Balcewicz, M.; Ahrens, B.; Lippert, K.; Saenger, E.H. Characterization of Discontinuities in Potential Reservoir Rocks for Geothermal Applications in the Rhine-Ruhr Metropolitan Area (Germany). Solid Earth 2021, 12, 35–58. [Google Scholar] [CrossRef]
- Yuan, H.; Chen, C.; He, Z.; Wang, Y. Numerical Simulation of Fluid-Solid Coupling in Surrounding Rock for River Stope Mining. Shock Vib. 2020, 2020, 9786182. [Google Scholar] [CrossRef]
- Morrow, C.A.; Lockner, D.A. Permeability Differences between Surface-derived and Deep Drillhole Core Samples. Geophys. Res. Lett. 1994, 21, 2151–2154. [Google Scholar] [CrossRef]
- Ti, Z.; Zhang, F.; Pan, J.; Ma, X.; Shang, Z. Permeability Enhancement of Deep Hole Pre-Splitting Blasting in the Low Permeability Coal Seam of the Nanting Coal Mine. PLoS ONE 2018, 13, e0199835. [Google Scholar] [CrossRef]
- Petrov, M.P.; Terzhevik, A.Y.; Palshin, N.I.; Zdorovennov, R.E.; Zdorovennova, G.E. Absorption of Solar Radiation by Snow-and-Ice Cover of Lakes. Water Resour. 2005, 32, 496–504. [Google Scholar] [CrossRef]
Disclaimer/Publisher’s Note: The statements, opinions and data contained in all publications are solely those of the individual author(s) and contributor(s) and not of MDPI and/or the editor(s). MDPI and/or the editor(s) disclaim responsibility for any injury to people or property resulting from any ideas, methods, instructions or products referred to in the content. |
© 2025 by the authors. Licensee MDPI, Basel, Switzerland. This article is an open access article distributed under the terms and conditions of the Creative Commons Attribution (CC BY) license (https://creativecommons.org/licenses/by/4.0/).