Abstract
Offshore wind energy is becoming an increasingly important element in the decarbonisation of energy systems. This study aims to estimate the technical potential for offshore wind energy in the Polish exclusive economic zone (EZZ) of the Baltic Sea. Such estimates are necessary to plan the expansion of energy infrastructure. This paper proposes a multi-criteria analysis for the estimation of offshore wind potential and site selection using QGIS software (QGIS Desktop 3.28.6). The criteria include wind velocity, water depth, distance from nature conservation areas, distance from submarine cables and gas pipelines, distance from shipping routes, distance from fishing areas, distance from shipwrecks, and distance from the coastline. The best sites are identified through the Analytic Hierarchy Process (AHP). The results show that the total suitable marine area of 16,218.67 square kilometres can be divided into three parts, in which the highly suitable area for offshore wind farms accounts for 17.55%, the moderately suitable area accounts for 48.56%, and the marginally suitable area accounts for 10.26%. Two different wind turbine placement configurations are being considered, in which wind turbines with a nominal capacity of 15 MW are laid out: 2.5 km and 2 km apart from each other. The corresponding overall electrical capacities only in highly suitable areas equal ca. 9 GW and 15 GW, respectively. If this area is extended to also include the moderately suitable parts, these values increase to ca. 31 GW and 50 GW. The results indicate that the technical potential of offshore wind in the Polish EEZ is significant and should be taken into account when designing the future electricity generation mix.
1. Introduction
In order to reach the national and European targets of a climate-neutral economy by 2050 [1], countries like Poland, which is still dominated by coal-based power generation, have to implement an adequate strategy for the development of renewable energy sources. Currently, solar and onshore wind systems have been developing most rapidly, replacing conventional power plants in the global energy mix. The development of offshore wind has a big advantage, which is more stable generation due to better wind resources over the sea. Both onshore and offshore wind technologies are characterised by technical maturity, and their environmental impacts are not significant if the necessary precautions have been taken. The better quality of wind resources over the sea makes it possible to install higher turbines with bigger rotor diameters that have a unit capacity of up to 15 MW/turbine [2,3].
This makes the offshore wind market the most dynamically growing market, especially in Europe. In 2021 in Europe, 3.3 GW of electrical capacity was added, and the overall capacity of offshore wind farms (OWFs) reached 28.3 GW. Today, the electrical capacity of projects carried out in the Baltic Sea is around 2.8 GW [4]. The optimistic predictions show that by 2030, only the United Kingdom will own 40 GW, while all of the European countries are expected to have up to 135 GW of offshore wind power [5]. More modest predictions show that by 2050, in the Baltic Sea, there will be 85 GW of offshore wind installed. As a result, the Baltic Sea would be the second-largest basin for offshore wind in Europe, after the North Sea [6].
Offshore wind energy could play a very important role in the transition of the Polish power sector. It is expected that most of the dispatchable coal-fired power plants will be decommissioned in the coming decade [7]. This creates an opportunity for RES characterised by stable generation and a high capacity factor (CF), such as offshore wind, for which the CF in the Polish conditions is reported to be in the range from 41.3% [8] to 55% [9]. In order to plan the expansion of offshore wind and its associated energy infrastructure and to properly set the corresponding policy targets, it is necessary to identify the technical potential for offshore wind in the Polish exclusive economic zone (EEZ) of the Baltic Sea. There have been studies aimed at conducting a multi-criteria analysis of the already planned investments in offshore wind projects in Poland. An analysis made with the use of the multi-criteria evaluation, including the modified fuzzy TOPSIS (Technique for Order of Preference by Similarity to Ideal Solution) method for sixed planned investments, revealed the most economically effective ones [10]. In the case study conducted for the planned offshore investments in the Polish EEZ [11], a comprehensive methodological approach was presented that allowed for the maximum capture of uncertainties and risks. Poland’s public policy tools supporting offshore wind projects were described and analysed from a wider geostrategic perspective in [12].
However, the number of works related to the assessment of the technical potential of offshore wind power in Poland is rather limited, and estimates vary significantly. For example, according to [13], this potential is 116 GW, of which 60 GW is suitable for fixed technologies and 56 GW is suitable for floating technologies. Poland’s Energy Policy for 2040 uses a value of 11 GW as the available potential [14], while the NWEA report estimates it to be 33 GW [15]. The European Commission, in its study on the Baltic Energy Market Interconnection Plan [8], identifies the offshore wind potential in Poland to be 12 GW. Estimates based on German and Danish experiences indicate that the potential of offshore wind in the EEZ could be at least 10–12 GW [16]. The differences in estimates confirm the need for further research in this area based on the transparent methodology.
There are numerous papers describing different methodological approaches to resource assessment. The examples are the resource estimation model and Geographical Information Systems (GISs). Data collection is a former step, and the methods are on-site measurements, weather station networks, and numerical climate models. Typically, the measurements in offshore regions are performed using different types of buoys (met buoys or moored buoys, depending on the water depth). Examples of remote sensing measurements are SODAR and LIDAR. Another possible option is to employ satellite data and combine them with the surface wind recording data accumulated using devices like scatterometers, altimeters, passive microwave remote sensors, and synthetic aperture radars (SARs). The raw data are then inserted into the mathematical model to create data sets [17]. The next step is to employ the selected method.
The most common way to assess wind resources is probably by using the Weibull and Rayleigh distribution. These are statistical functions, and they use simple parameters like the wind speed, shape parameter, and scale parameter [18]. Another more advanced method is Measure-Correlate-Predict (MCP). This approach not only considers the wind speed but also the direction. The first step is data gathering, and then the model is built in the second step, and finally, the historical data are divided into similar groups and further analysed to learn how to better predict wind speed distribution in each direction. MCP implements correlation with historical observations of 5–10 years [19,20]. Additionally, there are numerous advanced tools that allow for estimation or modelling. A software called WAsP (version 12) is widely known and is an example of wind atlas methodology. In this approach, the data are gathered and calibrated with the objective of obtaining the most accurate, reliable, and complete data. Then, additional long-term data should be implemented, as well as the data regarding the terrain: the elevation map and the land cover map. The model also takes into account the type of wind turbine as well as the layout, introduced by the user. After providing all of the necessary parameters, the calculation takes place, and the wind climate observed at a meteorological station is transformed to the generalised wind climate: static or dynamic. The latter is often preferred due to the direct reflection of changes. Other software that enable wind condition assessment are Openwind, Wind PRO, and RETScreen (version 4) [21,22].
Another often-deployed method is the Geographical Information System (GIS) approach. This method offers a great variety of uses. It enables a more complete analysis than the previously mentioned methods. The visualisation of the spatial data is a huge advantage. In this way, the impact of the individual aspects limiting the location is clearer. Furthermore, by combining all of the layers into one, the relationship among multiple constraints is shown. Nearly all significant aspects regarding offshore wind farms can be assessed using GIS software (for example ArcGIS 10.1). Among them, Cavazzi and Dutton placed development costs dependent on water depth; the distance from the nearest port or grid connection point; the potential energy production dependent on the annual average wind speed, potential array losses, and turbine availability; operation and maintenance costs; and financial parameters. GIS as an analytical site modelling tool, and it supports the preliminary selection of new turbine sites. The proposed model has two principal components: an economic database, based on existing cost data and predicted future cost developments, and a GIS component, which ties the cost data to the geographic properties that are unique to each site. This paper aimed to provide a spatially explicit model, using GIS, which is capable of estimating economically accessible offshore wind energy resources. The chosen location was the Renewable Energy Zone (REZ) in the United Kingdom (UK) that was declared as the area of the sea, beyond the United Kingdom’s territorial sea, which may be exploited for energy production. It was divided into grid squares of 10 km × 10 km, thereby taking into account local conditions on a scale that is compatible with the average raw wind speed data and computational feasibility [23]. A similar approach was suggested for the region of Jeju Island, South Korea [24]. To receive optimal sites, the authors have applied an equally weighted method for the chosen constraints. The necessary criteria were classified into four categories to present the multitude of factors that impact the development of offshore wind farms. As a result of the analysis, four scenarios that focus on different criteria were formulated. Scenario 1 considers only energy resources and profitability, Scenario 2 adds the criteria of conservation areas and view protection, Scenario 3 highlights the criteria of human activities, while Scenario 4 deeply analyses the criteria of the marine environment and marine ecology. Each of the subsequent scenarios considered a wider set of selection criteria. In this way, feasible sites for offshore wind farms have been investigated. For the first scenario, the suitable areas were distributed around Jeju Island; however, after applying other constraints, only a few sites were still adequate. This shows that while deciding on the location for offshore wind farms, all of the crucial categories should be considered. The authors point out that this approach would decrease conflicts between stakeholders. Moreover, the GIS method can be implemented together with other methods or software. The analysis of the EEZ of China was performed while taking into account the technical, spatial, and economic constraints and the power curves obtained from the WindPRO 2.7 software to assess the energy production and annual energy output per area. As a result, the study presented a GIS-based energy output model, cost model, and marine spatial planning. In addition, the offshore wind potential has been compared with the energy demand of the relevant area [25]. Similarly, the EEZ of Denmark has been investigated with the GIS model combined with the WaSP/KAMM model. The outcome of that approach was near-shore and far-shore scenarios. The authors compared them in terms of annual power production, area consumption, and installed capacity [26].
GIS-based methods are often combined with multi-criteria decision-making methods (MCDMs). The integration of GIS and MCDM allows decision makers to incorporate the spatial context. The GIS-MCDM combination has been used in numerous studies of renewable energy locations. In the context of the evaluation of the best location and the potential of wind farms, the Analytic Hierarchy Process (AHP), a method within the domain of Multi-Criteria Decision Making (MCDM), is commonly used. The AHP involves pairwise comparisons of the relative importance of criteria in the decision hierarchy (Appendix A). The results of the AHP are the criteria weights, showing their relative importance in reaching an overarching goal. A common scale that is used for pairwise comparisons typically contains integer values ranging from 1 to 9, where 9 signifies a very strong preference. The assessment of relative importance or preference through pairwise comparisons is typically conducted by decision makers or stakeholders involved in the decision-making process. These individuals are responsible for providing subjective judgments based on their expertise, knowledge, and preferences related to the decision problem. For instance, a questionnaire with 28 questions used to compare eight main criteria to optimise offshore wind farm plant site selection in Northwest Turkey was conducted by experts with different backgrounds, including civil engineers, electrical engineers, biologists, offshore wind project managers, and renewable energy project financers [27]. The highest score in the pairwise comparison equalled 5.2 and was given electricity grid connection against social acceptance (including visual impact and tourism). The criterion with the highest weight of 0.347 was assigned to electricity grid connection, followed by wind speed with the weight of 0.255. A similar approach was used in [28] to rank nine floating wind farm locations in Spain. Five specialists with diverse backgrounds and eight years of experience in floating offshore wind and offshore wind farms were asked to make pairwise comparisons for twenty-three different criteria. From all of the criteria considered, the wind potential and velocity had the highest weights. In addition to employing the traditional Analytic Hierarchy Process (AHP), the Fuzzy Analytic Hierarchy Process and Monte Carlo Simulation Analytic Hierarchy were also used in the study. All of these methods consistently ranked the top three locations. Many authors decide to score the criteria by themselves. For instance, in the assessment of the potential of offshore wind energy in Taiwan [29], the author evaluated the geology and topography as being five times more important than weather and marine meteorology, about two times more important than locations and the proposed area, and about seven times more important than human behaviour and ecological protection.
The GIS-MCDM has been applied in Poland for onshore wind energy. The optimal locations to build onshore wind turbines have been identified according to the following criteria: (i) protected nature areas, (ii) protected monuments of nature, (iii) distance from urban area, (iv) distance from power grid, (v) distance from roads, (vii) distance from the forest, (viii) distance from the water network, (ix) slope, (x) roughness class, (xi) mean wind speed, and (xii) power density of air [30]. In this paper, the factors that determine offshore wind farm location were analysed and incorporated into a multi-criteria model developed with the use of QGIS software. The abilities of the model were then demonstrated for the area covering part of the Baltic Sea, namely, the Exclusive Economic Zone of Poland. As a result of the investigation, the optimal sites for offshore wind farm development were proposed. Moreover, this study helped to answer the following research questions:
- What are the key aspects that should be considered while deciding on an offshore wind farm location?
- Which spatial data sets are crucial to determine optimal offshore wind farm locations using QGIS software?
- What are the suitable sites for offshore wind farm development in the Polish part of the Baltic Sea other than those proposed in the Act [31]?
- What is the technical potential of offshore wind in the Polish part of the Baltic Sea?
The novelty of this paper lies in the fact that for the first time, the technical potential of offshore wind in the Polish part of the Baltic Sea was estimated using the GIS-based approach described in the paper. In this process, a unique set of constraints was considered. This potential was estimated for two different placement configurations of individual wind turbines. An original set of assumptions was used in the Analytic Hierarchy Process in order to depict the most favourable locations for offshore wind investments. Determinants with the greatest influence on the choice of location were identified. The prosed methodology was validated based on real investment plans. This study provides new insights on the development of offshore wind farms in the Polish part of the Baltic Sea.
2. Optimisation of Offshore Wind Farm Locations
The implementation of different locational restrictions for offshore wind farms depends primarily on the specifics of the area. The constraints for the Chinese coast are not necessarily the same as those for the UK. For example, ref. [27] indicates the need to maintain a distance from seismic fault lines, which is specific to the Turkish coast and will not apply to the North Sea. Nevertheless, some restrictions apply to the majority of areas predisposed to offshore wind energy like wind energy potential or water depth. For the purpose of optimisation, the restrictions should be identified and then formulated as constraints. The following step would be to assign the possible and/or required outcome. For example, the wind speed should be maximised, while conservation areas and bird migratory routes should be excluded [27]. The constraints could be divided into three types of limitation factors: technical, regulatory, and economical [32]. Similarly, Kim et al. classified the criteria for offshore wind farm site selection using four categories: energy resources and profitability, conservation area and view protection, human activities, marine environment, and marine ecology [24].
2.1. Energy Resources and Profitability
Among the constraints that could be assigned to the category of energy resources and profitability are aspects regarding wind energy potential and water depth. In general, wind energy potential is considered a determining factor, and its value should be maximised [27]. The minimum wind speed that is perceived as suitable for offshore energy use is around 6.5 m/s at a height of 100 m [27]. Another way in which the wind potential can be determined is by calculating the wind power density. An annual power density of approximately 200 W/m2 is accepted as a suitable value [24]. The water depth constraint determines the possibility for the development of fixed or floating technology. There is no universal foundation type, and various technologies are applied depending on the water depth as well as the consistency of the seabed. In shallow waters (below 30 m), monopile foundations are most commonly used, and where the sea is deeper (30–60 m), jacket foundations are usually applied. Floating technology is promising for deep waters above 60 m [23]. The constraint of the water depth might be formulated as less or equal to 100 m with the objective of minimising the value [27]. Another constraint is the distance to the coast, which determines the costs of cabling and the transportation of the turbines, substations, and other necessary equipment. Additionally, the offshore and onshore grid infrastructure should be considered; cables that already exist reduce the cost significantly. The same applies to the existing onshore power substations’ infrastructures.
2.2. Conservation Area and View Protection
Another group of constraints covers conservation areas and view protection. An example of such restriction would be seabird conservation areas, as wind turbines pose a threat to birds flying nearby. Despite the use of safeguards in the form of motion detectors, sensors, acoustic signals, etc., the problem has not yet been fully eliminated. For this reason, offshore wind farms are usually not located in protected bird habitat areas, and a buffer of 3–5 km is suggested [25]. Another example of a constraint is the natural environment conservation area. Areas which were established to protect plant and animal species, such as Natura 2000, usually cannot be used for other purposes, including OWFs. For example, ref. [26] introduces the following buffers: 1 km for a near-shore scenario and 2 km for a far-shore scenario. Other protected areas are taken into account as well [24,26,27]. Additionally, coastal landscapes should be considered. Revised papers offer a buffer from the land to protect the marine view of 2 km [24] or even 8–16 km [25]. The distance from various types of conservation areas should therefore be maximised.
2.3. Human Activities
Human activities other than offshore wind farms include fishing areas, harbour developments, shipping routes, anchorages, shipwrecks, submarine cables and pipelines, oil and gas infrastructure, existing wind farms, military units, and marine leisure activities [23,24,25,26,27]. In this category, as a rule, buffers are proposed. For example, for anchorages and fishing areas, ref. [26] proposes a 1–2 km buffer, while [27] suggests a 1 km buffer from shipwrecks and offshore petroleum and natural gas wells and at least a 750 m buffer from subsea communication cables and subsea pipelines. The distance maintained from densely used shipping routes should be at least 1 km according to [27]. The buffer is applied in order to decrease the risk of a collision with the infrastructure.
2.4. Marine Environment and Marine Ecology
Last but not least, there are constraints in the category of marine environment and marine ecology. In the study presented in [24], the marine water quality was analysed and excluded areas with first-grade dissolved oxygen (7.5 mg/L). Similarly, the areas with increased activity of marine benthos and marine mammals were disregarded. As it has been mentioned, offshore wind farms have an influence on birds. OWFs can affect birds in terms of collision risk, short-term and long-term habitat loss, barriers to movement, and the disconnection of ecological units [33]. To prevent and reduce the damages, numerous papers exclude and/or apply a buffer from birds’ migratory routes [24,25,27].
3. Methodology
3.1. Proposed Framework
This study concerns the Polish part of the Baltic Sea, more specifically the Exclusive Economic Zone of Poland. The area under analysis is presented in Figure 1. In order to find optimal locations for offshore wind farms, a model in QGIS was developed. Before developing the model, solutions proposed in articles and publications were reviewed. This led to a preliminary selection of location factors on which the feasibility of siting offshore wind farms depends. Then, the availability of source data was verified, and in this way, the final constraints were selected. The data were obtained from different sources and in vector or raster format. The individual layers containing the constraints were imported into QGIS software, and their properties were adjusted. To receive the final layers, tools like buffer, cut, aggregate, and others were used. At the same time, the importance of each constraint was assessed, and the pairwise matrix was created using the Analytic Hierarchy Process (AHP). As a result, weights were assigned to each constraint. In QGIS software, data from all layers were then aggregated into one grid layer of a 1 km × 1 km spatial resolution. Similarly, areas where offshore wind farms cannot be located were rejected, and the excluded areas were combined. The sites with the best properties were selected to show the wind farm location suitability.
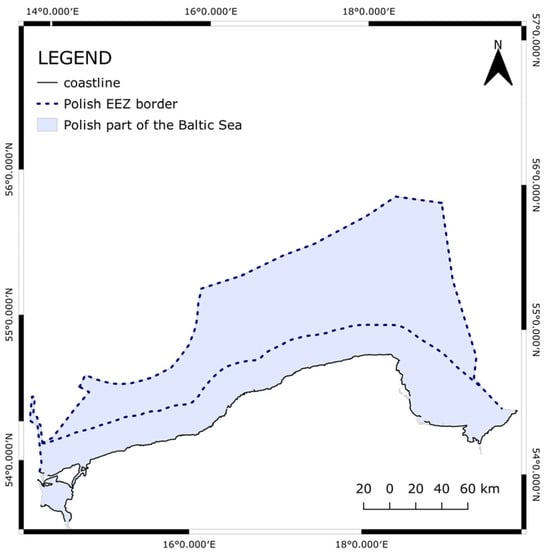
Figure 1.
Area under investigation—EEZ of Poland.
3.2. Criteria Selection
The literature mentions different criteria that can help with the site assessment process. Four categories could be applied regarding all of the constraints: energy resources and profitability, conservation area and view protection, human activities, and marine environment and marine ecology. Various sources provide data that could be later processed using QGIS software. For the constraints described below, the data were obtained from [34,35,36]. However, not all of the data were stored in vector format, which is more suitable for the analysis. Some layers were available only in raster format and in low quality. For that reason, the values could not be very precise. Moreover, not all of the data could be collected. For example, data about bird migratory routes or some of the human activities like military units or anchorages are not considered in the study. Table 1 contains the final nine constraints assigned to four categories and the source of raw data implemented in QGIS software.

Table 1.
Proposed criteria with sources.
3.3. Analytic Hierarchy Process
In order to assess the offshore wind potential, it is crucial to recognise the location constraints. Later, one should group the criteria and assign importance to each one. To address the matter, the Analytic Hierarchy Process could be applied. The AHP is a tool developed by Saaty to investigate complex problems. The AHP is an example of a multi-criteria decision-making method (MCDM) and aims to assign priority using relative weights of criteria that influence a complex decision [37,38]. Additionally, the AHP is one of the most commonly used methods to analyse the current state of the technology. Other examples of tools include the technology readiness level, S-curve analysis, and key technologies. The main purpose of the AHP is to reduce the uncertainty of the data accuracy and to facilitate the selection process. Typically, the methodology involves two steps: (1) a hierarchical structure development of the decision-making process and (2) the criteria and options evaluation within the hierarchical structure. To compare the elements on each level of the hierarchical model, the pairs are considered using a relative scale from 1 to 9. As a result, the importance rating among all elements is determined [39].
Among the advantages of the AHP method are the following:
- Provides a straightforward solution;
- Can be applied in computer software;
- Can address a wide range of complex decision problems;
- Ability to assess consistency while using the method [27,40].
In this study, the first step while performing the analysis using the AHP was to develop the hierarchical structure, taking into account the main goal of the process, then the criteria (constraints) and alternatives. Optimal locations for offshore wind farm development recognition were formulated as the main goal. Nine criteria were selected and analysed, eight of which were used in the AHP [40]. The latter step was to determine the relative importance of the different criteria while considering the main goal. Criteria weights were calculated using the data and equations described in Appendix A. Table 2 presented below summarises the results. The criteria weights were in the range of 0.030–0.349 and ranked from 1 to 8. Wind velocity was revealed as the most significant criterion in the study, and then distance from the coastline and water depth. In addition, communication with the onshore station or the harbour is affected by the distance from the coastline. The depth, as well as the type of seabed, influences the choice of foundation technology for wind turbines (monopile, jacket, gravity base, or floating). Fishing areas emerged to be the least important criterion due to lack of reliable data.
Table 2.
AHP calculation results—criteria weights.
3.4. Criteria Classification
For wind energy potential, the input layer was in a raster format, and it presented the data for the whole Baltic Sea region. First, it was clipped to fit the EEZ borders, and then the map was created. As it was mentioned, usually areas with a mean value of 6.5 m/s or more are considered suitable for offshore wind development. The whole area of the EEZ has a wind velocity of 8.85 m/s or more, as shown in Figure 2. The most promising areas with the highest values of wind speed are in the north of the Polish EEZ. The lowest value was 8.85 m/s, and as a result, no area was excluded from the study according to the wind velocity constraint. Nevertheless, the three ranges which correspond to suitability were proposed. For marginally suitable areas, the assigned value was 1, and for highly suitable areas, the assigned value was 3.
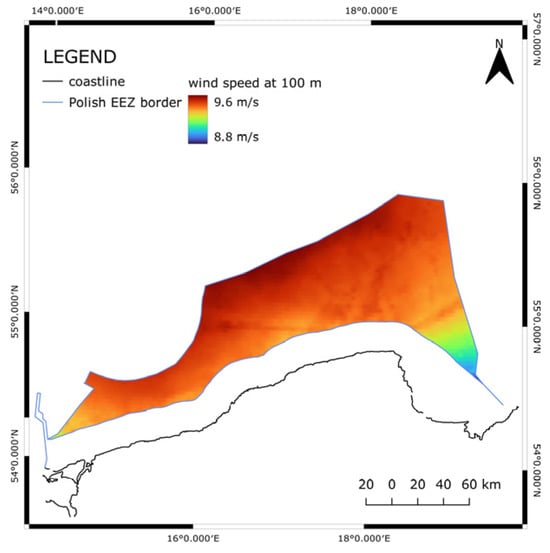
Figure 2.
Wind velocity distribution map.
Similarly, for water depth, the obtained data were in raster format, and first, it was necessary to convert the data into vector format. As a continuance, the layer was clipped to fit the EEZ borders. The water depth in the EEZ is within the range of 0–121 m. For offshore wind development, the appropriate value would be 100 m or less. Moreover, for fixed foundations, the maximal depth should be around 60 m, and for depths of 60–100 m, floating foundations would be preferred. Areas where the water depth is more than 100 m were excluded. Figure 3 shows the seabed characteristics.
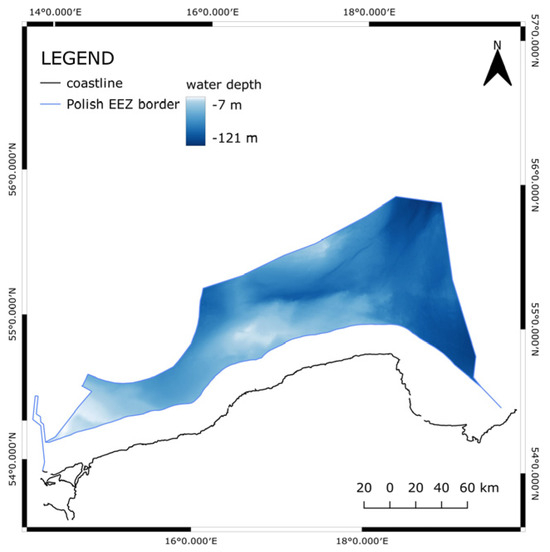
Figure 3.
Water depth distribution map.
In the EEZ, there are two types of nature conservation areas protected under Natura 2000: conservation under the Bird Directive and conservation under the Habitats Directive. Three areas were identified; however, two of them cover the same area. The names of the protected sites are Obszar specjalnej ochrony siedlisk “Ostoja na Zatoce Pomorskiej”, Obszar specjalnej ochrony ptaków “Zatoka Pomorska”, and Obszar specjalnej ochrony ptaków “Ławica Słupska”. For the mentioned areas, the data were stored in a vector format (polygon). It was necessary to clip the areas to fit the EEZ area. As a continuance, a buffer of 5 km was applied. The protected area as well as the 5 km buffer were excluded for offshore wind farm development. Taking into account the constraint regarding conservation areas, the area was divided into four ranges, and for each one, a value was assigned. Figure 4 presents the mentioned approach.
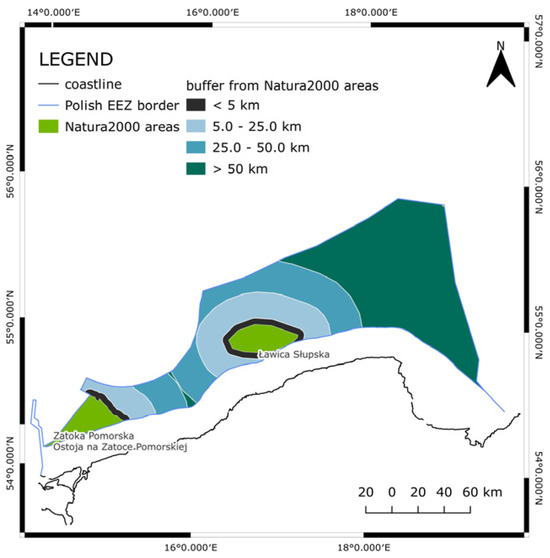
Figure 4.
Map of distance from nature conservation areas (Natura 2000).
For submarine cables and gas pipelines, a buffer of 1 km was applied. Only existing cables and gas pipelines were taken into account. Figure 5 presents (from the left) the Baltic Pipe (gas pipeline), the high voltage cable (450 kV) connecting Sweden and Poland, gas pipelines DN200 and DN250, and gas pipeline DN100.
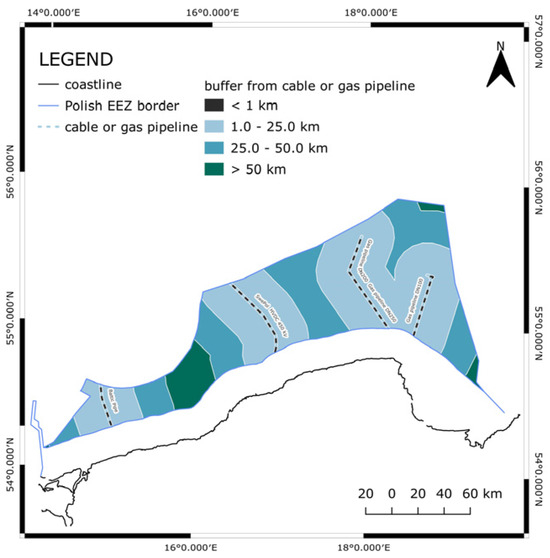
Figure 5.
Map of distance from submarine cables and pipelines.
The data about the most commonly used shipping routes were downloaded in a low-quality raster format. For that reason, the data were transformed into a vector layer. However, the precision of the presented shipping routes is not high, and therefore should not be considered a crucial constraint. No area was excluded due to the lack of reliable data. For typical shipping routes, a line was drawn in the middle, and then a buffer of 5 km was applied. However, these sites received marginally suitable ranks, and were thus not excluded. Figure 6 presents the shipping routes as well as the applied buffers.
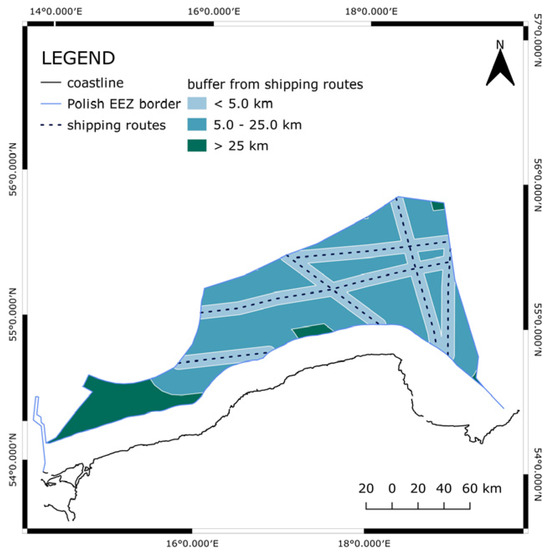
Figure 6.
Map of distance from shipping routes.
For fishing areas, the data considering the most frequently used sites were downloaded in raster format. The conversion to vector format was possible with the use of a tool in QGIS software. The areas were divided into three ranges that describe the fishing intensity: high, moderate, and low. Due to the uncertainty, no site was excluded. Figure 7 shows the map of fishing intensity.
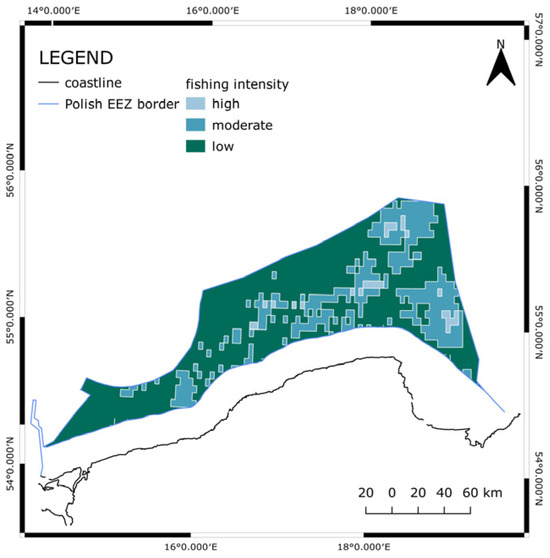
Figure 7.
Fishing intensity map.
The data about shipwrecks were obtained in a vector format, or more specifically, in points. First, the points that laid inside the EEZ area were selected. Then, a buffer of 1 km was applied in order to find the excluded sites. Figure 8 presents the EEZ area with shipwreck locations. Additionally, a detailed frame that shows the applied buffer is provided.
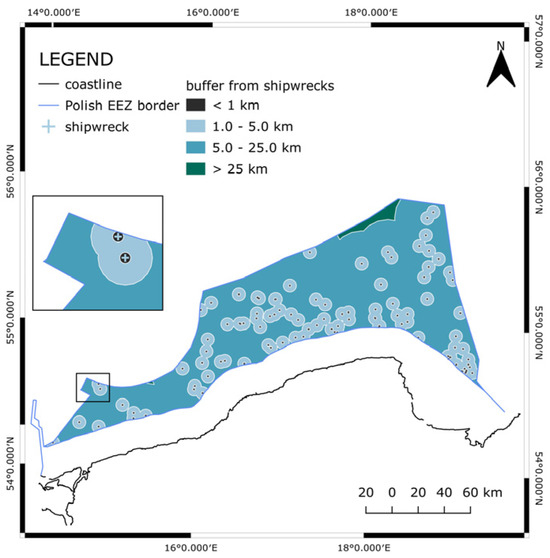
Figure 8.
Map of distance from shipwrecks.
Distances from the coast were determined using the buffer tool. Areas close to the land were considered to be the most optimal. Figure 9 shows the distribution of distances.
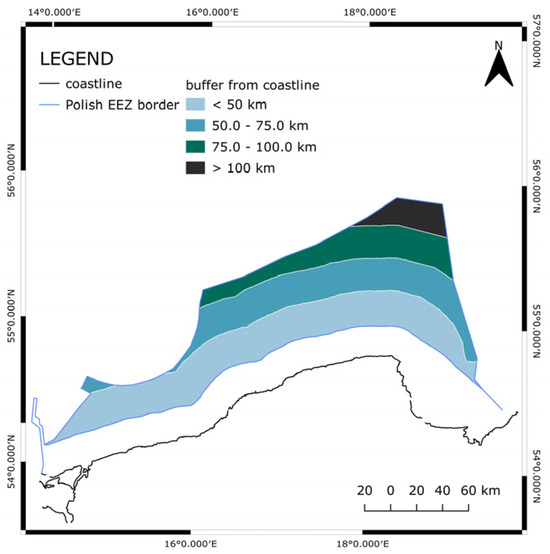
Figure 9.
Map of distance from coastline.
3.5. Assumptions
To estimate the offshore wind energy potential for the Polish EEZ, certain assumptions have to be made. As a result of the mapping and calculations performed in QGIS, it was possible to obtain an optimal area for the location of offshore wind farms. Two important assumptions had to be made for the evaluation of the power generation potential, i.e., the electrical capacity of a single turbine and the spatial distribution of the turbines. The use of turbines with a nominal capacity of 15 MW, manufactured by Vestas, was assumed [3]. Similar components are planned to be used for the Baltic Power offshore wind farm in the Polish part of the Baltic Sea. In addition, it was proposed to lay the turbines 2 km apart from each other to minimise the risk of the wake effect. The literature recommends a distance between 10 and 15 D, where D is the rotor diameter [41,42,43].
4. Results
4.1. Excluded Areas
In this study, the Exclusive Economic Zone of Poland is considered. However, not the whole area (approx. 22,500 km2) is suitable for offshore wind development. Numerous constraints restrict the area. During the preliminary analysis, it was determined which criteria are related to the exclusion of sites. These areas were then mapped in the QGIS software according to the proposed methodology. Water depth areas with depths of 100 m or more were excluded due to the lack of appropriate foundation technology. The development of nature conservation areas protected under the Natura 2000 programme is prohibited. Additionally, a 5 km buffer from these areas was not considered. Submarine cables, gas pipelines, shipwrecks’ locations, and a 1 km buffer zone around them have all been excluded from consideration. Since the data about shipping routes and fishing areas were not highly reliable, no sites were removed for further study in relation to these constraints. Nevertheless, distance from the coast should not exceed 100 km, and further areas were excluded from the study. Areas in proximity to the shore have not been disregarded, as only the EEZ is taken into account. Moreover, there are areas not considered in the study due to there being more than one constraint. The total value of the excluded area equals 5 018.852 km2, which is 22.3% of the EEZ of Poland (Figure 10).
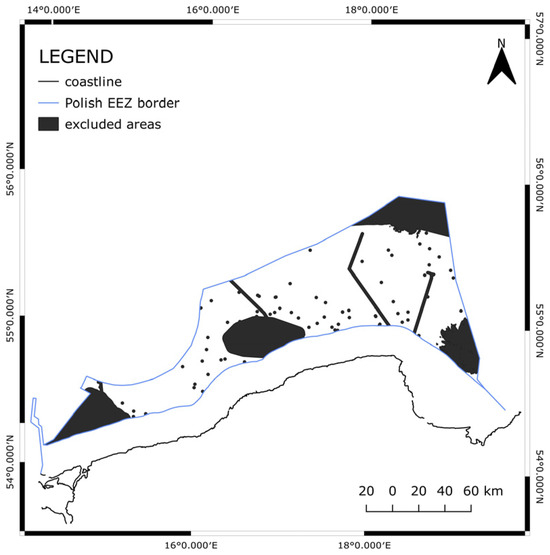
Figure 10.
Excluded areas.
4.2. Suitable Areas
A spatial resolution of 1 km × 1 km was applied over the domain covering the EEZ to map the detailed results. After the summation of all layers’ values and weights obtained from the AHP process, the final values were obtained. The results were in a range from 1.494 to 2.801 (Table 3). The authors decided to divide the results into three groups, namely, marginally, moderately, and highly suitable. The sites that were deemed marginally suitable covered an area of 2178.97 km2, which is equal to 10.26% of the total EEZ area. The moderately suitable sites covered an area of 10,312.76 km2 and a share of 48.56%. Moreover, the highly suitable sites covered an area of 3726.90 km2 and a share of 17.55%. The total area predisposed for OWF development was 16,218.67 km2. As mentioned, the minimal value observed was 1.494, and the maximal value was 2.801. The mean value was 2.272, and the median was 2.217. The standard deviation was 0.227. The areas suitable for OWF development are distributed as shown in the map (Figure 11). Areas that are highly suitable are in the south of the EEZ.
Table 3.
Suitable areas.
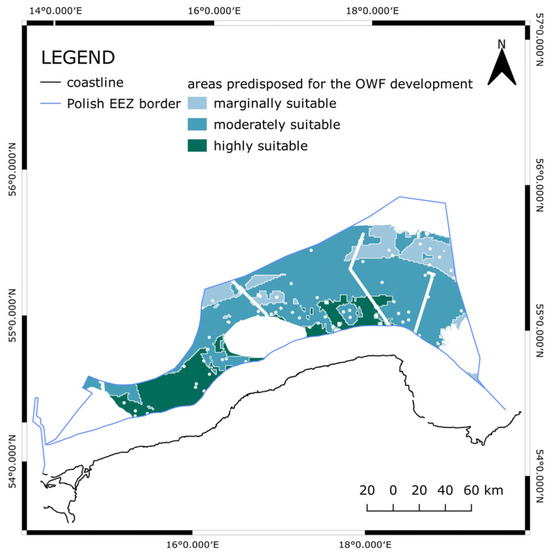
Figure 11.
Areas suitable for OWF development.
4.3. Offshore Wind Potential of the EEZ of Poland
To assess the offshore wind potential of the Polish part of the Baltic Sea, two different spatial configurations for the deployment of individual wind turbines were considered.
In the first one, wind turbines with a nominal capacity of 15 MW were laid out 2 km apart from each other only in the suitable areas of the EEZ. The dots presented in Figure 12 depict the locations of the turbines with such a layout. In total, such an area can accommodate 3664 turbines with an overall electrical capacity equal to 54.96 GW. The technical potential only in highly suitable areas is equal to 15.24 GW. The technical potential in highly and moderately suitable areas in which 3 307 turbines could be placed is equal to 49.6 GW.
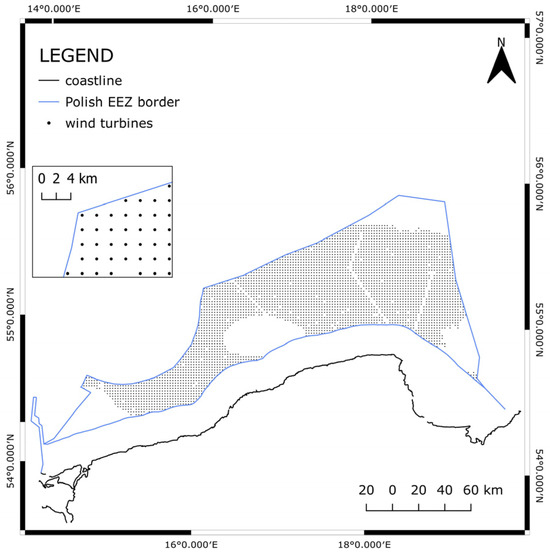
Figure 12.
Wind turbine locations according to first spatial configuration.
In the second spatial configuration, wind turbines of the same size were laid out 2.5 km apart from each other in the suitable areas of the EEZ. The dots presented in Figure 13 depict the locations of the turbines with such a layout. In total, such an area can accommodate 2 347 turbines with an overall electrical capacity equal to 35.2 GW. The technical potential only in highly suitable areas is equal to 9.15 GW. The technical potential in highly and moderately suitable areas, in which 2119 turbines could be placed, is equal to 31.78 GW.
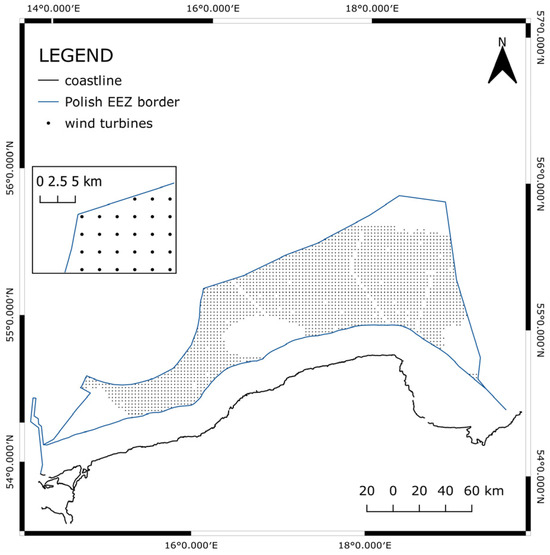
Figure 13.
Wind turbine locations according to second spatial configuration.
4.4. Validation of the Results against Real Investment Plans
The most advanced investment projects in offshore wind farms in the EEZ are listed in Table 4. All of them obtained the location permit, and some of them also received an environmental decision, a grid connection agreement, or other required permits. Examples of highly developed projects are Baltic Power, Baltica I, Baltica II, Baltica III, BC-WIND, F.E.W. Baltic II, MFW Bałtyk I, MFW Bałtyk II, and MFW Bałtyk III. Less advanced ones include five areas granted to the PGE Group, and another five locations awarded to the Orlen Group [44,45,46,47,48,49,50,51,52].
Table 4.
Currently developed offshore wind projects in Poland [45,46,47,48,49,50,51,52].
As shown in Figure 14, the outlines of planned investments overlap with the highly suitable areas for OWF development indicated in this study.
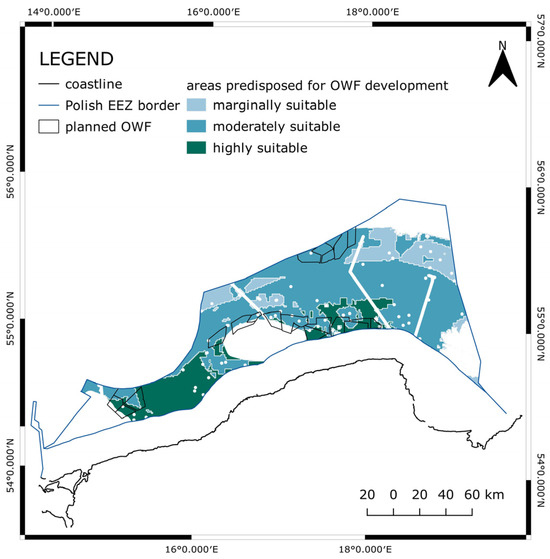
Figure 14.
Outlines of planned investments.
5. Summary and Conclusions
The offshore wind energy market is one of the fastest growing markets, especially in Europe. Offshore wind farms, compared to other weather-dependent RESs, are characterised by stable electricity generation and a high capacity factor, and therefore, they can play a very important role in the energy transition of Poland’s coal-based power sector. In order to plan the expansion of the energy infrastructure, and to correctly formulate energy policy targets, it is necessary to identify the available technical potential for offshore wind farms (OWFs). This was the main aim of this study.
Site selection for the development of an OWF project is complex and needs to take into consideration numerous constraints. This paper proposes a GIS-based methodology in which a unique set of constraint-related criteria was employed to select the bests sites. These criteria included wind velocity, water depth, distance from nature conservation areas, distance from submarine cables and gas pipelines, distance from shipping routes, distance from fishing areas, distance from shipwrecks, and distance from the coastline. Some of the geospatial data were downloaded in raster format, and it was necessary to convert the data into vector format. Impact maps with distances were created for each constraint.
In the Analytic Hierarchy Process, at first, each criterion was given a score. Then, the rating matrix was formed, containing the weights from their pairwise comparisons. Finally, the weights were ranked (the minimal value was 1.494, and the maximal 2.801) and divided into three groups, namely, marginally, moderately, and highly suitable. The total area predisposed for OWF development was 16,218.67 km2. The sites deemed marginally suitable covered an area of 2178.97 km2, which is equal to 10.26% of the total EEZ area. tThe moderately suitable sites comprised an area of 10,312.76 km2 and a share of 48.56%. Moreover, the highly suitable sites comprised an area of 3726.90 km2 with a share of 17.55%. The three most significant criteria in the study were wind velocity, distance from the coastline, and water depth. The results were presented in the form of maps over the domain covering a spatial resolution of 1 km × 1 km. Two different spatial configurations for the deployment of individual wind turbines were considered to assess the offshore wind potential, in which wind turbines with a nominal capacity of 15 MW were laid out (i) 2 km and (ii) 2.5 km apart from each other, respectively. The first configuration could accommodate 3664 turbines with an overall electrical capacity equal to 54.96 GW, whereas the second one could accommodate 2347 turbines with an overall electrical capacity equal to 35.2 GW. The technical potential values only in highly suitable areas are equal to 15.24 GW and 9.15 GW, respectively. If this area is extended to also include the moderately suitable parts, the corresponding values are ca. 50 GW and 31 GW, respectively. Therefore, the results indicate that the electrical capacity that can be installed in offshore wind farms in the Polish EEZ is significant and should be taken into account when designing the future electricity generation mix. The most optimal conditions for offshore wind farms are in the south of the EEZ of Poland due to the proximity to the coast, relatively shallow waters, and appropriate wind conditions. On the other hand, the marginally suitable areas for OWFs are located in the north of the EEZ of Poland, further from the coast, where the sea is deeper. The methodology presented in this paper could be easily applied to estimate the technical potential and select the best sites for OWFs in other locations.
One limitation of the proposed approach is that the technical potential of offshore wind power was estimated only for two deployment configurations of wind turbines. In a future study, other placement configurations that maximise the electrical output will be analysed, and their impact on the overall potential will be assessed. Another limitation is that the fishing area was the least important criterion due to the lack of reliable data. This drawback can be overcome once reliable data become available. This study focused on assessing the technical potential from the perspective of the electrical capacity that can be installed in the EEZ. With information on electrical capacity, a future study will focus more on assessing the possible production of electricity from offshore wind turbines.
As mentioned earlier, the addressed topic is significant as offshore wind farms can play a very important role in replacing coal and lignite power plants in Poland’s energy mix, thus helping the country achieve its decarbonisation goals. The broader implications of the research results are that they can be used as inputs in planning the expansion and operation of the Polish power system with the use of system models, particularly in studies on the decommissioning of coal-fired power plants and the integration of large amounts of offshore wind power in the Polish power system.
Author Contributions
Conceptualisation, M.P. (Magdalena Przewoźniak), A.W. and J.Z.; methodology, M.P. (Magdalena Przewoźniak) and A.W.; software, M.P. (Magdalena Przewoźniak) and M.R.; validation, M.P. (Magdalena Przewoźniak); formal analysis, M.P. (Magdalena Przewoźniak); investigation, M.P. (Magdalena Przewoźniak) and A.W.; resources, M.P. (Magdalena Przewoźniak); data curation, M.P. (Magdalena Przewoźniak) and M.R.; writing—original draft preparation, M.P. (Magdalena Przewoźniak) and A.W.; writing—review and editing, M.P. (Magdalena Przewoźniak) and A.W.; visualisation, M.P. (Magdalena Przewoźniak) and M.P. (Marcin Pluta); supervision, A.W.; project administration, A.W.; funding acquisition, A.W. All authors have read and agreed to the published version of the manuscript.
Funding
This research was funded by the AGH University of Krakow, Faculty of Energy and Fuels (grant number 16.16.210.476) with the financial support of the “Excellence Initiative—Research University” program.
Data Availability Statement
Data are contained within the article.
Conflicts of Interest
The authors declare no conflicts of interest.
Appendix A
In the first step of the AHP, a hierarchical model of the problem is built, and the individual decision elements are compared using a relative scale from 1 to 9, as presented in Table A1.
Table A1.
Scale of relative importance [27].
Table A1.
Scale of relative importance [27].
| Importance | Definition | Explanation |
|---|---|---|
| 1 | Equal importance | Two sub-objectives contribute equally to the objective |
| 3 | Weak importance of one over the other | Experience and judgement slightly favour one over another |
| 5 | Essential or strong importance | Experience and judgement strongly favour one over another |
| 7 | Demonstrated importance | A sub-objective is strongly favoured, and its dominance is demonstrated in practice |
| 9 | Absolute importance | The evidence favouring one sub-objective or another is of the highest possible order of affirmation |
| 2, 4, 6, 8 | Intermediate values | A compromise is needed |
Eight criteria were used in the AHP, i.e., wind velocity, water depth, distance from nature conservation areas, distance from submarine cables and gas pipelines, distance from shipping routes, distance from fishing areas, distance from shipwrecks, and distance from the coastline. The criteria were compared in pairs with the respect to the objective, using the scale presented in Table A1. The compared elements created a rating matrix A with dimensions of 8 × 8 (Table A2). For instance, in Table A2, number 7 means that the criterion of wind velocity is 7 times more important than criterion of distance from shipwrecks.
In matrix A, the elements are pairwise consistent (Equation (A1)).
This means that the value 1/7 is a result of the comparison of the following two criteria: the distance from shipwrecks and the wind velocity.
Table A2.
Matrix A of pairwise comparison.
Table A2.
Matrix A of pairwise comparison.
| Criteria | 1 | 2 | 3 | 4 | 5 | 6 | 7 | 8 | |
|---|---|---|---|---|---|---|---|---|---|
| Wind Velocity | Water Depth | Distance from Nature Conservation Areas (Natura 2000) | Distance from Submarine Cables and Gas Pipelines | Distance from Shipping Routes | Fishing Areas | Distance from Shipwrecks | Distance from Coastline | ||
| 1 | wind velocity | 1 | 3 | 5 | 7 | 7 | 5 | 7 | 4 |
| 2 | water depth | 0.33 | 1 | 4 | 5 | 5 | 4 | 5 | 0.33 |
| 3 | distance from nature conservation areas (Natura 2000) | 0.20 | 0.25 | 1 | 3 | 3 | 4 | 3 | 0.25 |
| 4 | distance from submarine cables and gas pipelines | 0.14 | 0.20 | 0.33 | 1 | 2 | 3 | 2 | 0.20 |
| 5 | distance from shipping routes | 0.14 | 0.20 | 0.33 | 0.50 | 1 | 2 | 0.33 | 0.17 |
| 6 | fishing areas | 0.20 | 0.25 | 0.25 | 0.33 | 0.50 | 1 | 0.33 | 0.17 |
| 7 | distance from shipwrecks | 0.14 | 0.20 | 0.33 | 0.50 | 3 | 3 | 1 | 0.20 |
| 8 | distance from coastline | 0.25 | 3 | 4 | 5 | 6 | 6 | 5 | 1 |
Next, the matrix of normalised preference values was created, in which the elements were calculated according to Equation (A2):
Then, the criteria weights, which represent the relative importance of the chosen criteria, were calculated as the arithmetic mean value for each row of the normalised matrix according to Equation (A3):
where n refers to number of criteria (i.e., n = 8).
The consistency of the comparison matrix should be verified. The characteristic value, λmax, was calculated as the arithmetic mean value of the weighted sum and criteria weights ratio divided by the number of elements n according to Equation (A4).
The calculated value of λmax equalled 8.866. Then, the consistency index (CI) was calculated according to Equation (A5) and equalled 0.124.
The consistency coefficient CR took into account the previously calculated CI value and a random index (RI) (Equation (A6)). The values of the RI depend on the number of considered elements; in this case, RI = 1.41 [37].
As a result, the CR was equal to 8.8%, which corresponds with the theory (CR ≤ 10%).
References
- ‘Fit for 55’: Delivering the EU’s 2030 Climate Target on the Way to Climate Neutrality. Communication from the Commission to the European Parliament, the Council, the European Economic and Social Committee and the Committee of the Regions; European Commission: Brussels, Belgium, 2021; Available online: https://eur-lex.europa.eu/legal-content/EN/TXT/?uri=CELEX%3A52021DC0550 (accessed on 1 May 2023).
- Esteban, M.D.; Diez, J.J.; López, J.S.; Negro, V. Why Offshore Wind Energy? Renew. Energy 2011, 36, 444–450. [Google Scholar] [CrossRef]
- V236-15.0 MWTM at a Glance. Available online: https://www.vestas.com/en/products/offshore/V236-15MW (accessed on 1 May 2023).
- Ramírez, L. Offshore Wind Energy 2022 Statistics; WindEurope: Brussels, Belgium, 2023. [Google Scholar]
- Ramírez, L.; Brindley, G. Offshore Wind Energy 2021 Statistics; WindEurope: Brussels, Belgium, 2022. [Google Scholar]
- Cecchinato, M. Boosting Offshore Wind Energy in the Baltic Sea; WindEurope: Brussels, Belgium, 2019. [Google Scholar]
- Pluta, M.; Wyrwa, A.; Suwała, W.; Zyśk, J.; Raczyński, M.; Tokarski, S. A Generalized Unit Commitment and Economic Dispatch Approach for Analysing the Polish Power System under High Renewable Penetration. Energies 2020, 13, 1952. [Google Scholar] [CrossRef]
- European Union Study On Baltic Offshore Wind Energy Cooperation Under BEMIP; Final Report ENER/C1/2018-456; European Union: Brussels, Belgium, 2019; Available online: https://op.europa.eu/en/publication-detail/-/publication/9590cdee-cd30-11e9-992f-01aa75ed71a1 (accessed on 1 May 2023).
- Olczak, P.; Surma, T. Energy Productivity Potential of Offshore Wind in Poland and Cooperation with Onshore Wind Farm. Appl. Sci. 2013, 13, 4258. [Google Scholar] [CrossRef]
- Ziemba, P. Multi-Criteria Fuzzy Evaluation of the Planned Offshore Wind Farm Investments in Poland. Energies 2021, 14, 978. [Google Scholar] [CrossRef]
- Ziemba, P. Uncertain Multi-Criteria Analysis of Offshore Wind Farms Projects Investments—Case Study of the Polish Economic Zone of the Baltic Sea. Appl. Energy 2022, 309, 118232. [Google Scholar] [CrossRef]
- Pronińska, K.; Księżopolski, K. Baltic Offshore Wind Energy Development—Poland’s Public Policy Tools Analysis and the Geostrategic Implications. Energies 2021, 14, 4883. [Google Scholar] [CrossRef]
- Offshore Wind Technical Potential|Analysis and Maps. Available online: https://www.esmap.org/esmap_offshorewind_techpotential_analysis_maps (accessed on 1 May 2023).
- Polityka Energetyczna Polski Do 2040 r.; Ministerstwo Klimatu i Środowiska: Warsaw, Poland, 2021. Available online: https://www.gov.pl/web/klimat/polityka-energetyczna-polski (accessed on 1 May 2023).
- Pogorzelski, K.; Mitraszewski, K.; Matczak, M.; Pardus, J.; Szydłowski, Ł.; Zaucha, J.; Jensen, J.F.; Brezgin, M.; Scheffler, R.; Foy, M.; et al. KP Consulting, Instytut Morski Uniwersytetu Morskiego w Gdyni, Ramboll, DWF Potencjał Morskiej Energetyki Wiatrowej w Polsce; PSEW: Szczecin, Poland, 2022; Available online: https://konferencja-offshore.pl/wp-content/uploads/2022/11/FarmyMorskie_RaportShort_Prev.pdf (accessed on 1 May 2023).
- The Future of Offshore Wind in Poland; Polish Wind Energy Association: Warsaw, Poland, 2019; Available online: http://psew.pl/en/wp-content/uploads/sites/2/2019/09/The-future-of-offshore-wind-in-Poland-PWEA-Report.pdf (accessed on 1 May 2023).
- Michaelides, E.E. Alternative Energy Sources; Green Energy and Technology; Springer: Berlin/Heidelberg, Germany, 2012; ISBN 978-3-642-20950-5. [Google Scholar]
- Quaschning, V. Understanding Renewable Energy Systems; Earthscan: London, UK; Sterling, VA, USA, 2005; ISBN 978-1-84407-128-9. [Google Scholar]
- Kalyan, V.; Xiang, Y.; O’Reill, U. Statistical Approaches for Wind Resource Assessment. In Computational Intelligent Data Analysis for Sustainable Development; Chapman and Hall/CRC: New York, NY, USA, 2013. [Google Scholar]
- Anjum, L. Wind Resource Estimation Techniques-An Overview. Int. J. Wind Renew. Energy 2014, 3, 26–38. [Google Scholar]
- Mortensen, N.G. Wind Resource Assessment Using the WAsP Software; E No. 174; DTU Wind Energy: Roskilde, Denmark, 2018. [Google Scholar]
- Murthy, K.S.R.; Rahi, O.P. A comprehensive review of wind resource assessment. Renew. Sustain. Energy Rev. 2017, 72, 1320–1342. [Google Scholar] [CrossRef]
- Cavazzi, S.; Dutton, A.G. An Offshore Wind Energy Geographic Information System (OWE-GIS) for Assessment of the UK’s Offshore Wind Energy Potential. Renew. Energy 2016, 87, 212–228. [Google Scholar] [CrossRef]
- Kim, T.; Park, J.-I.; Maeng, J. Offshore Wind Farm Site Selection Study around Jeju Island, South Korea. Renew. Energy 2016, 94, 619–628. [Google Scholar] [CrossRef]
- Hong, L.; Möller, B. Offshore Wind Energy Potential in China: Under Technical, Spatial and Economic Constraints. Energy 2011, 36, 4482–4491. [Google Scholar] [CrossRef]
- Möller, B.; Hong, L.; Lonsing, R.; Hvelplund, F. Evaluation of Offshore Wind Resources by Scale of Development. Energy 2012, 48, 314–322. [Google Scholar] [CrossRef]
- Caceoğlu, E.; Yildiz, H.K.; Oğuz, E.; Huvaj, N.; Guerrero, J.M. Offshore Wind Power Plant Site Selection Using Analytical Hierarchy Process for Northwest Turkey. Ocean Eng. 2022, 252, 111178. [Google Scholar] [CrossRef]
- Díaz, H.; Teixeira, A.P.; Guedes Soares, C. Application of Monte Carlo and Fuzzy Analytic Hierarchy Processes for Ranking Floating Wind Farm Locations. Ocean Eng. 2022, 245, 110453. [Google Scholar] [CrossRef]
- Lee, T.-L. Assessment of the Potential of Offshore Wind Energy in Taiwan Using Fuzzy Analytic Hierarchy Process. TOCIEJ 2010, 4, 96–104. [Google Scholar] [CrossRef][Green Version]
- Amsharuk, A.; Łaska, G. The Approach to Finding Locations for Wind Farms Using GIS and MCDA: Case Study Based on Podlaskie Voivodeship, Poland. Energies 2023, 16, 7107. [Google Scholar] [CrossRef]
- Ustawa z Dnia 17 Grudnia 2020 r. o Promowaniu Wytwarzania Energii Elektrycznej w Morskich Farmach Wiatrowych. 2020. Available online: https://isap.sejm.gov.pl/isap.nsf/DocDetails.xsp?id=WDU20210000234 (accessed on 1 May 2023).
- Chaouachi, A.; Covrig, C.F.; Ardelean, M. Multi-Criteria Selection of Offshore Wind Farms: Case Study for the Baltic States. Energy Policy 2017, 103, 179–192. [Google Scholar] [CrossRef]
- Exo, K.M.; Hüppop, O.; Garthe, S. Birds and Offshore Wind Farms: A Hot Topic in Marine Ecology. Wader Study Group Bull. 2003, 100, 50–53. [Google Scholar]
- Global Wind Atlas. Available online: https://globalwindatlas.info/en/ (accessed on 1 May 2023).
- System Informacji Przestrzennej Administracji Morskiej. Available online: https://sipam.gov.pl/ (accessed on 1 June 2023).
- European Marine Observation and Data Network (EMODnet). Available online: https://emodnet.ec.europa.eu/ (accessed on 1 May 2023).
- Saaty, R.W. The Analytic Hierarchy Process—What It Is and How It Is Used. Math. Model. 1987, 9, 161–176. [Google Scholar] [CrossRef]
- Saaty, T.L.; Kearns, K.P. The Analytic Hierarchy Process. In Analytical Planning; Elsevier: Amsterdam, The Netherlands, 1985; pp. 19–62. ISBN 978-0-08-032599-6. [Google Scholar]
- Halicka, K. Prospektywna Analiza Technologii: Metodologia i Procedury Badawcze; Oficyna Wydawnicza Politechniki Białostockiej: Białystok, Poland, 2016; ISBN 978-83-65596-05-5. [Google Scholar]
- Tatjana, A.; Pachemska; Lapevski, M.; Timovski, R. Analytical Hierarchical Process (AHP) Method Application in the Process of Selection and Evaluation. In Proceedings of the Hierarchical Process (AHP) Method Application in the Process, Gabrovo, Bulgaria, 21–22 November 2014. [Google Scholar]
- Stevens, R.J.A.M.; Hobbs, B.F.; Ramos, A.; Meneveau, C. Combining Economic and Fluid Dynamic Models to Determine the Optimal Spacing in Very Large Wind Farms: Combining Economic and Fluid Dynamic Models to Determine the Optimal Spacing in Very Large Wind Farms. Wind Energy 2017, 20, 465–477. [Google Scholar] [CrossRef]
- Meyers, J.; Meneveau, C. Optimal Turbine Spacing in Fully Developed Wind Farm Boundary Layers: Optimal Turbine Spacing in Wind Farm Boundary Layers. Wind Energy 2012, 15, 305–317. [Google Scholar] [CrossRef]
- Stevens, R.J.A.M.; Gayme, D.F.; Meneveau, C. Effects of Turbine Spacing on the Power Output of Extended Wind-Farms. Wind Energy 2016, 19, 359–370. [Google Scholar] [CrossRef]
- PGE and Orlen Group to Shape Phase II of Polish Offshore. Available online: https://balticwind.eu/pge-and-orlen-group-to-shape-phase-ii-of-polish-offshore/ (accessed on 1 May 2023).
- PGE Baltica Sp. z o.o. Available online: https://pgebaltica.pl/ (accessed on 1 May 2023).
- Baltic Power. Available online: https://www.balticpower.pl/ (accessed on 1 May 2023).
- Baltica 2+3. Available online: https://baltica.energy/en (accessed on 1 May 2023).
- BC-WIND. Available online: https://www.bc-wind.pl/en (accessed on 1 May 2023).
- F.E.W. Baltic II. Available online: https://fewbalticii.rwe.com/en (accessed on 1 May 2023).
- Morska Farma Wiatrowa MFW Bałtyk I. Available online: https://www.mfwbaltyk1.pl/ (accessed on 1 May 2023).
- Virtual Exhibition MFW Bałtyk II. Available online: https://wystawa.baltyk2.pl/en (accessed on 1 May 2023).
- Virtual Exhibition MFW Bałtyk III. Available online: https://wystawa.baltyk3.pl/en/ (accessed on 1 May 2023).


Disclaimer/Publisher’s Note: The statements, opinions and data contained in all publications are solely those of the individual author(s) and contributor(s) and not of MDPI and/or the editor(s). MDPI and/or the editor(s) disclaim responsibility for any injury to people or property resulting from any ideas, methods, instructions or products referred to in the content. |
© 2024 by the authors. Licensee MDPI, Basel, Switzerland. This article is an open access article distributed under the terms and conditions of the Creative Commons Attribution (CC BY) license (https://creativecommons.org/licenses/by/4.0/).