

Calculation of the Potential Biogas and Electricity Values of Animal Wastes: Turkey and Poland Case

 ,
,  ,
,  ,
,  ,
,  ,
,  and
and 
Abstract
:1. Introduction
2. Materials and Methods
2.1. Materials
2.2. Methods
2.2.1. Calculation of the Amount of Wet Fertilizer That Can Be Obtained
- FM: Amount of fresh manure (kg·year−1)
- AN: Animal number
- ADM: Average daily manure production per animal (kg·day−1·animal −1)
2.2.2. Calculation of the Amount of Biogas Energy That Can Be Obtained
- ME: Energy value that can be obtained from methane gas (MJ)
- FM: Amount of fresh manure (kg·year−1)
- SM: Solid matter content (%)
- VDM: Volatile dry matter content (%)
- RM: Raw material-specific methane production rate (m3·CH4·kg−1·VDM−1)
2.2.3. Calculation of Electricity Generation from Biogas Energy
2.2.4. Number of Houses Whose Electricity Needs Are Met
2.2.5. Calculating the Amount of CO2 Emissions That Can Be Avoided with the Biogas Energy That Can Be Obtained
2.2.6. Economic Gain from Electricity
2.2.7. Economic Gain from Fermented Fertilizer
2.2.8. Total Economic Gain
3. Results and Discussion
4. Conclusions
Author Contributions
Funding
Data Availability Statement
Conflicts of Interest
References
- Abdeshahian, P.; Lim, J.S.; Ho, W.S.; Hashim, H.; Lee, C.T. Potential of biogas production from farm animal waste in Malaysia. Renew. Sustain. Energy Rev. 2016, 60, 714–723. [Google Scholar] [CrossRef]
- Hosseini, S.E.; Wahid, M.A. Feasibility study of biogas production and utilization as a source of renewable energy in Malaysia. Renew. Sustain. Energy Rev. 2013, 19, 454–462. [Google Scholar] [CrossRef]
- Çağlayan, G.H. Investigation of Biogas Potential of Cattle and Sheep Waste in Eastern Anatolia Region. Turk. J. Agric. Nat. Sci. 2020, 7, 672–681. [Google Scholar] [CrossRef]
- Yasar, A.; Nazir, S.; Rasheed, R.; Tabinda, A.B.; Nazar, M. Economic review of different designs of biogas plants at household level in Pakistan. Renew. Sustain. Energy Rev. 2017, 74, 221–229. [Google Scholar] [CrossRef]
- Kaya, D.; Çankakılıç, F.; Dikeç, S.; Baban, A.; Güneş, K. Türkiye’de tarımsal atıkların değerlendirilmesi rehberi, LIFE 03 TCY/TR/000061 2005. proje raporu, Tubitak. Available online: https://biyogazder.org/makaleler/mak41.pdf (accessed on 2 October 2023).
- Altıkat, S.; Çelik, A. Biogas Potential from Animal Waste of Iğdır Province. J. Inst. Sci. Technol. 2012, 2, 61–66. Available online: https://dergipark.org.tr/en/pub/jist/issue/7928/104281 (accessed on 5 June 2023).
- Taleghani, G.; Kia, A.S. Technical Economical Analysis of the Saveh Biogas Power Plant. Renew. Energy 2005, 30, 441–446. [Google Scholar] [CrossRef]
- Mao, C.; Feng, Y.; Wang, X.; Ren, G. Review on research achievements of biogas from anaerobic digestion. Renew. Sustain. Energy Rev. 2015, 45, 540–555. [Google Scholar] [CrossRef]
- Artun, O.; Atilgan, A.; Saltuk, B. Determination of the potential biogas energy production amounts and areas in the Tigris Basin using GIS. Infrastrukt. I Ekol. Teren. Wiejskich. 2016, 3, 761–771. [Google Scholar] [CrossRef]
- Kumaş, K.; Temiz, D.; Akyüz, A.; Güngör, A. Biomass to Energy: The Potential of Biogas in Turkey and World. Mesleki Bilim. Derg. 2019, 8, 70–77. Available online: https://dergipark.org.tr/tr/pub/mbd/issue/50202/568785 (accessed on 15 April 2023).
- Atilgan, A.; Krakowiak-Bal, A.; Ertop, H.; Saltuk, B.; Malinowski, M. The Energy Potential of Waste from Banana Production: A Case Study of the Mediterranean Region. Energies 2023, 16, 5244. [Google Scholar] [CrossRef]
- Saltuk, B.; Artun, O.; Atılgan, A. Determination of the Areas Suitable for Biogas Energy Production by Using Geographic Information Systems (Gis): Euphrates Basin Case. Scientific Papers. Ser. E Land Reclam. Earth Obs. Surv. Environ. Eng. 2017, 6, 57–64. [Google Scholar]
- Boyacı, S. Determination of Biogas Potential from Animal Waste in Kirşehir Province. Türk Tarım Doğa Bilim. Derg. 2017, 4, 447–455. [Google Scholar]
- Doğru, C. Trakya Bölgesinin biyogaz Potansiyeli ve Mevcut Potansiyelin Bölge Ekonomisine Katkısı Üzerine Bir İnceleme. Uluslararası II. Trakya Bölgesi Kalkınma Girişimcilik Sempozyumu, 1–2 October 2010 İğneada. 2010, pp. 1–2. Available online: https://yayin.klu.edu.tr/dosyalar/birimler/yayin/dosyalar/dosya_ve_belgeler/kalk%C4%B1nma%201/13-orhan-kocak-ersin-kavi.pdf (accessed on 1 June 2023).
- Tufaner, A.; Avşar, A. Yenilenebilir Bir Enerji Kaynağı Olarak Organik İçeriği Yüksek Atıklardan Biyogaz Üretim Teknolojisi. In Proceedings of the Kültür ve Sanat Sempozyumu, Adıyaman Üniversitesi Bilim, Türkiye, 3–4 April 2014; pp. 156–160. [Google Scholar]
- Karim, K.; Hoffmann, R.; Klasson, K.T.; Al-Dahhan, M.H. Anaerobic digestion of animal waste: Effect of mode of mixing. Water Res. 2005, 39, 3597–3606. [Google Scholar] [CrossRef] [PubMed]
- Dalkılıç, K.; Uğurlu, A. Biogas Production from Chicken Manure. J. Poult. Res. 2013, 10, 14–19. Available online: https://dergipark.org.tr/en/pub/jpr/issue/35225/390756 (accessed on 30 May 2023).
- Hol-Nielsen, J.B.; Al-Seadi, T.; Oleskowicz, P. The future of anaerobic digestion and biogas utilization. Bioresour. Technol. 2009, 100, 5478–5484. [Google Scholar] [CrossRef]
- Gebrezgabher, S.A.; Meuwissen, M.P.M.; Prins, B.A.M.; Lansink, A.G.J.M.O. Economic analysis of an aerobic digestion-a case of green power biogas plant in The Netherlands. NJAS Wagening J. Life Sci. 2010, 57, 109–115. [Google Scholar] [CrossRef]
- Tambone, F.; Genevini, P.; D’Imporzano, G.; Adani, F. Assessing amendment properties of digestate by studying the organic matter composition and the degree of biological stability during the anaerobic digestion of the organic fraction of MSW. Bioresour. Technol. 2009, 100, 3140–3142. [Google Scholar] [CrossRef]
- Nkoa, R. Agricultural Benefits and Environmental Risks of Soil Fertilization with Anaerobic Digestates: A review. Agron. Sustain. Dev. 2014, 34, 473–492. [Google Scholar] [CrossRef]
- Wang, Y.; Shen, F.; Liu, R.; Wu, L. Effects of anaerobic fermentation residue of biogas production on the yield and quality of Chinese cabbage and nutrient accumulations in soil. Int. J. Glob. Energy Issues 2008, 29, 284–293. [Google Scholar] [CrossRef]
- Odlare, M. Organic Residues. A Resource Fora Rable Soils; Swedish University of Agricultural Sciences: Upsala, Sweden, 2005. [Google Scholar]
- Alburquerque, J.A.; Fuente, C.; Ferrer-Costa, A.; Carrasco, L.; Cegarra, J.; Abad, M.; Bernal, M.P. Assessment of the fertiliser potential of digestates from farm and agroindustrial residues. Biomass Bioenergy 2012, 40, 181–189. [Google Scholar] [CrossRef]
- Bharathiraja, B.; Sudharsana, T.; Jayamuthunagai, J.; Praveenkumar, R.; Chozhavendhan, S.; Iyyappan, J. Biogas Production—A review on composition, fuel properties, feed stock and principles of anaerobic digestion. Renew. Sustain. Energy Rev. 2018, 90, 570–582. [Google Scholar] [CrossRef]
- Arthurson, V. Closing the Global Energy and Nutrient Cycles through Application of Biogas Residue to Agricultural Land-Potential Benefits and Drawbacks. Energies 2009, 2, 226–242. [Google Scholar] [CrossRef]
- Agayev, E.; Ugurlu, A. Biogas production from co-digestion of horse manure and waste sewage sludge. In Proceedings of the 2011 NSTI Nanotechnology Conference and Expo, NSTI-Nanotech, Boston, MA, USA, 13–16 June 2011; Volume 3, pp. 657–660. [Google Scholar]
- Şenol, H.; Atasoy, S. Portable anaerobic bioreactor design and production trials. Gümüşhane Univ. J. Sci. Technol. 2022, 12, 1146–1157. [Google Scholar] [CrossRef]
- Marañón, E.; Castrillón, L.; Quiroga, G.; Fernández-Nava, Y.; Gómez, L.; García, M.M. Co-digestion of Cattle Manure with Food Waste and Sludge to Increase Biogas Production. Waste Manag. 2012, 32, 1821–1825. [Google Scholar] [CrossRef] [PubMed]
- Cu, T.T.T.; Nguyen, T.X.; Triolo, J.M.; Pedersen, L.; Le, V.D.; Le, P.D.; Sommer, S.G. Biogas production from Vietnamese animal manure, plant residues and organic waste: Influence of biomass composition on methane yield. Asian Australas. J. Anim. Sci. 2015, 28, 280–289. [Google Scholar] [CrossRef]
- Lonnqvist, T.; Sanches-Pereira, A.; Sandberg, T. Biogas potential for sustainable transport e a Swedish regional case. J. Clean. Prod. 2015, 108, 1105–1114. [Google Scholar] [CrossRef]
- Uddin, W.; Khan, B.; Shaukat, N.; Majid, M.; Mehmood, A.; Ali, S.M.; Younas, U.; Anwar, M.; Mujtaba, G.; Almeshal, A.M. Biogas potential for electric power generation in Pakistan: A survey. Renew. Sustain. Energy Rev. 2016, 54, 25–33. [Google Scholar] [CrossRef]
- Moreda, L. The potential of biogas production in Uruguay. Renew. Sustain. Energy Rev. 2016, 54, 1580–1591. [Google Scholar] [CrossRef]
- Kurnuç Seyhan, A.; Badem, A. Biyogas plant scenarios for evaluating biogas potential from animal waste of Erzincan province. Gümüşhane Univ. J. Sci. Technol. 2011, 11, 245–256. [Google Scholar] [CrossRef]
- İlkiliç, C.; Deviren, H. Formation of Biogas and Purification Methods of Biogas. In Proceedings of the 6th International Advanced Technologies Symposium (IATS’11), Elazığ, Turkey, 16–18 May 2011. [Google Scholar]
- Gülşen, H.; Akkuş, A.; Yolun, A.; Asalan, M. Determination the Electric Potential of Solid Waste in Adiyaman Province. Kahramanmaras Sutcu Imam Univ. J. Eng. Sci. 2022, 25, 173–182. [Google Scholar]
- Kankılıç, T. Production of Solid Biogas and Energy in Sanitary Landfill from Municipal Waste. Eng. Mach. 2015, 56, 58–69. [Google Scholar]
- Wall, D.; Dumont, M.; Murphy, J.D. Green Gas: Facilitating a Future Green Gas Grid through the Production of Renewable Gas. Summary Series IEA Bioenergy: Task 37: 2 2018. Available online: https://www.ieabioenergy.com/wp-content/uploads/2018/04/Two-page-summary-%E2%80%93-Green-Gas.pdf (accessed on 6 April 2023).
- Lohri, C.R.; Diener, S.; Zabaleta, I.; Mertenat, A.; Zurbrügg, C. Treatment technologies for urban solid biowaste to create value products: A review with focus on low- and middle- income settings. Rev. Environ. Sci. Bio/Technol. 2017, 16, 81–130. [Google Scholar] [CrossRef]
- Hengeveld, E.J.; Bekkering, J.; Van Gemert, W.J.T.; Broekhuis, A.A. Biogas infrastructures from farm to regional scale, prospects of biogas transport grids. Biomass Bioenergy 2016, 86, 43–52. [Google Scholar] [CrossRef]
- Ünvar, S. Regional Analysis of Electricity Energy Produced from Animal Manure Sourced Biogas in Turkey. Yuz. Yil Univ. J. Inst. Nat. Appl. Sci. 2023, 28, 131–139. [Google Scholar]
- Koyuncu, S.; Nas, B. Effects of Volatile Acids and Alkalinity in Different Solid Retention Times of Anaerobic Sludge Digester on Biogas Production Yield. Mühendislik Bilim. Tasarım Derg. 2022, 10, 103–109. [Google Scholar] [CrossRef]
- Speece, R.E. Anaerobic Biotechnology for Industrial Wastewaters; Archae Press: Nashvillee, TN, USA, 1996. [Google Scholar]
- Alvarez, M.J. Biomethanization of the Organic Fraction of Municipal Solid Wastes; Iwa Publishing: London, UK, 2003. [Google Scholar]
- Anderson, G.H.; Yang, G. Determination of bicarbonate and total volatile acid concentration in anaerobic digesters using a simple titration. Water Environ. Res. 1992, 64, 53–59. [Google Scholar] [CrossRef]
- Karlssson, A.; Einarsson, P.; Schnürer, A.; Sundberg, C.; Eilertsson, J.; Svensson, B.H. Impact of trace element addition on degradation efficiency of volatile fatty acids, oleic acid and phenyl acetate and on microbial populations in a biogas digester. J. Biosci. Bioeng. 2012, 114, 446–452. [Google Scholar] [CrossRef]
- Biomass. Available online: https://enerji.gov.tr/bilgi-merkezi-enerji-biyokutle (accessed on 15 September 2023).
- Holewa-Rataj, J.; Kukulska-Zając, Z. Agricultural biogas in Poland—production and possible applications. Naft.-Gaz 2022, 12, 872–877. [Google Scholar] [CrossRef]
- Available online: https://rsrenerji.com/blog/biyogazin-yararlari-ve-zararlari (accessed on 29 September 2023).
- Ekinci, K.; Kulcu, R.; Kaya, D.; Yaldız, O.; Ertekin, C. The Prospective of Potential Biogas Plants That Can Utilize Animal Manure in Turkey. Energy Exploit. Explor. 2010, 28, 187–206. [Google Scholar] [CrossRef]
- Aybek, A.; Üçok, S.; İspir, M.A.; Bilgili, M.E. Türkiye’de kullanılabilir Hayvansal Gübre ve Tahıl Sap Atıklarının Biyogaz ve Enerji Potansiyelinin Belirlenerek Sayısal Haritalarının Oluşturulması. J. Tekirdag Agric. Fac. 2015, 12, 111–120. [Google Scholar]
- Ngwabie, N.M.; Chungong, B.N.; Yengong, F.L. Characterisation of pig manure for methane emission modelling in Sub-Saharan Africa. Biosyst. Eng. 2018, 170, 31–38. [Google Scholar] [CrossRef]
- Ertop, H.; Atılgan, A.; Saltuk, B.; Aksoy, E. Establishment of Numerical Maps by Determining the Biogas and Electricity Production potential Obtainable from Cattle Waste. Eur. J. Sci. Technol. 2022, 35, 530–540. [Google Scholar] [CrossRef]
- Melikoglu, M. Vision 2023: Feasibility analysis of Turkey’s renewable energy projection. Renew. Energy 2023, 50, 570–575. [Google Scholar] [CrossRef]
- Tırınk, S. Calculation of Biogas Production Potential of Animal Wastes: Example of Iğdır Province. J. Inst. Sci. Technol. 2022, 12, 152–163. [Google Scholar] [CrossRef]
- Electricity. Available online: https://enerji.gov.tr/bilgi-merkezi-enerji-elektrik (accessed on 12 September 2023).
- Available online: https://iea.blob.core.windows.net/assets/b9ea5a7d-3e41-4318-a69e-f7d456ebb118/Poland2022.pdf (accessed on 20 September 2023).
- Gümüşçü, M.; Uyanık, S. Güneydoğu Anadolu Bölgesi Hayvansal Atıklarından Biyogaz ve Biyogübre Eldesi. Tesisat Mühendisliği MMO 2010, 16, 59–65. [Google Scholar]
- Küsek, G.; Güngör, C.; Öztürk, H.H.; Akdemir, Ş. Biopellet Production from Agricultural Residues. J. Agric. Fac. Uludag Univ. 2015, 29, 137–145. [Google Scholar]
- Atılgan, A.; Saltuk, B.; Ertop, H.; Yücel, A. Determination of Potential Biogas, Electricity and Natural Gas Energy Value that can be Obtained from Animal Wastes, 4. In Proceedings of the Asia Pacific International Congress on Contemporary Studies 2020, Subic Bay Freeport Zone, Olongapo, Philippines, 12–13 December 2020; pp. 1–14, ISBN 978-625-7687-42-3. [Google Scholar]
- Kozłowski, K.; Dach, J.; Lewicki, A.; Malińska, K.; Paulino do Carmo, I.E.; Czekała, W. Potential of biogas production from animal manure in Poland. Arch. Environ. Prot. 2019, 45, 99–108. [Google Scholar] [CrossRef]
- Wicki, L.; Naglis-Liepa, K.; Filipiak, T.; Parzonko, A.; Wicka, A. Is the Production of Agricultural Biogas Environmentally Friendly? Does the Structure of Consumption of First- and Second-Generation Raw Materials in Latvia and Poland Matter? Energies 2022, 15, 5623. [Google Scholar] [CrossRef]
- Adamczyk, J.; Graczyk, M. Green certificates as an instrument to support renewable energy in Poland—Strengths and weaknesses. Environ. Sci. Pollut. Res. 2020, 27, 6577–6588. [Google Scholar] [CrossRef]
- Akdoğan, İ.; Kovancılar, B. Evaluation of Eco-Friendly Renewable Energy Policies in The European Union and Turkey in Terms of Incentive Types. Manag. Econ. 2022, 29, 69–91. [Google Scholar]
- Ergün, İ. Economic and Fiscal Dimensions of Renewable Energy Resources: Comparison between European Union and Turkey. Ph.D. Thesis, Dokuz Eylül University, Graduate School of Social Sciences, İzmir, Turkey, 2020; p. 206. [Google Scholar]
- Official Newspaper. Available online: https://www.resmigazete.gov.tr/eskiler/2023/05/20230501-7.pdf (accessed on 10 March 2023).
- Eurostat (Database). Available online: https://ec.europa.eu/eurostat/web/main/data/database (accessed on 10 March 2023).
- The World Bank—data for Turkiye. Available online: https://data.worldbank.org/country/turkiye (accessed on 10 March 2023).
- The World Bank—data for Poland. Available online: https://data.worldbank.org/country/poland (accessed on 10 March 2023).
- Kusz, D.; Bąk, I.; Szczecińska, B.; Wicki, L.; Kusz, B. Determinants of Return-on-Equity (ROE) of Biogas Plants Operating in Poland. Energies 2023, 16, 31. [Google Scholar] [CrossRef]
- Agricultural Prices. Available online: http://www.notowania.kpodr.pl/ (accessed on 15 September 2023).
- Türker, M. Available online: https://www.researchgate.net/publication/281626833_Anaerobik_Biyoteknoloji_ve_Biyoenerji_Uretimi#fullTextFileContent (accessed on 30 May 2023).
- Tufaner, F.; Avşar, Y.; Dere, T.; Gönüllü, T. Türkiye’de Biyogaz Tesisi Projelerinde Başarı ve Başarısızlık Nedenlerinin Analizi ve Merkezi Biyogaz Tesislerinin Önemi. In Proceedings of the Ulusal Kompost ve Biyogaz Çalıştayı, Antalya, Türkiye, 11–14 April 2013. [Google Scholar]
- International Renewable Energy Agency. Renewable Power Generation Costs in 2020; International Renewable Energy Agency: Abu Dhabi, United Arab Emirates, 2021; ISBN 978-92-9260-348-9. [Google Scholar]
- Wicki, L.; Pietrzykowski, R.; Kusz, D. Factors Determining the Development of Prosumer Photovoltaic Installations in Poland. Energies 2022, 15, 5897. [Google Scholar] [CrossRef]
- Klimek, K.; Kapłan, M.; Syrotyuk, S.; Bakach, N.; Kapustin, N.; Konieczny, R.; Dobrzyński, J.; Borek, K.; Anders, D.; Dybek, B.; et al. Investment Model of Agricultural Biogas Plants for Individual Farms in Poland. Energies 2021, 14, 7375. [Google Scholar] [CrossRef]
- Przesmycka, A.; Podstawka, M. Economic Profitability of Investment in Biogas Plant. Ann. Pol. Assoc. Agric. Agribus. Econ. 2016, 18, 176–182. Available online: https://rnseria.com/resources/html/article/details?id=179361 (accessed on 7 November 2022).
- Baccioli, A.; Ferrari, L.; Guiller, R.; Yousfi, O.; Vizza, F.; Desideri, U. Feasibility Analysis of Bio-Methane Production in a Biogas Plant: A Case Study. Energies 2019, 12, 473. [Google Scholar] [CrossRef]
- Bartkowiak, A.; Bartkowiak, P.; Kinelski, G. Efficiency of Shaping the Value Chain in the Area of the Use of Raw Materials in Agro-Biorefinery in Sustainable Development. Energies 2022, 15, 6260. [Google Scholar] [CrossRef]
- Atılgan, A.; Çetin, H.; Tezcan, A. The use in biogas energy production of plant wastes: Kumluca Case. 13. In Proceedings of the National Kültürteknik Congress, Antalya, Turkey, 12–15 April 2016; pp. 435–438. [Google Scholar]
- Gökdoğan, O. Greenhouse Heating with the Energy that Can Be Acquired from Isparta Province’s Animal Waste. Acad. J. Nat. Hum. Sci. 2019, 5, 27–34. [Google Scholar]
- Atılgan, A.; Saltuk, B.; Ertop, H.; Aksoy, E. Determining The Biogas Energy Potential from Greenhouse Wastes and Creating Maps: The Case of Antalya Province. Euroasia J. Math. Eng. Nat. Med. Sci. 2020, 7, 19–30. [Google Scholar] [CrossRef]


| Animal Breed | Manure Production Per Animal Unit (kg·Animal−1·Day−1) | DM (Dry Matter) (%) | VDM (Volatile Dry Matter) (%) | Raw Material-Specific Methane Production Rate (m3 ·CH4·kg·VDM−1) | Availability of Animal Manure (%) |
|---|---|---|---|---|---|
| Cattle | 43.00 | 13.95 | 83.33 | 0.18 | 50 * |
| Sheep | 2.40 | 27.50 | 23.00 | 0.30 | 13 |
| Goat | 2.05 | 31.71 | 23.17 | 0.30 | 13 |
| Horse, Donkey, Mule | 20.40 | 29.41 | 19.61 | 0.30 | 29 |
| Poultry | 0.18 | 25.88 | 77.27 | 0.35 | 19 |
| Turkey | 0.38 | 25.53 | 19.36 | 0.35 | 26 |
| Duck and Geese | 0.33 | 28.18 | 17.27 | 0.35 | 22 |
| Pig | 3 | 17 | 83 | 0.29 | 50 * |
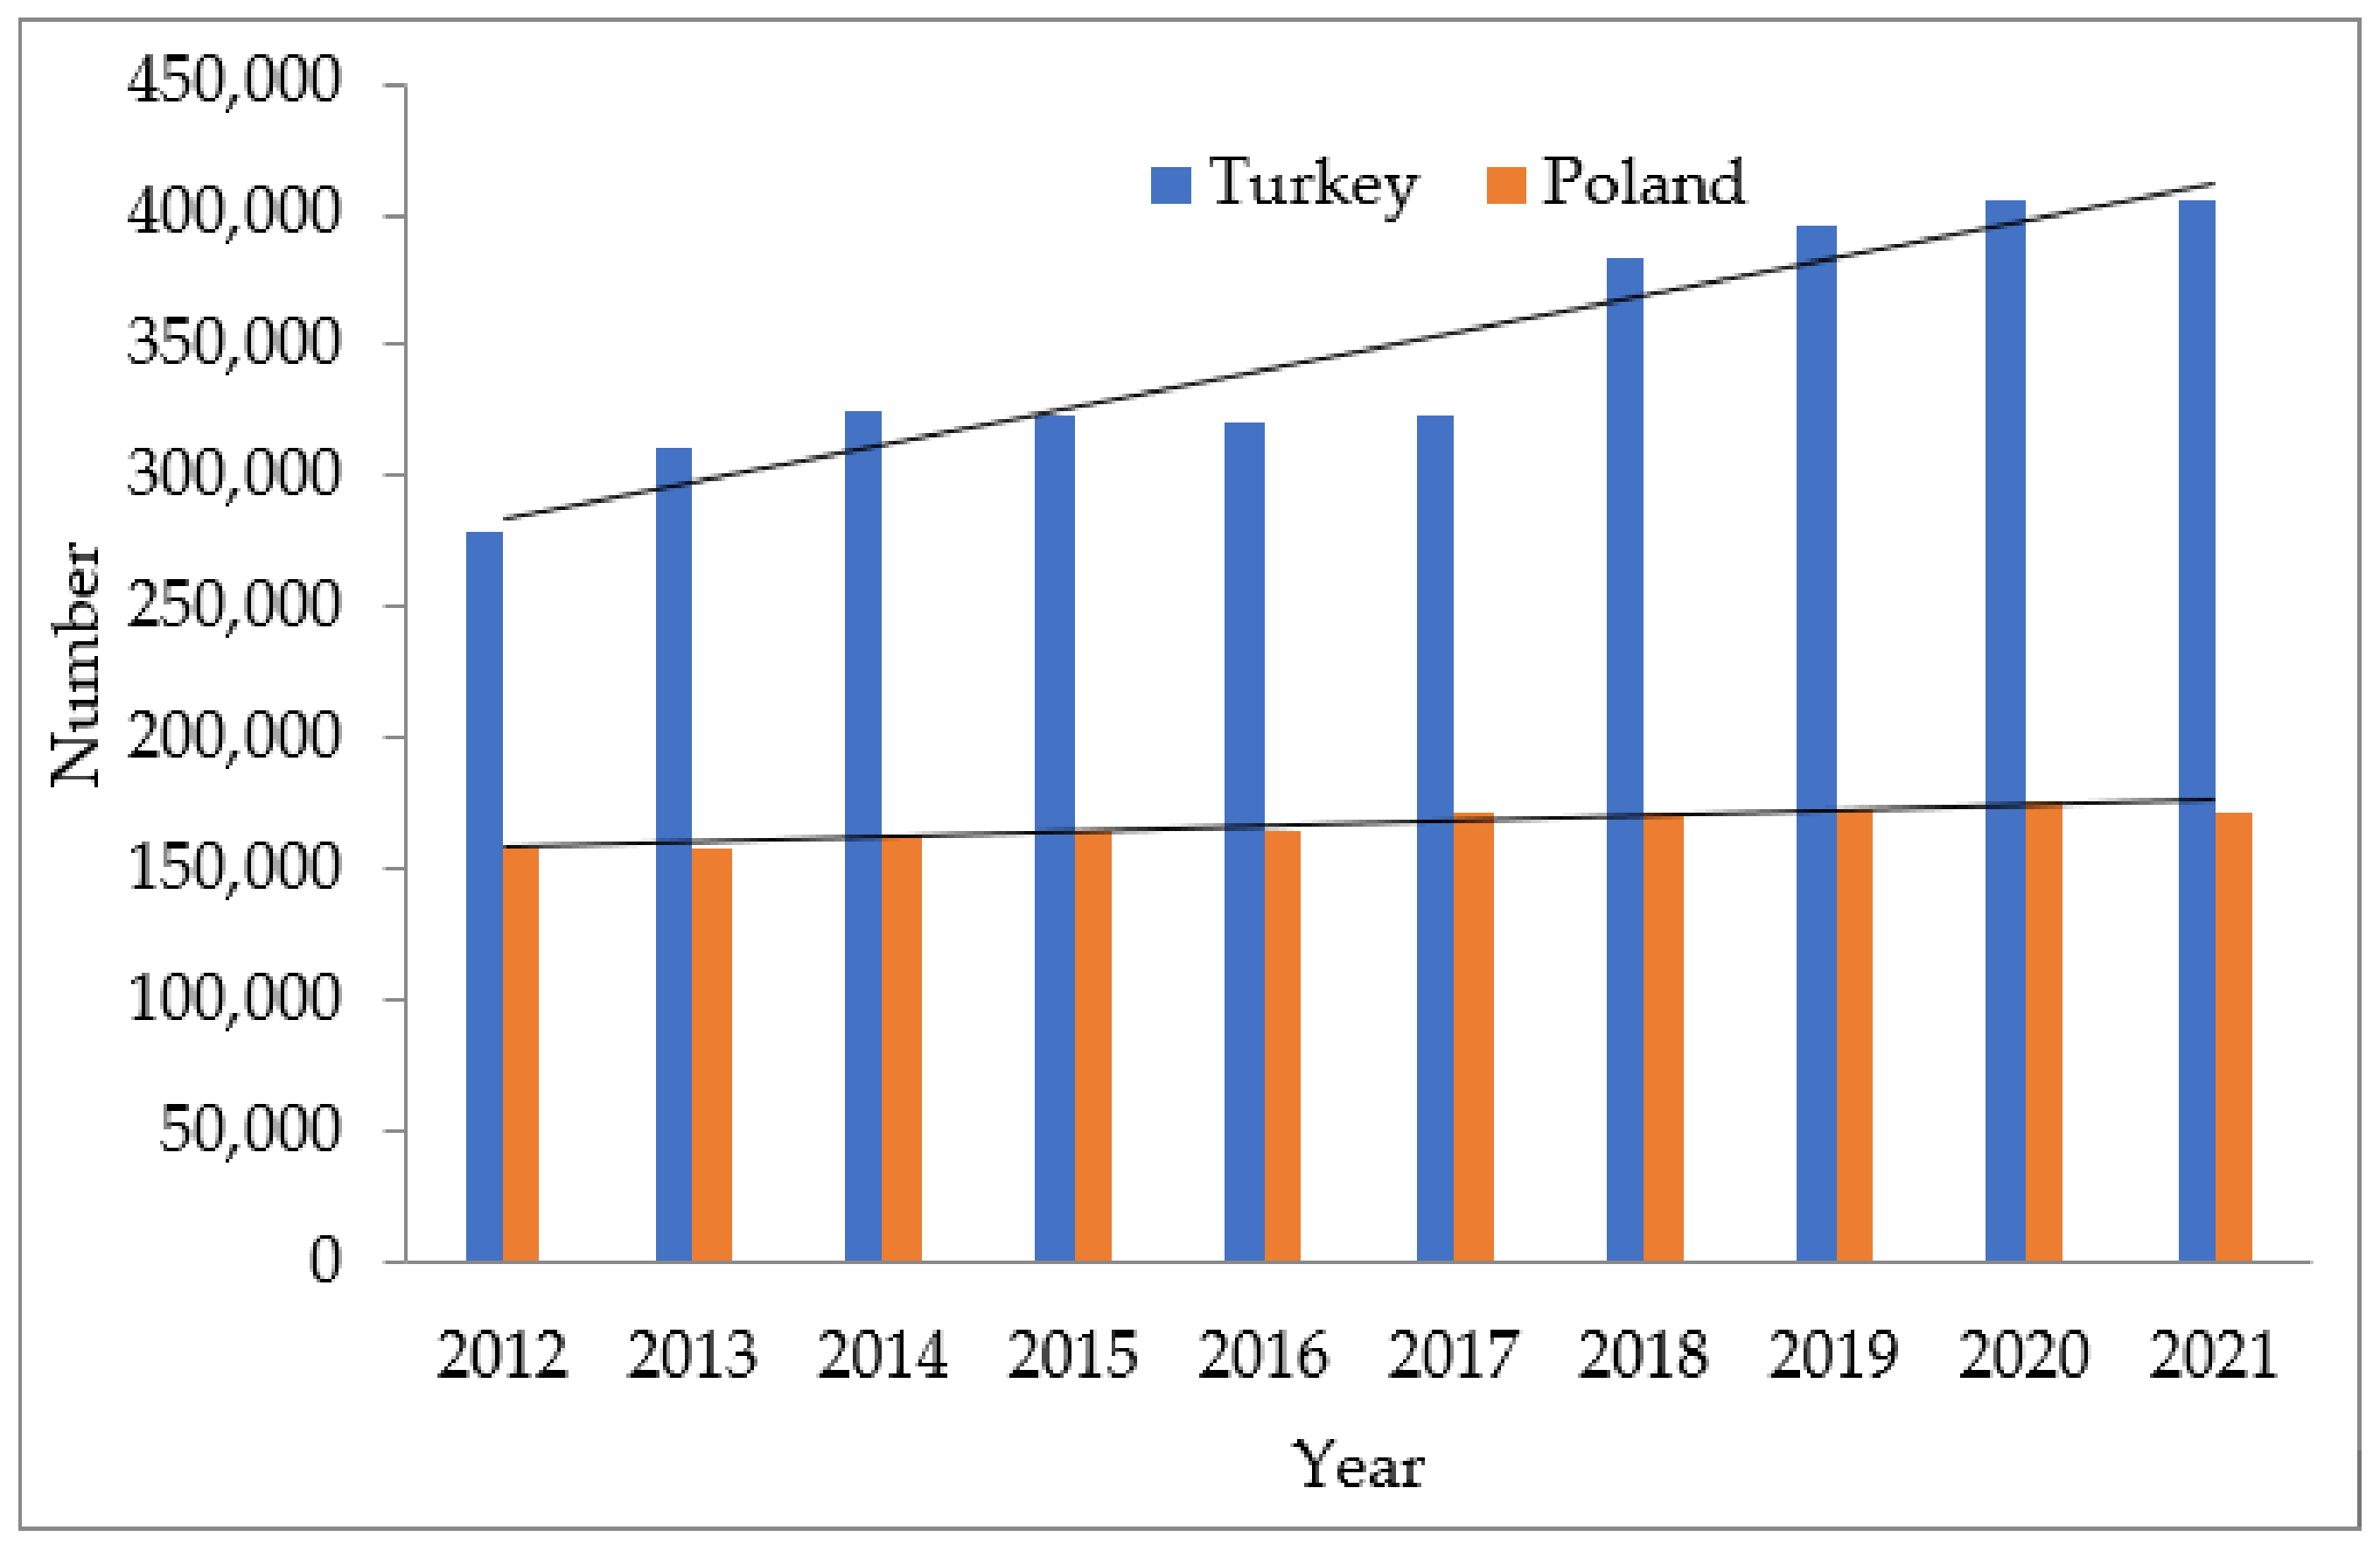
| Year | Animal Breed | ||||||||
|---|---|---|---|---|---|---|---|---|---|
| Cattle | Sheep | Goat | Horse, Donkey, Mule | Poultry | Turkey | Duck and Geese | Pig | Total | |
| 2012 | 12,386 | 25,032 | 7277 | 398 | 253,712 | 2761 | 1033 | 0 | 302,599 |
| 2013 | 13,914 | 27,425 | 8357 | 377 | 266,153 | 2925 | 1123 | 0 | 320,274 |
| 2014 | 14,415 | 29,284 | 9225 | 363 | 293,728 | 2990 | 1312 | 0 | 351,317 |
| 2015 | 14,223 | 31,140 | 10,344 | 342 | 312,256 | 2820 | 1249 | 0 | 372,374 |
| 2016 | 13,994 | 31,508 | 10,416 | 320 | 329,011 | 3183 | 1347 | 0 | 389,779 |
| 2017 | 14,080 | 30,984 | 10,345 | 310 | 342,801 | 3872 | 1470 | 0 | 403,862 |
| 2018 | 17,043 | 35,195 | 10,922 | 273 | 353,561 | 4043 | 1613 | 0 | 406,650 |
| 2019 | 17,688 | 37,276 | 11,205 | 259 | 342,567 | 4541 | 1677 | 0 | 415,213 |
| 2020 | 17,965 | 42,127 | 11,986 | 223 | 379,349 | 4798 | 1934 | 0 | 458,382 |
| 2021 | 17,851 | 45,178 | 12,342 | 202 | 39,394 | 4704 | 2018 | 0 | 473,689 |
| Total | 137,559 | 335,149 | 102,419 | 3067 | 3,264,532 | 36,637 | 14,776 | 0 | 3,894,139 |
| Year | Animal Breed | ||||||||
|---|---|---|---|---|---|---|---|---|---|
| Cattle | Sheep | Goat | Horse, Donkey, Mule | Poultry | Turkey | Duck and Geese | Pig | Total | |
| 2012 | 5776 | 267 | 90 | 222 | 112,477 | 9156 | 3791 | 11,581 | 143,360 |
| 2013 | 5859 | 249 | 82 | 207 | 117,054 | 8161 | 4139 | 11,162 | 146,913 |
| 2014 | 5920 | 223 | 82 | 207 | 129,861 | 9449 | 7253 | 11,724 | 164,719 |
| 2015 | 5960 | 228 | 82 | 207 | 146,123 | 10,320 | 6824 | 11,640 | 181,384 |
| 2016 | 5939 | 239 | 44 | 185 | 169,033 | 11,706 | 6864 | 10,865 | 204,875 |
| 2017 | 6143 | 261 | 44 | 185 | 177,640 | 12,228 | 7354 | 11,353 | 215,208 |
| 2018 | 6183 | 277 | 44 | 185 | 182,200 | 14,173 | 9705 | 11,028 | 223,795 |
| 2019 | 6262 | 269 | 50 | 185 | 183,121 | 15,592 | 10,619 | 11,215 | 227,313 |
| 2020 | 6279 | 278 | 44 | 185 | 182,473 | 15,892 | 7408 | 11,727 | 224,286 |
| 2021 | 6379 | 265 | 54 | 157 | 168,629 | 15,256 | 6163 | 10,242 | 207,145 |
| Total | 60,700 | 2556 | 616 | 1925 | 1,568,611 | 121,933 | 70,120 | 112,537 | 1,938,998 |
| Year | Animal Breed | ||||||||
|---|---|---|---|---|---|---|---|---|---|
| Cattle | Sheep | Goat | Horse, Donkey, Mule | Poultry | Turkey | Duck and Geese | Pig | Total | |
| 2012 | 194,398 | 21,928 | 5445 | 2964 | 16,669 | 382 | 124 | 0 | 241,910 |
| 2013 | 218,380 | 24,024 | 6253 | 2807 | 17,486 | 405 | 135 | 0 | 269,490 |
| 2014 | 226,243 | 25,652 | 6903 | 2703 | 19,298 | 414 | 158 | 0 | 281,371 |
| 2015 | 223,230 | 27,278 | 7740 | 2547 | 20,515 | 391 | 150 | 0 | 281,851 |
| 2016 | 219,636 | 27,601 | 7794 | 2383 | 21,616 | 441 | 162 | 0 | 279,633 |
| 2017 | 220,986 | 27,142 | 7741 | 2308 | 22,522 | 537 | 177 | 0 | 281,413 |
| 2018 | 267,490 | 30,831 | 8172 | 2033 | 23,229 | 561 | 194 | 0 | 332,510 |
| 2019 | 277,613 | 32,654 | 8384 | 1929 | 22,507 | 630 | 202 | 0 | 343,919 |
| 2020 | 281,961 | 36,903 | 8969 | 1660 | 24,923 | 665 | 233 | 0 | 355,314 |
| 2021 | 280,171 | 39,576 | 9235 | 1504 | 25,715 | 652 | 243 | 0 | 357,096 |
| Total | 2,410,108 | 293,589 | 76,636 | 22,838 | 214,480 | 5 078 | 1 778 | 0 | 3,024,507 |
| Year | Animal Breed | ||||||||
|---|---|---|---|---|---|---|---|---|---|
| Cattle | Sheep | Goat | Horse, Donkey, Mule | Poultry | Turkey | Duck and Geese | Pig | Total | |
| 2012 | 90,654 | 234 | 67 | 1653 | 7389 | 1270 | 457 | 12,681 | 114,405 |
| 2013 | 91,957 | 218 | 61 | 1541 | 7690 | 1132 | 499 | 12,222 | 115,320 |
| 2014 | 92,914 | 195 | 61 | 1541 | 8531 | 1311 | 874 | 12,837 | 118,264 |
| 2015 | 93,542 | 200 | 61 | 1541 | 9600 | 1431 | 822 | 12,745 | 119,942 |
| 2016 | 93,212 | 209 | 33 | 1378 | 11,105 | 1623 | 827 | 11,897 | 120,284 |
| 2017 | 96,414 | 229 | 33 | 1378 | 11,671 | 1696 | 886 | 12,431 | 113,067 |
| 2018 | 97,042 | 243 | 33 | 1378 | 11,971 | 1966 | 1169 | 12,075 | 125,877 |
| 2019 | 98,282 | 236 | 37 | 1378 | 12,031 | 2163 | 1279 | 12,280 | 127,686 |
| 2020 | 98,549 | 244 | 33 | 1378 | 11,988 | 2204 | 892 | 12,841 | 128,129 |
| 2021 | 100,118 | 232 | 40 | 1169 | 11,079 | 2116 | 742 | 11,214 | 126,710 |
| Total | 952,684 | 2240 | 459 | 14,335 | 91,384 | 16,912 | 8447 | 123,223 | 1,209,684 |
| Year | Animal Breed | ||||||||
|---|---|---|---|---|---|---|---|---|---|
| Cattle | Sheep | Goat | Horse, Donkey, Mule | Poultry | Turkey | Duck and Geese | Pig | Total | |
| 2012 | 2,033,811 | 54,091 | 15,602 | 14,870 | 221,668 | 1722 | 466 | 0 | 2,342,230 |
| 2013 | 2,284,712 | 59,262 | 17,917 | 14,085 | 232,537 | 1825 | 507 | 0 | 2,610,845 |
| 2014 | 2,366,977 | 63,279 | 19,778 | 13,562 | 256,630 | 1865 | 592 | 0 | 2,722,683 |
| 2015 | 2,335,450 | 67,290 | 22,177 | 12,777 | 272,817 | 1759 | 563 | 0 | 2,712,833 |
| 2016 | 2,297,848 | 68,085 | 22,332 | 11,955 | 287,456 | 1985 | 608 | 0 | 2,690,269 |
| 2017 | 2,311,970 | 66,952 | 22,180 | 11,582 | 299,505 | 2416 | 664 | 0 | 2,715,269 |
| 2018 | 2,798,501 | 76,052 | 23,417 | 10,199 | 308,906 | 2522 | 728 | 0 | 2,911,419 |
| 2019 | 2,904,412 | 80,549 | 24,024 | 9676 | 299,301 | 2833 | 757 | 0 | 3,321,552 |
| 2020 | 2,949,896 | 91,031 | 25,699 | 8331 | 331,437 | 2993 | 873 | 0 | 3,410,260 |
| 2021 | 2,931,176 | 97,624 | 26,462 | 7547 | 341,961 | 2934 | 911 | 0 | 3,408,615 |
| Total | 25,214,753 | 724,215 | 219,588 | 114,584 | 2,543,312 | 22,854 | 6669 | 0 | 28,845,975 |
| Year | Animal Breed | ||||||||
|---|---|---|---|---|---|---|---|---|---|
| Cattle | Sheep | Goat | Horse, Donkey, Mule | Poultry | Turkey | Duck and Geese | Pig | Total | |
| 2012 | 948,433 | 577 | 193 | 8294 | 98,271 | 5712 | 1711 | 259,450 | 1,322,641 |
| 2013 | 962,061 | 538 | 176 | 7734 | 102,270 | 5091 | 1868 | 250,063 | 1,329,801 |
| 2014 | 972,078 | 482 | 176 | 7734 | 113,460 | 5895 | 3274 | 262,654 | 1,365,753 |
| 2015 | 978,646 | 493 | 176 | 7734 | 127,668 | 6438 | 3080 | 260,772 | 1,385,007 |
| 2016 | 975,197 | 516 | 94 | 6912 | 147,684 | 7303 | 3098 | 243,410 | 1,384,214 |
| 2017 | 1,008,695 | 564 | 94 | 6912 | 155,204 | 7628 | 3319 | 254,343 | 1,429,131 |
| 2018 | 1,015,263 | 599 | 94 | 6912 | 159,188 | 8842 | 4381 | 247,062 | 1,433,499 |
| 2019 | 1,028,235 | 581 | 107 | 6912 | 159,993 | 9727 | 4793 | 251,251 | 1,451,872 |
| 2020 | 1,031,027 | 601 | 94 | 6912 | 159,427 | 9914 | 3344 | 262,721 | 1,464,126 |
| 2021 | 1,047,447 | 573 | 116 | 5866 | 147,331 | 9517 | 2782 | 229,453 | 1,433,568 |
| Total | 9,967,082 | 5524 | 1320 | 71,922 | 1,370,496 | 30,439 | 31,650 | 2,521,179 | 13,999,612 |
| Year | Animal Breed | ||||||||
|---|---|---|---|---|---|---|---|---|---|
| Cattle | Sheep | Goat | Horse, Donkey, Mule | Poultry | Turkey | Duck and Geese | Pig | Total | |
| 2012 | 565,399 | 15,037 | 4337 | 4134 | 61,624 | 478 | 130 | 0 | 651,139 |
| 2013 | 635,150 | 16,475 | 4981 | 3916 | 64,646 | 507 | 141 | 0 | 725,816 |
| 2014 | 658,020 | 17,592 | 5498 | 3770 | 71,343 | 518 | 165 | 0 | 756,906 |
| 2015 | 649,255 | 18,707 | 6165 | 3552 | 75,843 | 489 | 157 | 0 | 754,168 |
| 2016 | 638,802 | 18,928 | 6208 | 3324 | 79,913 | 552 | 169 | 0 | 747,896 |
| 2017 | 642,727 | 18,613 | 6166 | 3220 | 83,262 | 672 | 184 | 0 | 754,844 |
| 2018 | 777,983 | 21,142 | 6510 | 2835 | 85,876 | 701 | 202 | 0 | 895,249 |
| 2019 | 807,426 | 22,393 | 6679 | 2690 | 83,206 | 788 | 210 | 0 | 923,392 |
| 2020 | 820,071 | 25,307 | 7145 | 2316 | 92,140 | 832 | 243 | 0 | 948,054 |
| 2021 | 814,867 | 27,139 | 7356 | 2098 | 95,065 | 816 | 253 | 0 | 947,594 |
| Total | 7,009,700 | 201,333 | 61,045 | 31,855 | 792,918 | 6353 | 1 854 | 0 | 8,105,058 |
| Year | Animal Breed | ||||||||
|---|---|---|---|---|---|---|---|---|---|
| Cattle | Sheep | Goat | Horse, Donkey, Mule | Poultry | Turkey | Duck and Geese | Pig | Total | |
| 2012 | 263,664 | 160 | 54 | 2306 | 27,319 | 1588 | 476 | 72,127 | 367,694 |
| 2013 | 267,453 | 150 | 49 | 2150 | 28,431 | 1415 | 519 | 69,517 | 369,684 |
| 2014 | 270,237 | 134 | 49 | 2150 | 31,542 | 1639 | 910 | 73,017 | 379,678 |
| 2015 | 272,063 | 137 | 49 | 2150 | 35,492 | 1790 | 856 | 72,494 | 385,031 |
| 2016 | 271,105 | 144 | 26 | 1921 | 41,056 | 2030 | 861 | 67,668 | 384,811 |
| 2017 | 280,417 | 157 | 26 | 1921 | 43,147 | 2121 | 923 | 70,707 | 399,419 |
| 2018 | 282,243 | 166 | 26 | 1921 | 44,254 | 2458 | 1218 | 68,683 | 399,751 |
| 2019 | 285,849 | 162 | 30 | 1921 | 44,478 | 2704 | 1332 | 69,848 | 404,992 |
| 2020 | 286,625 | 167 | 26 | 1921 | 44,321 | 2756 | 930 | 73,037 | 409,783 |
| 2021 | 291,190 | 159 | 32 | 1631 | 40,958 | 2646 | 773 | 63,788 | 401,177 |
| Total | 2,770,846 | 1536 | 367 | 19,992 | 380,998 | 21,147 | 6248 | 700,886 | 3,902,020 |
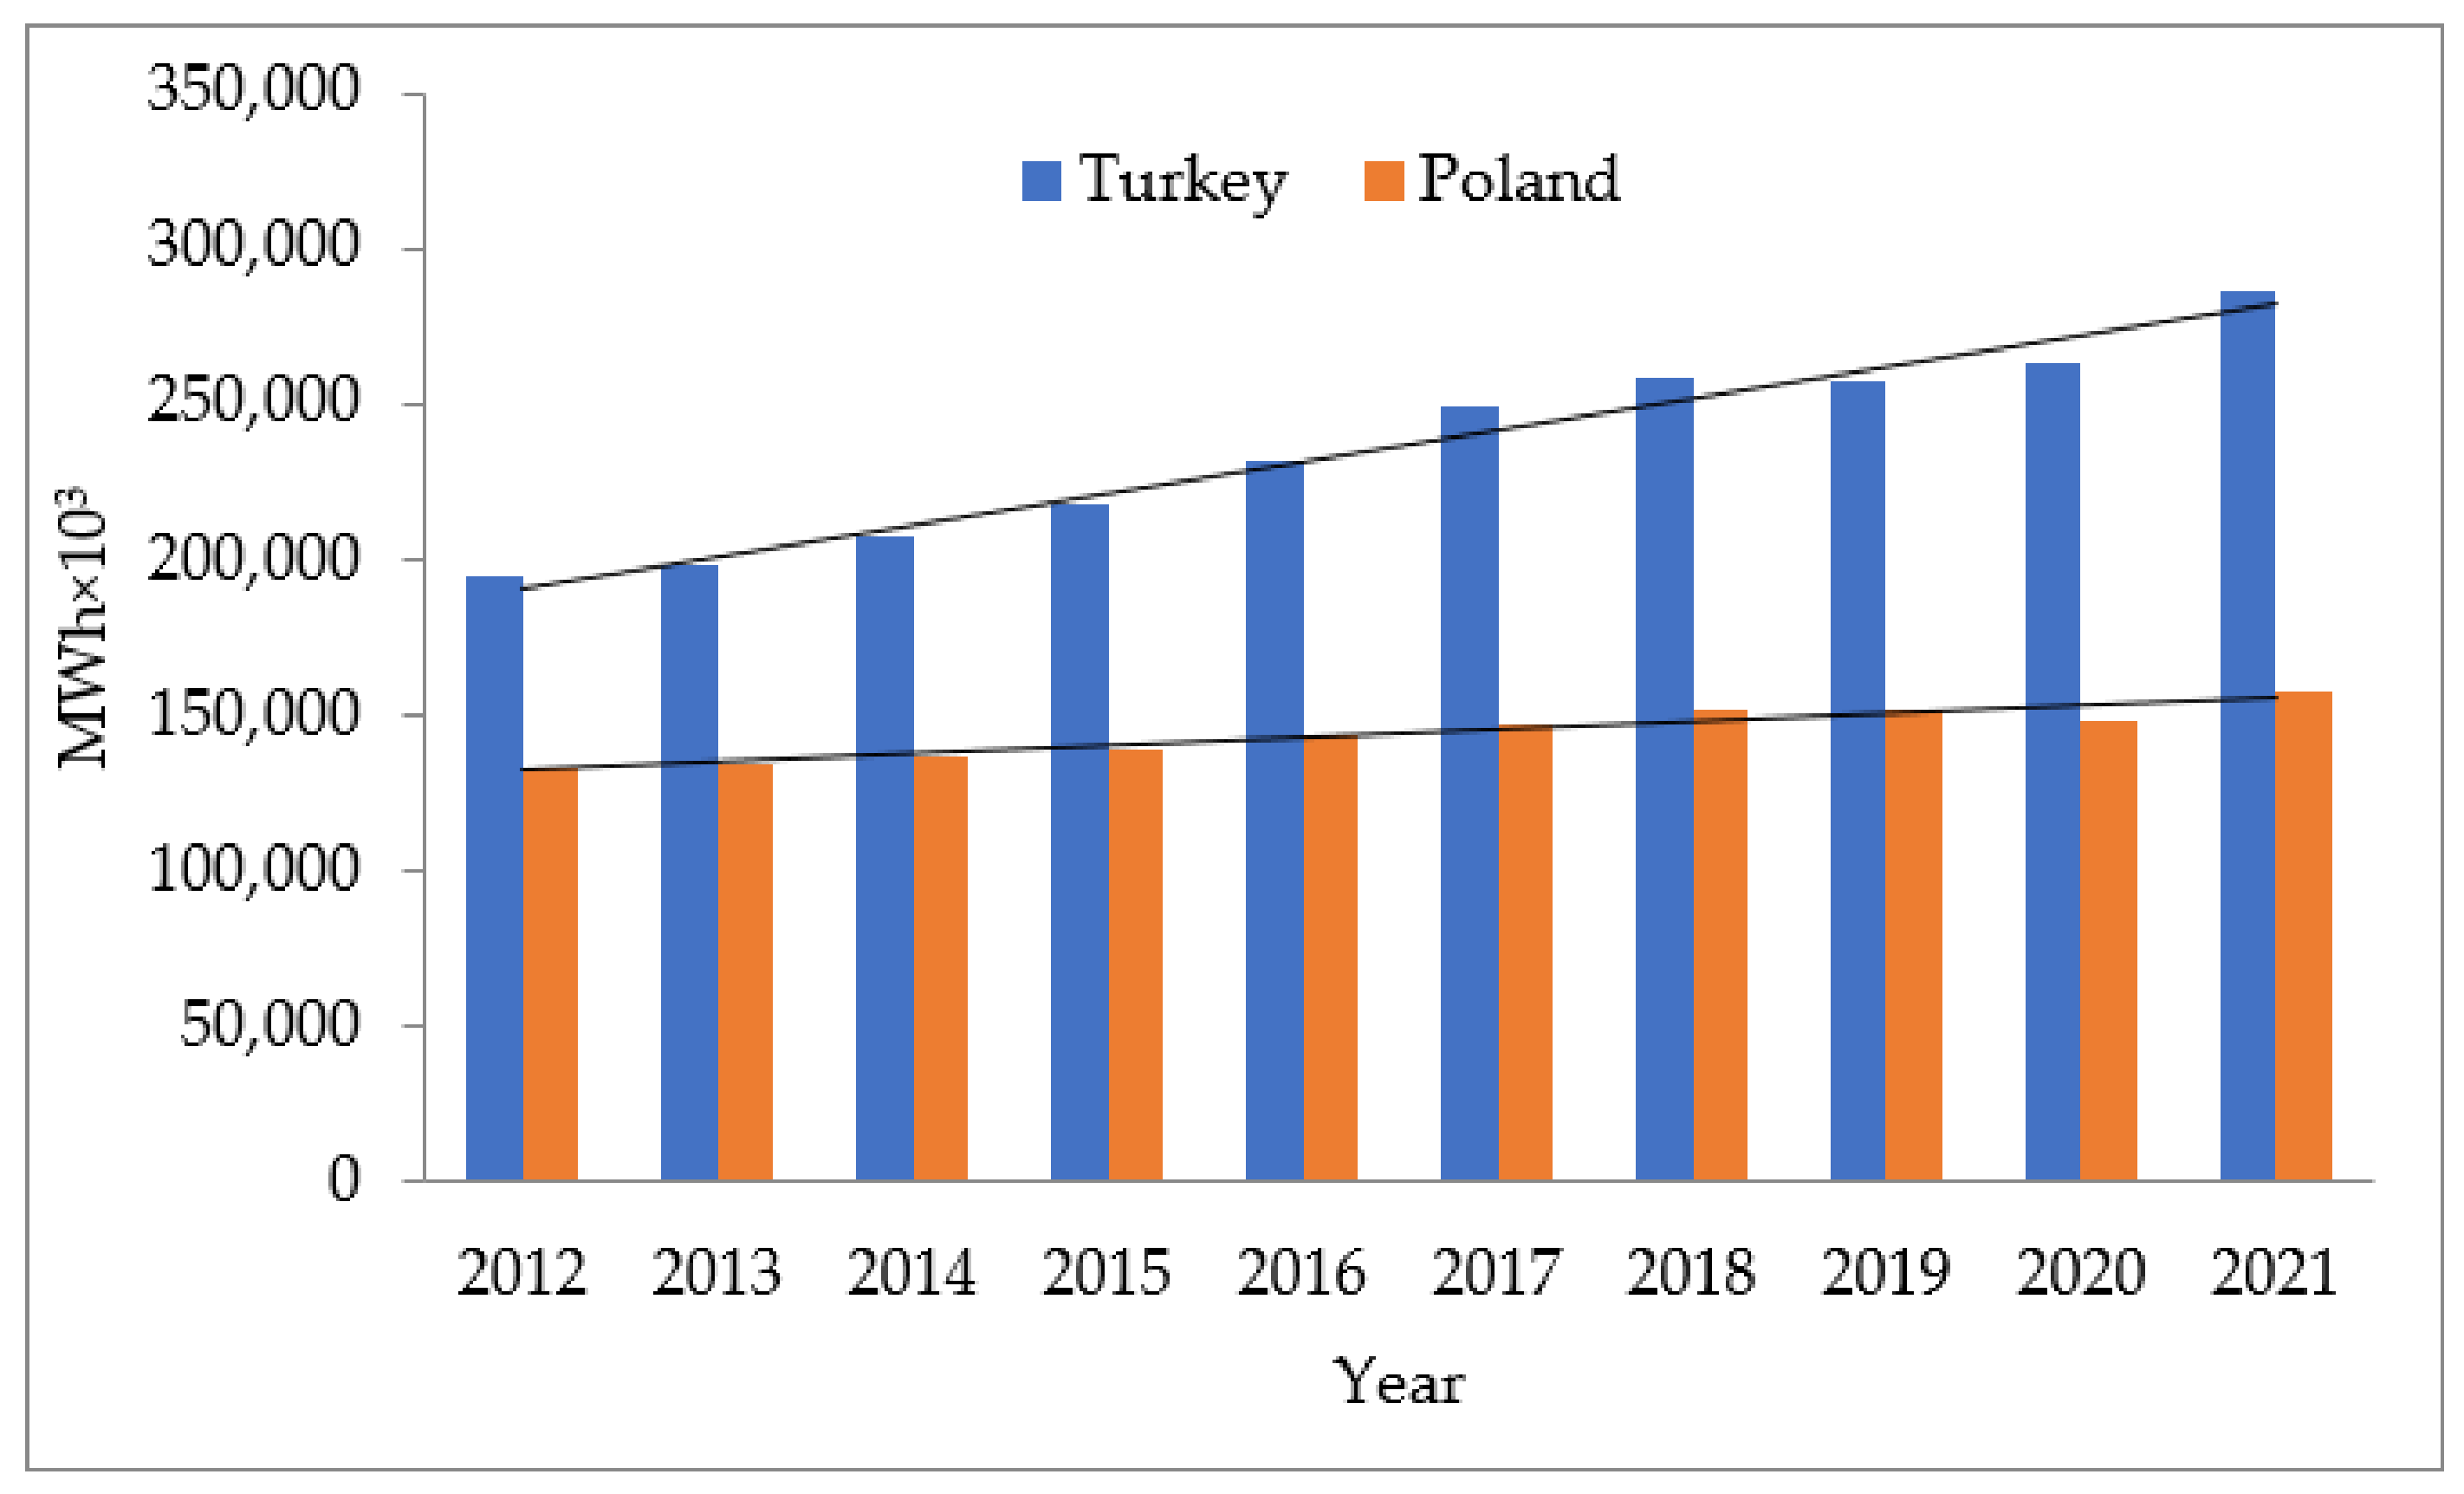
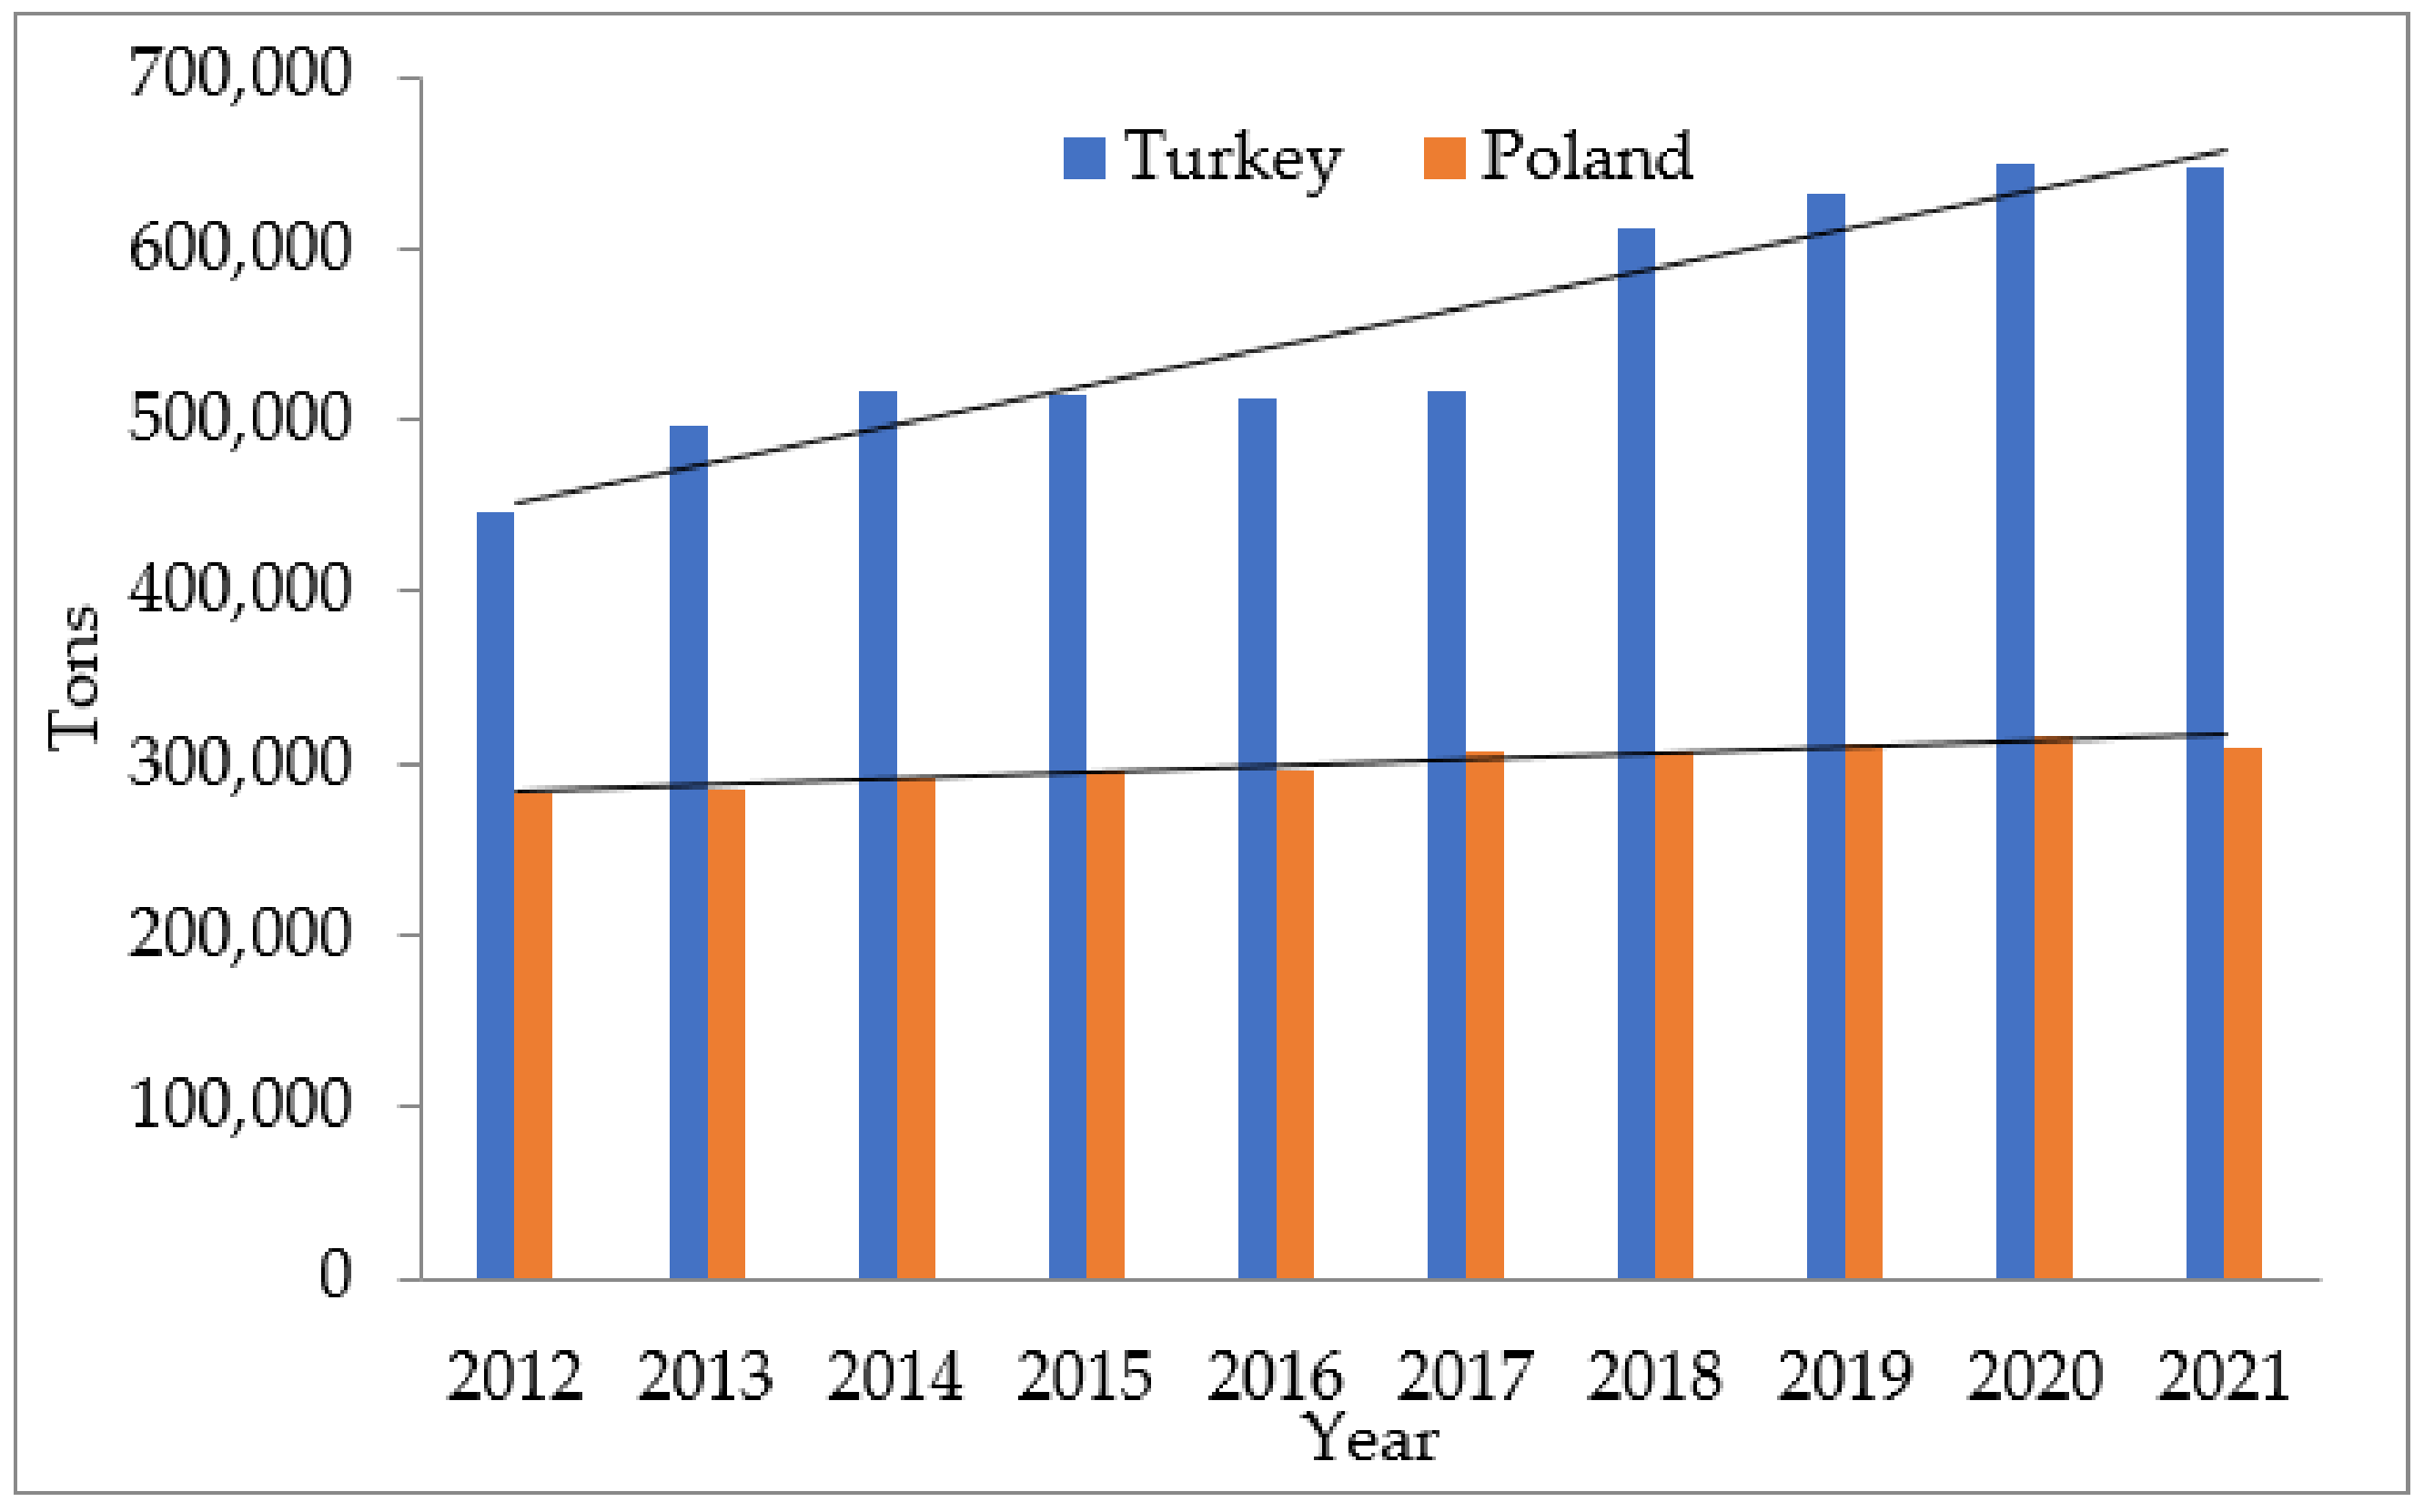
| Year | Turkey | Poland | ||||
|---|---|---|---|---|---|---|
| Obtainable Electricity (MWh) | Unit Price * (€·MWh−1) | Total Economic Gain (€) | Obtainable Electricity (MWh) | Unit Price * (€·MWh−1) | Total Economic Gain (€) | |
| 2012 | 651,139 | 131 | 85,299,209 | 367,694 | 142 | 52,212,548 |
| 2013 | 725,816 | 150 | 108,872,400 | 369,684 | 148 | 54,713,232 |
| 2014 | 756,906 | 119 | 90,071,814 | 379,678 | 142 | 53,914,276 |
| 2015 | 754,168 | 136 | 102,566,848 | 385,031 | 144 | 55,444,464 |
| 2016 | 747,896 | 127 | 94,982,792 | 384,811 | 133 | 51,179,863 |
| 2017 | 754,844 | 105 | 79,258,620 | 399,419 | 144 | 57,516,336 |
| 2018 | 895,249 | 90 | 80,572,410 | 399,751 | 141 | 56,364,891 |
| 2019 | 923,392 | 85 | 78,488,320 | 404,992 | 134 | 54,268,928 |
| 2020 | 948,054 | 99 | 93,857,346 | 409,783 | 148 | 60,647,884 |
| 2021 | 947,594 | 83 | 78,650,302 | 401,177 | 155 | 62,182,435 |
| Total | 8,105,058 | - | 892,620,061 | 3,902,020 | - | 558,444,857 |
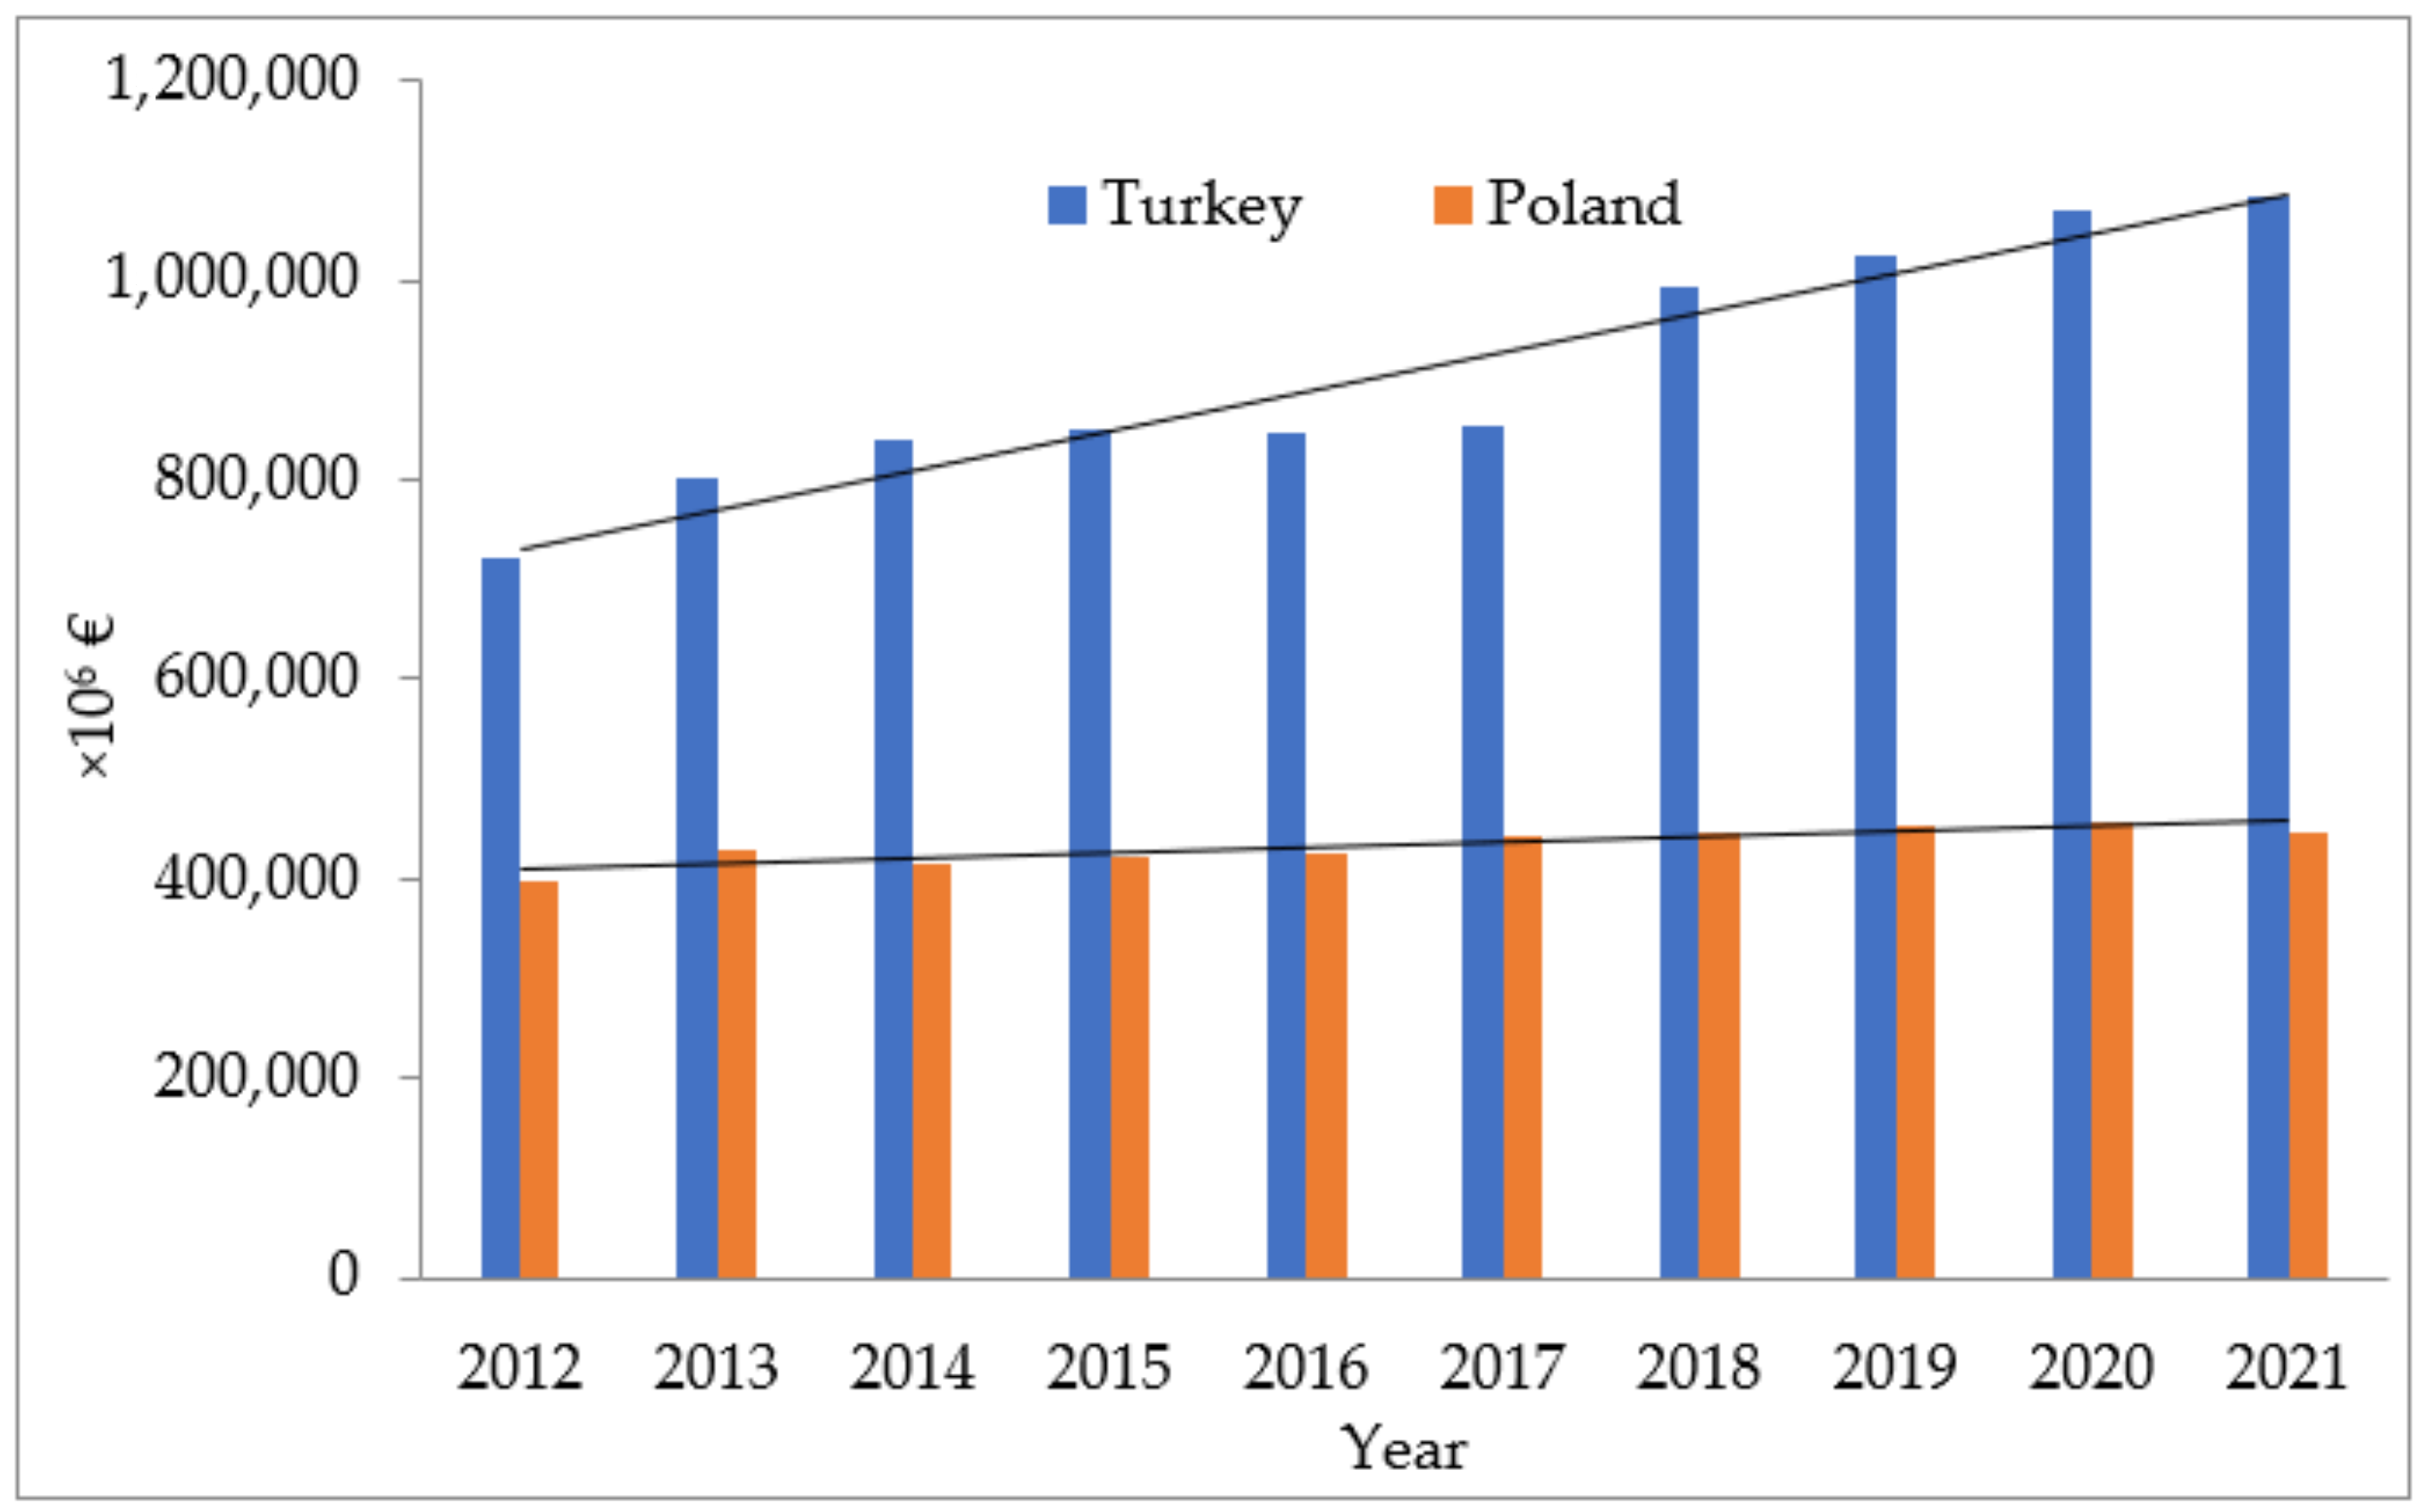
| Turkey | Poland | |||||
|---|---|---|---|---|---|---|
| Year | Income from Obtainable Electricity (×106 €) | Income from Biofertilizer Production (×106 €) | Total Economic Gain from Biogas Production (×106 €) | Income from Obtainable Electricity (×106 €) | Income from Biofertilizer Production (×106 €) | Total Economic Gain from Biogas Production (×106 €) |
| 2012 | 85.3 | 722,523 | 722,608 | 52.2 | 397,360 | 397,412 |
| 2013 | 108.8 | 800,751 | 800,860 | 54.7 | 428,420 | 428,475 |
| 2014 | 90 | 840,266 | 840,356 | 53.9 | 413,480 | 413,534 |
| 2015 | 102.5 | 850,201 | 850,304 | 55.4 | 421,680 | 421,735 |
| 2016 | 95 | 847,649 | 847,744 | 51.2 | 426,060 | 426,111 |
| 2017 | 79.2 | 852,800 | 852,879 | 57.5 | 442,280 | 442,338 |
| 2018 | 80.5 | 992,147 | 992,228 | 56.4 | 448,040 | 448,096 |
| 2019 | 78.5 | 1,024,183 | 1,024,262 | 54.3 | 454,860 | 454,914 |
| 2020 | 93.9 | 1,064,757 | 1,064,851 | 60.6 | 455,400 | 455,461 |
| 2021 | 78.7 | 1,082,653 | 1,082,732 | 62.2 | 445,980 | 446,042 |
| Total | 892.4 | 9,077,930 | 9,078,824 | 558.4 | 4,333,560 | 4,334,118 |
Disclaimer/Publisher’s Note: The statements, opinions and data contained in all publications are solely those of the individual author(s) and contributor(s) and not of MDPI and/or the editor(s). MDPI and/or the editor(s) disclaim responsibility for any injury to people or property resulting from any ideas, methods, instructions or products referred to in the content. |
© 2023 by the authors. Licensee MDPI, Basel, Switzerland. This article is an open access article distributed under the terms and conditions of the Creative Commons Attribution (CC BY) license (https://creativecommons.org/licenses/by/4.0/).
Share and Cite
Ertop, H.; Atilgan, A.; Kocięcka, J.; Krakowiak-Bal, A.; Liberacki, D.; Saltuk, B.; Rolbiecki, R. Calculation of the Potential Biogas and Electricity Values of Animal Wastes: Turkey and Poland Case. Energies 2023, 16, 7578. https://doi.org/10.3390/en16227578
Ertop H, Atilgan A, Kocięcka J, Krakowiak-Bal A, Liberacki D, Saltuk B, Rolbiecki R. Calculation of the Potential Biogas and Electricity Values of Animal Wastes: Turkey and Poland Case. Energies. 2023; 16(22):7578. https://doi.org/10.3390/en16227578
Chicago/Turabian StyleErtop, Hasan, Atilgan Atilgan, Joanna Kocięcka, Anna Krakowiak-Bal, Daniel Liberacki, Burak Saltuk, and Roman Rolbiecki. 2023. "Calculation of the Potential Biogas and Electricity Values of Animal Wastes: Turkey and Poland Case" Energies 16, no. 22: 7578. https://doi.org/10.3390/en16227578
APA StyleErtop, H., Atilgan, A., Kocięcka, J., Krakowiak-Bal, A., Liberacki, D., Saltuk, B., & Rolbiecki, R. (2023). Calculation of the Potential Biogas and Electricity Values of Animal Wastes: Turkey and Poland Case. Energies, 16(22), 7578. https://doi.org/10.3390/en16227578