Abstract
Earthing and protective devices such as line surge arrestors (LSAs) play an important role in areas with high lightning occurrence for overhead HVAC lines’ performance. A lightning stroke of high magnitude can lead to back flash-overs, and the resultant power surge on the phase conductor can cause instigate the line breaker operating to extinguish the power surge. This operation of the protective devices leads to consumer interruptions on the network, a loss of production, and negatively affects the economy. Studies have shown that reducing an earthing system’s values, which itself is costly, may not be sufficient to prevent back flashover and the associated customer production cost loss. A code was developed to determine the possibility of back flashover and the cost of various earthing schemes utilizing the MATLAB software analysis tool. This paper determines the possibility of a back flashover for various combinations of lightning strokes and earthing profiles. Tower Footing Resistances as low as 9.8 Ω can cause back flashover, provided the lightning stroke exceeds 12 kA. Furthermore, the paper presents and discusses an innovative hybrid power line protection scheme, which estimates and considers the high cost associated with establishing an earthing system; it examines the impracticality of re-engineering an earthing scheme for implementation and results obtained by the inclusion of lightning surge arrester’s (LSA). The cost-saving resulting from dips is also established over 25 years for an 88 kV line, and the breakeven point is established. The results showed that the best scenario would be to reduce the tower footing resistance to 29.1 Ω and install 11 LSA per phase.
1. Introduction
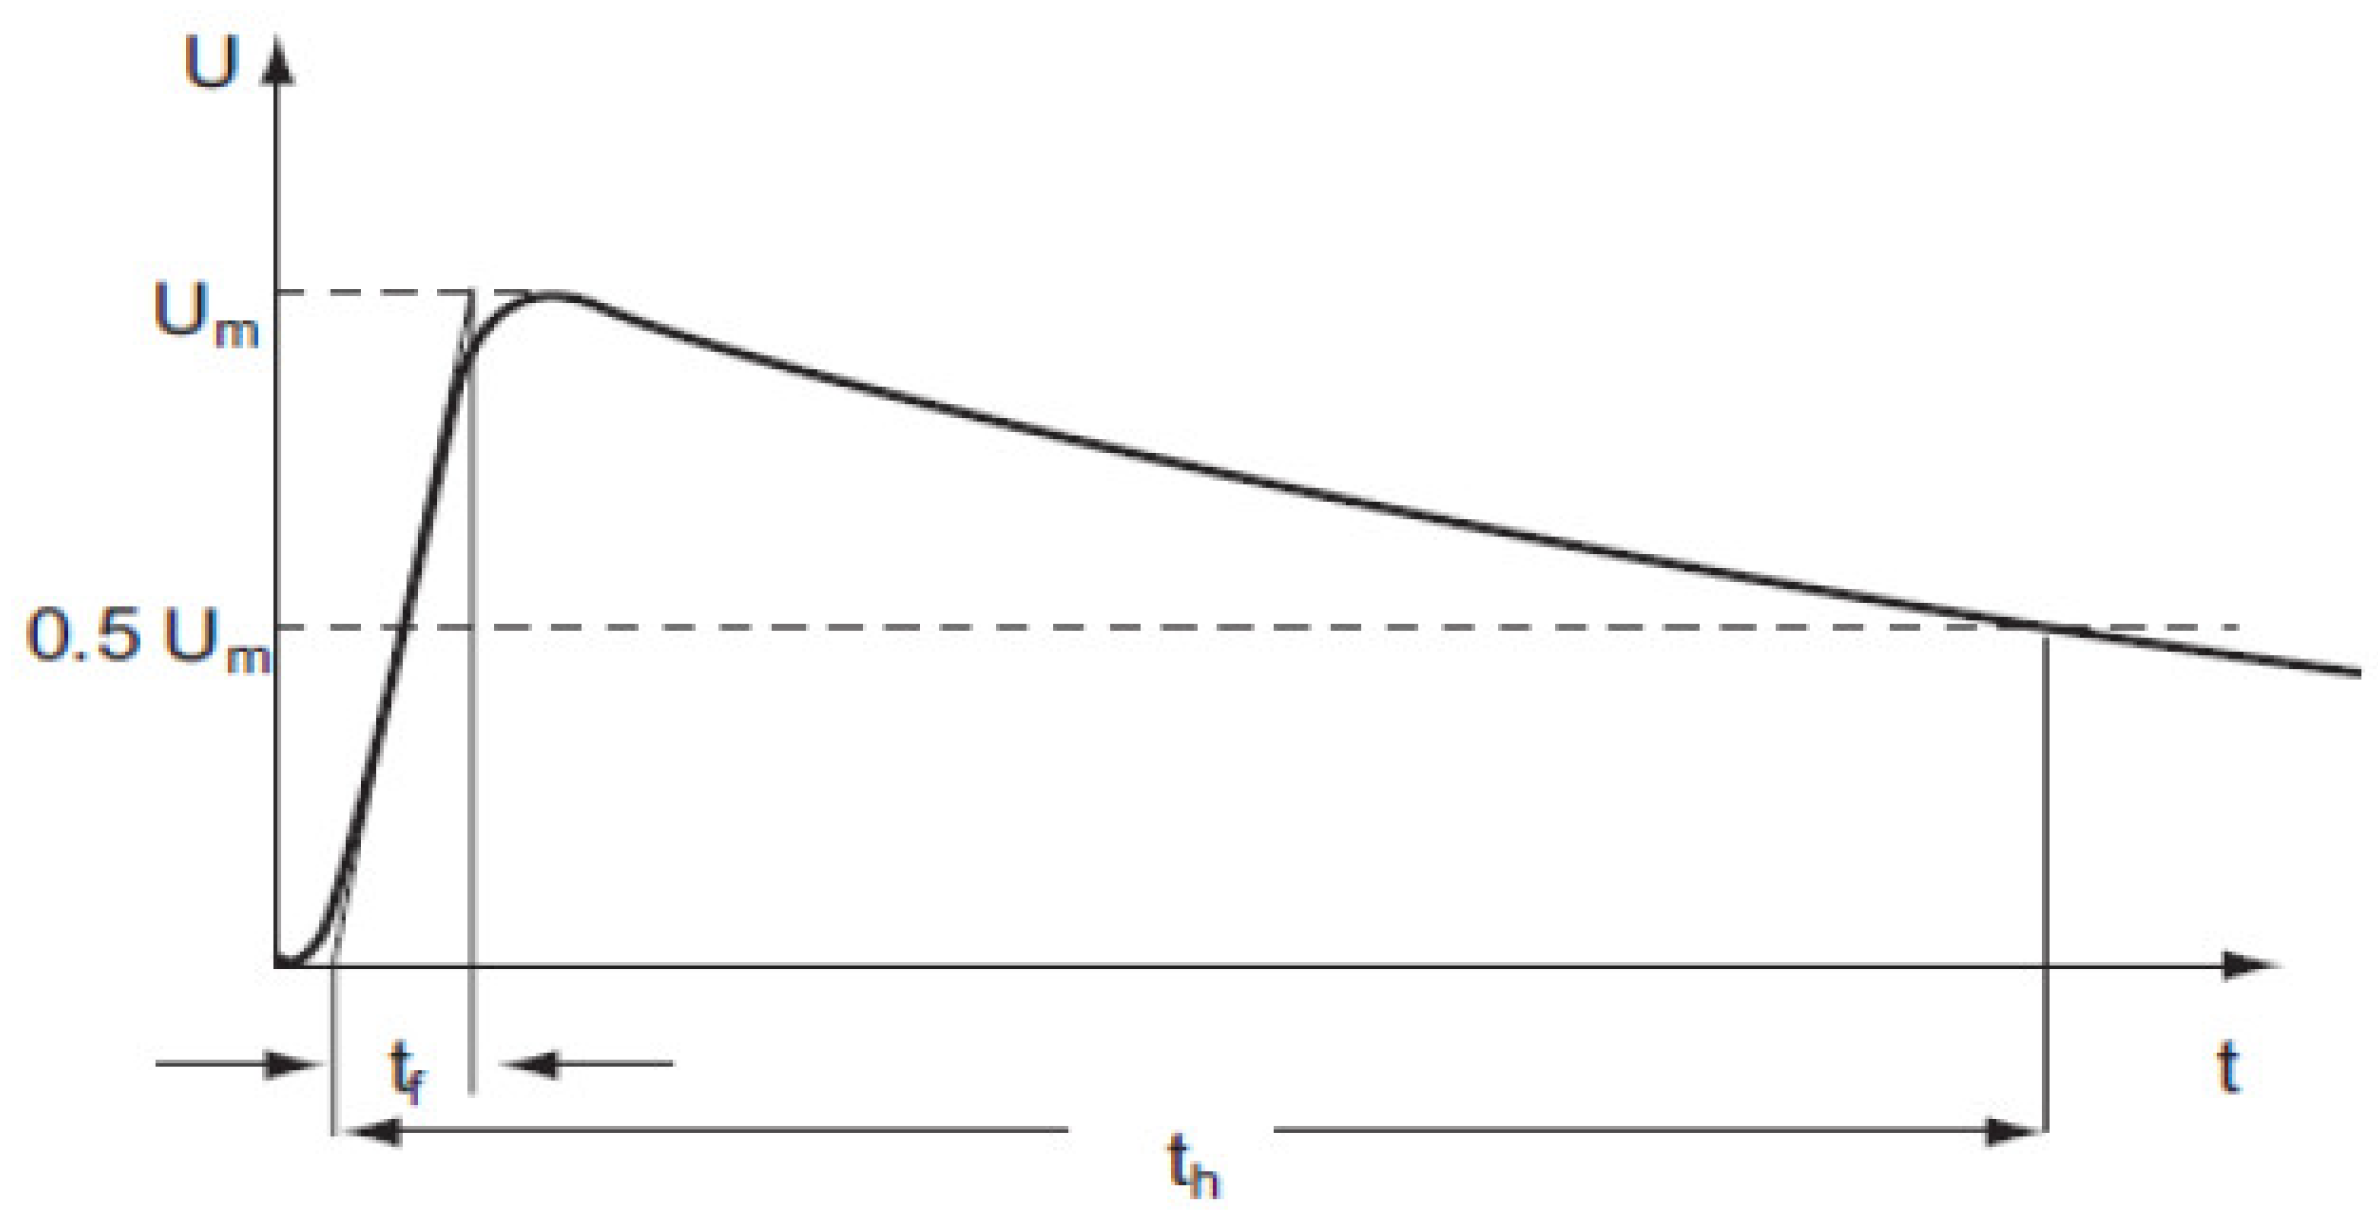
Shielded overhead steel lattice towers are used throughout South Africa to carry 88 kV and 132 kV power line networks. Generally, these power lines transverse high lightning corridors and are exposed to high lighting current magnitudes when the lightning strike occurs to or near the line. Lighting flashovers typically cause distribution line (88 kV and 132 kV) outages. Lightning flashovers are caused by three mechanisms: earth-wire shielding failure, back-flashovers, and induced over-voltages. Figure 1 shows an overvoltage waveform from lightning impulses, which are unipolar in nature. The average lightning impulse voltage includes a fast-rising front time reaching a peak, Um then by a decaying tail., front time tf is extrapolated from the 10% and 90% levels, whereas the decaying time of the tail th is computed as half the of the peak voltage as shown in Figure 1 [1]. Lightning tends to terminate on the earth-wire and/or tower of HVAC overhead lines. Factors such as the conductor/tower/soil impedance and magnitude of the strike play a critical role in determining the possibility of a flashover across the insulator. Studies have shown that reducing an earthing system’s values, which itself is costly, may not be sufficient to prevent back flashover and the associated customer production cost loss [2]. This is actually a short circuit created by a high current. The current splits and propagates along the line until extinguished by the line’s impedance or the line breaker operates. The current movement tends to compromise and reduce the lifespan of associated equipment like breakers and transformers and negatively impacts network performance. Should breakers operate, the resultant short duration outage and/or dips would negatively impact customers. Those customers with delicate appliances like electric motors, thereby coming to a standstill, stopping production and causing financial loss.
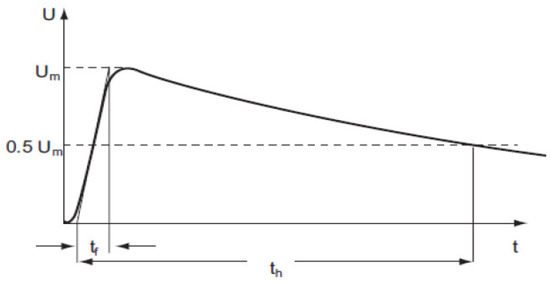
Figure 1.
Lightning impulse voltage waveform generated on the tower/line by lightning strike [1].
Studies have shown that reducing an earthing system’s values, which itself is costly, may not be sufficient to prevent back flashover and the associated customer production cost loss. A case study conducted by Khuluse [3] considered outlines and compares streamers’ behavior and surge arrestors on a 22 kV overhead line, especially after the fault. The results show that the lightning streamers clips the surge voltages more efficiently than surge arrestors. However, much more practical work, such as determining optimal sizing of streamers, has to be done on this comparison.
Research undertaken by Southey [4] compared the Wenner method to that of a “general method” The “general method” shows that the soil resistivity measurements need not be made with equally spaced electrodes. However, the potential electrodes can be located at arbitrary positions along a straight line joining the current electrodes. This research shows that the “general method” can improve deeper soil layer resistivity’s estimation and earthing values. These aspects can improve the accuracy of the variables such as tower top voltages, and hence the back flash overvalues. The rainfall frequency dictates earthing variations due to the wetness and dryness of the soil. The study undertaken by Selim [5] discusses and displays results conducted within a laboratory environment to maintain the earthing resistance system within its standard/accepted value according to the international safety code. This research needs to be enhanced practically and can play a valuable role in creating and maintaining a uniform earthing profile of the network throughout the year, which is critical for the work in this paper.
Practically measurements of the nonlinear electrode are shown in the research undertaken by Ramos-Leafios [6]. This method challenges the trusted electrode arrangement, which is in a linear formation. Results showed that due to electrodes placing in a confined area that have been combined with different measurement methodologies in a single traverse and acquiring more measurement points than for a single environment, the nonlinear process benefits from fewer tasks, and the calculated values of both methods are small. The research work published by Nzimande [7] indicated that customer surveys have recently been the most effective technique to evaluate the costs of voltage dips to the customer. The tracking of dip-related plant downtime and dips costs is an essential tool in quantifying voltage dips’ impact on the customer. Dip costs were obtained from the paper plant customer. The customer records estimated costs associated with each dip event. These dip costs are critical and used in this paper to determine the breakeven point between capital invested and cost-saving.
For transmission systems, the current practice is to possess resistance for tower footing less a limit. On an 88 kV system, the tower footing resistance should ideally be less than 30 Ω. This allows a large percentage of the lightning surges to be dissipated through the earthing systems. The “Fault Analysis and Lightning Location System’ FALLS software and database in reference [8] allow the measurement of the lightning stroke’s size and location to be calculated in greater detail the strokes from lightning. Preliminary analysis shows that the current line design can withstand only a portion of the strokes. This leads to the poor performance of the line under lightning conditions. Previously the actual magnitude of the lightning strokes was not known. Thus, further reducing the tower footing resistance (TFR) to values below 30 Ω up to 20 Ω results in the line withstanding a more significant portion of the strokes. Published results by [2] showed that even reducing the TFR to under 5 ohms, the line would still be unable to withstand lightning strokes more than 25 kA. Devices that mitigate lightning, such as line surge arrestors (LSAs), can be placed in existing transmission systems to improve system performance. The LSA reduces/or eliminates the high magnitude power surge arising from back flashovers. This may help prevent the network breaker from operating and improving the security of supply and power quality.
2. Methodology
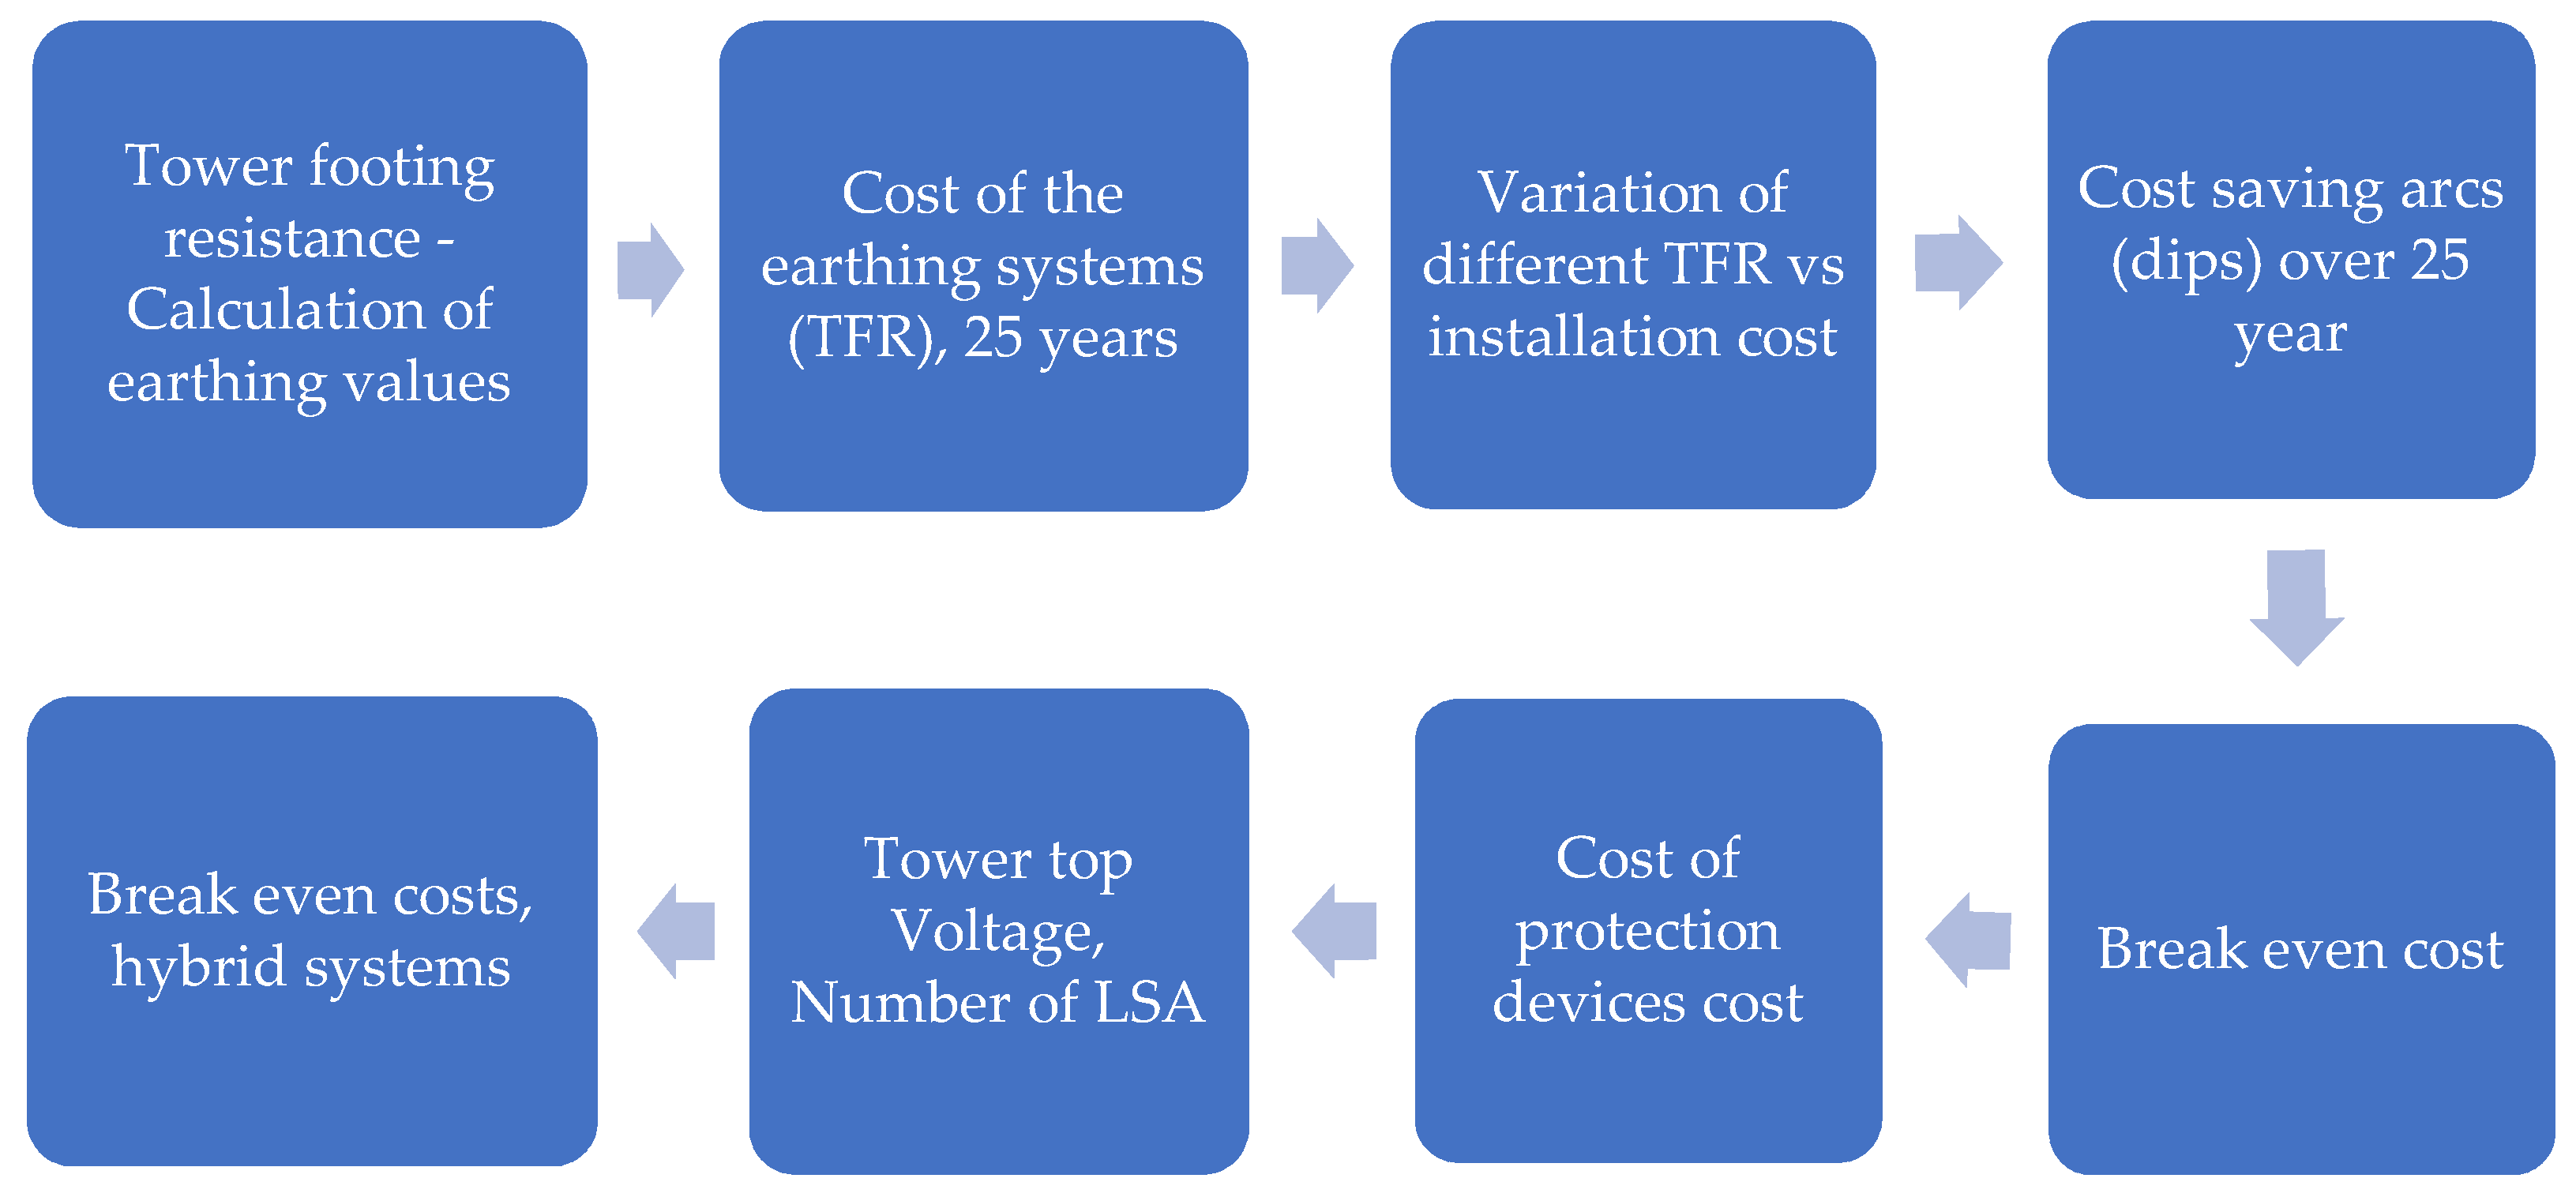
Figure 2 describes the process followed to determine the type of hybrid system and the breakeven cost. This process can be followed to determine the cost to achieve earthing profiles of various values, the cost-saving resulting from dip prevention, the power surge magnitude on the conductor in the phase, and the number of surge arresters needed for draining the power surge into the ground. The breakeven cost is also determined.
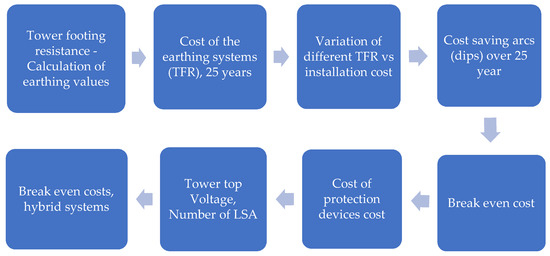
Figure 2.
Process diagram to determine breakeven cost w.r.t earthing enhancement, the needed number of surge arresters, and cost-saving in preventing interruptions in power.
Genetic models are created utilizing MATLAB programming, which is used to evaluate different “blocks” outputs. Some of the key models are discussed in more detail in the following sections.
2.1. Calculation of the Earthing Values
The sub-routines, which are created in MATLAB show the variables, such as soil resistivity as the inputs to the program and the outputs been the earthing values. The sub-routine re-iterates until the earthing value is less than the input value. Thereafter the method that provides the lowest earthing value is identified and that value is used further in the program. This process is shown in Figure 3.
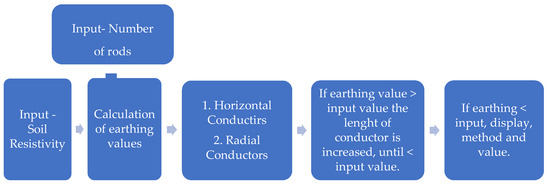
Figure 3.
Process to calculate the earth values.
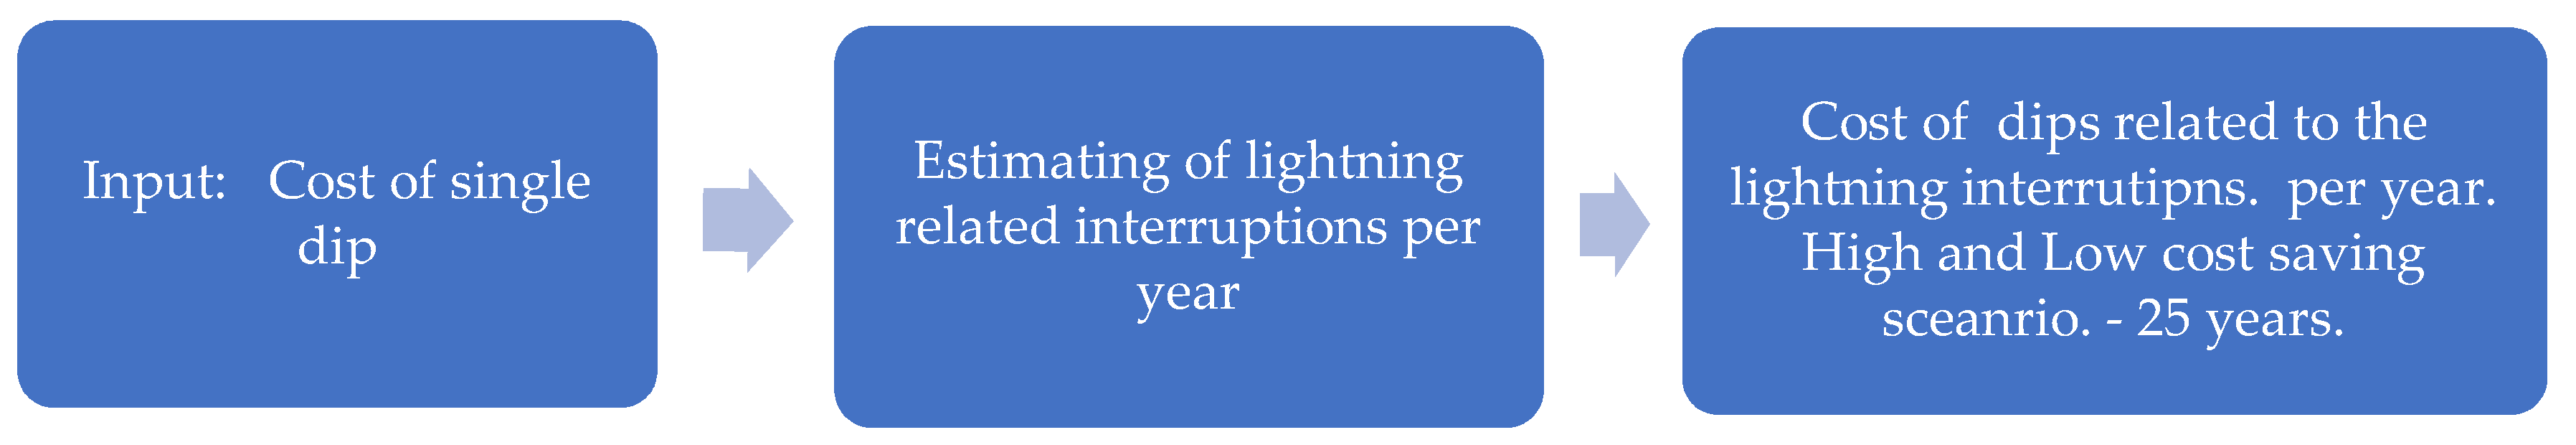
2.2. Calculation of the Cost of Dips
Figure 4 shows the process used to calculate the cost related to dips over 25 years. Dips arise when line breakers arcs. This can occur due to lightning strokes. The resultant consumer outage is associated with a cost. Depending on the number of lightning strokes and dips, an annual cost loss (or saving if dip can be prevented) can be calculated over 25 years.
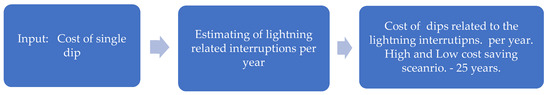
Figure 4.
Process to determine the cost of dip saving.
2.3. Cost of Earthing Systems
The earthing values required would dictate the amount of conductor required, which in turn, determines the earthing cost of the system. This process is shown in Figure 5. The MATLAB subroutine created is based on the following process.
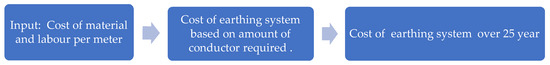
Figure 5.
Process to determine the earthing system cost over 25 years.
2.4. Calculation of the Tower Top Voltage
Figure 6 show the process that would be followed to determine the tower top voltage.
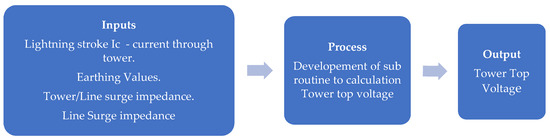
Figure 6.
Process to determine the Tower Top Voltage.
Ic is a function of the wave travel time within the tower. The MATLAB subroutine calculates the tower top voltage for various lightning strokes. The subroutines contain a small database that contains the magnitude of the lightning that could be chosen. The tower top voltage, if it exceeds the insulator flash overvoltage would result in the back flashover and give rise to the phase voltage.
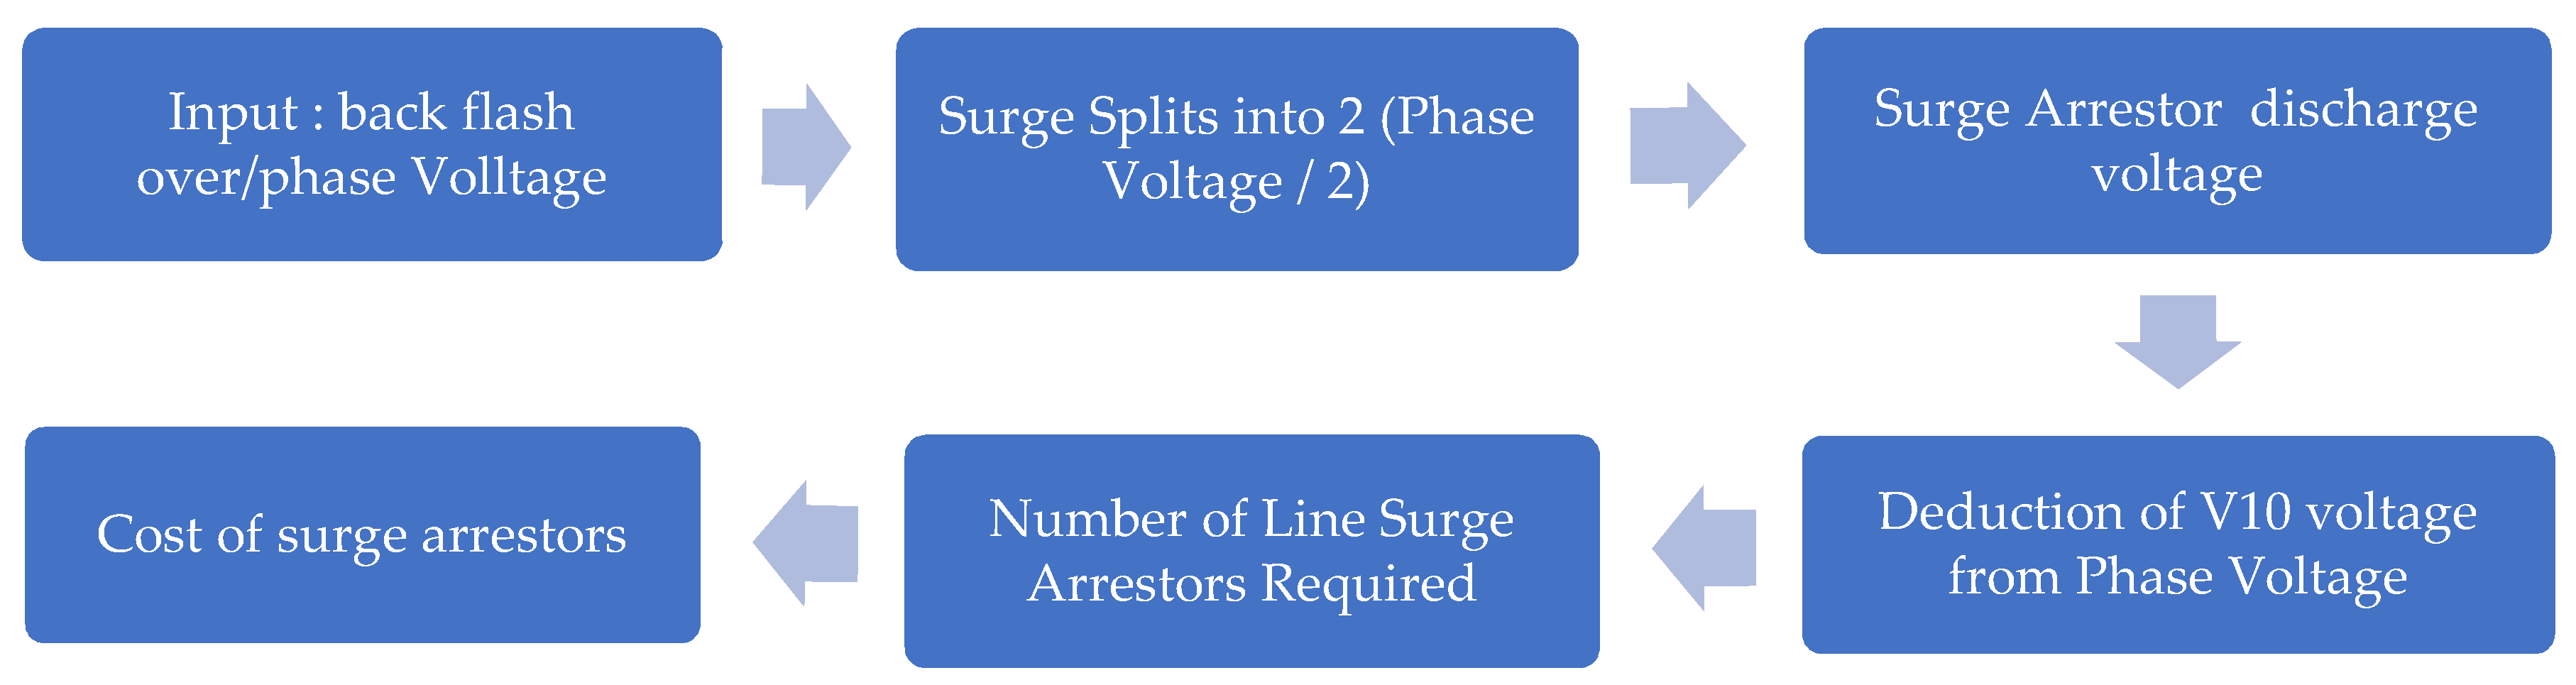
2.5. Calculation of the Number of Surge Arrestors
The over-voltage surge caused by the lightning stroke may result in a back flashover. Figure 7 illustrates the process required to calculate the required number of surge arrestor. This is a simple process of deduction the overvoltage on the phase conductor (remember that this splits into two) by the V10 (discharge voltage) until the power surge is completely eliminated.
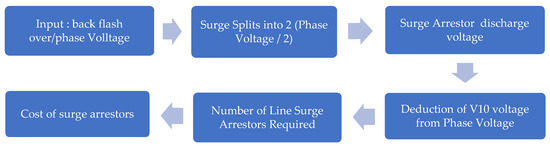
Figure 7.
The process used to calculate the required number of surge arrestors.
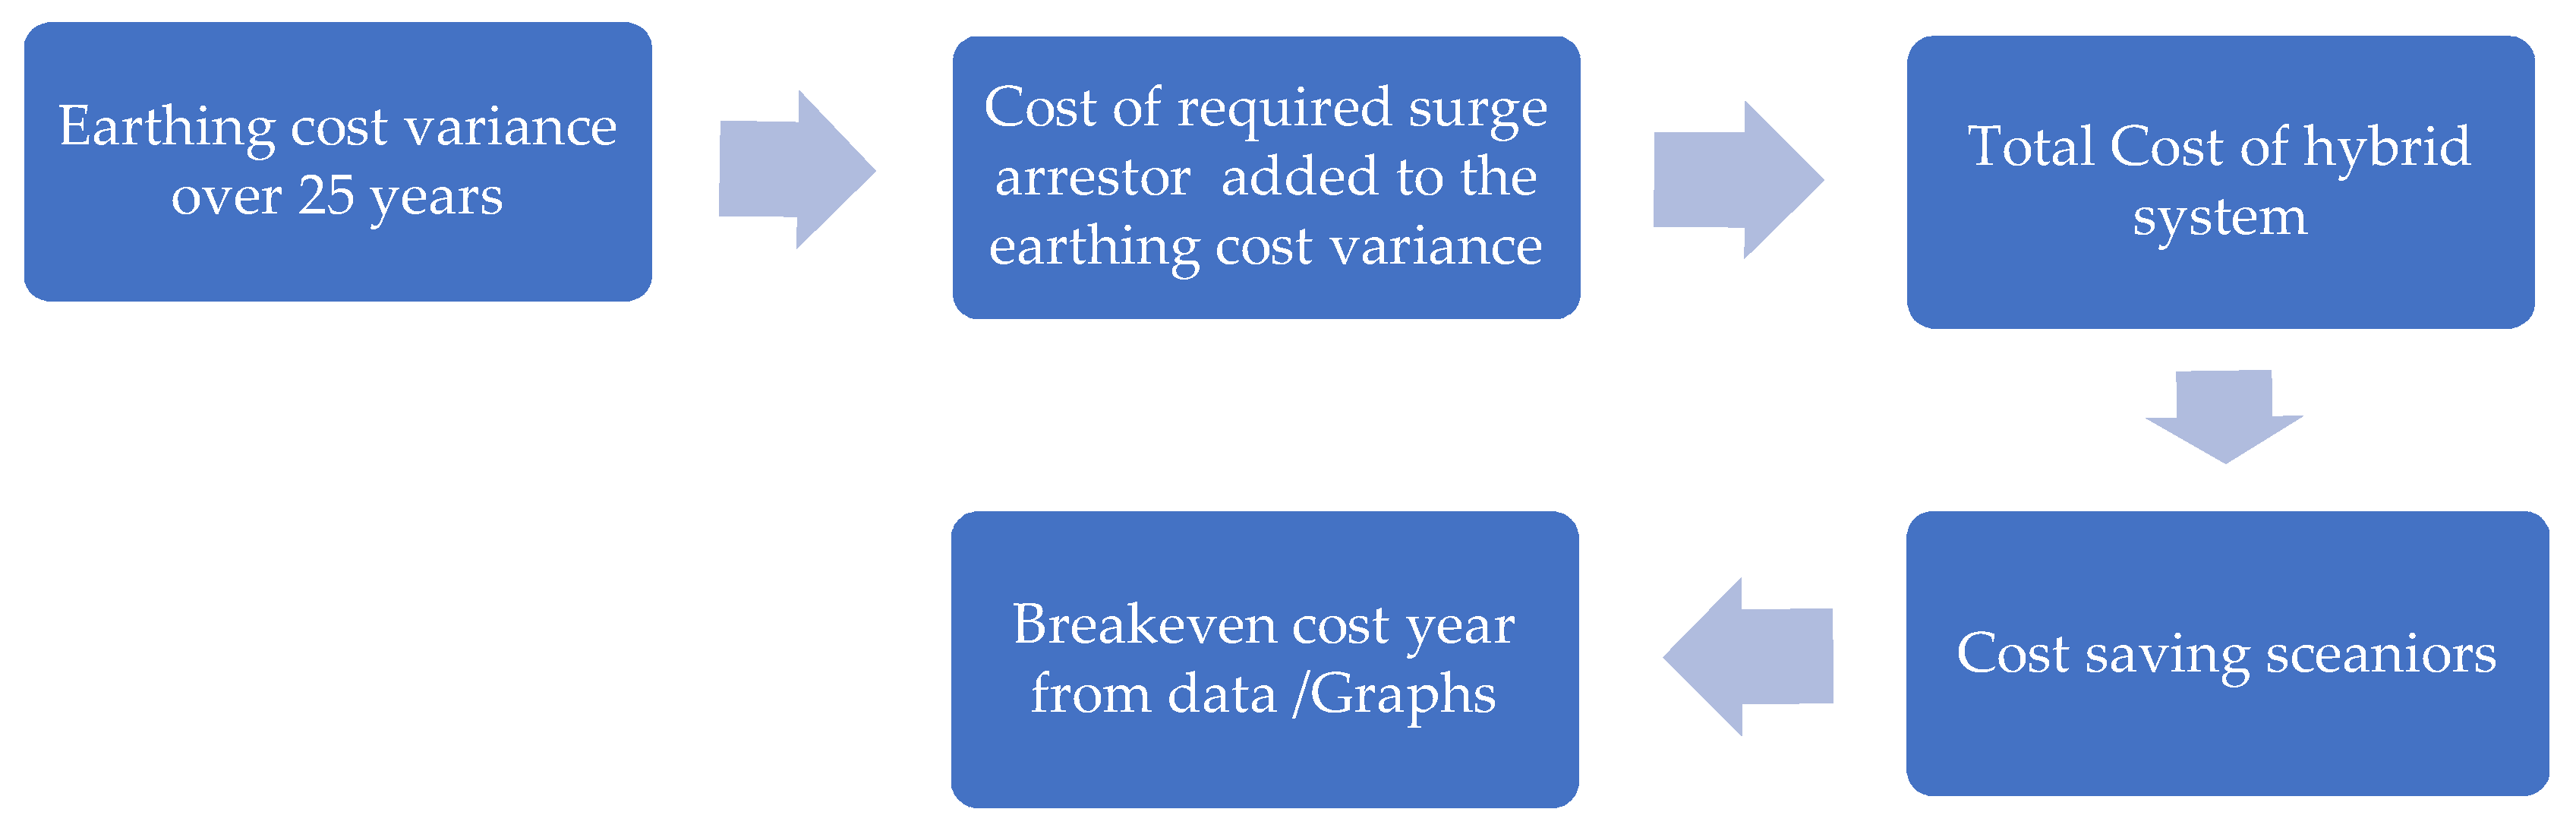
2.6. Break even Cost—Hybrid System
The process in Figure 8 involves a trade-off between the combined cost of the various earthing system and LSA vs. the cost-saving scenarios. This would be done over a 25 year period.
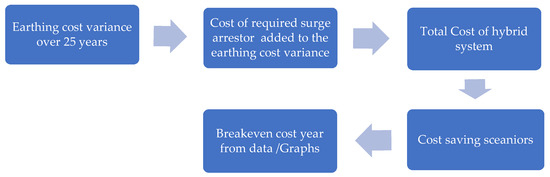
Figure 8.
The process used to calculate the break-even cost of the hybrid system.
3. Simulation and Results
3.1. Tower Footing Resistance—Earthing Methods and Configuration
There are different techniques of earthing and design available for improving tower footing resistance. There are different types of earth electrodes [9,10]. These are:
- (i.)
- Vertical electrode (Driven rod)
- (ii.)
- Horizontal electrode
- (iii.)
- Earthing grid
- (iv.)
- Ring electrode
Using MATLAB software, genetic frameworks to measure tower resistance were developed in accordance with the below equations. The programming was developed using the following formula [11,12].
Driven Rod:
Horizontal Electrode (crow’s foot):
Radial Conductors:
As such, the number of earthing rods used is denoted by r, the number of radials is denoted by n, and the resistance of the tower footing is given as R. The length and radius in meters for the conductor are given as L and α, respectively. L and h in meters are the buried length and depth of the electrode, respectively. The distance between rods is given as D, and the electrode’s diameter is given by d. The resistivity of the soil is demoted by ρ measured in Ω-m.
For MATLAB, the parameters are the software inputs, and the obtained tower footing measured resistance values are the output. Soil resistivity is presumed to have been consistent [4] and to differ in both wet (200 Ω-m) and dry (~1800 Ω-m) circumstances [13]. Table 1 indicates the findings collected from four studies.

Table 1.
Resistance to Tower Footing of various soil conditions.
Different requirements specify that the total resistors to the tower footing are less than 30 Ω for HVAC lines. Studies of cases 1, 2, and 3 indicate values above 30 Ω per case. Either the number of rods or the conductor length can vary in order to reduce the values below 30 Ω.
Two of the earthing configurations were modeled. These are the horizontal electrode and radial conductors. It was assumed at homogenous soil conditions to exist, and the following soil parameters were used. Resistivity for the upper level is 1000 Ω/m, and for the bottom layer, 500 Ω/m, i.e., case study 2 was simulated. Table 2 and Table 3 indicate the calculation.
Table 2.
Horizontal electrode.
Table 3.
Radial conductor.
Both earthing methods required the same amount of conductor to be utilized but in different configurations.
3.2. Cost of Earthing System
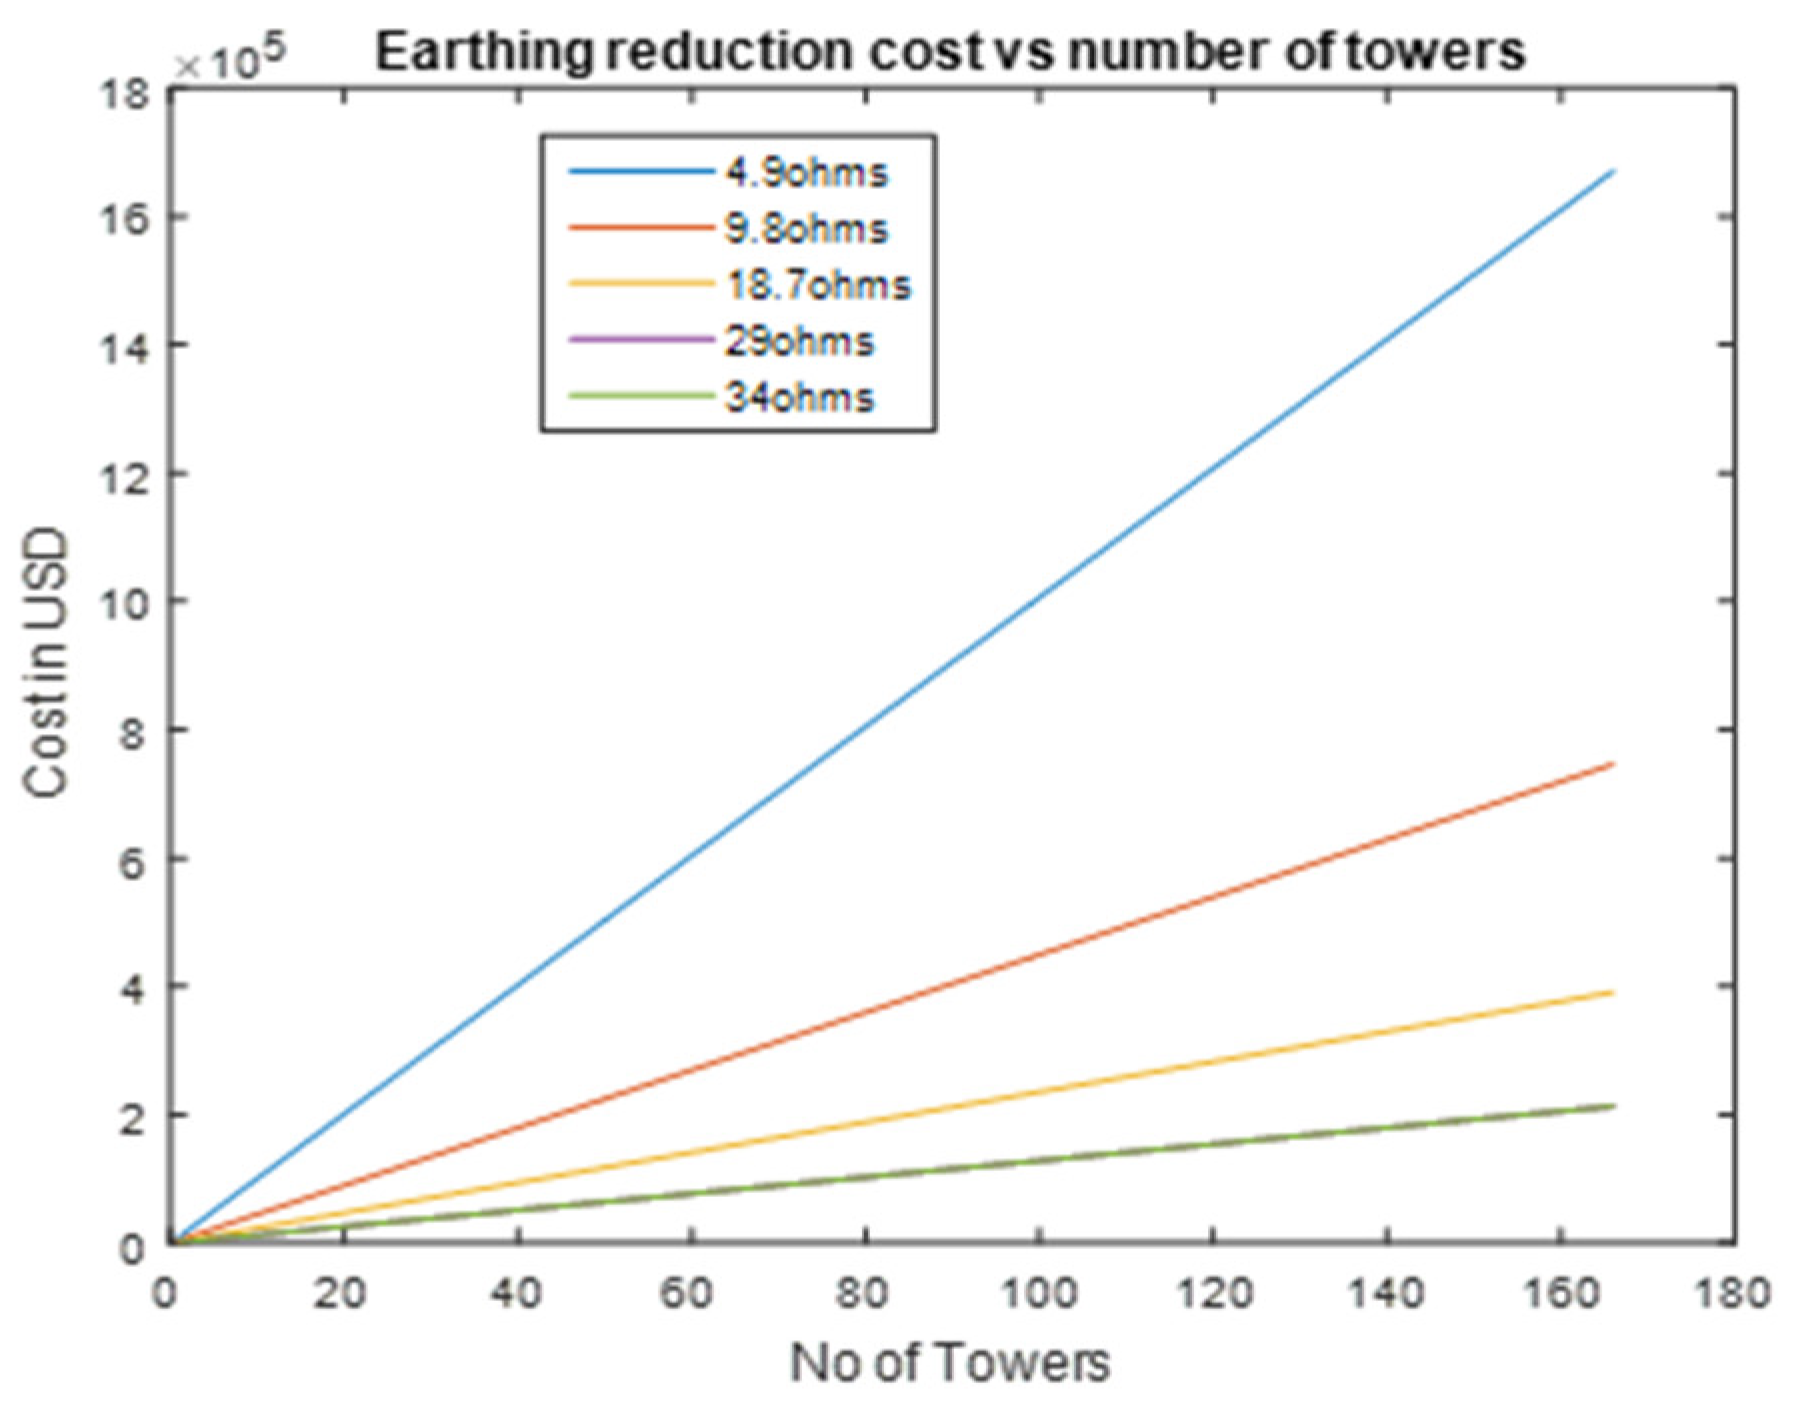
Copper clad flat bar earth straps can be used as the earth straps. These strap costs depend on the quality required and the number of towers that require these straps. Various studies are undertaken for a horizontal earthing system. This was modeled on an 88 kV HVAC line, line length of 49 km, and has 166 towers. Figure 9 illustrates the cost comparison to obtain different earthing profiles. The normalized cost estimates per meter that were used:
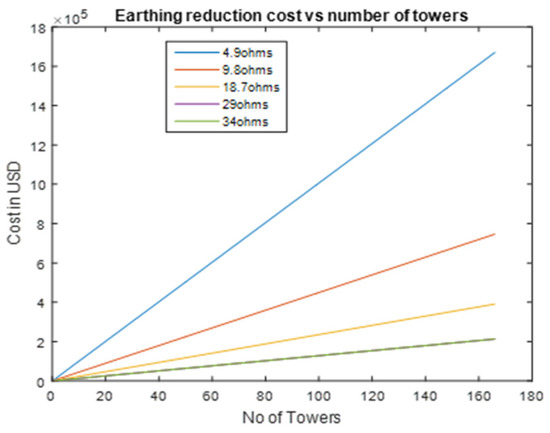
Figure 9.
Cost of earthing reduction for 166 towers.
- (a)
- Material cost is $11.30 per meter (including associated hardware).
- (b)
- Labor cost is $10.10 per meter.
MATLAB simulation was undertaken, whereby the length of the earthing strap was increased to obtain lower tower footing resistance. This is undertaken for the horizontal electrode method. It must be noted that a large number of conductors may have to be laid. This may not be practically possible due to the span lengths and terrain. The study assumes that the terrain is fairly uniformed in terms of soil conditions, i.e., the upper level has been 1000 Ω-m, and the lower level has been 500 Ω-m.
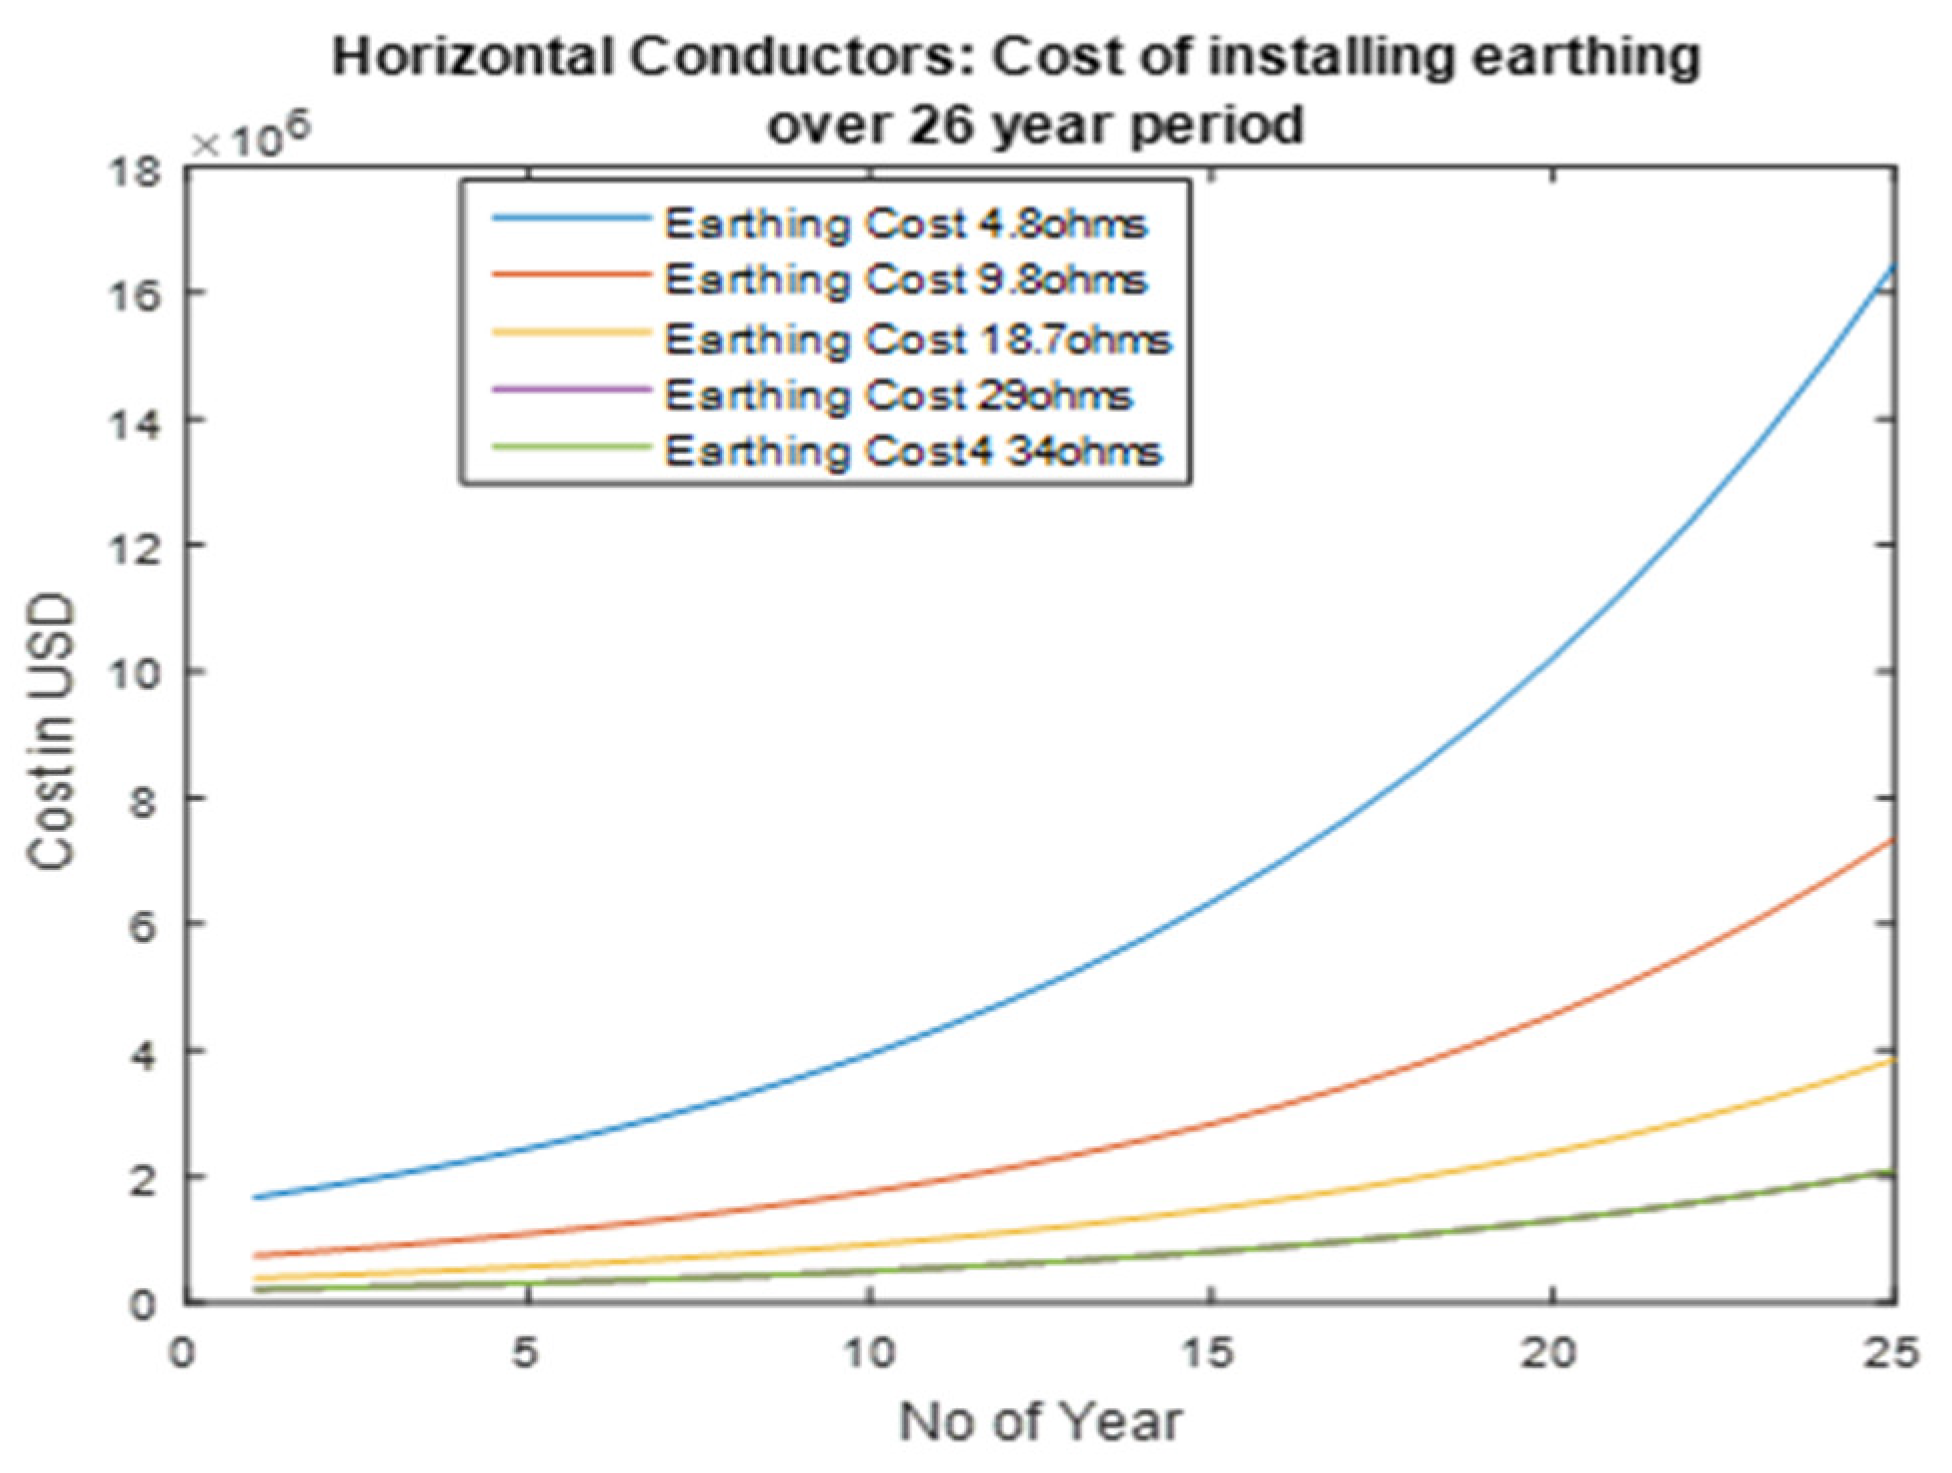
The cost that would be incurred to obtain an earthing profile of 4.9 Ω is substantial. This cost, approximately $1.6 million, is almost eight times that required for an 18.7 Ω uniform earthing value. It must be noted that this is for 166 towers. Published research [2] shows that uniform earthing values of 4.6 Ω may withstand a 12.5 kA stroke. For higher lightning stroke magnitude, there will be a back flashover. Figure 10 shows the cost associated with installing an earthing system to obtain an earthing profile for different values over 26 years. An escalation rate of 10% per annum was used.
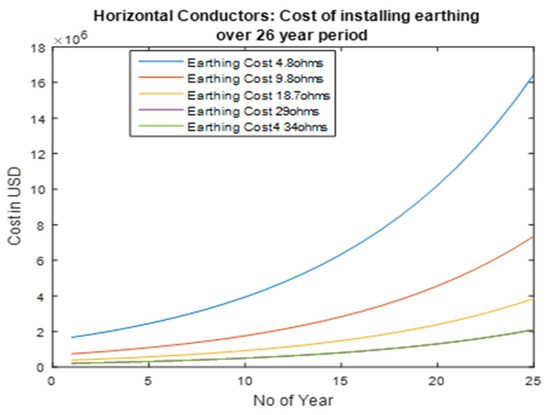
Figure 10.
Cost of installing an earthing system.
As expected, the cost estimate to obtaining a lower earthing value increases substantially as compared with that of obtaining a 29 Ω and 34 Ω system.
3.3. Cost Associated with Dips
- (a)
- Estimate the cost of voltage drops and temporary outages.
A study of Nzimande [7] found that lightning-related flashing causes losses of $5357 to $3485 an annum for ten plunges and an average of $535.70 to $3571 a year, respectively. These are 2003 dollars. In 2018 these figures would be $1143—low cost-saving scenario and $7425—high-cost saving scenario.
- (b)
- Annual expected voltage drops and temporary lightning outages.
Monitoring the submission overhead line’s output has shown that 106 lightning interrupts occurred between 2007 and 2011. The average interruption is 26 lightning-related per year.
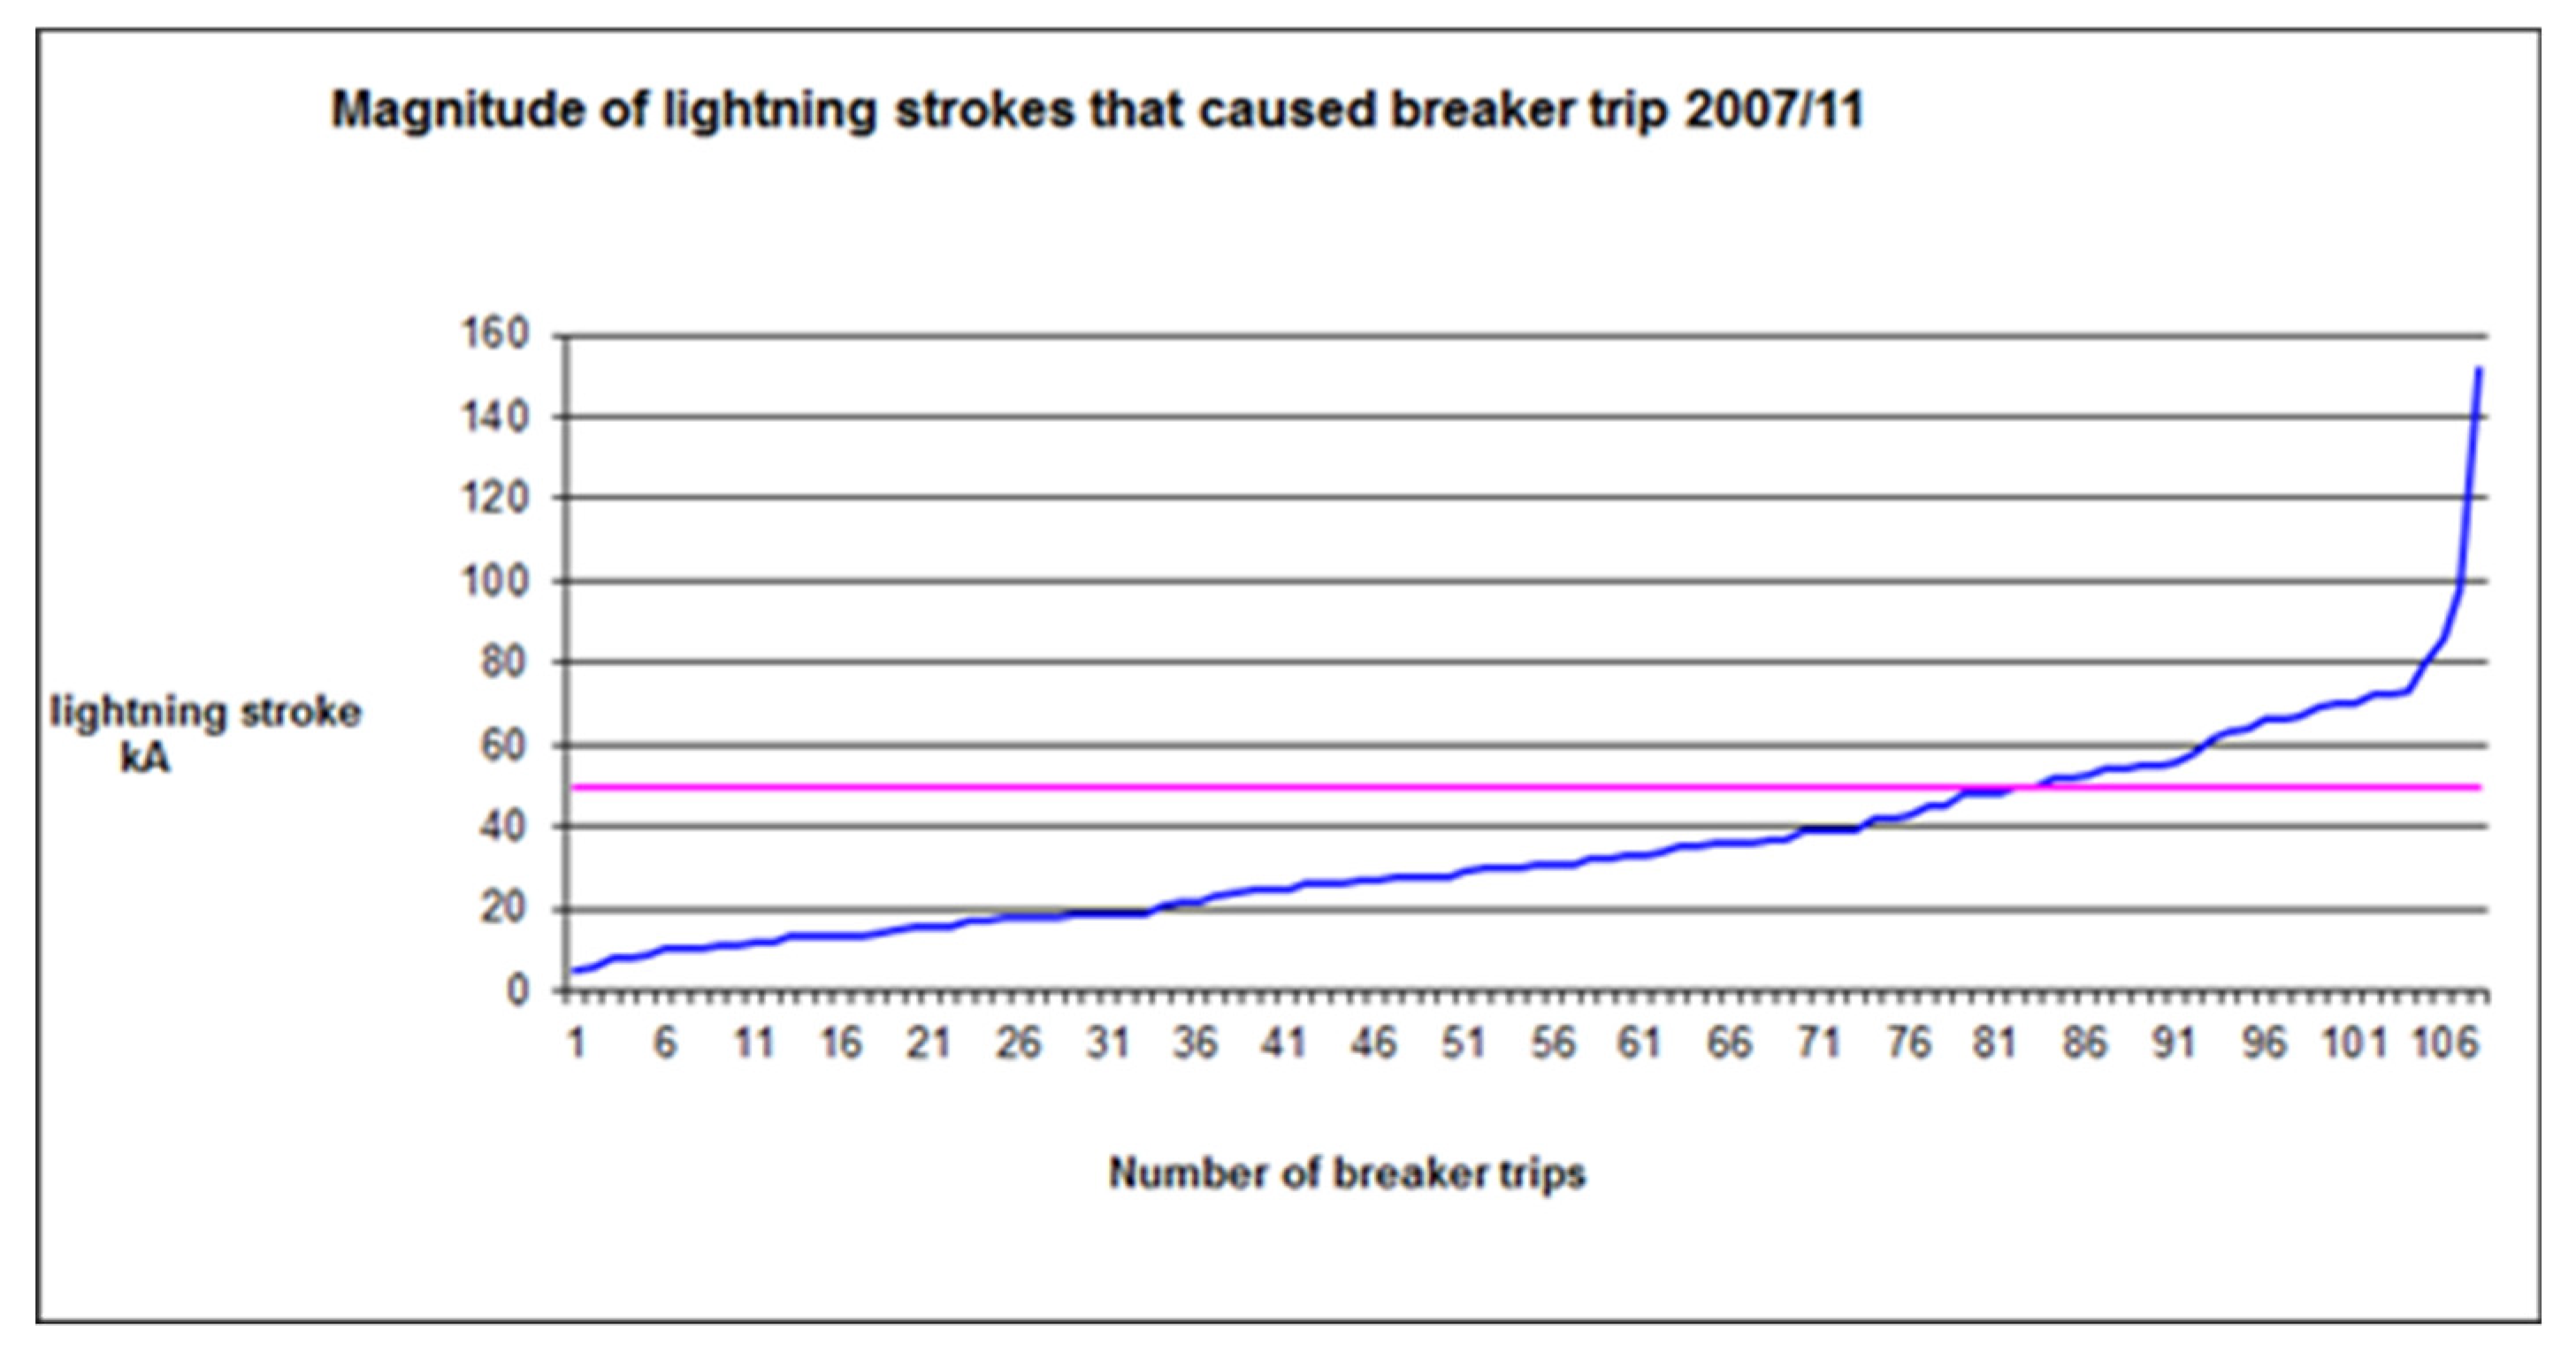
The number of disturbances over four years is shown in Figure 11 [2,14]. These interruptions were all triggered by flashing strikes within 1 km of line diameter. The corresponding strokes were obtained from the FALLS method for the interruption period [14]. Data analysis showed 106 breaker interruptions triggered by lightning during a four-cycle storm period. The lightning strokes were less than 50 kA and contributed to 83 of these interruptions. This is all about 78% of breaks. That is 21 per year on average.
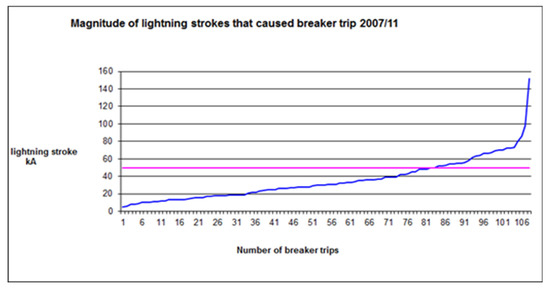
Figure 11.
The incident of breaker interruptions vs. stroke magnitude.
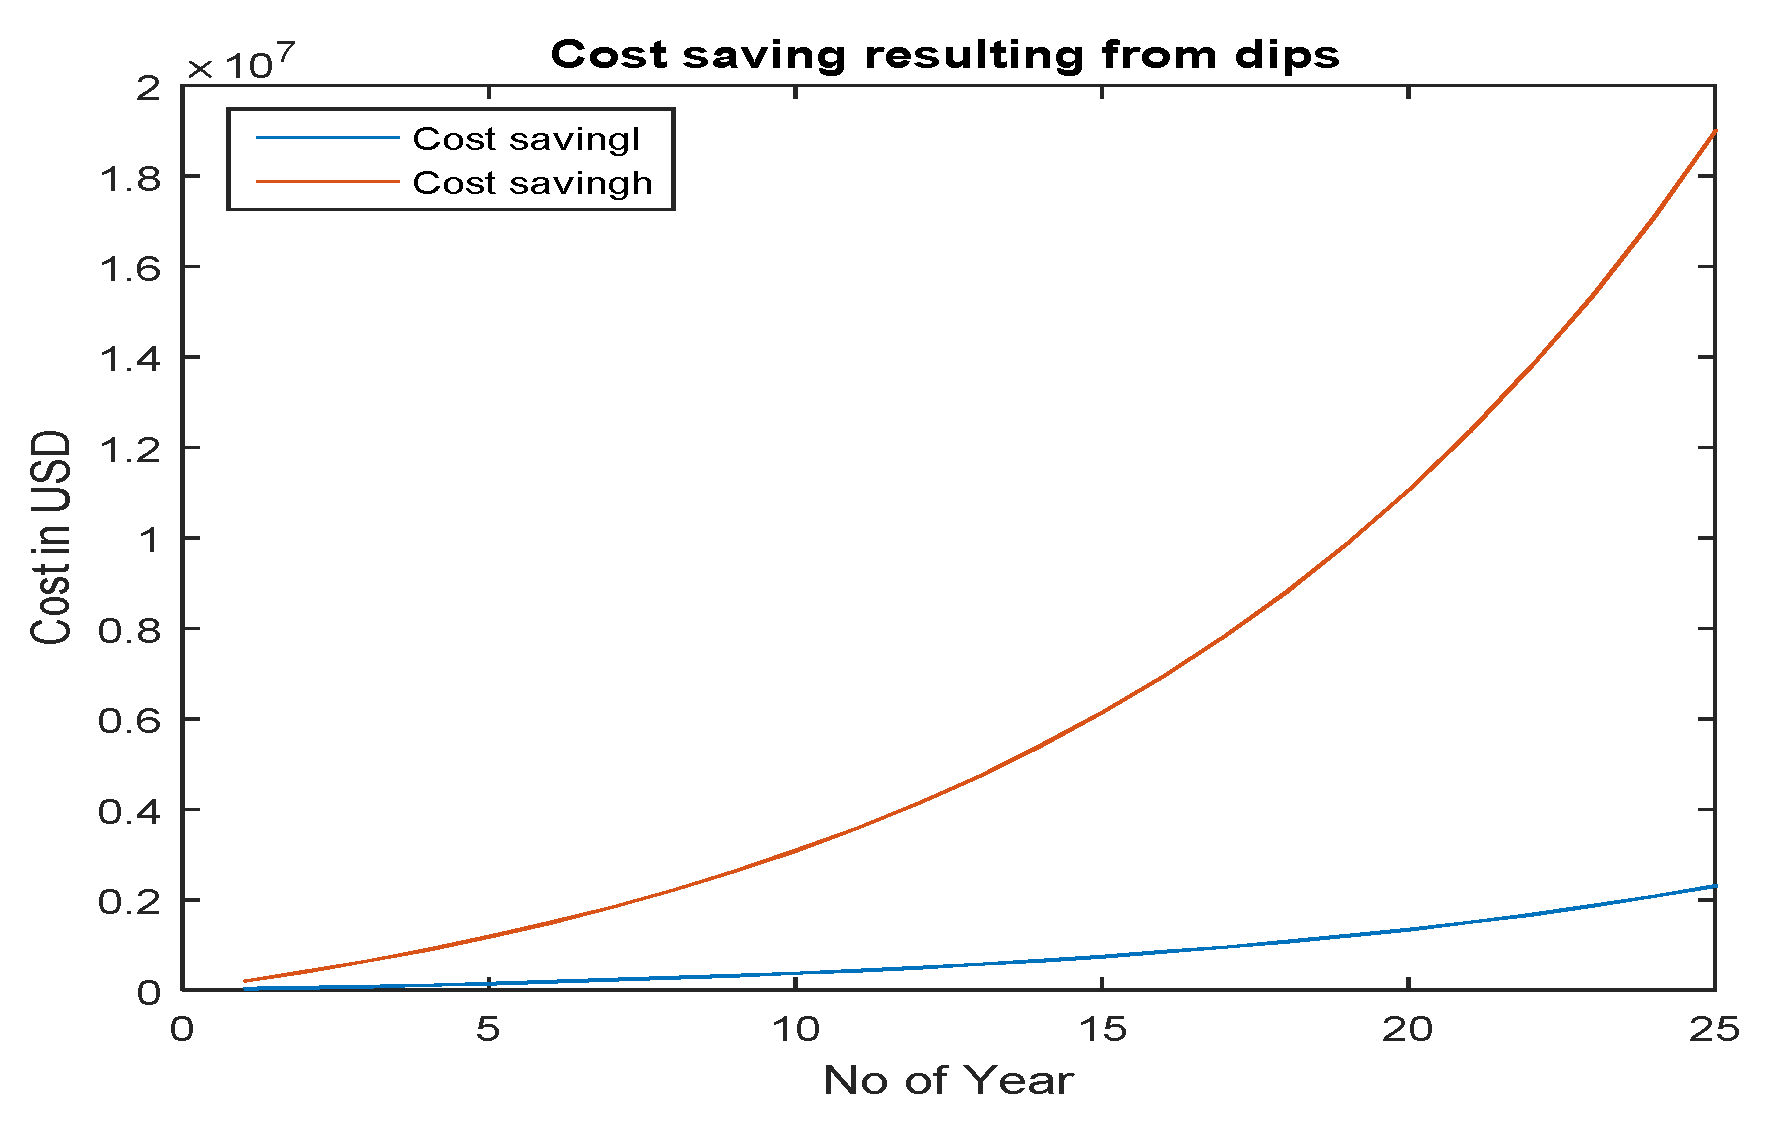
The cost savings for both the low and high-cost saving is shown in Figure 12 and is based in USD. An escalation rate of 10% per annum is assumed in both cases.
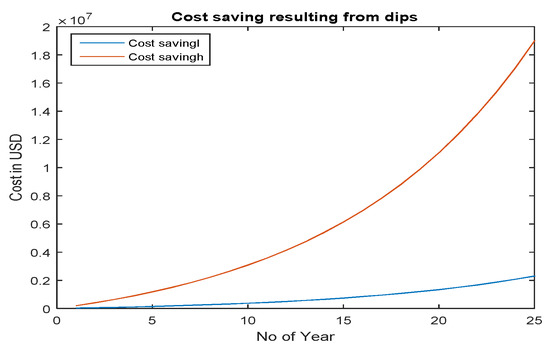
Figure 12.
Cost saving scenario’s resulting from dips.
3.4. Calculation of Tower Top Voltage
The high voltage in the tower results from the impedance of light, line and disturbance and the earth’s resistance. With earthing improvement strategies such as additional motors, the tower footing resistance decreases, but the tower top voltage also decreases. MATLAB subroutine was created and based on the theory and example illustrated by Dekker [11]. The following parameters are used as program inputs.
Ic—Current through the tower, which is determined by the lightning stroke.
R—Tower footing resistance
Zs—Line surge impedance.
Zt—Tower surge impedance.
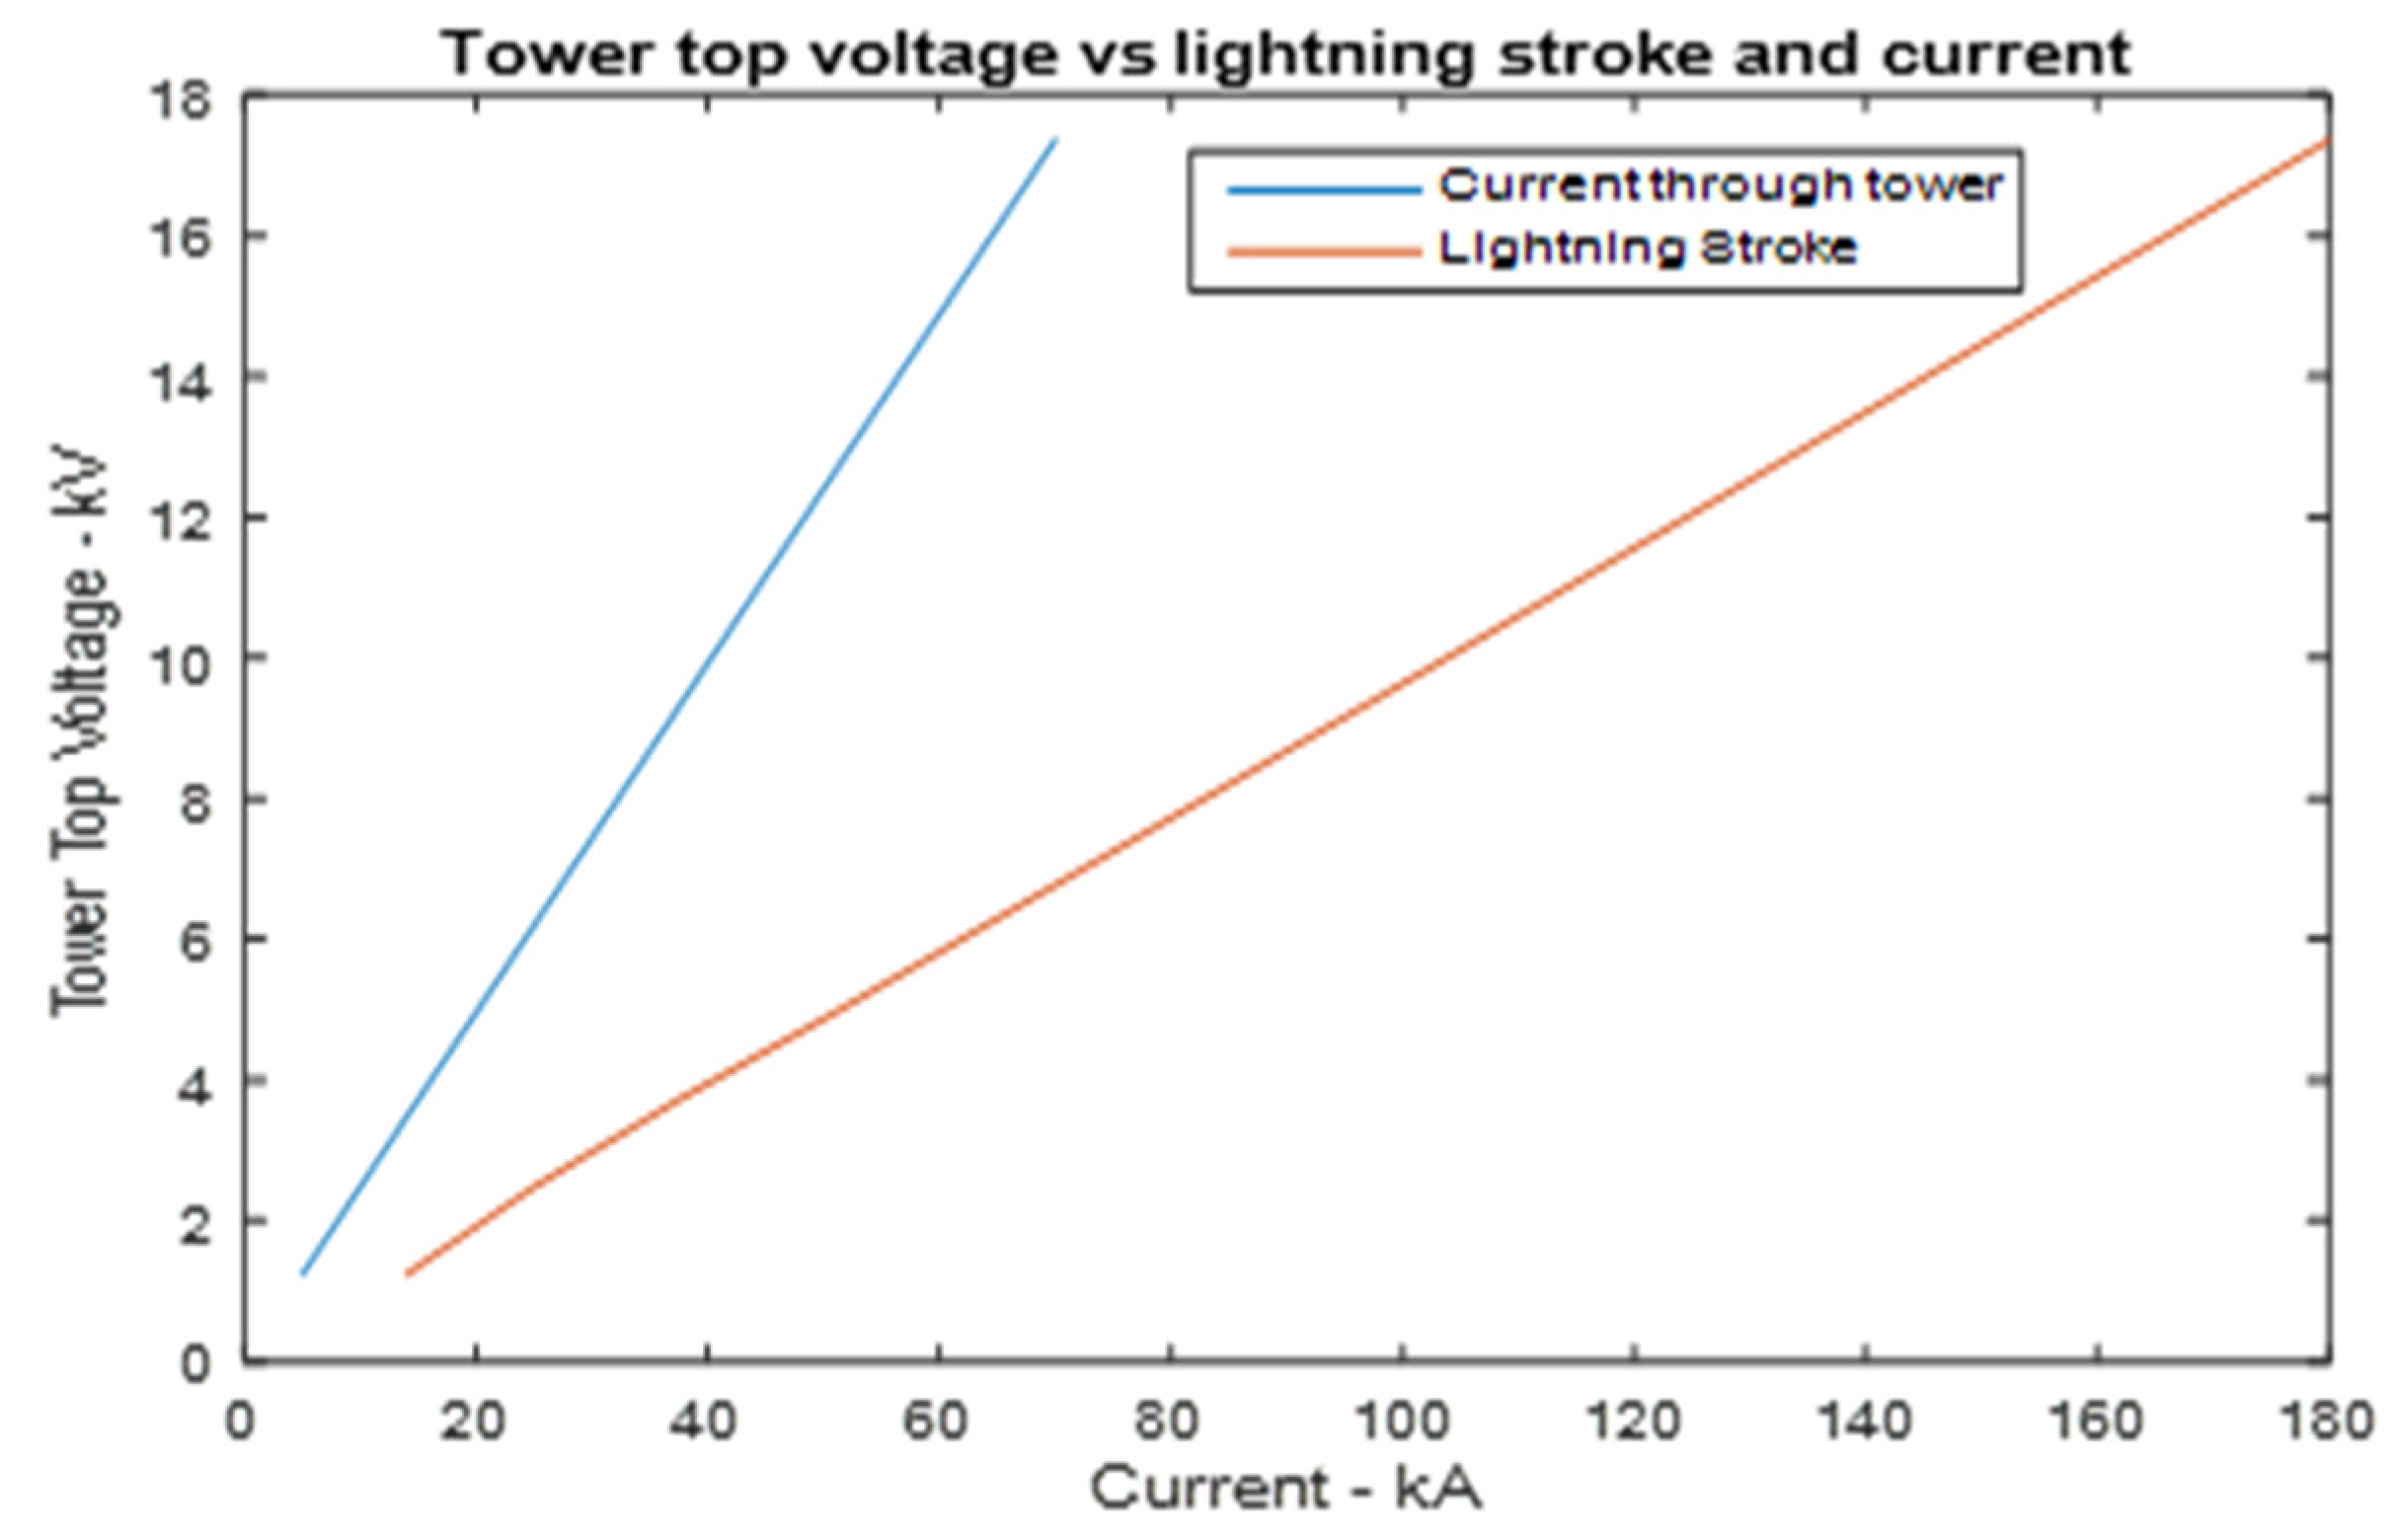
These parameters are calculated as part of other subroutines and those outputs are used as input into determining the tower top voltage [2,15]. The following tower top voltage for various lightning strokes was obtained as shown in Figure 13.
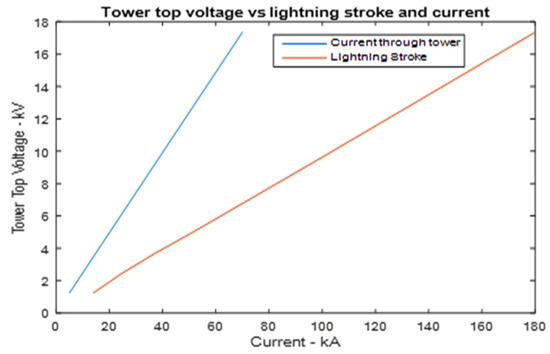
Figure 13.
Top Tower voltage vs. lightning current through the tower.
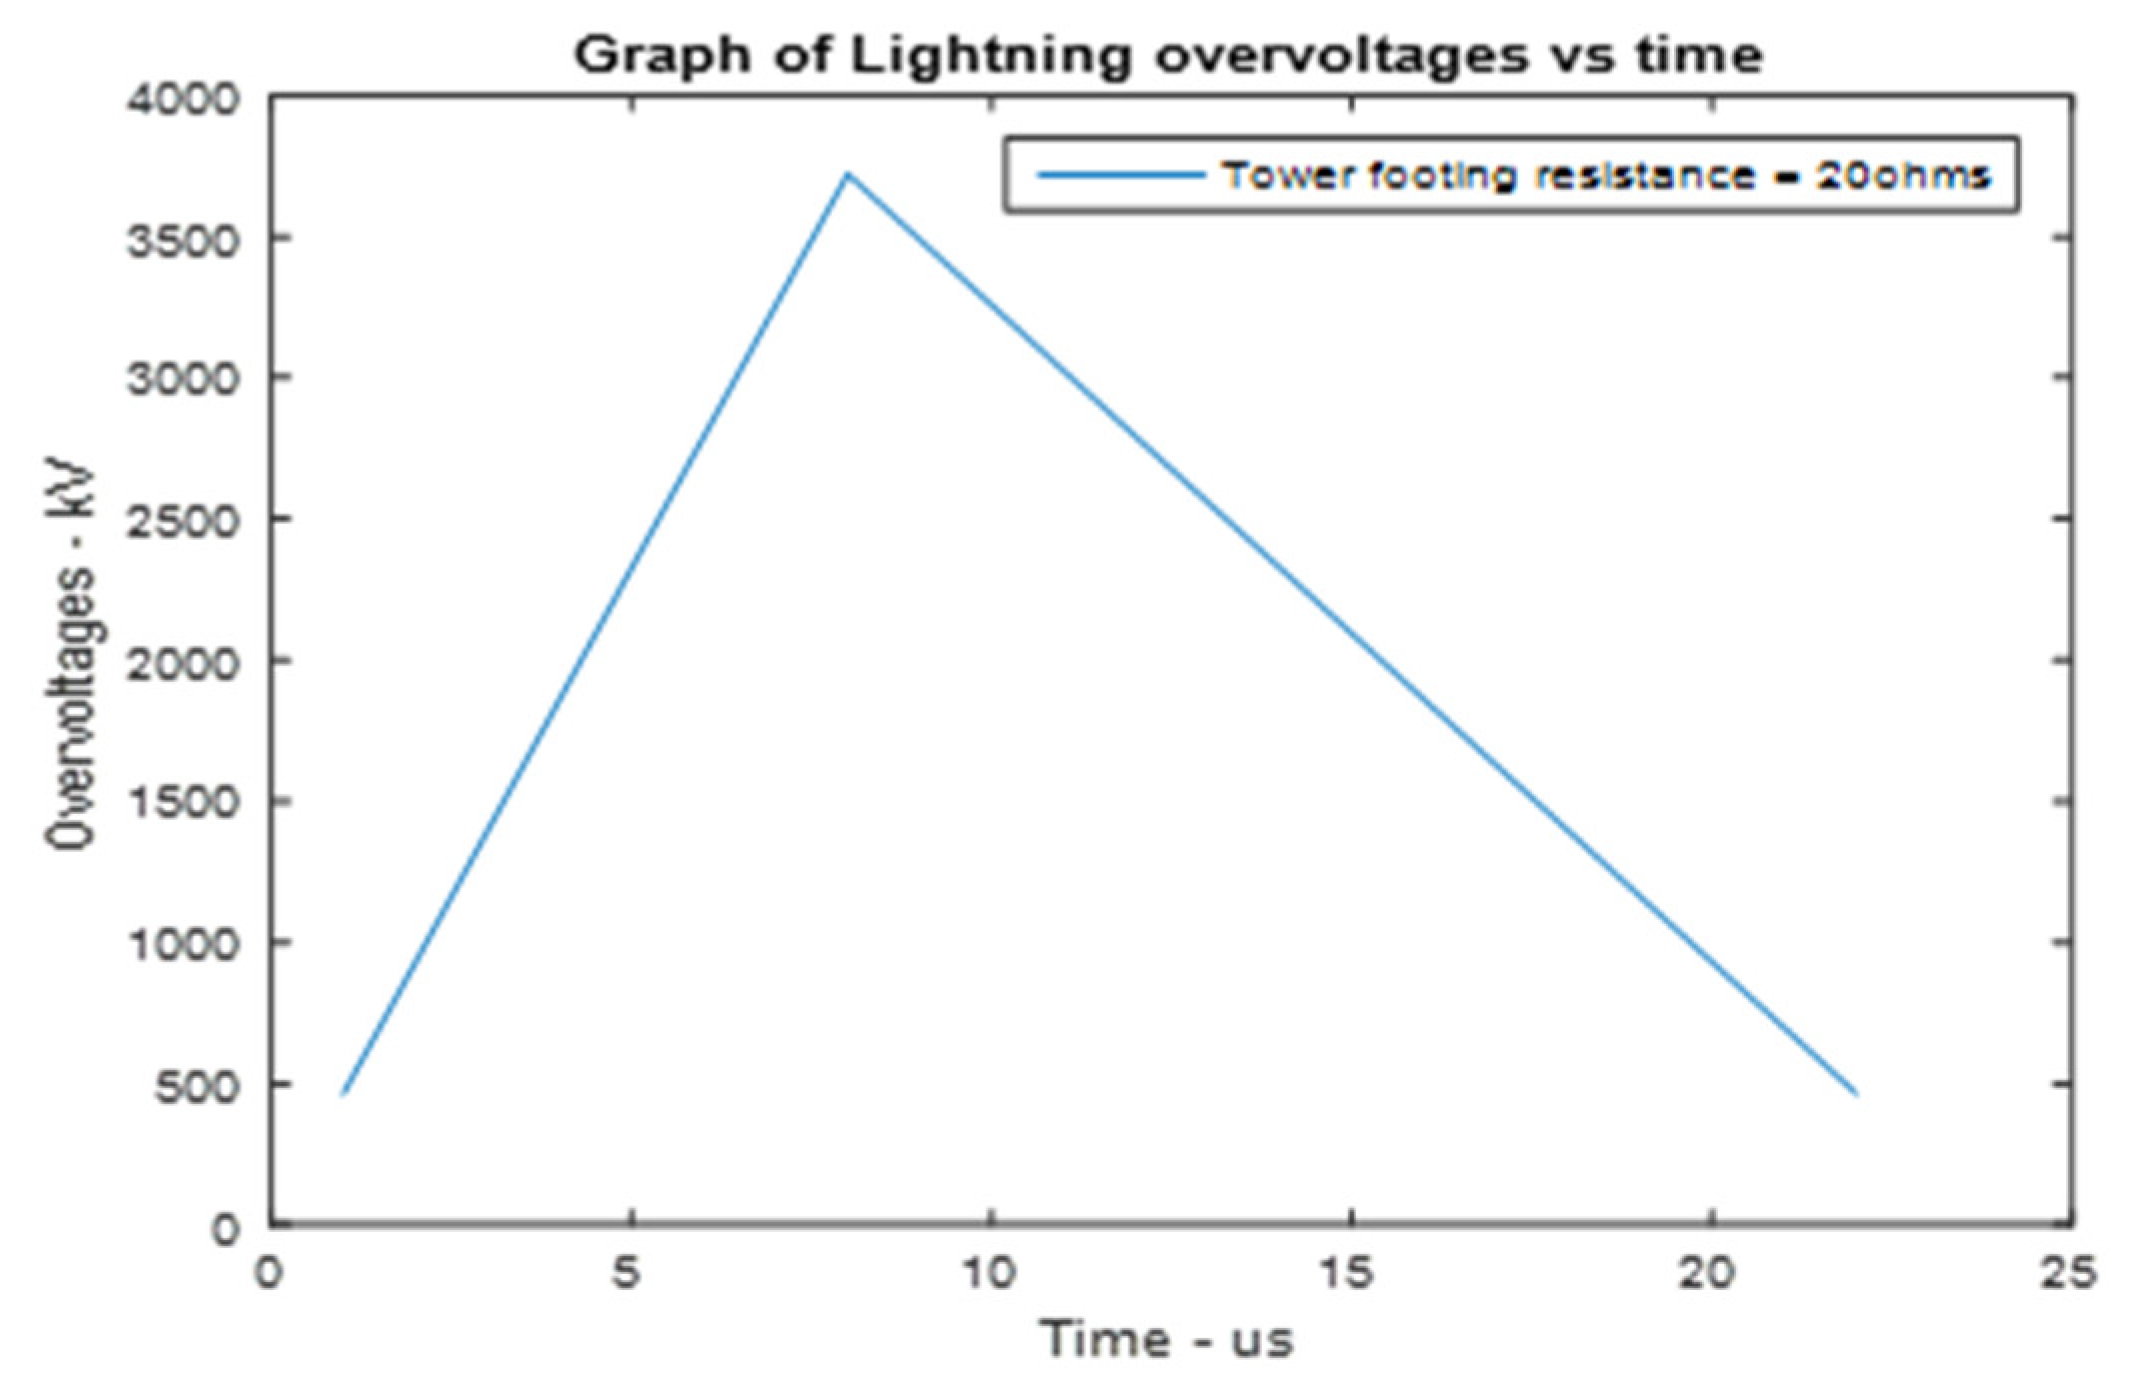
The only variable that suggests a linear relationship will be the intensity of the lightning strike. The magnitude of the tower’s top voltage corresponds to the flash current that passes through the tower is significant. The tower and overhead conductor’s impedance would result in the lightning current splitting [2], 15 kA of a 37.5 kA stroke would flow through the tower. This would give a peak overvoltage of 3720 kV [2,15]. The 8/20 microsecond wave shape is centered and shown in Figure 14.

Figure 14.
Over-voltages triggered by a 37.5 kA lightning stroke.
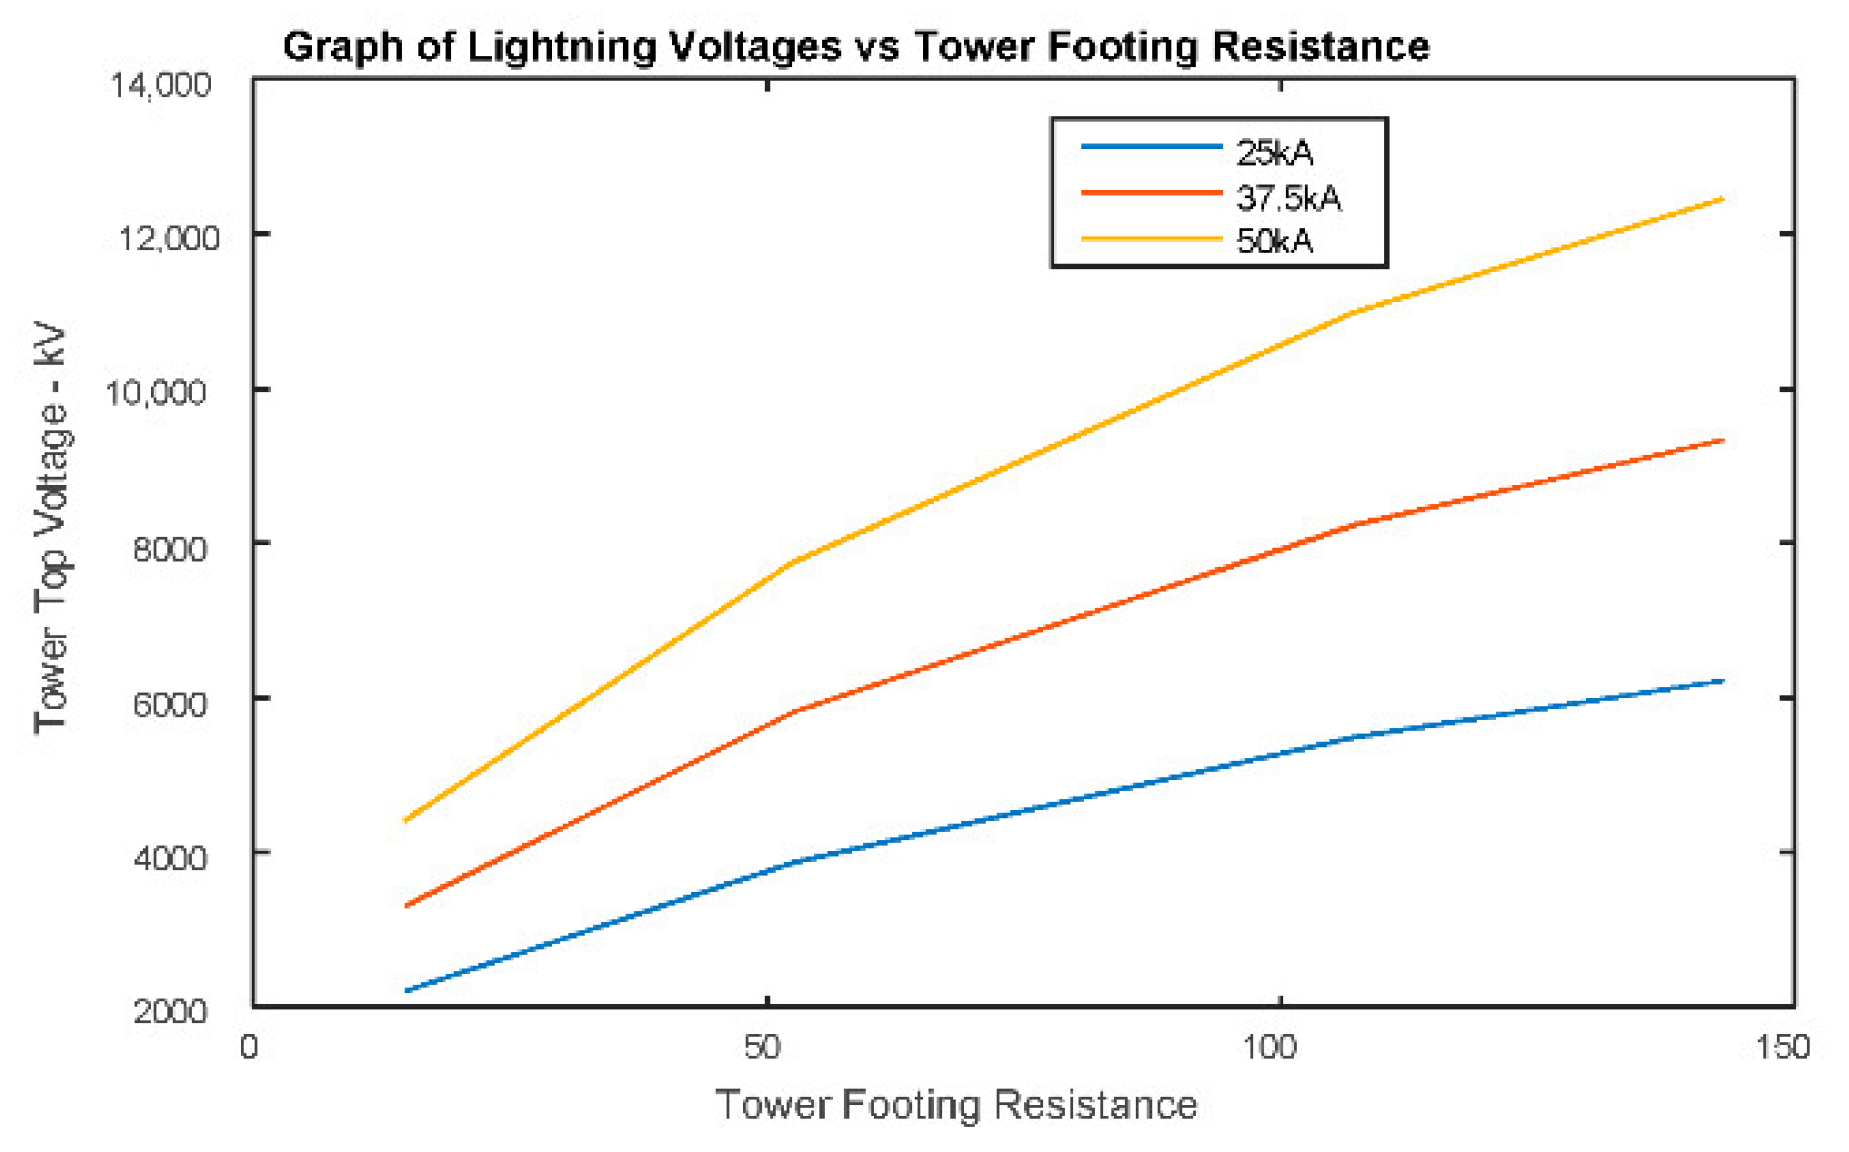
Various lightning strokes and tower footing resistors produce different voltages. Some curves are highlighted in Figure 15.

Figure 15.
Tower Top Voltage variation vs. Tower Footing Resistance.
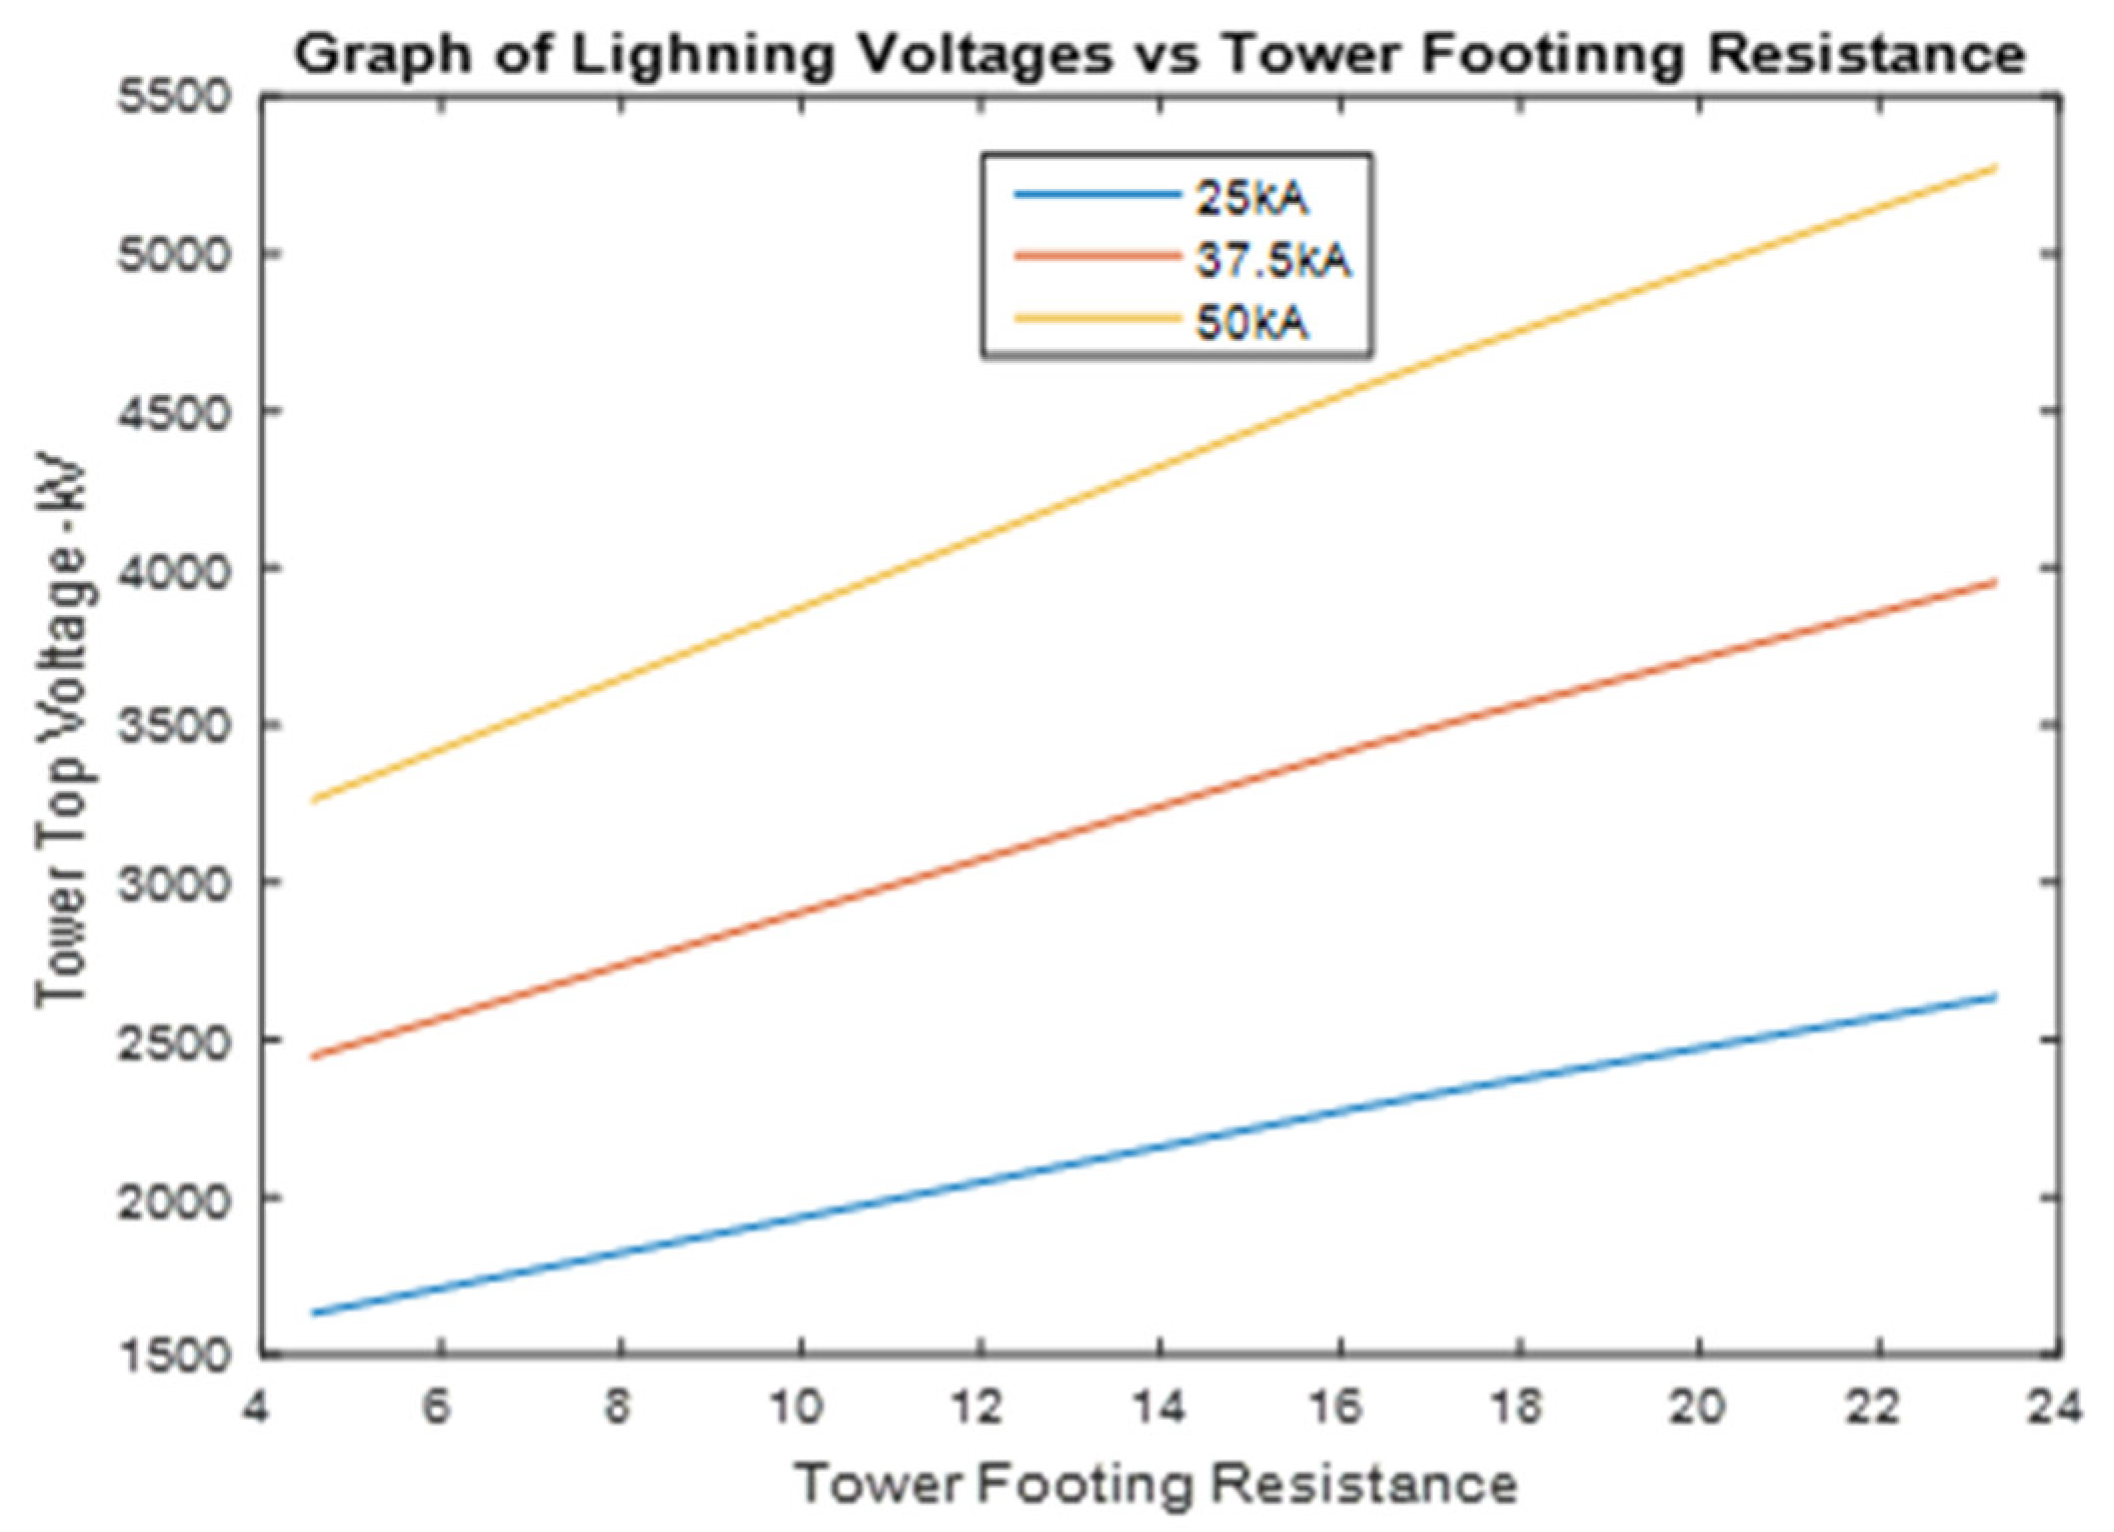
The tower voltage will increase with an increasing tower footing resistance by a constant lightning-stroke magnitude. For the earthing values used, no earth improvement techniques were considered. As discussed in Section 3, utilizing earthing enhancement techniques, which reduces the tower footing resistance value below 30 Ω, the graphs shown in Figure 16 are obtained.
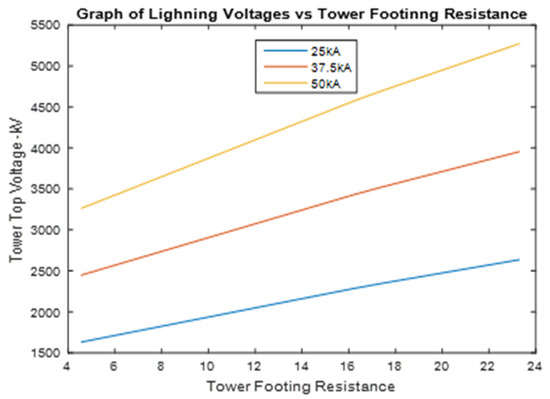
Figure 16.
Enhance earthing (less than 30 ohms) vs. overvoltages.
Figure 15 and Figure 16 show that the tower top voltage is almost halved. This is a substantial reduction and underlines the need for sufficient resistance to the tower foot. However, as shown in Figure 9, reducing the footing resistance to less than 10 Ω is expensive.
The excess voltages generated by lightning strikes of various dimensions are shown in Table 4, for a homogenous soil, but for different tower footing, which is obtaining by varying the conductor length. The soil resistivity values used are 1000 Ω-m and 500 Ω-m for the upper and lower soil layer. Should the insulator voltage be exceeded, a back flashover can be expected. The value of the insulator voltage is determined by the length of the 88 kV insulator.
Table 4.
(a): Resistance at the tower footing (earthing profile) of 4.98 Ω and various strokes of lightning. (b): Resistance at the tower footing (earthing profile) of 9.8 Ω and various strokes of lightning. (c): Resistance at the tower footing (earthing profile) of 18.7 Ω and various strokes of lightning. (d): Resistance at the tower footing (earthing profile) of 29.1 Ω and various strokes of lightning. (e): Resistance at the tower footing (earthing profile) of 34 Ω and various strokes of lightning. LC–Lightning current; IV–Insulating Voltage; TFR–Tower footing resistance; TTV–Tower top voltage; BFO–Back flash over.
In Table 4a–e, the Lightning Current is signified by LC in kA, Insulating Voltage is signified by IV in kV, Tower Footing Resistance signified by TFR, Tower Top Voltage signified by TTV in kV, Black Flash Over is signified by BFO, phase voltage is signified by PV and the required time for South Africa to respond to the power outage is signified by RSAPO.
There is the only instance when a back flashover will not occur with a uniform and low earthing profile. This is when the earthing profile is 4.9 Ω, and the lightning stroke is 12.5 kA. All other scenarios will result in a back flashover. The cost involved in obtaining an earthing system that varies between 4.9 Ω and 34 Ω is substantial, as illustrated in Figure 9. Furthermore, it is almost impractical to install a vast amount of conductors to achieve low earthing values.
3.5. High and Low Dip Cost-Saving Scenario
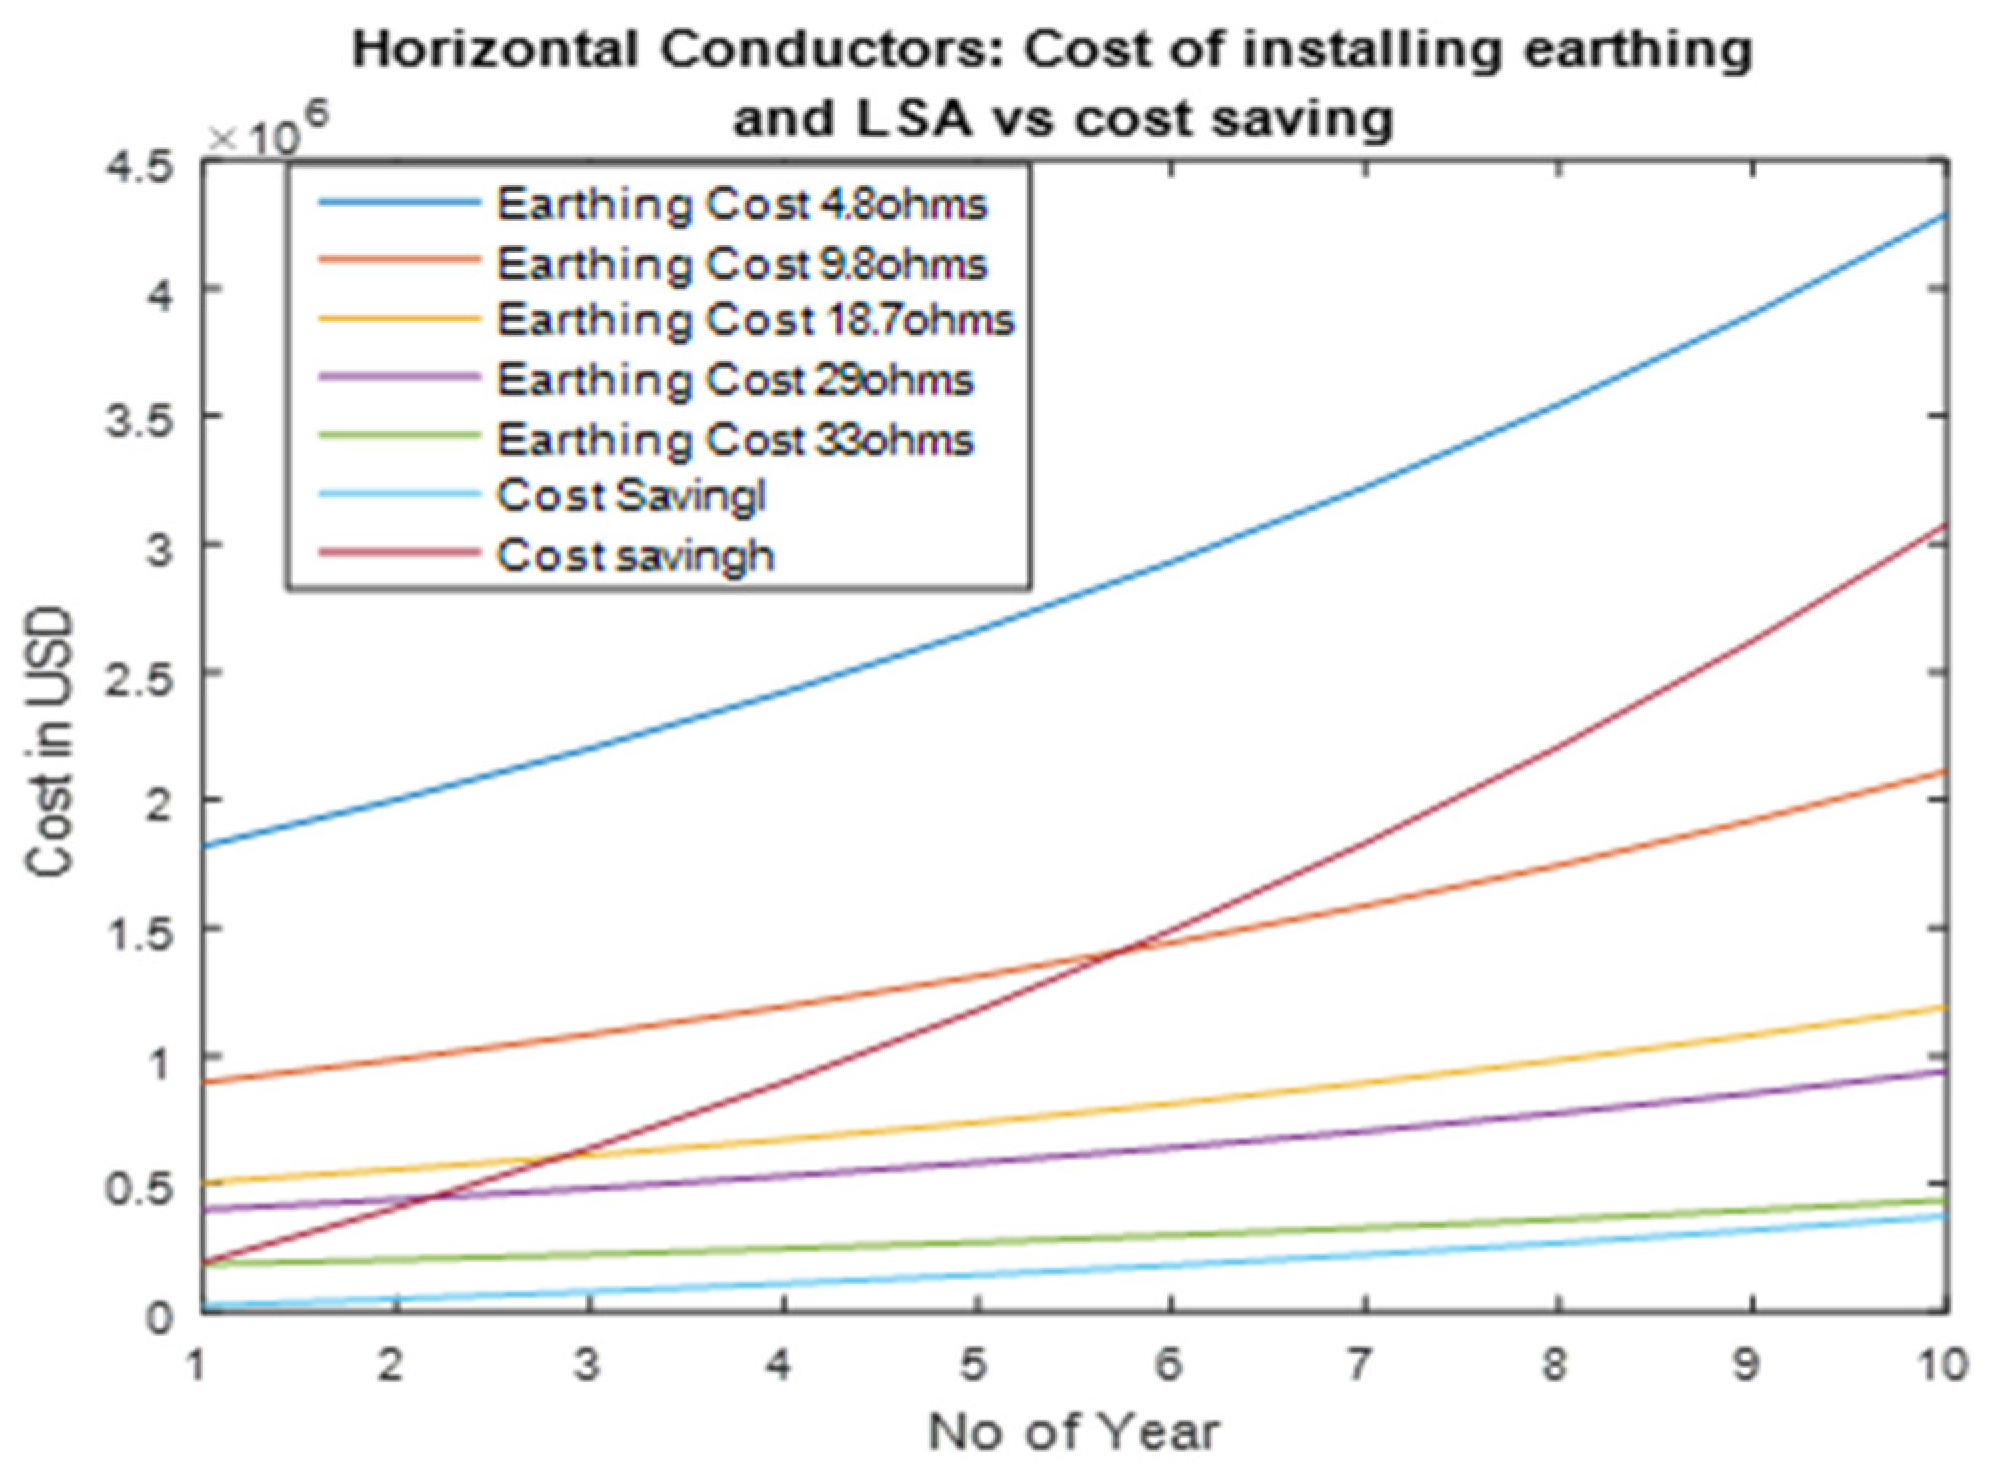
Figure 17 shows the cost profile between the different earthing systems coupled and high and low dip cost-saving profiles.
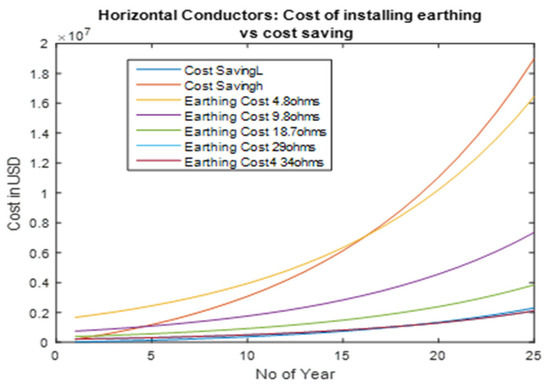
Figure 17.
Earthing cost vs. cost saving.
For the higher dip cost-saving scenario, the breakeven point would be year 14 for the 4.9 Ω and year 5 for the 10 Ω. The low-cost saving scenarios show that we would not recover any money to obtain a TFR below 18.7 Ω. The money would be recovered for 20 Ω and above. However, in both scenarios, the earthing profiles would not give us complete protection against over-voltages as we would still have back flashovers and ultimately consumer production losses. It is also impractical to install a vast amount of conductors in the ground per tower. Hence it is advisable to use LSA to drain the power surge to earth, in conjunction with lowering the TFR to a suitable value
3.6. Number of Surge Arresters Needed to Dissipate the Lightning Surge on Phase Conductor
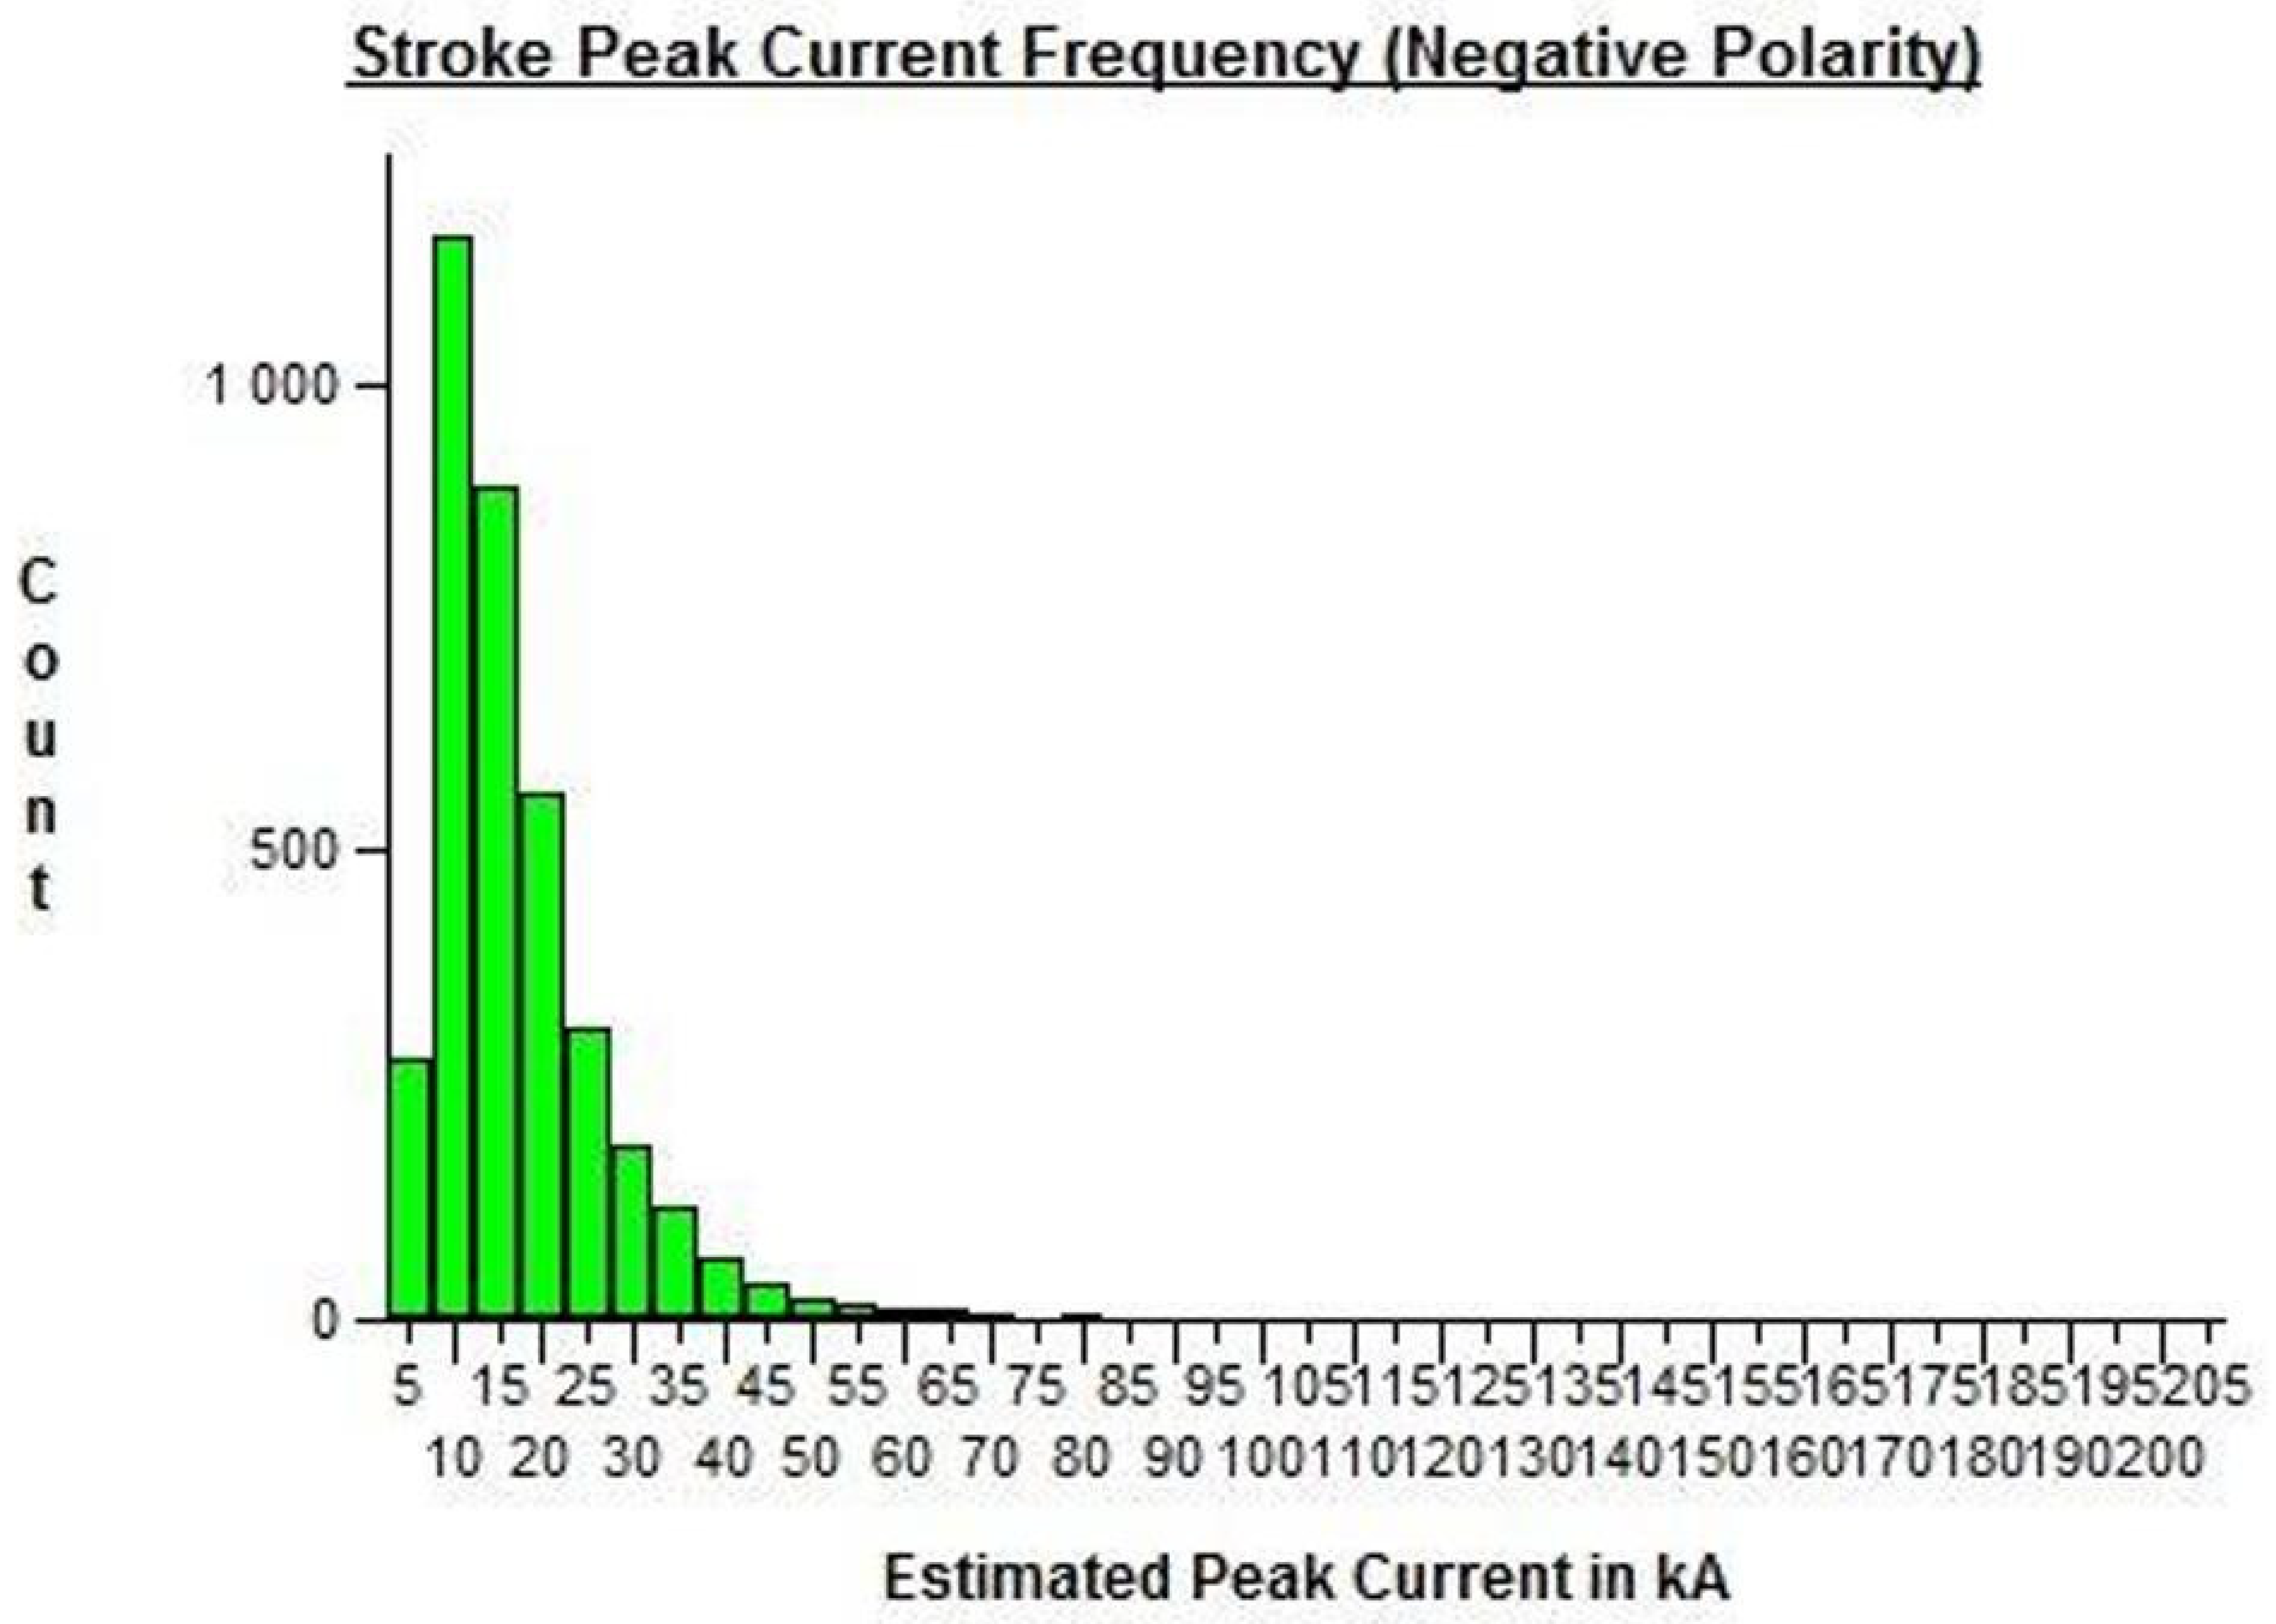
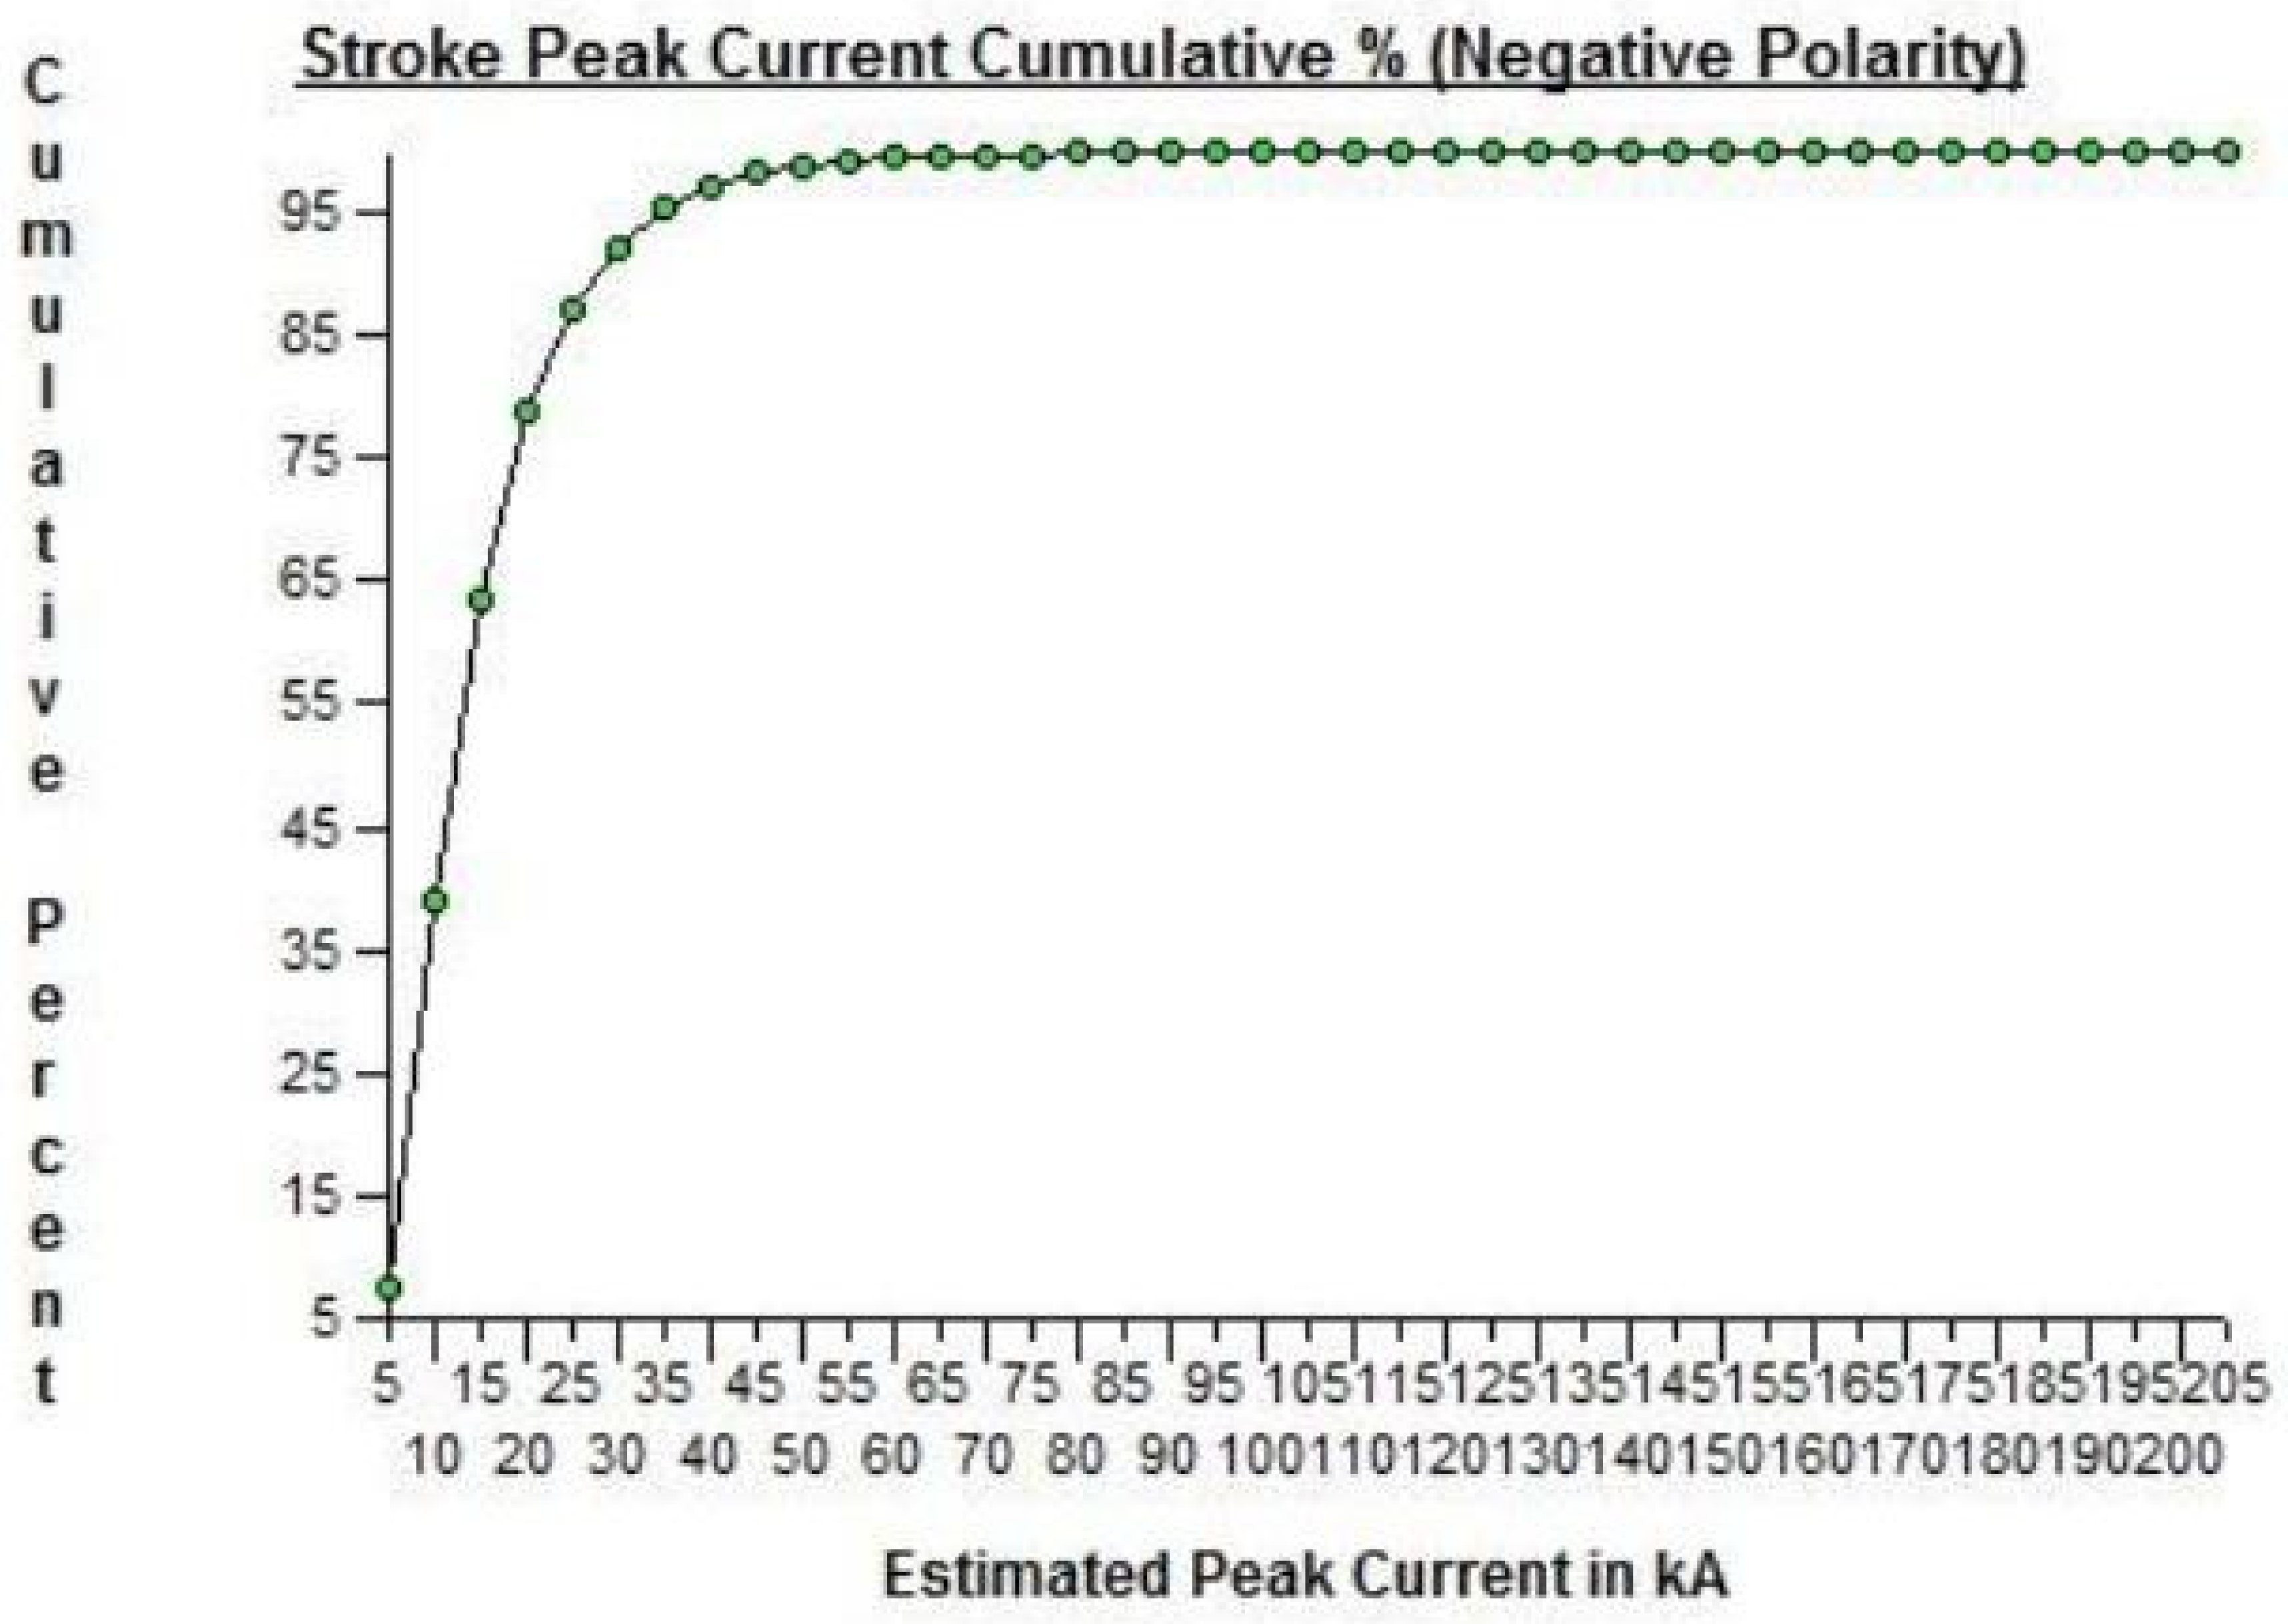
Figure 18 and Figure 19 illustrate the lightning stroke pattern in terms of value and magnitude for an 88 kV, 49 km overhead transmission line [14].

Figure 18.
Stroke current frequency.
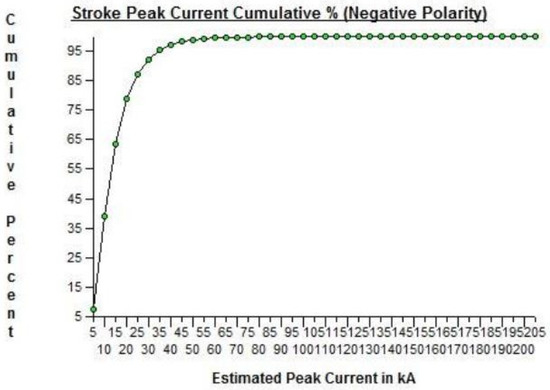
Figure 19.
Accumulative stroke percentage.
Nearly 85% of the strokes reported are less than 25 kA, and more than 95% are less than 50 kA. In conjunction with the case studies, reducing the tower footing resistance to 5 Ω would mean that the line would withstand lightning strokes of less than 12.5 kA. Even this is marginal as the tower top voltage is only marginally less than insulator voltage. This is only 30% of the strokes. However, at the values in Table 4, there would still be back flash-overs. This implies that the use of LSA is recommended. If the flashing voltage of the insulator is surpassed, a flashing will occur. The same tower top voltage level will be present on the surge arrester’s live side. Lightning surges travel at the speed of light. This waveform does not stay at the surge arrestor node for durations long enough for the surge arrestor to dissipate the voltage to the ground. The placement of the surge arrester should be parallel to each other and placed after the operating device, which would be used to clear the fault. This should prevent the device from operating and any short during outages.
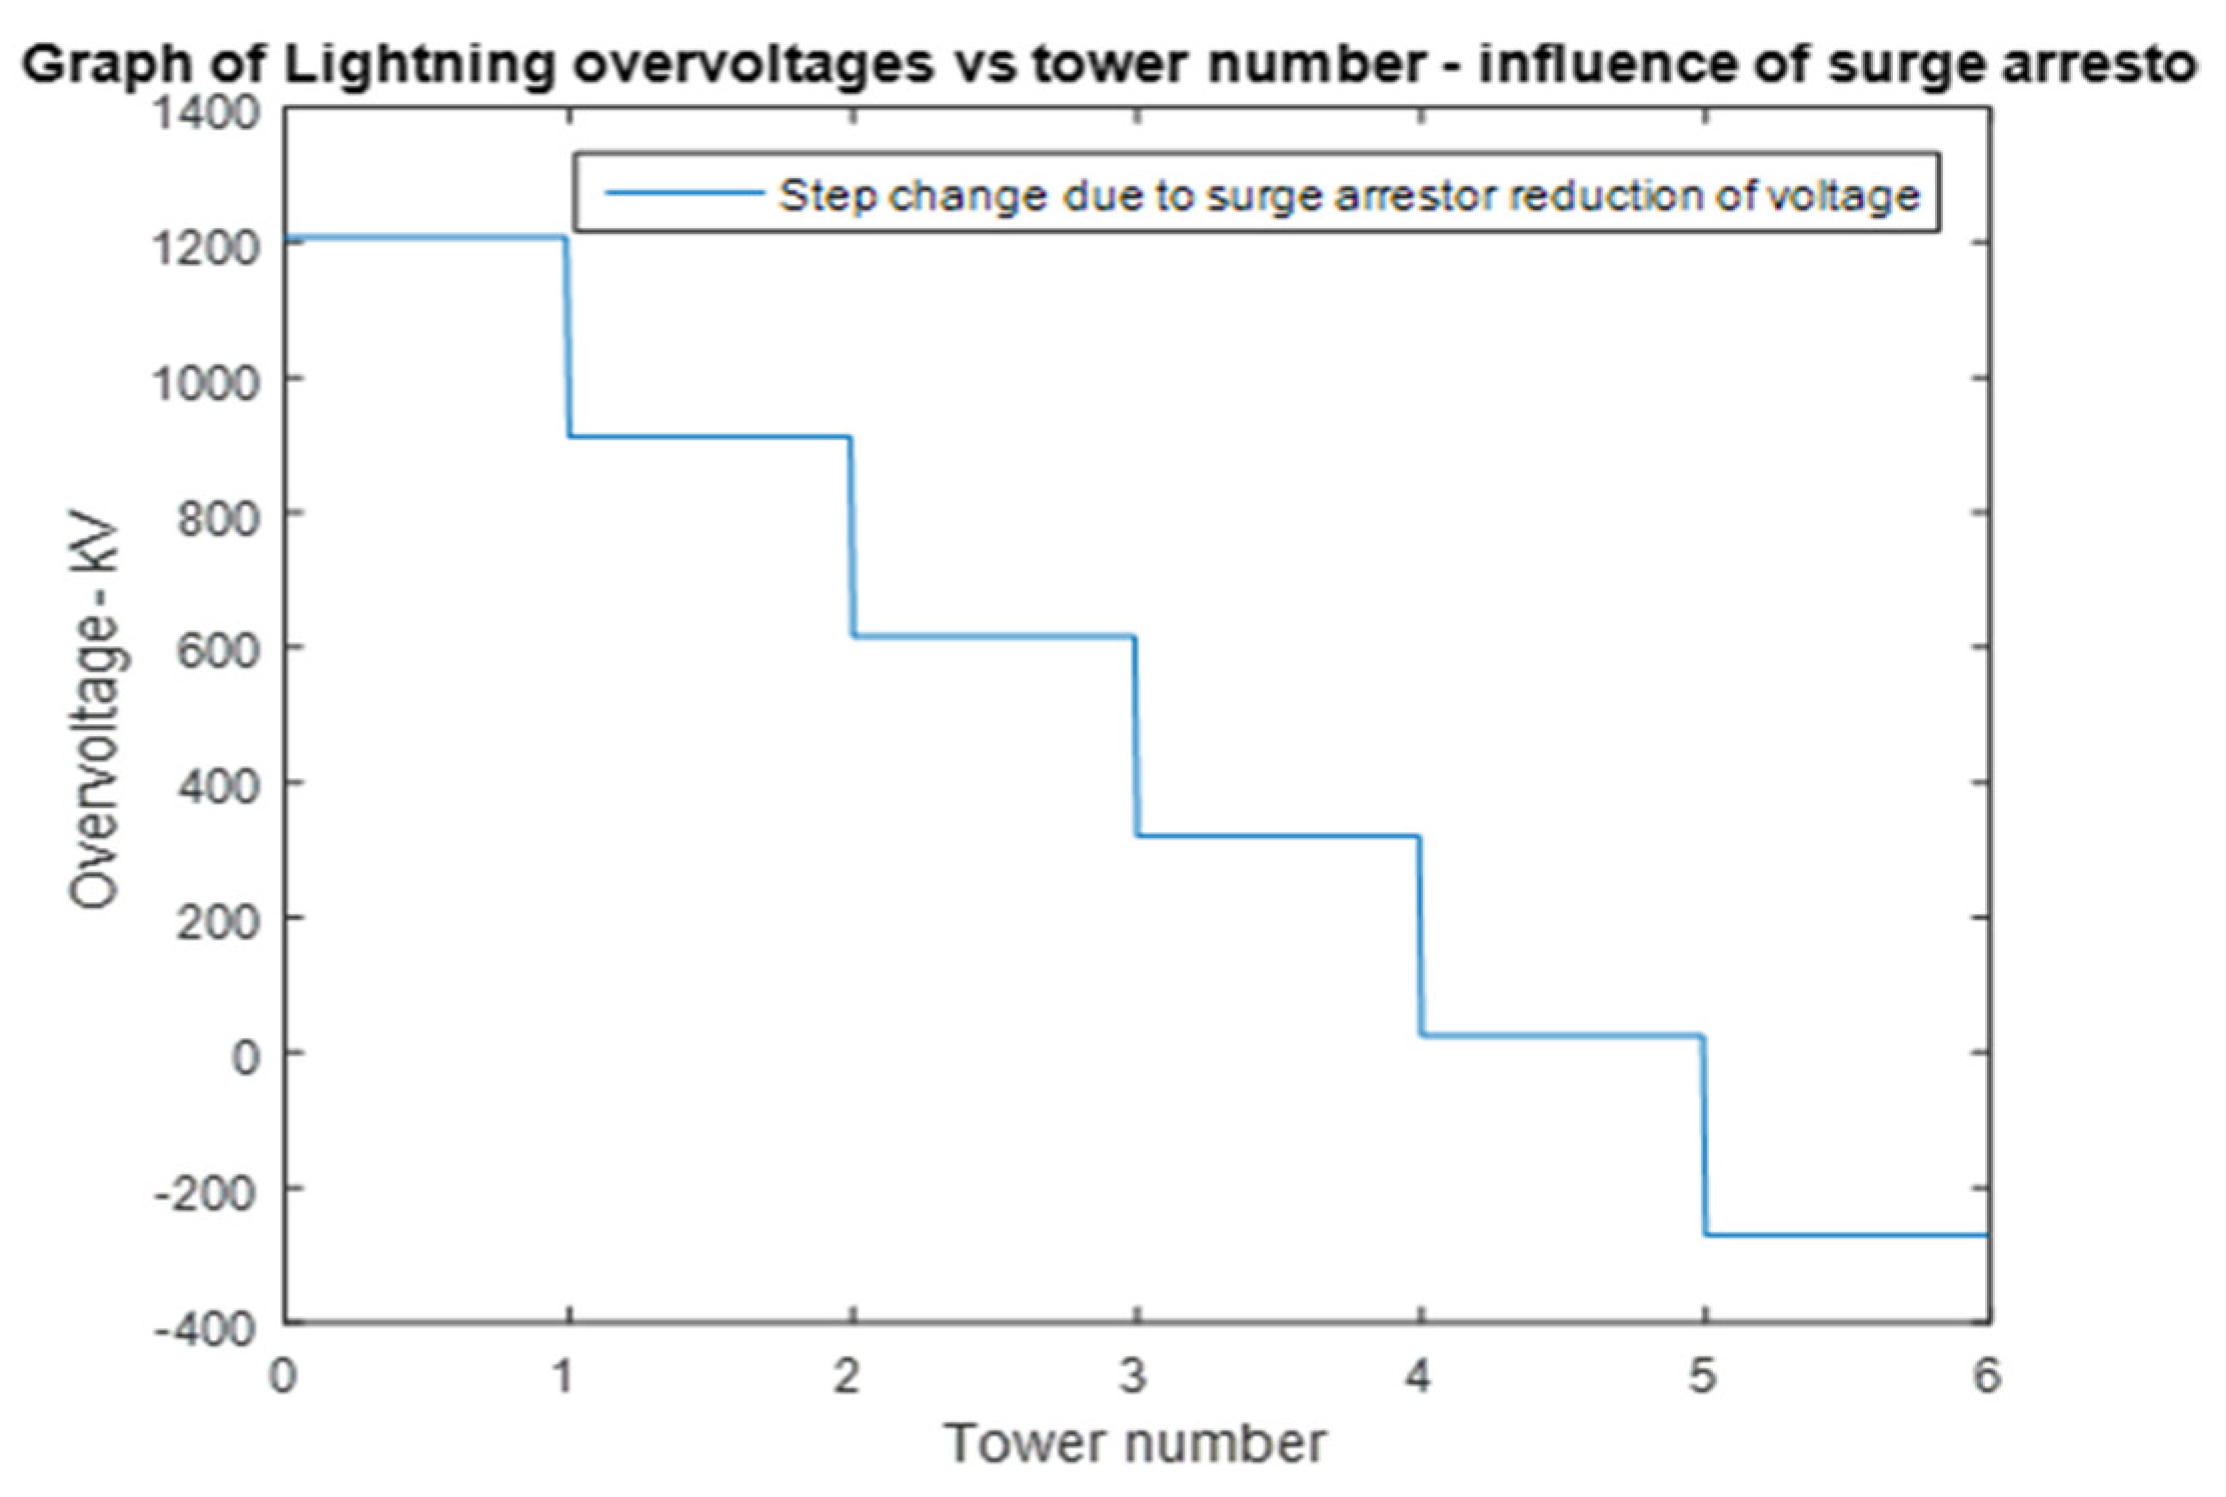
The number of surge arrestors needed [16,17,18] is therefore a simple process by which overvoltage can be deduced on a phase conductor by the value of V10 (remember that this divides into 2) up to a complete removal of the surge [2,16]. The needed number of surge arresters would be indicated. The calculation of V10 value is discussed in detail in references [2,16,19,20]. Figure 20 illustrates the reduction of the over-voltages, which is caused by a 25 kA lightning stroke. Surge arrestors of the same rating were used, and the tower footing resistance is 18.7 Ω. Five 88 kV surge arresters linked in parallel will have to be connected to a 25 kA lightning stroke and 18.7 Ω Tower Footing Resistance to dissipate the flash. This will prevent the line breaker from working and trigger short-term outages.
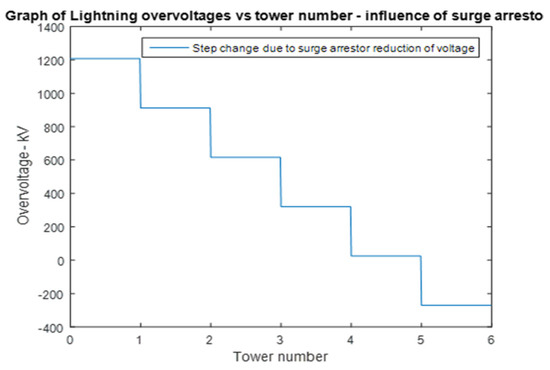
Figure 20.
Lightning overvoltages vs. tower number—The influence of surge line arrestors.
Table 5 shows the number of surge arrestors needed to drain lightning strokes of different magnitude and soil parameters from over-voltages into the soil. The soil parameters of 1000 Ω-m and 500 Ω-m for the lower layer have been extracted from the analysis of cases used.
Table 5.
(a): Resistance at the tower footing of 29.1 and various strokes of lightning. (b): Resistance at the tower footing of 18.7 and various strokes of lightning. (c): Resistance at the tower footing of 9.8 and various strokes of lightning. (d): Resistance at the tower footing of 4.98 and various strokes of lightning. (e): Resistance at the tower footing of 33 and various strokes of lightning. PV–Phase Voltage; RSAPO–required time in South Africa to respond to the power outage.
Even with tower footing resistance as low as 4.9 Ω, strokes of lightning larger than 25 kA will continue to cause back flash. Figure 11 and Figure 12 illustrate the lightning stroke pattern in terms of value and magnitude for an 88 kV, 49 km overhead transmission line. Lines that have an earthing profile of 18.9 Ω (Table 5b) will need seven sets of surge arrestors to prevent back flashovers. With reference to Figure 11 and Figure 12, this means that approximately 95% of the lightning stroke would be prevented. Table 5e shows the prevention of this 95% back flash from lightning strokes by installing 11 sets of surge arresters. Note that this is for an earthing profile of 33 Ω. Table 6 indicates the cost of building 33 surge arresters to protect breakers effectively.
Table 6.
Illustrates the costs to install 33 surge arrestors.
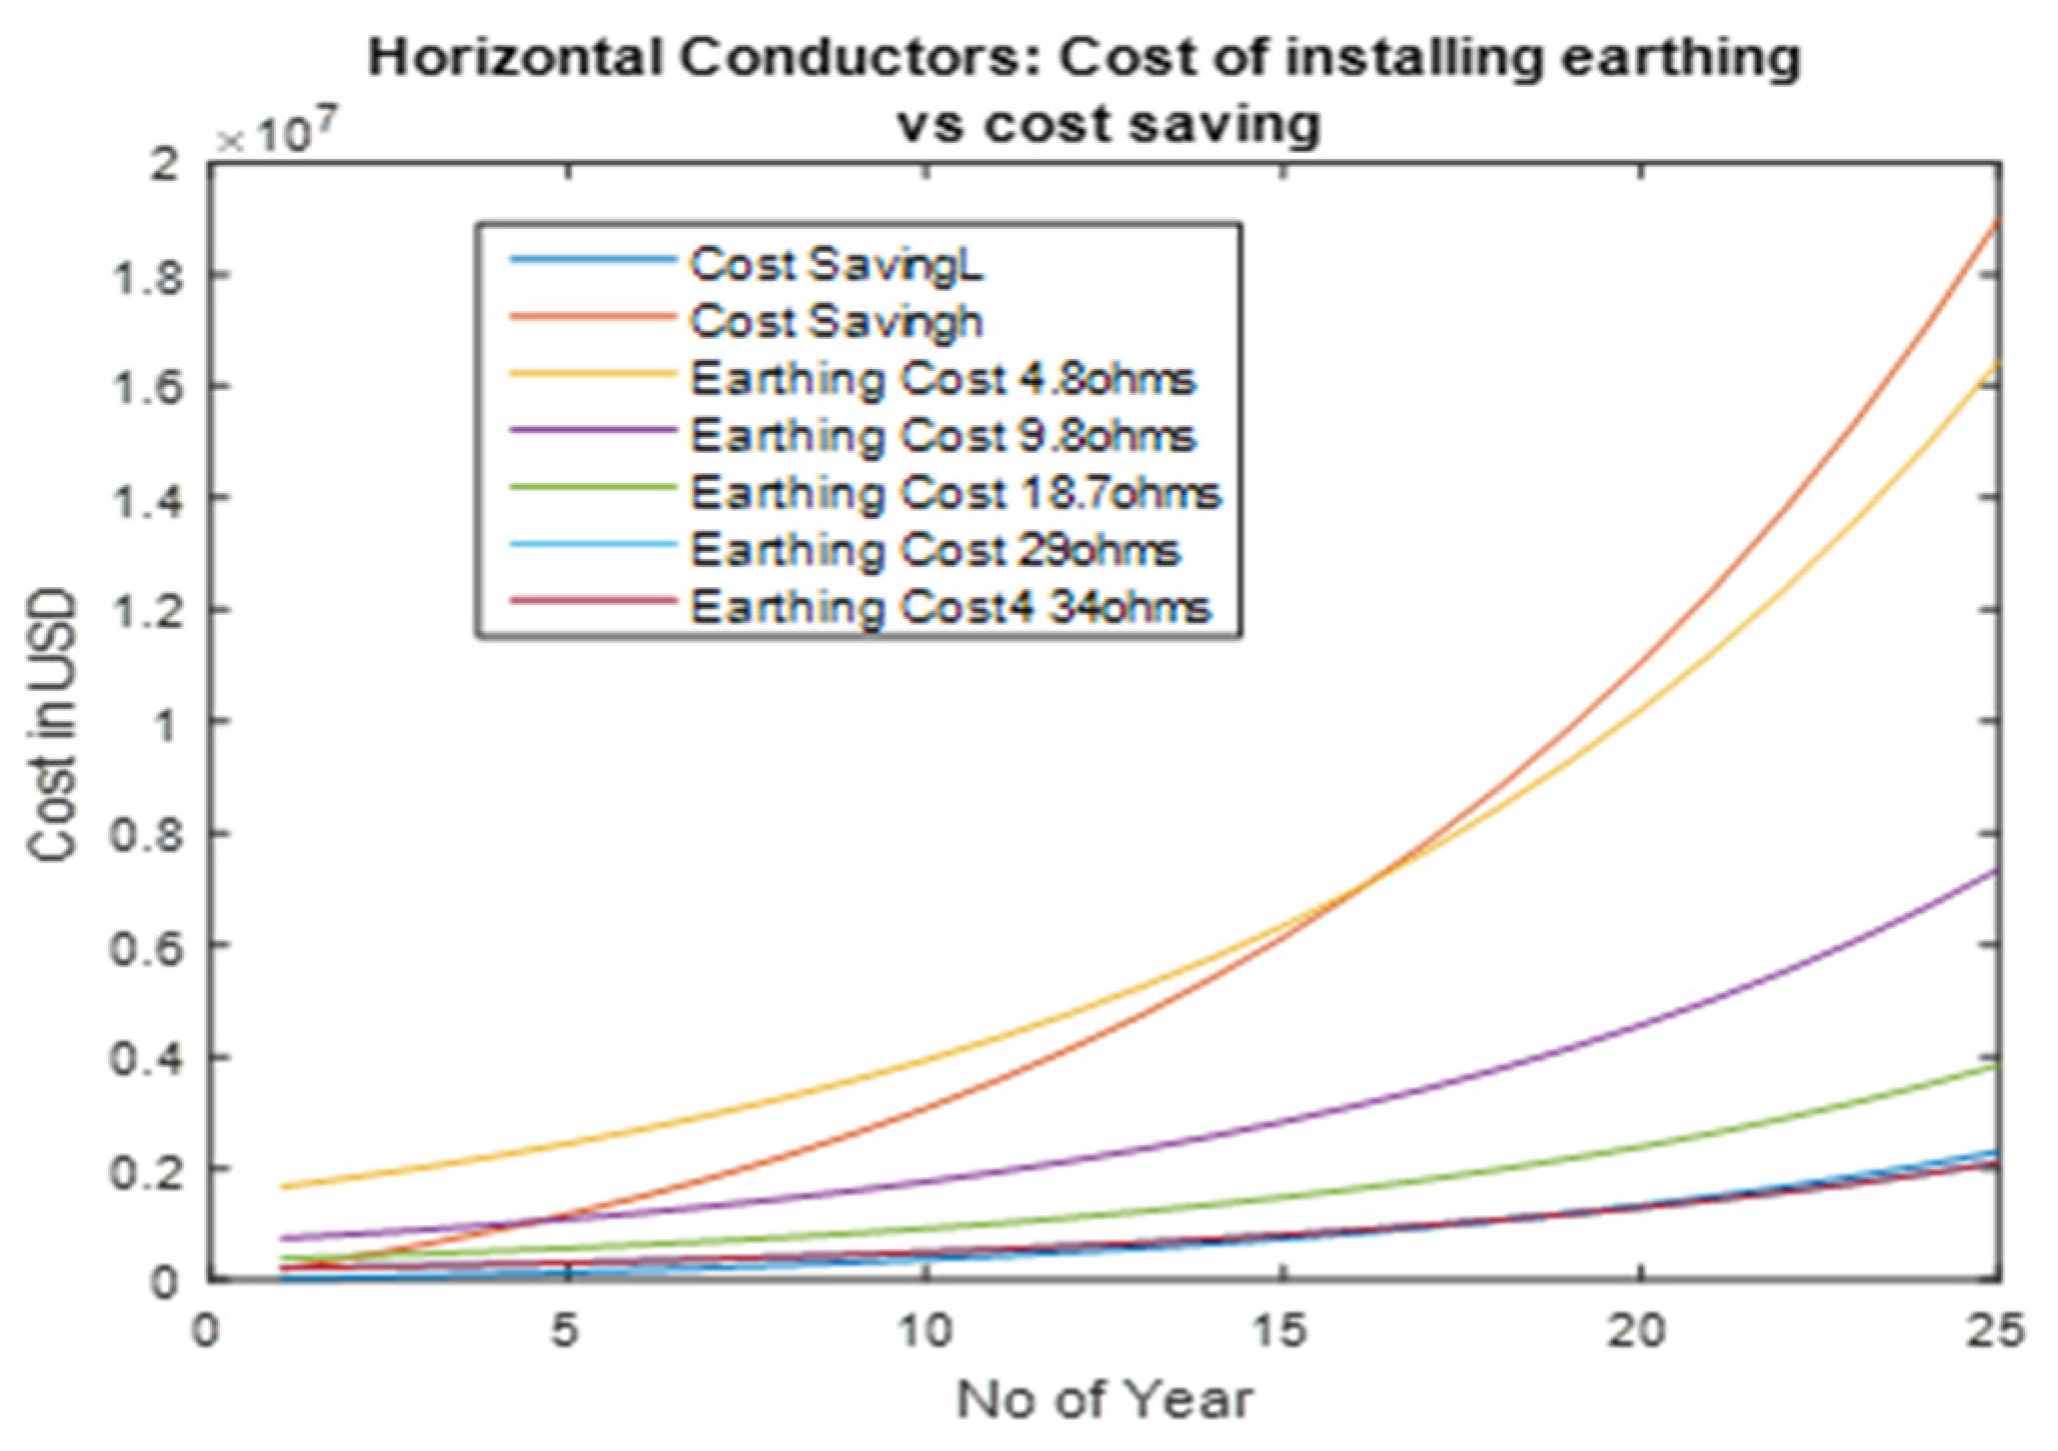
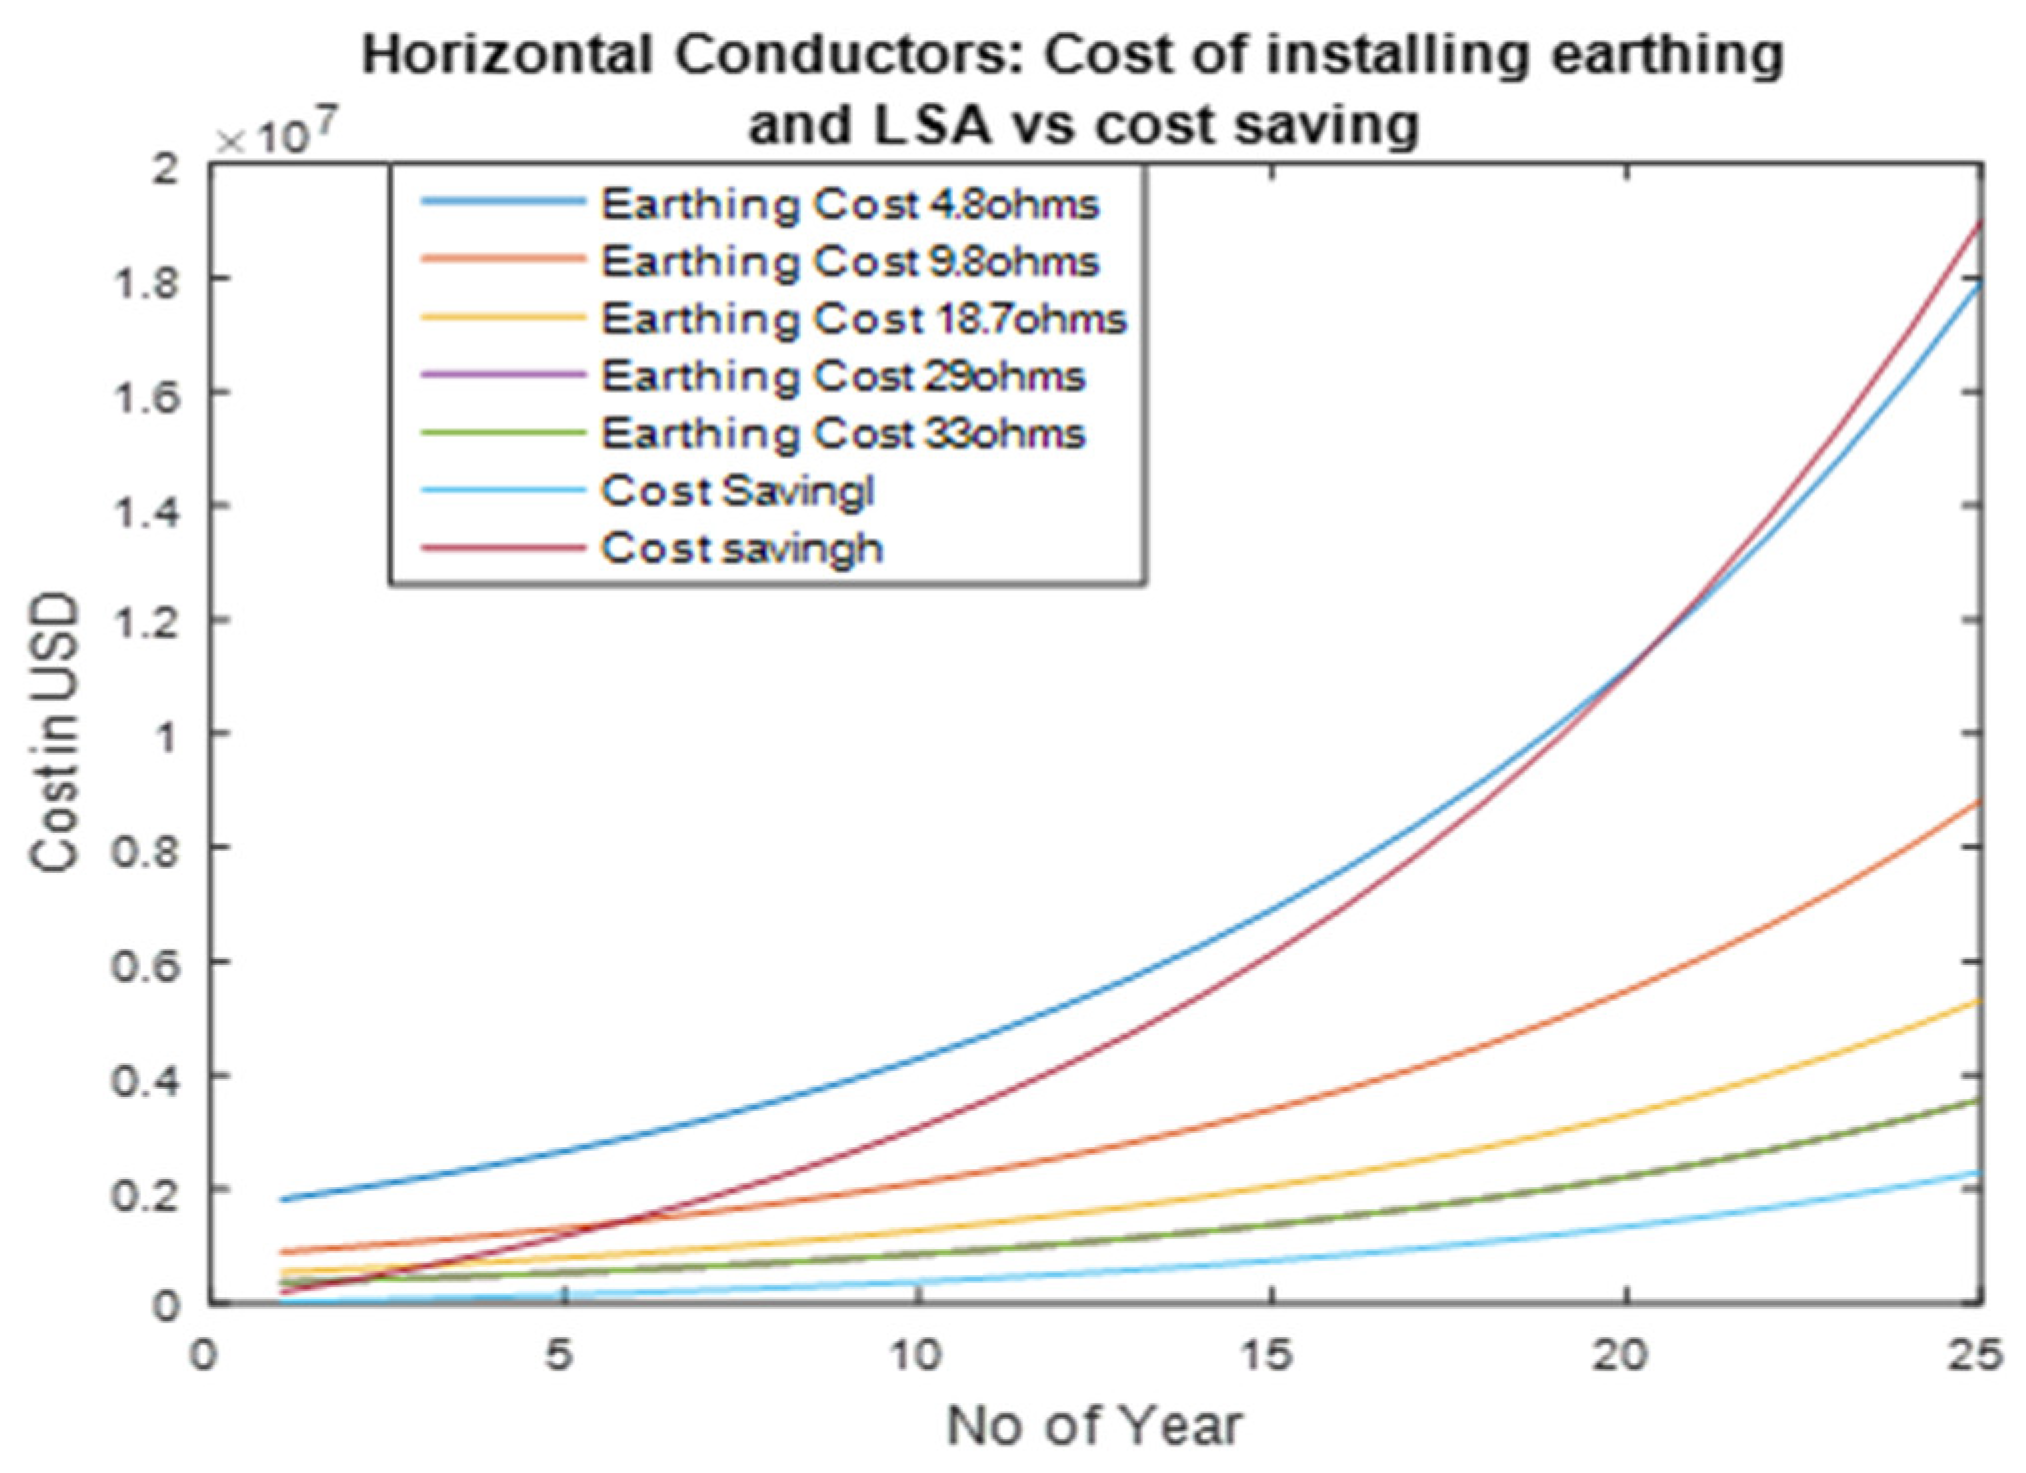
The cost of the additional surge arrestors is combined with the cost of achieving the earthing profile. Figure 21 shows the total cost of the lightning protective system. This is a summation of the earthing cost and the LSA cost to prevent 95% of the back flashovers. The cost-saving as a result of no dips is also shown. This is the inclusion of the low-cost and high-cost saving dip scenarios.
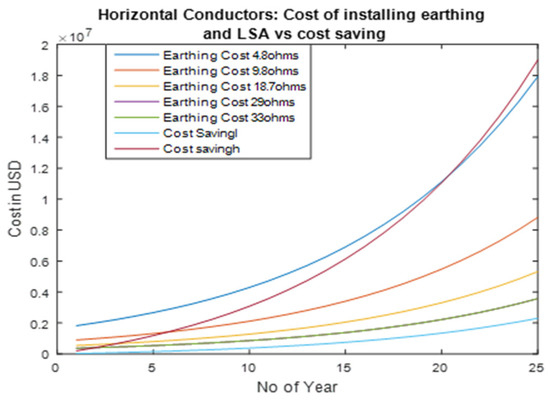
Figure 21.
Break-even cost of earthing enhancement with line surge arrestors (LSAs) vs. cost saving over a 25 year period.
Figure 21 indicates that dips and consumer production losses would be prevented for the low-cost saving scenario, but no return of investment would be achieved. The high cost-saving scenario sees a return of investment in the 18 years for the 4.8 Ω earthing profile. Expanding the high cost-saving scenario, Figure 22 is shown for the first 10 years.

Figure 22.
Break even cost of earthing enhancement with LSA vs. cost saving over a 10 years period.
The 9.8 Ω protection profile sees a return of investment before the 6th year. The 18.8 Ω year profile sees a return of investment after the third year. The 29 and 34 Ω profile see a return of investment by the second year. Note the earthing cost is substantially reduced to obtaining higher earthing profiles.
4. Conclusions
With the aid of earthing improvement methods, the TFR resistance from various values can be minimized and reduced. A reduction in TFR reduces the tower top voltage and would prevent the insulator voltage been exceeded. The cost of obtaining different earthing value for a suitable HVAC line length was estimated over 25 years. This cost varied significantly between a 4.9 Ω and a 34 Ω earthing profile.
By maintaining a tower footing resistance value below 30 ohms, implies that the tower top voltage would be substantially reduced when compared with scenarios of having no earthing enhancements. The tower top voltage, when calculated by the developed MATLAB programs showed a reduction of almost 50%. This figure can be substantially higher should if lower tower footing resistance values are required, but at a substantially higher cost.
The amount of earthing conductor requires per tower varied between 50 to 450 m, the lower the required earthing profile the greater the conductor length and cost. It is difficult to install a large amount of earthing per tower, which is required to minimize or prevent lightning-related interruptions.
By prevent back flashovers, arcs, dips, and hence customer outage are prevented. Dip studies reflect a cost estimate between a low and high cost-saving scenario. Should a combination of any earthing profile be applied on the line, and the high cost-saving scenario is applied, a positive return on investment can be expected. The lower cost-saving scenario does not provide any return on investment.
Furthermore, damage to overhead line components will be minimized as the power surge will be removed from the line. Routine maintenance of the protective device will also be minimized as the operations will be reduced. This cost-saving is minimal and is not included in any of the scenarios.
The practicality of installing approximately 100 to 450 m of earth straps per tower needs careful consideration. The best possible scenario would be a 29.1 Ω earthing profile coupled with 11 LSA per phase, i.e., a hybrid system. This hybrid system will withstand lightning strokes of 50 kA and below and would require 60 m of earthing conductor per tower, which should be achievable for the towers on an 88 kV line. The placement of the surge arrestor should be in parallel to each other and placed after the operating device, which would be used to clear the fault.
Author Contributions
Conceptualization, E.S. and I.E.D.; Methodology, E.S. and S.C.M.; Software, E.S.; Validation, E.S., I.E.D. and S.C.M.; Formal Analysis, E.S.; Investigation, E.S.; Resources, I.E.D.; Data Curation, E.S.; Writing-Original Draft Preparation, E.S.; Writing-Review & Editing, S.C.M.; Visualization, E.S. and S.C.M.; Supervision, I.E.D.; Project Administration, S.C.M. All authors have read and agreed to the published version of the manuscript.
Funding
This research received no external funding.
Conflicts of Interest
The authors declare no conflict of interest.
References
- Naidoo, N. Improving Lightning Performance on High Voltage Overhead Shielded Networks by Reducing Tower Footing Earthing Resistance. Master’s Thesis, Department of Electrical Engineering, College of Agriculture, Engineering and Science, University of KwaZulu-Natal, Durban, South Africa, 2019. [Google Scholar]
- Singh, E.; Davidson, I.E. Improving Overhead HV AC Line Performance using Line Surge Arrestors under Lightning Conditions with economic analysis. Int. J. Appl. Eng. Res. 2019, 14, 4126–4135. [Google Scholar]
- Khuluse, P.N.; Nnachi, A.F.; Moloi, K.; Akumu, A.O. Lightning Protection of A 22 kV Distribution Overhead Line-A Case Study. In Proceedings of the 6th IEEE International Energy Conference (ENERGYCon), Gammarth, Tunis, Tunisia, 28 September–1 October 2020; pp. 792–796. [Google Scholar]
- Southey, R.D.; Siahrang, M.; Fortin, S.; Dawalibi, F.P. Using Fall-of-Potential Measurements to Improve Deep Soil Resistivity Estimates. IEEE Trans. Ind. Appl. 2015, 51, 5023–5029. [Google Scholar] [CrossRef]
- Selim, F.; Abdelwanis, M.I. A Newly On-Time Following up Electrical Earthing System Technology. In Proceedings of the 21st International Middle East Power Systems Conference (MEPCON), Cairo, Egypt, 17–19 December 2019. [Google Scholar]
- Ramos-Leaños, O.; Uribe, F.A.; Valcárcel, L.; Hajiaboli, A.; Franiatte, S.; Dawalibi, F.P. Nonlinear Electrode Arrangements for Multilayer Soil Resistivity Measurements. IEEE Trans. Electromagn. Compat. 2020, 62, 2148–2155. [Google Scholar]
- Nzimande, T.M. Voltage Dip Performance Analysis. Master’s Thesis, Department of Electrical Engineering, College of Agriculture, Engineering and Science, University of KwaZulu-Natal, Durban, South Africa, 2009. [Google Scholar]
- Global Atmospherics Inc. Vaisala-GAI Fault Analysis and Lightning Location Systems (FALLS) Version 3.2.4; Global Atmospherics Inc.: Tucson, AZ, USA, 2002. [Google Scholar]
- Singh, E.; Davidson, I.E.; Venayagamoorthy, G.K. Methodology for Measuring and Enhancing Tower Footing Resistance for Lightning Protection in an 88 KV Line. In Proceedings of the 25th South African Universities Power Engineering Conference, Stellenbosch, South Africa, 30 January–1 February 2017; pp. 655–659. [Google Scholar]
- Chen, L.-H.; Chen, J.-F.; Liang, T.-J.; Wang, W.-I. Calculation of ground resistance and step voltage for buried ground rod with insulation lead. Electr. Power Syst. Res. 2008, 78, 995–1007. [Google Scholar] [CrossRef]
- Adegboyega, G.A.; Odeyemi, K.O. Assessment of Soil Resistivity on Grounding of Electrical Systems: A case study of North-East Zone, Nigeria. J. Acad. Appl. Stud. 2011, 1, 28–38. [Google Scholar]
- Gouda, O.E.; Amer, G.M.; El-Saied, T.M. Factors Affecting the Apparent Soil Resistivity of Multi-Layer Soil. In Proceedings of the XIVth International Symposium on High Voltage Engineering, Beijing, China, 25–29 August 2005. [Google Scholar]
- Malanda, S.C.; Davidson, I.; Singh, E.; Buraimoh, E. Analysis of Soil Resistivity and its Impact on Grounding Systems Design. In Proceedings of the IEEE Power Africa Conference, Cape Town, South Africa, 26–29 June 2018; pp. 522–527. [Google Scholar]
- Singh, E. Fault Mitigation and Performance Improvement of an 88 kV Line Using Line Surge Arrestors and Counters; University of KwaZulu-Natal: Durban, South Africa, 2016. [Google Scholar]
- Dekker, M. Lightning Surge Analysis. 2012. Available online: http://197.14.51.10:81/pmb/informatique/computer%20aid%20analys/0824706994/PDFs/DK1913_CH13.pdf (accessed on 20 June 2020).
- ABB. High Voltage Surge Arrestors. 2002, p. 6. Available online: www.abb.com (accessed on 20 June 2020).
- Hassan, N.H.N.; Bakar, A.H.A.; Mokhlis, H.; Illias, H.A. Analysis of Arrestor Energy for 132 kV Overhead Transmission Line due to Back Flashover and Shielding failure. In Proceedings of the 16th IEEE International Conference on Power and Energy, Kota Kinabalu, Malaysia, 2–5 December 2012; pp. 683–688. [Google Scholar]
- IEEE Working Group 3.4.11. Modeling of metal oxide surge arrestors. IEEE Trans. Power Deliv. 1999, 7, 302–309. [Google Scholar]
- Radhika, G.; Suryakalavathi, M. Effective Placement of Surge Arrestor during Lightning. Int. J. Comput. Commun. Inf. Syst. 2010, 2, 167–172. [Google Scholar]
- Singh, E.; Davidson, I.E. Improving Overhead EHV DC Line Performance using Line Surge Arrestors under Lightning Conditions. Int. J. Appl. Eng. Res. 2019, 14, 4130–4141. [Google Scholar]


Publisher’s Note: MDPI stays neutral with regard to jurisdictional claims in published maps and institutional affiliations. |
© 2020 by the authors. Licensee MDPI, Basel, Switzerland. This article is an open access article distributed under the terms and conditions of the Creative Commons Attribution (CC BY) license (http://creativecommons.org/licenses/by/4.0/).