1. Introduction
The usage of fossil fuels for mobility purposes significantly contributes to the total CO
2 emissions (greenhouse gases—GHG). Regarding the European Union (EU) transport sector, its share in final energy consumption is around 33% [
1], and the transport sector contributes around 23% to the total greenhouse gas emissions [
2]. As a new member of EU, Croatia has been obliged to match targets regarding the reduction of GHGs. In addition, in accordance with international and EU legislative frameworks, Croatia is obliged to create a national low-carbon strategy. The Croatian low-carbon strategy (CLCS) should be the basis for other important documents regarding climate change, and at the same time, it should represent directions for national economic and environmental strategies. Low-carbon strategy targets are in accordance with the European Union’s low-carbon development policy that seeks for measures to decrease GHG emissions by 80–95% by 2050 [
3]. Consequently, the European Council agreed on the Climate and Energy Framework of 2030 in October 2014 [
4] with specific targets for 2030: to decrease CO
2 emissions by 40%, to increase renewable energy source (RESs) penetration level by 32%, and to reduce energy consumption by 32.5%. The aforementioned indicative EU targets should be integrated into the Republic of Croatia political framework. In order to achieve these targets, it is necessary to boost both RES-based electricity production and the electrification of the transport sector. Electric vehicles (EVs) provide great potential for short term electricity storage that provide additional room for RES penetration [
5,
6], as seen in [
7], where the focus of the research was on how transport electrification using a smart charging strategy can elevate solar electricity integration. Moreover, the authors of [
8] concluded that EVs could provide a significant electricity storage potential and tackle the issue of intra-day power imbalance that results from the high installed capacity of unpredictable renewable energy.
Considering previously set ambitious targets, it is a necessity to transform traditional electricity production, distribution, and consumption premises. Current power systems are based on investments and planning from the last century. Therefore, electricity from predominantly large capacity power plants is transferred through a high voltage grid, usually over long distances. Consequently, it is delivered to traditional one-direction power flow distribution networks and distributed among all consumers. The new premise of integrating a rather small capacity production units into the distribution network has been increasingly analyzed and investigated recently. These distributed power plants are mainly based on renewable energy sources, resulting in bi-direction power flows in a distribution grid. This new condition can raise concerns of voltage stability since most of the current grids are dimensioned for one-direction power flows from upstream distribution substations to final consumers. The large penetration of RES has substantial benefits for the environment and energy independence of energy systems of countries. On the other hand, it also poses significant issues for many features of the power system. As emphasized in [
9,
10], economical, technical, and environmental aspects should be considered while optimizing and diversifying the energy mix. In addition, smart energy system approaches have to be enrolled in order to avoid possible curtailments imposed by the high penetration of RES capacity. These approaches include smart electricity storage systems, revised and improved transmission lines management, and, of course, the increase of electrification in all energy sectors. Additional energy storage, better interconnection between different regions, and back-up capacities appear to be necessary for the stability of a system when analyzing the increased penetration of RES, among which mainly wind and photovoltaic [
11,
12]. Moreover, RES, namely wind generation, can have a significant impact on the frequency response and voltage profile of a system [
13], as shown in [
14]. Therefore, it has been shown that the integration of wind power plants increases the voltage profile of a power system. To support the integration of a large share of RES projects, different innovative market models, such as peer-to-peer and local electricity trading, are rising [
15,
16,
17]. In addition to the techno-economic issues related to the larger integration of RES into power systems [
18], such ambitious plans require continuous improvement in policy and research into new efficient approaches and instruments [
19]. As studied in much research, uncertainties related to weather—such as natural water inflow to reservoirs, wind speed, and insolation—requires significant additional reserves in power systems. This reserve can be provided either in the form of conventional power plants or in the form of electricity storage systems (ESSs). In [
20], the authors made an extensive literature overview regarding long- and short-term issues related to possible ESS roles in both the transmission and distribution grids. They concluded that there is a need to develop new ESS applications with an emphasis on distribution level in order to make the grid more resilient. In their findings, the effects of ESSs regarding active network design, demand response, and distributed generation must be evaluated. Electric vehicles and pumped storage hydropower plants (PSHPPs) can increase of power system flexibility by working as stores of electricity that grant the additional potential for new RES capacity [
21,
22,
23]. However, as stated in [
24], it is important to simultaneously develop a suitable regulatory framework of integrating such energy storage technologies along with a strategy of increasing the installation of RES.
Many previous studies have identified the effects, advantages, and disadvantages that EVs have on a power system. In [
25], EVs were referred to as a means of global CO
2 emission reductions per kilometer in the transport sector. The impact of an additional EV load on the power system of the Republic of Ireland for 2020, with the 10% target for the minimum share of renewable energy in the final consumption in the transport, was studied in [
26,
27]. Additionally, a further analysis of the power system of Ireland was made in [
28], focusing on the impact of EV on electricity generation in 2025; it was based on five alternative production portfolios, with a detailed market simulation for each portfolio.
As stated before, EVs can act as ESSs in the short term, and in that way, they can boost RES penetration into a grid. The results of the research conducted in [
29] proved that the optimal scheduling of EV charging and discharging can provide additional flexibility in a system, especially for load shedding in peak hours. In this way, the role of the traditional means of system flexibility such as coal/natural gas power plants can be replaced with a new sustainable solution. In addition, a larger share of EVs contributes to easier integration and new investment in wind power plants. The study presented in [
30] analyzed the optimal investment and deployment of distributed intermittent sources in an EV schedule. The results of the study showed that an EV can have a significant impact on the investment in distributed energy sources, provided that the return time is relatively short. Furthermore, these two technologies can profit from each other because EVs can provide capacity for energy storage produced from unpredictable RESs with a fast response at peak demand, while it has been proved that an RES is the purest, cost-effective source of additional energy demanded by EV [
31]. Additionally, when connected to the grid, an EV can present an additional source of energy at moments of a lack of production from an RES or in moments of a sudden increase in the demand for electricity, also referred to as vehicle-to-grid (V2G) [
32].
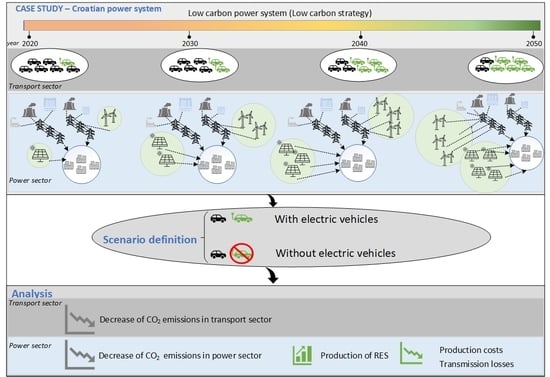
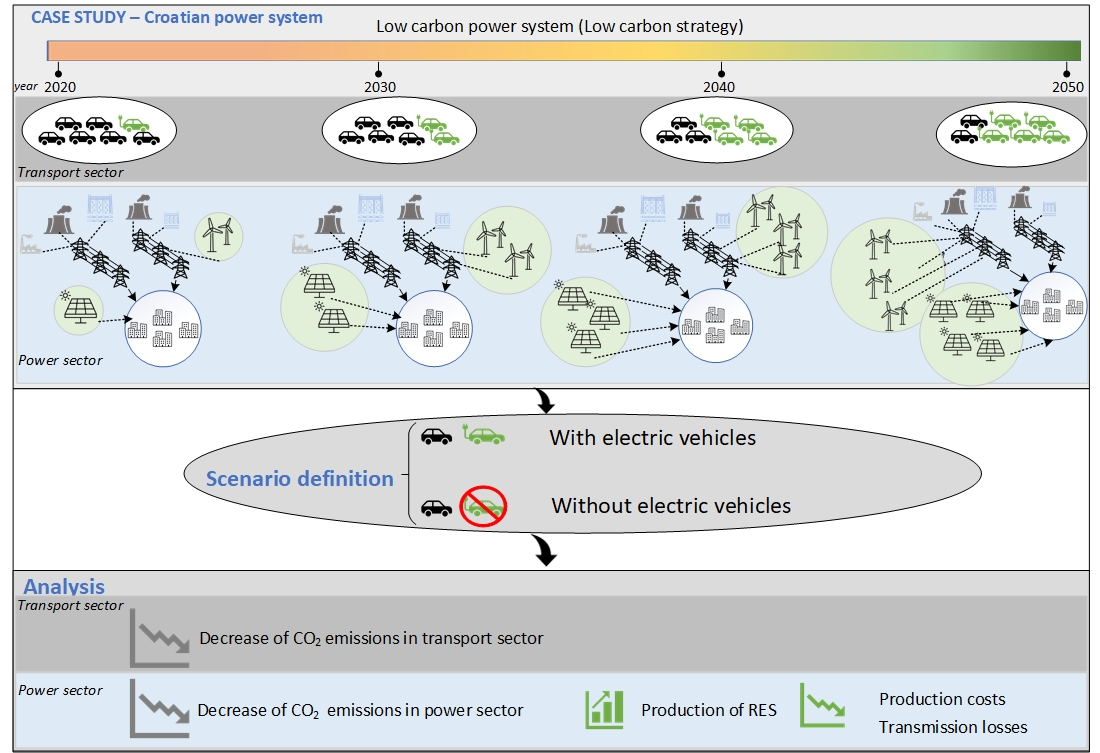
The motivation of this work was to analyze the impacts of the V2G implementation, predominantly of private passenger electric vehicle fleets on the exploitation of the significant potential that the Republic of Croatia has in both solar and wind energy resources. The analysis was conducted based on the very ambitious scenario (also used in the CLCS) of large penetration of the RES power plants, mainly wind and solar. Data related to electricity production and consumption were modelled on hourly resolution and obtained from real observations, and measurements used the CLCS. Contrary to other available research, this paper was first to use the model of EVs in PLEXOS and to deal with the assessment of the possibility of transferring CO2 emissions from the transport sector (non-emission trading system (ETS)) to the power system sector (ETS).
The main questions of this research were:
To which extent could a large increase in EV numbers decrease CO2 emissions from both the transport and power sectors?
What is the role and potential of EVs in providing additional flexibility to the Croatian power system when taking the volatile nature of wind and solar into account?
In addition, a question regarding solar availability and simultaneous low-availability parked electrical vehicles was also examined.
The main contribution of this paper was to point out the possibility of reducing domestic CO2 emissions by shifting 75% of internal combustion fossil-fuel vehicles (and equivalent emissions) to electric vehicles. At the same time, power system production costs and related emissions could be maintained at an almost unchanged level. The effect of this switch on the levelized cost of electricity was not assessed within this paper. The main contribution factor for this sustainable change is a more efficient use of a significant amount of RESs due to the additional flexibility enforced by the increased penetration of EVs.
The rest of the paper is organized as follows. Costs related to RESs are briefly described in
Section 2.
Section 3 describes the energy storage technologies modelled for the purpose of the conducted analysis. The methodology and the power system model used for unit commitment, economic dispatch, and long-term plans under scenario simulations are described in
Section 4, alongside modelled wind plants, solar power plants, and EVs. The obtained results are presented in
Section 5 and discussed in
Section 6.
Section 7 concludes the paper and gives the main directions for future development and research.
2. Renewable Energy Sources
The production of RESs, such as wind, sun, biomass, biogas, tides, waves, and geothermal heat, substantially increases the potential for reducing GHG emissions in accordance with national and international targets. RESs have enormous potential, although some more than others, and in contrast to conventional power plants, potential RES energy is not expected to decrease in the future. Regarding RES potential in terms of installed capacity, it is obviously constrained and possible to reach upper limits. This fact requires the optimal long-term allocation of these renewable sources.
RES Integration Costs
The large use of RES (wind and sun) results in specific issues that lead to an increase of the cost of their integration:
The volatility of RESs, i.e., the output power of solar and wind power plants, cannot be controlled and scheduled in the same way as conventional power plants.
Production is unpredictable even for shorter periods, meaning that every deviation between the actual and planned production must be balanced in real-time, which creates the need to maintain reserves in the power system and additional flexibility.
RES costs are divided into three groups, according to [
33]:
Direct costs.
System costs.
Macroeconomic impact.
Direct costs cover building and financing costs (loans, etc.), fuel costs, variable operating and maintenance costs (VO and M), and fixed operating and maintenance costs (FO and M), and they are often called the levelized cost of electricity (LCOE). System costs consist of costs related to integrating power plant into an existing power grid. Therefore, system costs cover balancing costs (balancing energy), integration costs (needed reserve), and network-related costs such as the upgrading and/or construction of the grid, new congestions, and transmission losses. The macroeconomic impact covers RES power plant impacts on gross domestic product (GDP) and social welfare, incurred external costs/benefits related to the environment and the local community, and effects on the employment rate. The uncontrolled penetration of one specific production technology can have effects on the local and global economy, especially regarding a large increase in RES share. Therefore, an overall economy level analysis is of great importance.
3. Energy Storage Technologies
EU targets for the transformation of traditional power systems towards low carbon power systems largely rely on supporting the role of energy storage technologies. With the increasing RES penetration level, the differences between the production and consumption of electricity are becoming increased and more unpredictable, which poses specific issues for power system operators. In this regard, the additional—mainly short-term—flexibility provided by energy storage technologies can greatly help system operators to keep the system in balance. In other words, energy storage technologies will act as support in power systems with a significant share of unpredictable and volatile wind and solar power plant production. On the other hand, the usage of ESSs in distribution systems can provide a large variety of benefits such as decreased production costs, improved efficiency, and distribution system operation and management. It must be stressed that the main reason for this important role of ESSs in modern power systems is a fundamental feature of electricity: it constantly requires the same amount of production and consumption. This balance is needed in order to keep the power system in stable operation.
Besides the short-term balance of electricity production, there are driving factors that require mid-to-long-term ESSs. One of the factors is the frequent excess of produced electricity from RESs that can be either curtailed or stored in ESSs with almost zero marginal cost. This way of energy storage can be provided by different types of ESSs such as EVs, PSHPPs, compressed air storage, or fixed battery energy storage systems (BESS) [
34]. There are also frequent periods with low production from RES that can result in a lack of electricity in the power system. In these periods energy stored in previously mentioned ESS technologies can be used from and in that way decrease system production. Consumers equipped with adequate technology can also use more electricity during periods of low electricity prices and store used the surplus of electricity in their ESSs that can be used later during the peak load periods. This is especially valid for those customers that have EVs, which can be charged in the off-peak period and discharged during peak load period if there is enough energy in their batteries.
3.1. Pumped-Storage Hydropower Plants (PSHPPs)
The ESS technology with the by-far largest share of total worldwide storage capacity (almost 99%) is in form of PSHPPs, with a capacity of over 150 GW. This form of power plants is a net consumer of electricity due to the fact that the cycle efficiency of a PSHPP is well below 90% [
35]. It is often modelled as a battery system because it uses water from upper storage when producing electricity and water from lower storage when consuming (pumping water) electricity. This ESS technology is very well-known to humanity, and it has very long technical lifetime but strongly depends on local geographical conditions where there are two reservoirs of water on proximity to each other with substantial altitude differences. Most of such places in the world are already used for this ESS technology purpose. Therefore, large investment costs (economy of scale) and a lack of suitable locations are the major barriers for further increases in the capacity of this energy storage and production option.
3.2. Electric Vehicles (EVs)
Electric vehicles are transport devices that use electricity from an electric motor that is fueled by batteries or some other source of power. Scotland inventor Robert Anderson invented the first electric vehicle in the 19th century, and it was one of the first types of vehicles, but fossil-fueled vehicles very soon dominated and pushed away electric vehicles. In last decade, the research and development of electric vehicles have resurrected this type of transportation device. The reason for this is the global desire and sustainable development target to significantly decarbonize the transport sector by the midpoint of this century. The type of electric motor, engine, and usage of battery divide EVs into several categories:
Hybrid electric vehicles (HEVs).
Plug-in hybrid electric vehicles (PHEVs).
Battery electric vehicles (BEVs).
In this paper, only the BEVs were considered and modelled. For this reason, a brief description of only this EV type is provided in the following text. BEVs are designed without diesel or petrol motors, they do not have a reservoir for fuel, and you cannot see the exhaust pipe behind them because they are driven by an electricity-only powered motor. In contrast to traditional cars, the heart of the electric vehicle is an electric motor, the basic part of a BEV, with a battery and engine controller, and the only way to drive the engine is by discharging the associated battery. Essentially, an electric motor transforms energy discharged from a battery into EV kinetic (mechanical) energy that allows an EV to move. The engine controller system, which is constructed in the same manner as in traditional vehicles, uses an analogue-to-digital converter to control the performance of an EV engine by simply pushing the accelerator or brake pedal [
36].
Regarding operating mode and power flow direction relative to the connected grid, there are four states of EV batteries [
37]. An EV battery can be charging for its own purpose from the connected grid, and this state is called grid-to-vehicle (G2V); an EV battery can be charging from the connected grid for the purpose of the up-regulation of the grid, and this state is called grid-to-vehicle half (G2V/2); an EV battery can be discharging to the connected grid for the purpose reserving the grid, and this state is called vehicle-to-grid (V2G); and an EV battery of one EV can be charging for the purpose of charging the battery of another EV, and this state is called vehicle-to-vehicle (V2V).
In addition to EVs, there could be other battery sources in a power system like a household or stationary batteries. These devices apply more to investing carriers of transmission or distribution networks with the aim of maintaining the quality and stability of a network. Therefore, household batteries and stationary batteries were not included in this model because no national strategic document foresees the significant use of them in the future.
4. Methodology
The analysis in this paper was made using the PLEXOS software tool [
38]. When modelling in PLEXOS, one can decide to use deterministic techniques, stochastic techniques, or a combination of these two to minimize or maximize an objective function. The objective function, depending on the needs, can be total system cost minimization or profit maximization. The optimization can include capacity expansion formulation in long-term planning models for building new resources which is dictated by least cost or economics of retiring the plant. These goal functions are controlled by constraints arbitrary defined by a user such as the working features of generating plants, emission limits to the environment, fuel-related constraints, reservoir and inflow constraints, reserve requirements, heat and electricity load needs, and transmission line constraints. The PLEXOS optimization process usually uses mixed-integer programming (MIP) as the solving technique. After performing an optimization based on the obtained solutions, PLEXOS offers the user predefined output data for preview in a user-friendly graphical user interface (GUI).
PLEXOS has been widely used software for almost two decades in terms of the techno-economic analysis of both national or regional power systems and markets. It is therefore a well-recognized and verified tool by business sector analysis and studies, as well as the scientific and research community.
4.1. Test Model—Republic of Croatia Power System
The Republic of Croatia power system represented the test system for this study. Historically in the Croatian power system, the majority of electricity has been produced from hydropower plants, thermal power plants, and the nuclear power plant Krško that is situated in the neighboring Republic of Slovenia. Croatia has also historically been greatly dependent on electricity import (sometimes more than 50%), and, therefore, a large share of electricity needs is provided by trades in the power markets. Furthermore, hydropower plants are a predominant type of power plants within the Croatian power system with a share greater than 50% in the total installed capacity. There is an insignificant installed capacity in small, distributed sources such as photovoltaic (PV) cells or small hydropower plants. On the other hand, more recently, there has been a significant increase in wind and large PV power plant penetration in the Croatian power system. Currently, there is an installed capacity of 718 MW in wind and 53 MW in solar, which represents around 15% of the installed capacity in the system and more than 10% of the total domestic production [
39].
As instructions for future researchers that want to check this approach for their power systems, a few notes must be stressed. It is necessary to distinguish between power system load and a load of EVs in the transport sector. This was the most important aspect of modelling a power system in this paper. In other words, an EV can discharge either to the grid (G2V) or to drive its engine, and these two kinds of operations must be divided by all means. This approach can be replicated by projecting RES share increases, new power plant entries and the decommission of old ones, and EV number increases for the country of interest. On this basis, it is possible to evaluate CO2 emissions from both the power system and the transport sector.
4.1.1. Node Model of the Croatian Power System
In the model, the basic assumptions from the scenario of strong transition were considered, and all the data (production and investment-related costs for different technologies among others) were used according to the CLSC [
40].
Table 1 presents the production structure for the base year 2015 together with the expansion planning for years 2030, 2040, and 2050.
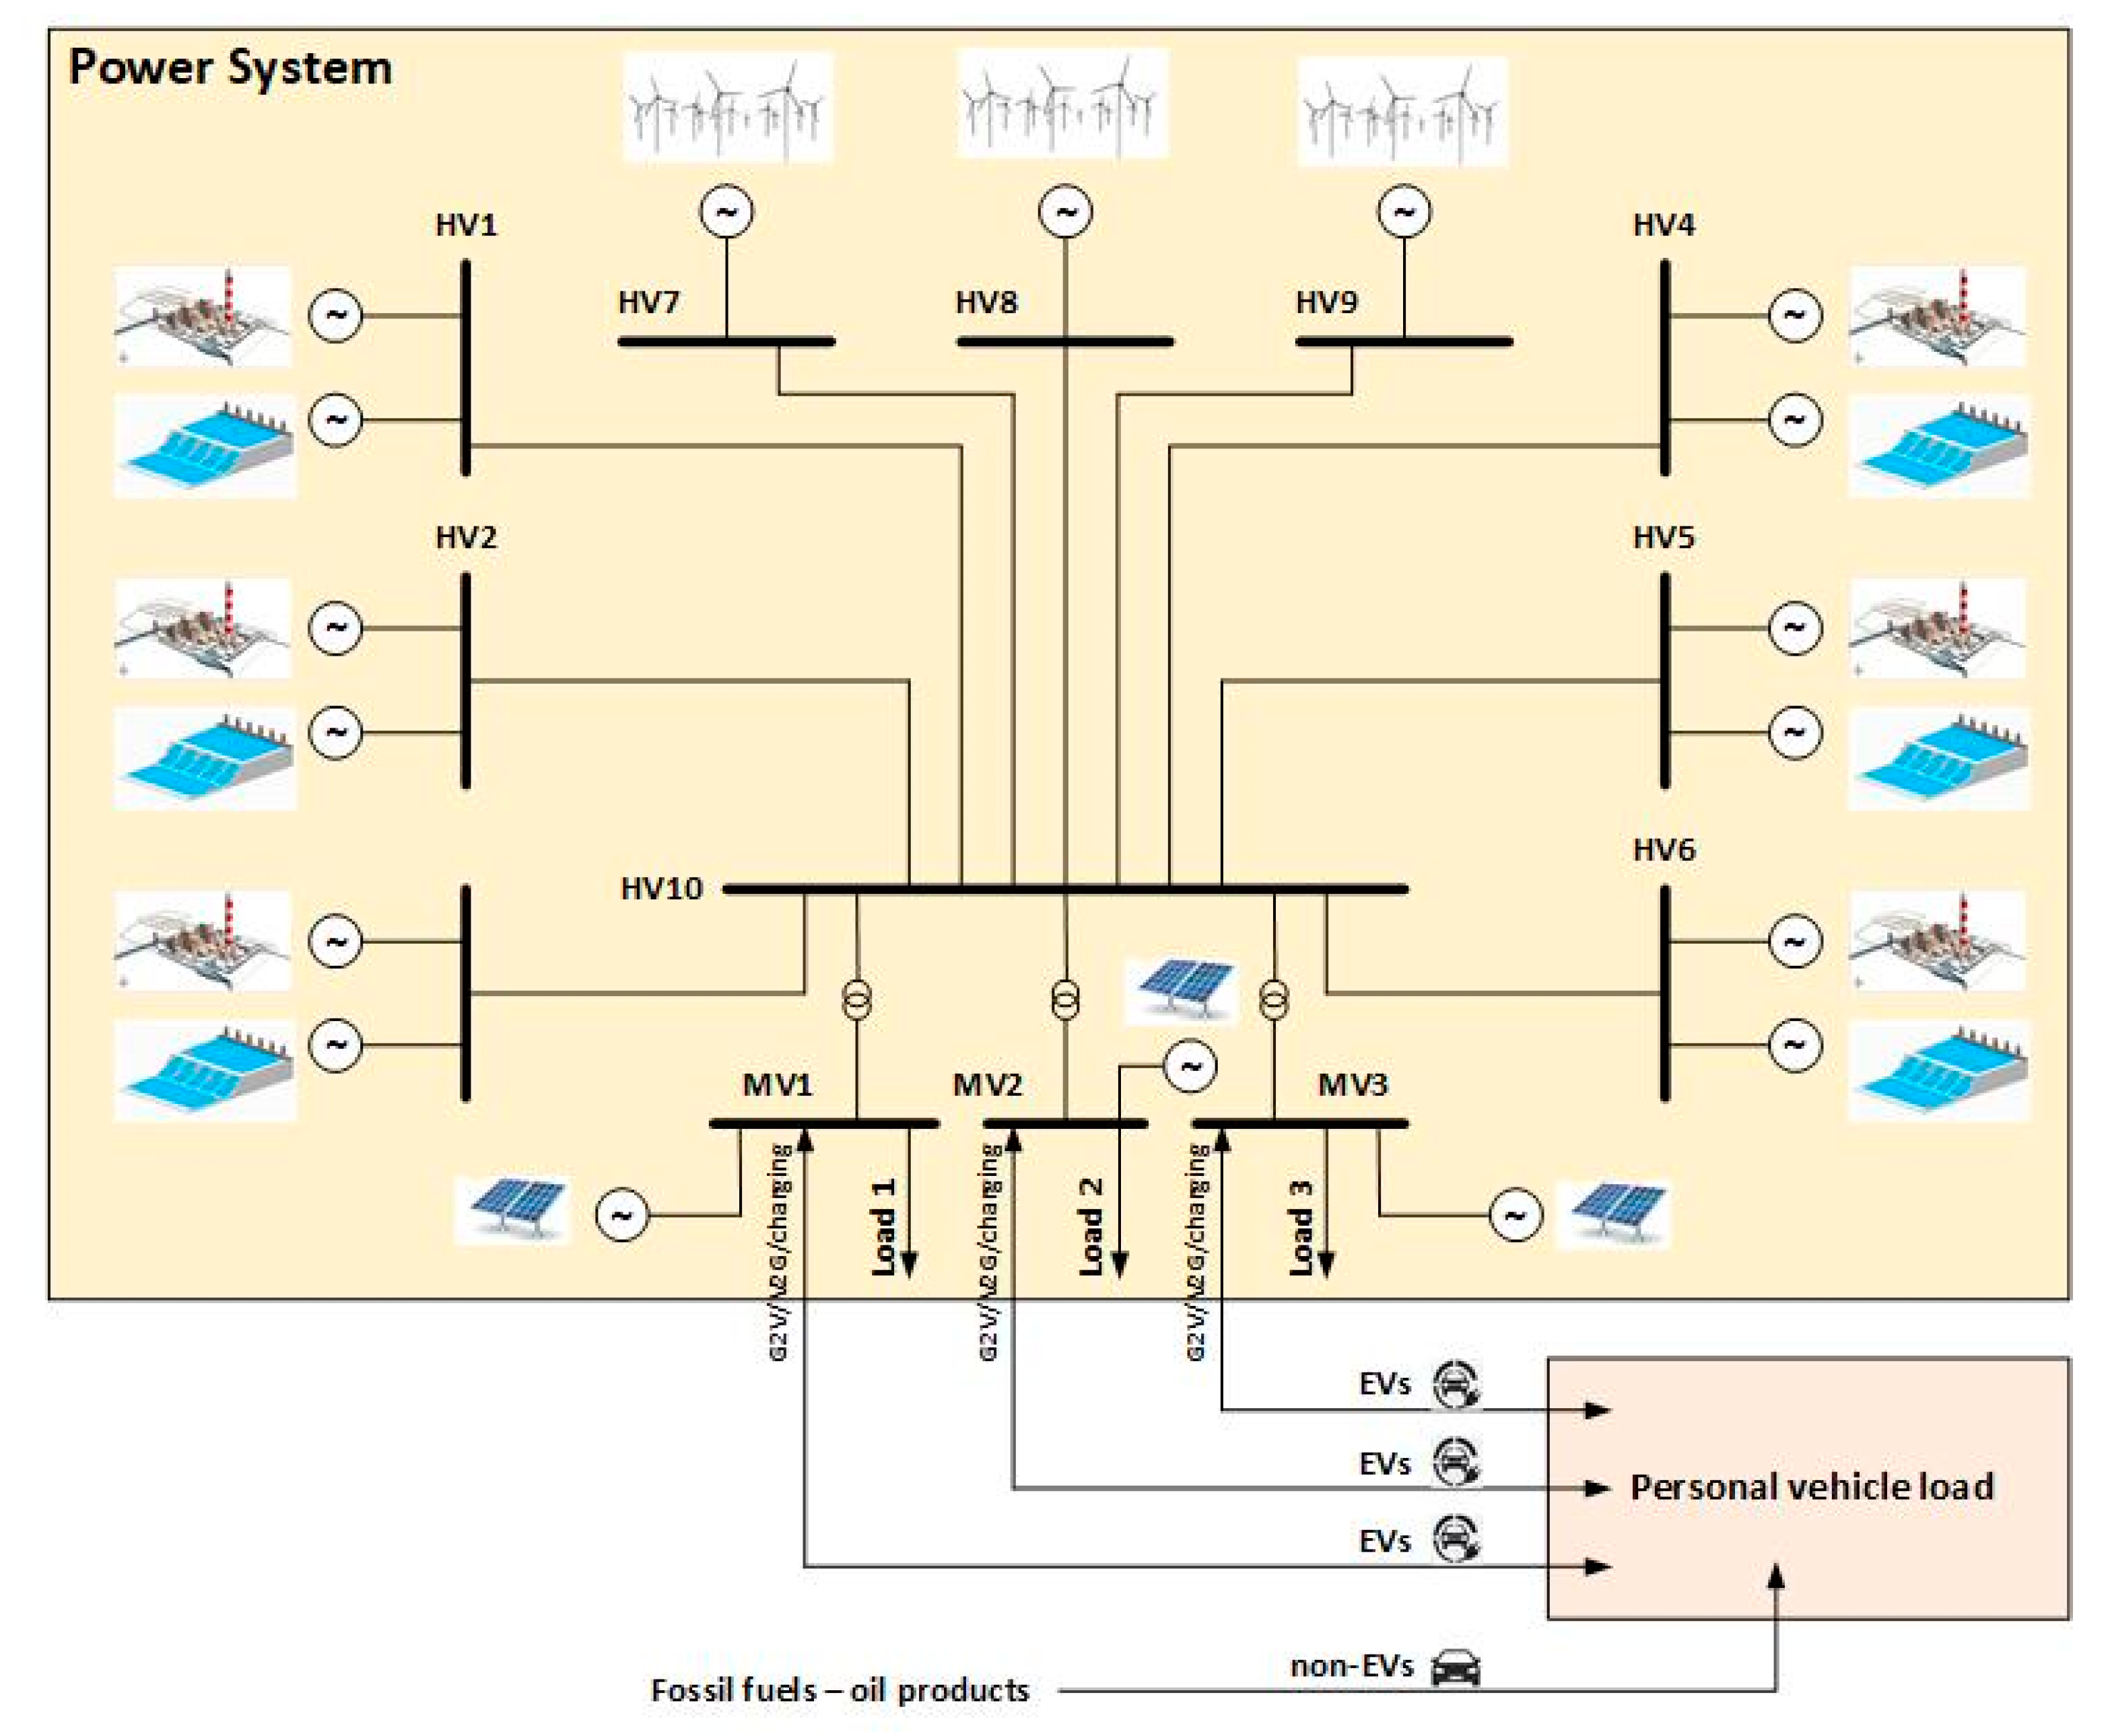
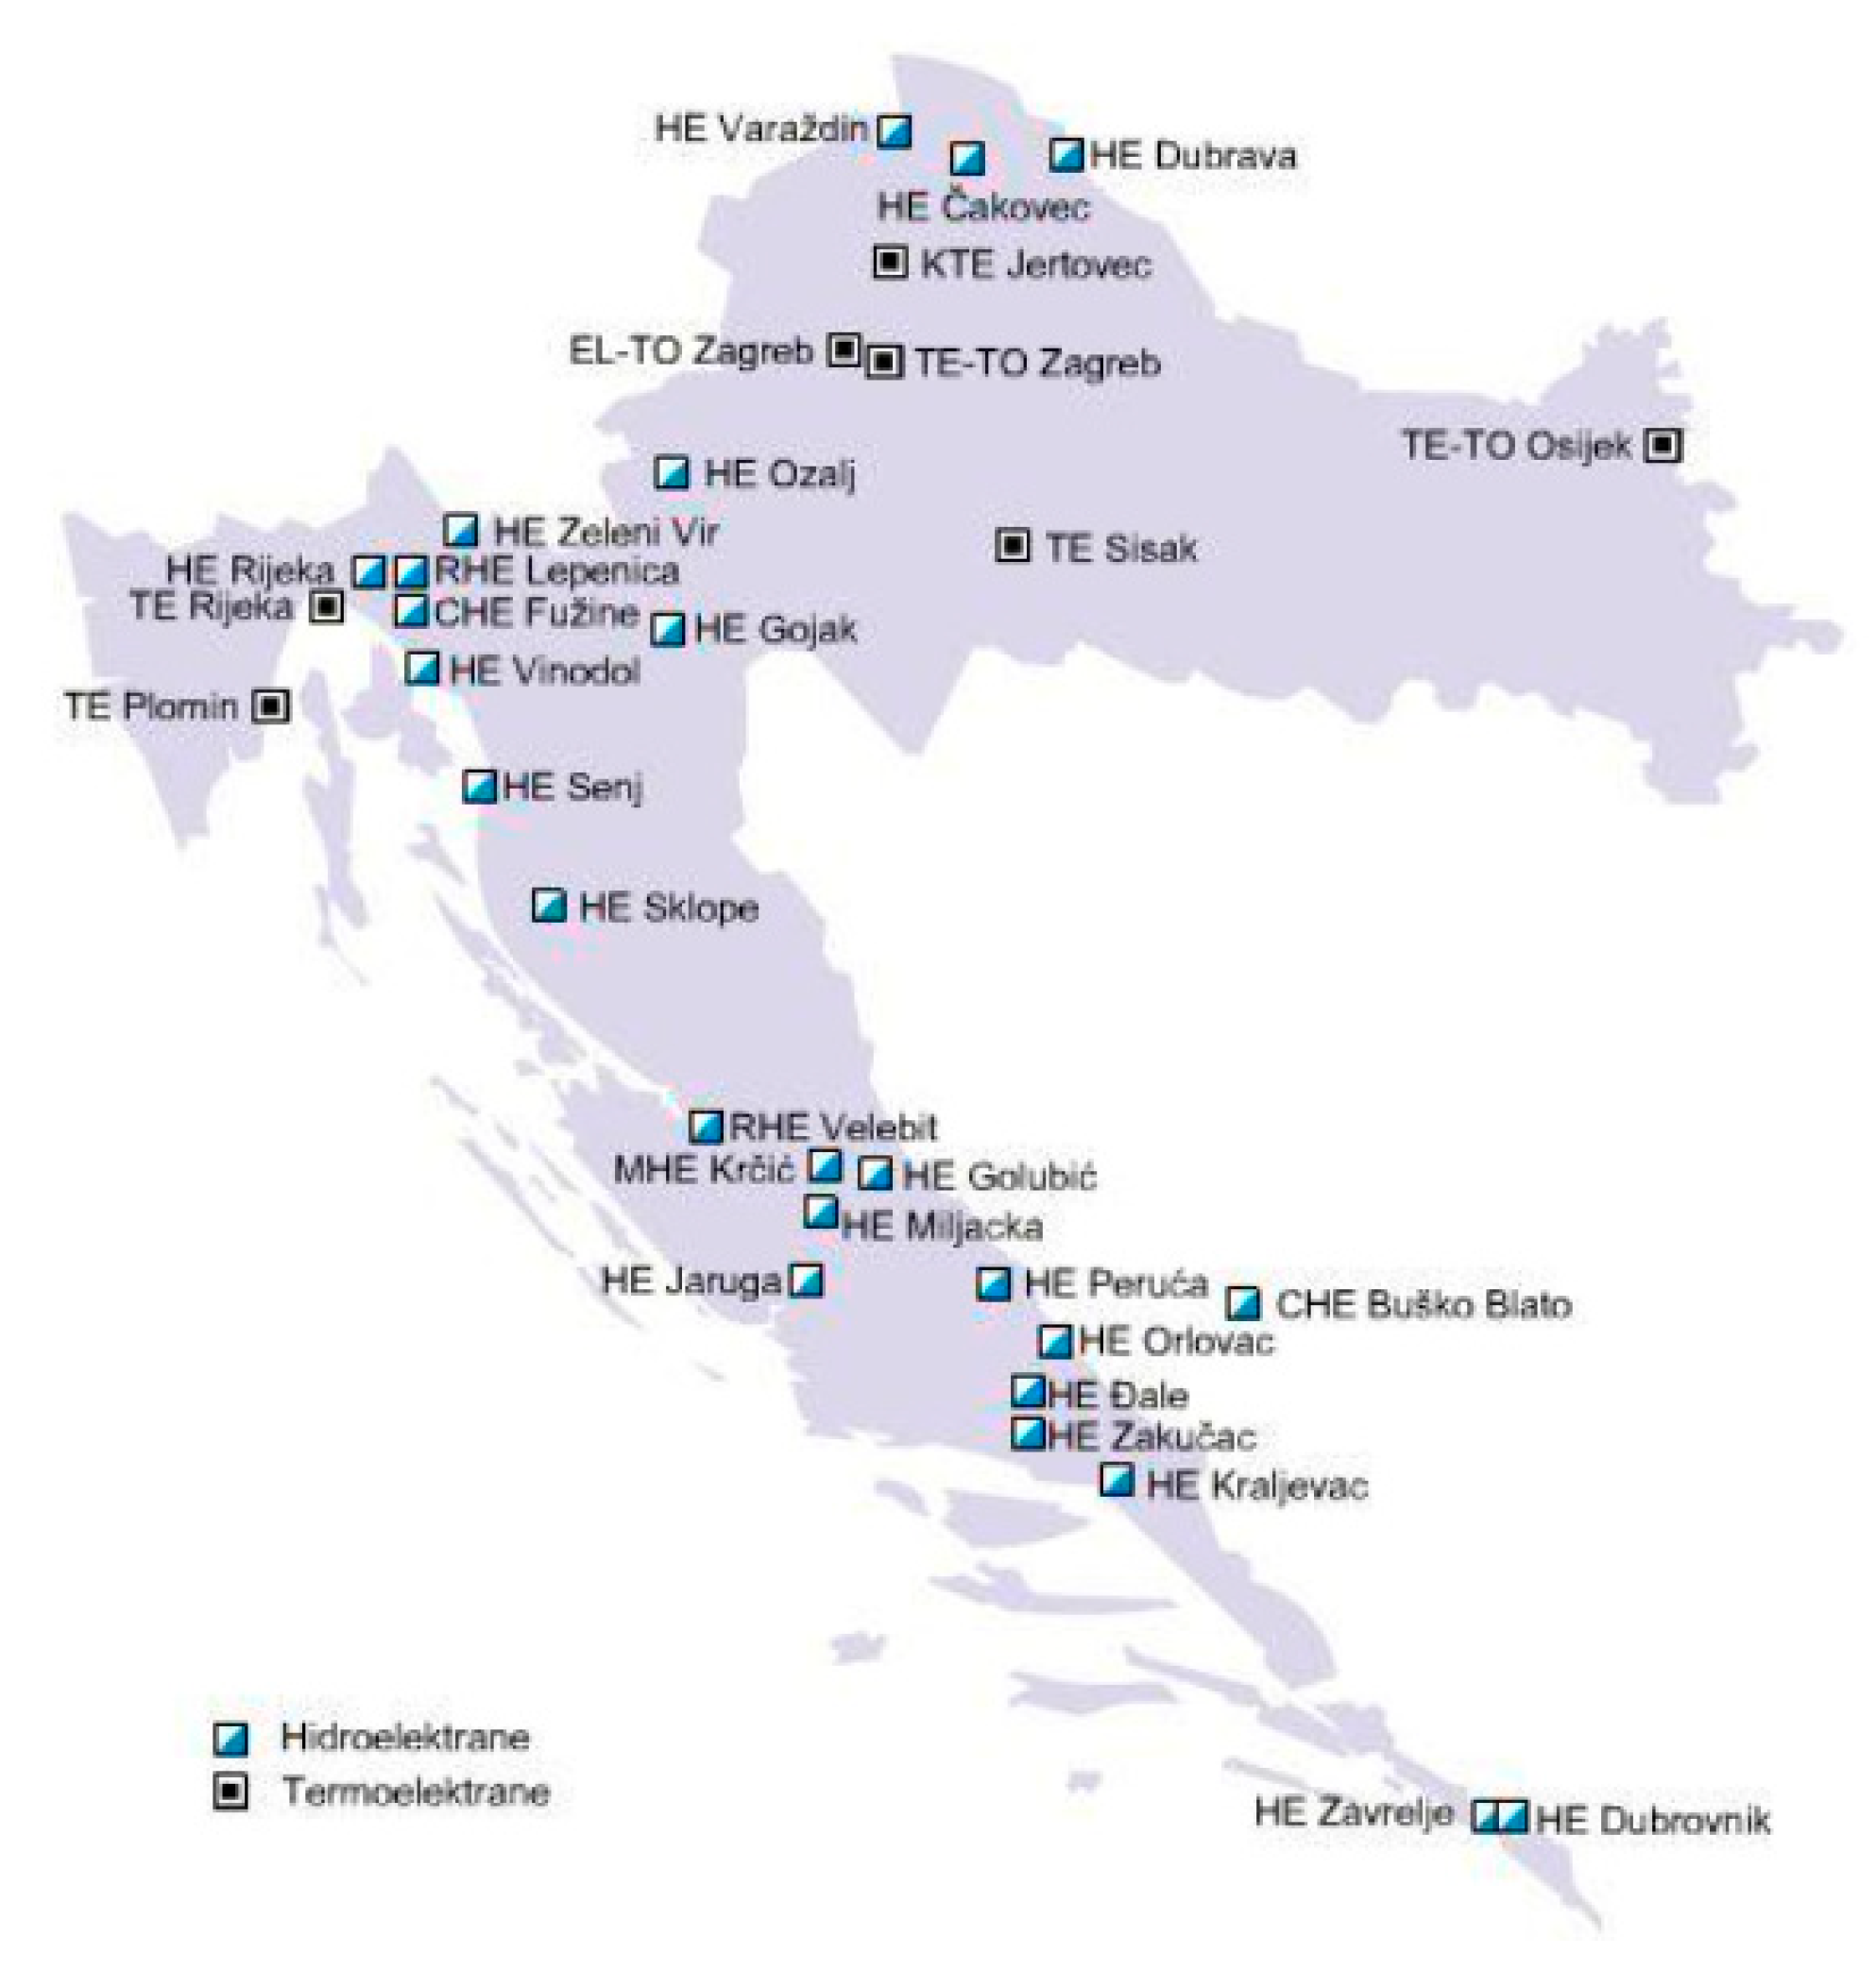
A 400-kV transmission network (high voltage—HV) with the largest Croatian power system nodes was modelled in this research (
Figure 1), alongside a medium voltage (MV) network, and all the modelled power plants were connected to the geographically closest node (
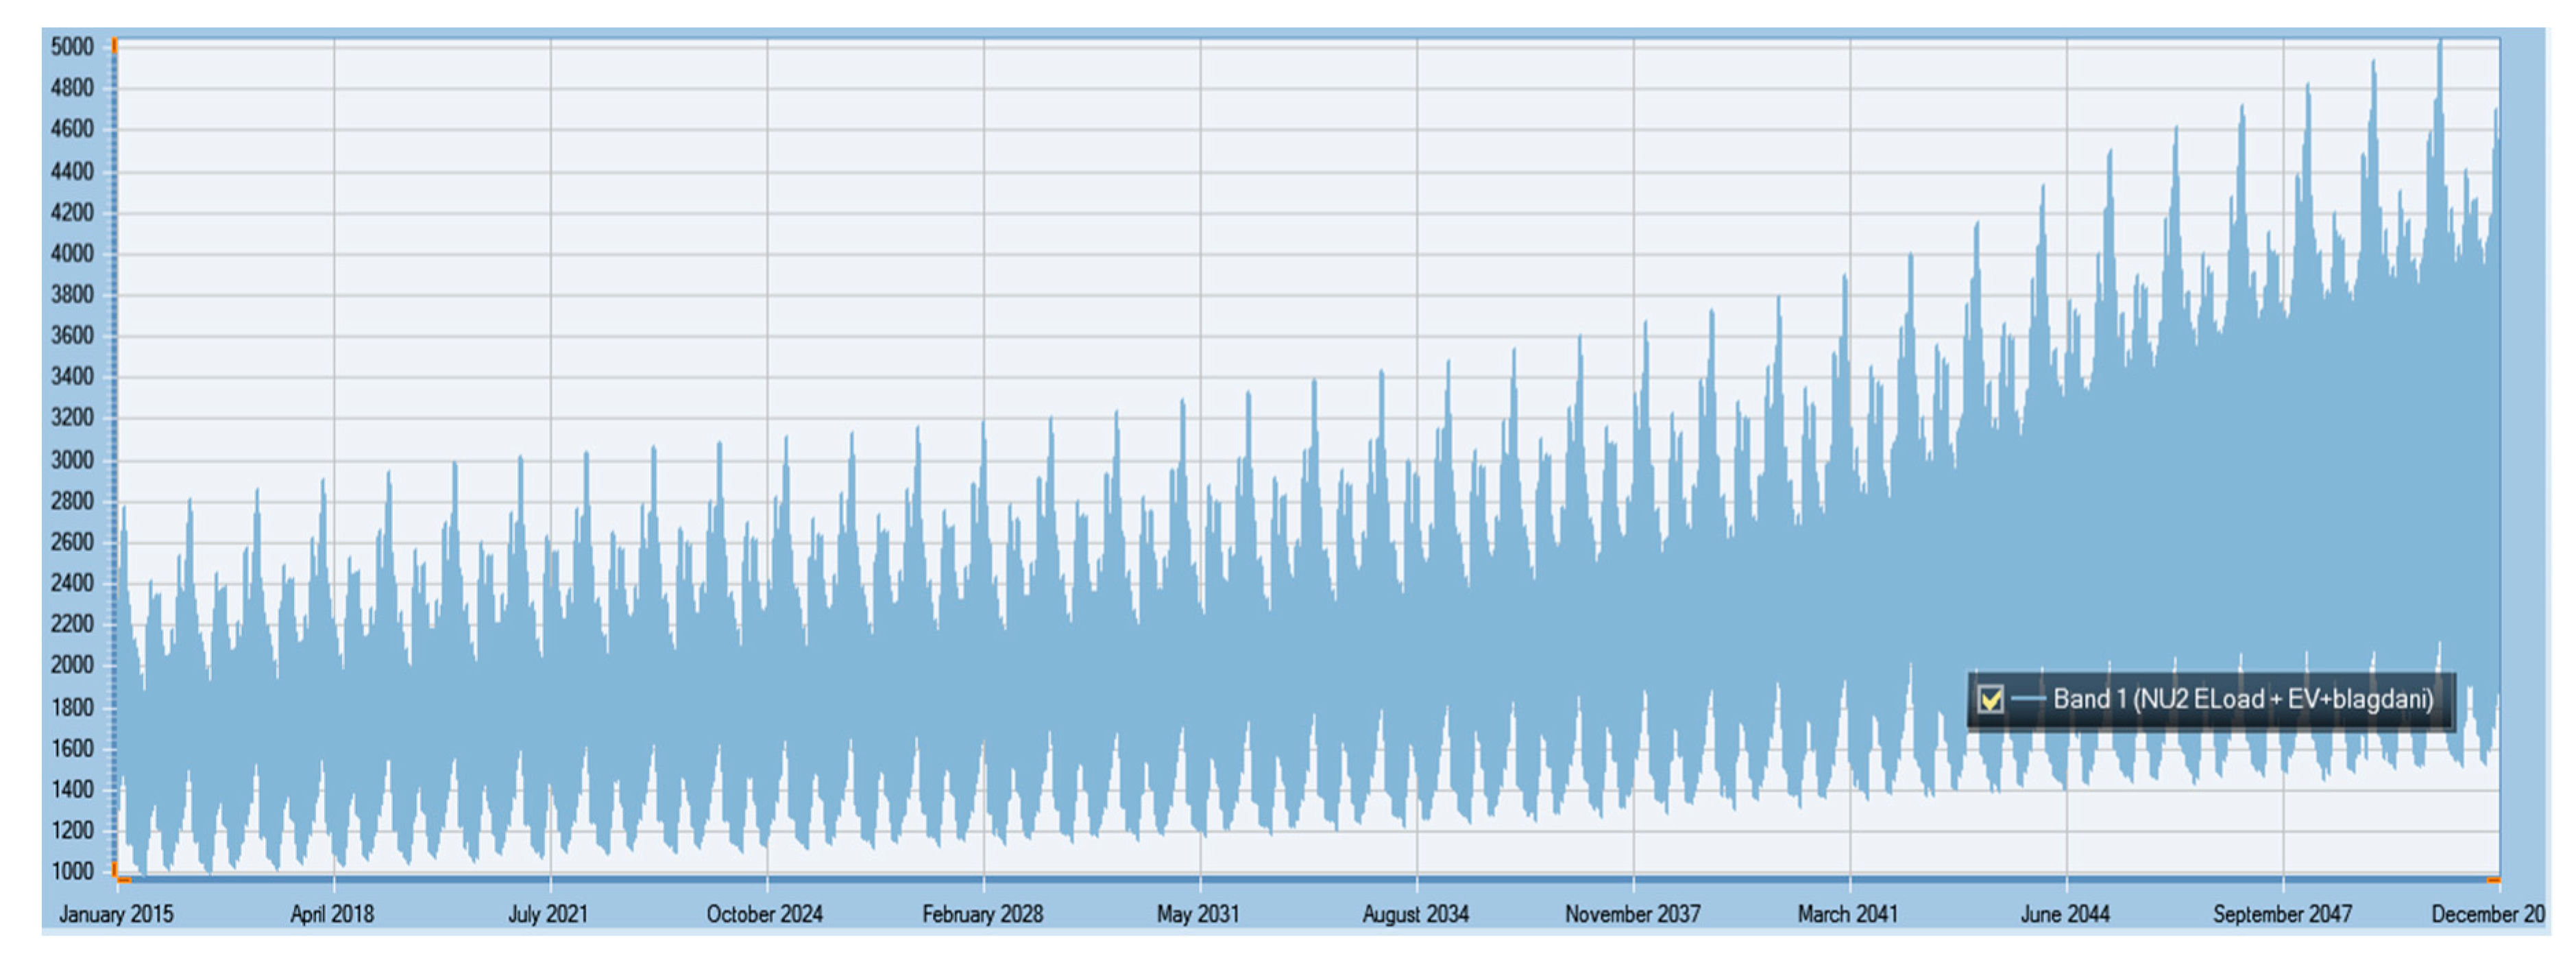
Figure 2). Moreover, the solar power plants were connected to the system at the MV nodes, whereas the connection of wind power plants was assumed to be to HV nodes. The predicted electricity load was distributed over all MV nodes based on shares of actual electricity consumption in those regions regarding the cumulative electricity load (
Figure 3) in the Croatian power system (load 1 was 35%, load 2 was 40% and load 3 was 25% of the predicted cumulative load). It must be noted that the process of the validation and verification of the model itself was performed during the comprehensive and precise development of the framework for the CLCS. Model behavior was tested against real system data that showed a satisfying level of model accuracy. Changes made in the model for the purpose of this paper were such that they could not significantly affect the achieved accuracy of the original model. Additionally, that verification would not be even possible because, at the moment, there was no single power system with a significant share of integrated electric vehicles that could be used as a benchmark.
The hourly data on electricity load were estimated and prepared for up to 2050 based on the real hourly baseload profile from 2015. It was assumed that both maximum electricity and total electricity consumption will increase proportionally. Due to the higher anticipated consumption of electricity in industry and services, as well as the electrification of transport, the average growth rate of electricity consumption was estimated to be 1.2% per annum from 2014 to 2030 and 1.7% of growth from 2030 to 2050. In 2050, electricity consumption was assumed to be by 70.1% higher than 2014.
Expansion candidates that will enter the Croatian power system were determined based on the data provided by HEP d.d.—Croatian National Power Utility. After the decommissioning of the existing power plants, there will be no new coal-fired power plants entering the Croatian power system. The average hydrology was taken into account while anticipating natural inflow for the reservoirs of hydropower plants. The penetration levels of new RES capacities for 2020 were determined based on the quotas set in the document regarding changes of the tariff system for the production of electricity from the RES and cogeneration [
42].
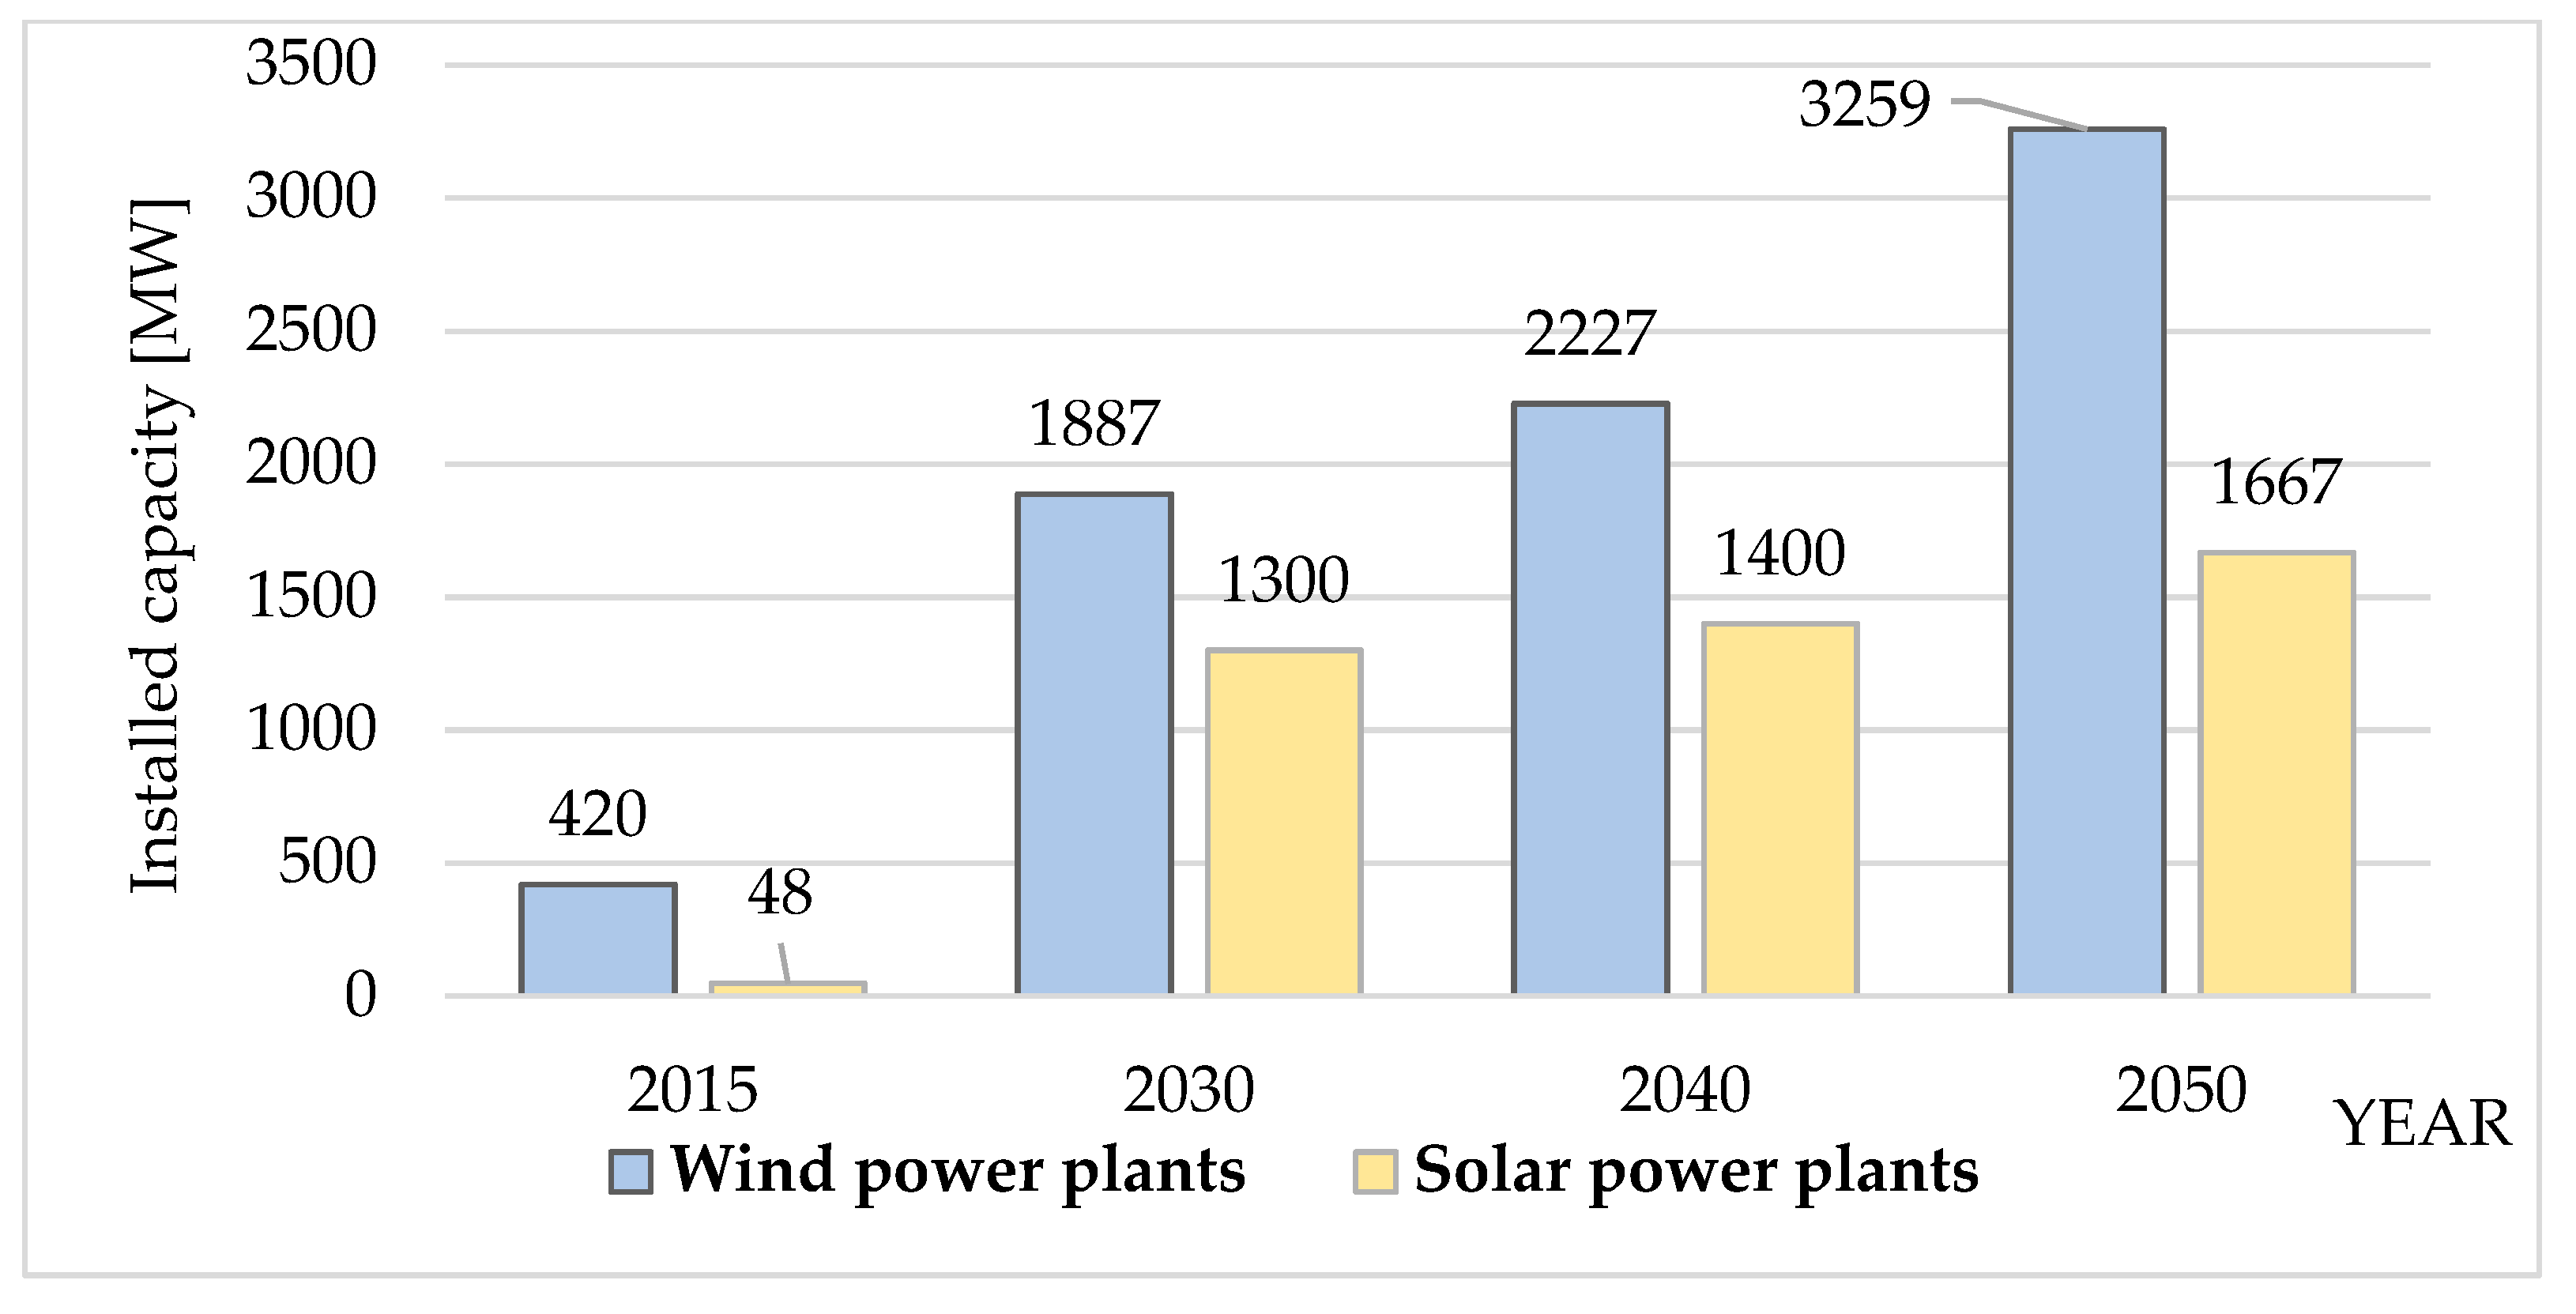
Figure 4 shows the penetration level of wind and PV power plant capacity, as modelled in the case study and according to author’s expert judgement and data from the CLCS. In addition, the model did not consider incentives after 2020 for new solar (with a quota of 1075 MW) and wind power plants (with a quota of 1050 MW). On the other hand, capacity incentives for small hydropower, biomass, biogas, and geothermal power plants will continue based on a feed-in-premium method with a total quota of 2265 MW. In other words, new wind and solar capacities are expected to be driven by market conditions and signals. Regarding emissions, the annual limits to produce CO
2 emissions and emission prices were set according to the CLCS [
40]. Modelled expansion candidates included all currently available technologies with associated technical features and costs. The CO
2 price in the EU ETS was assumed to continuously rise to 90 €/ton by 2050, and limits on CO
2 emissions of 1725 ktons from 2030 and 555 ktons from 2050 were set in the model. Those limits on CO
2 emissions were control limits. However, as is shown in the results, those limits were never reached in the proposed model; in other words, they never became boundaries. After 2030, the electricity market was assumed to be inaccessible. The main reason behind this assumption was to isolate the EVs’ flexibility potential and to avoid selling extra RES-produced electricity to the external market. Additionally, unserved and dump energy were not permitted in the model; in other words, the electricity load had to always be met and no surplus electricity could be produced. In this way, RESs were expected to be occasionally curtailed regarding electricity load and cross-border transmission capacity usage. Namely, the assumption was that at any time, 1.5 GW of cross-border transmission capacity was available both for the import and export of electricity.
4.1.2. Object Modelling in PLEXOS
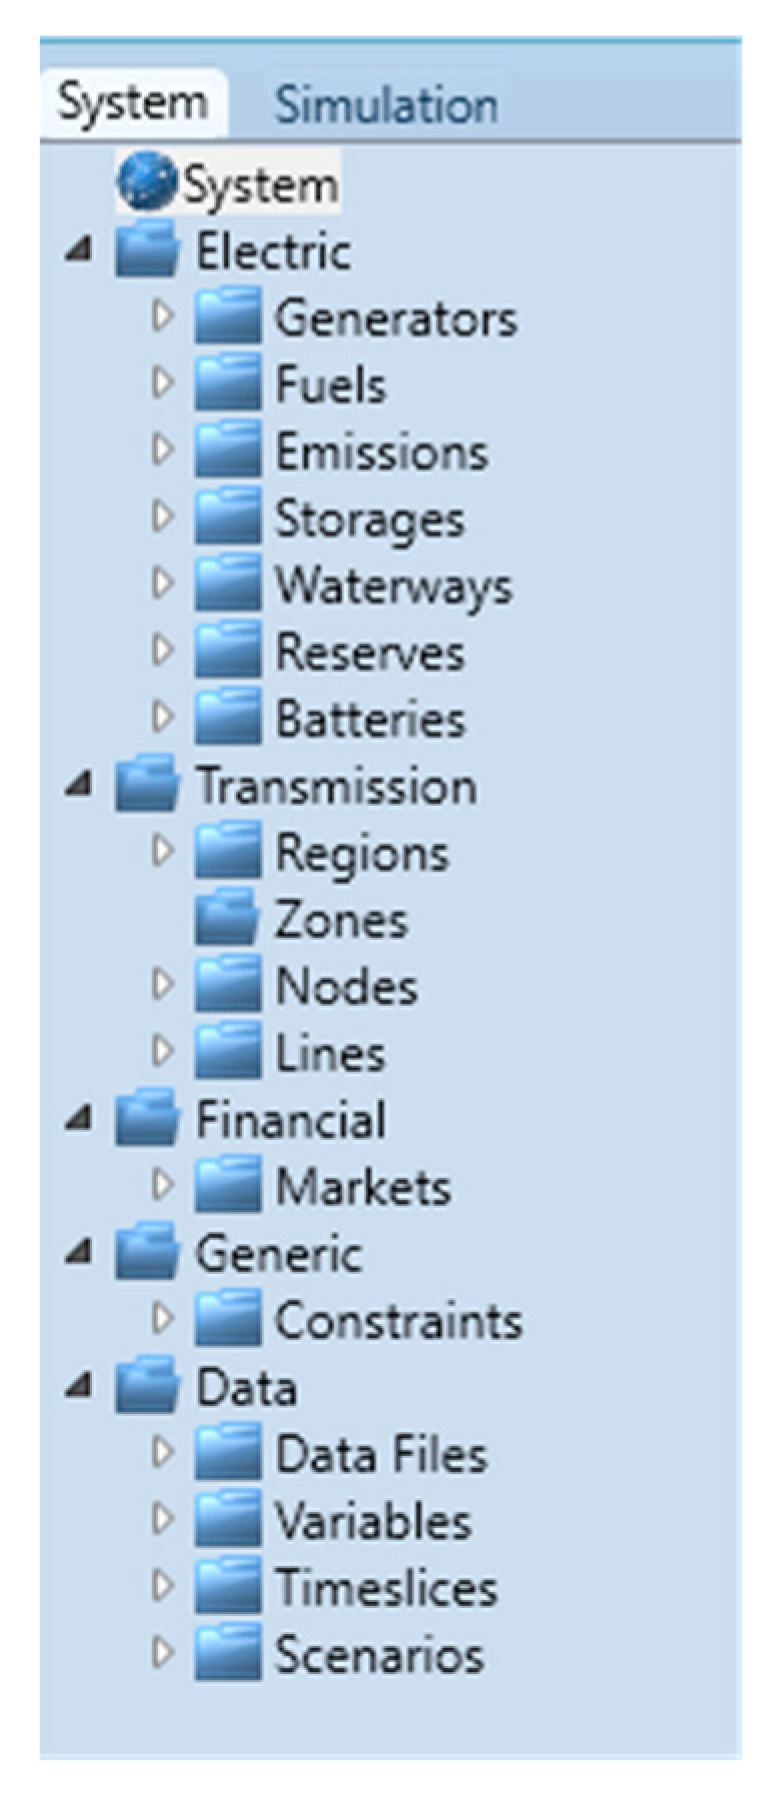
The above-described node model of the Croatian power system was modelled in PLEXOS. The modelling included the definition of each element of the power system, which was represented by an object in PLEXOS. The defined objects included generators, lines, nodes, fuels, battery systems, reserves, and markets. Those objects were grouped in different categories, as shown in
Figure 5.
Objects representing power plants, both existing and planned capacities, were first modelled. Those objects were grouped in the generators class and classified according to the primary energy source and type of the power plant. Modelled power plants included nuclear power plants, gas-fired power plants, coal-fired power plants, run-of-river hydropower plants, storage hydropower plants, pumped storage hydropower plants, biomass power plants, biofuel power plants, geothermal power plants, small-scale hydropower plants, solar plants, and wind power plants. Each created generator was associated with the appropriate technical limitations and operating specifications that were used during the simulation to seek optimal solutions for each time period of a given horizon. Additionally, for each thermal power plant, the fuel object had to be created and linked to the power plant. Therefore, the fuel objects were created as follows: extra light fuel oil, fuel oil, natural gas, and coal. The projected price movement until 2050 was defined for each fuel [
40]. Furthermore, thermal power plants generate CO
2 emissions while operating, which had to also be taken into account due to the emission costs. This emission object was also created and associated with each fossil fuel or thermal power plant. All power plants objects were added to the Nodes class in the Transmission category according to the scheme in
Figure 1. Nodes were connected via created lines objects. Those objects were grouped in the Lines class and included high and medium voltage lines with specified characteristics for each type. Those characteristics, among others, include the max power flow, resistance, and reactance of each specified line object.
Class batteries have been used to model energy storage systems and were represented by electric vehicles in the proposed model. The properties of each object in Batteries class included capacity, initial state of charge (SOC), charge efficiency, discharge efficiency, maximum input power, capacity degradation, economic life, and fixed and variable operating and maintenance costs. More details on EV modelling can be found in
Section 4.4.
4.2. Wind Power Plants Modelling
The anticipated entry of new production units into the grid and the existing installed wind power plants capacity in the period up to 2050 were modelled. Current and future production units were divided into nodes by the modelling of three geographic areas with different wind patterns. Historical data and measurements from 2015 were used for each of these areas to forecast an hourly diagram of wind power plants production by 2050, meaning that the wind production in each region was modelled separately and specifically for that region. The generated hourly diagrams, stored in .csv files, were associated with data files (timeseries input that support several text file formats) and linked to each existing and future production unit.
Table 1 shows the penetration level of wind power capacity for the specific analyzed years.
4.3. Solar Power Plants Modelling
The modelled existing PV power plants and anticipated production units were divided into nodes by the modelling three geographic areas with different insolation patterns. Those three geographic areas were inland, coast, and Dalmatia. Historical data and measurements from 2015 were used for each of these areas to forecast an hourly diagram of PV power plant production by 2050. The solar production in each region was modelled separately and specifically for that region. The generated hourly diagrams, stored in .csv files, were associated with object data files and linked to each existing and future production unit.
Table 1 shows the penetration level of the PV power capacity for the specific analyzed years.
4.4. EV Modelling
As already stated, for the methodology used in this paper, only BEVs with V2G technology were modelled. In accordance with the data from [
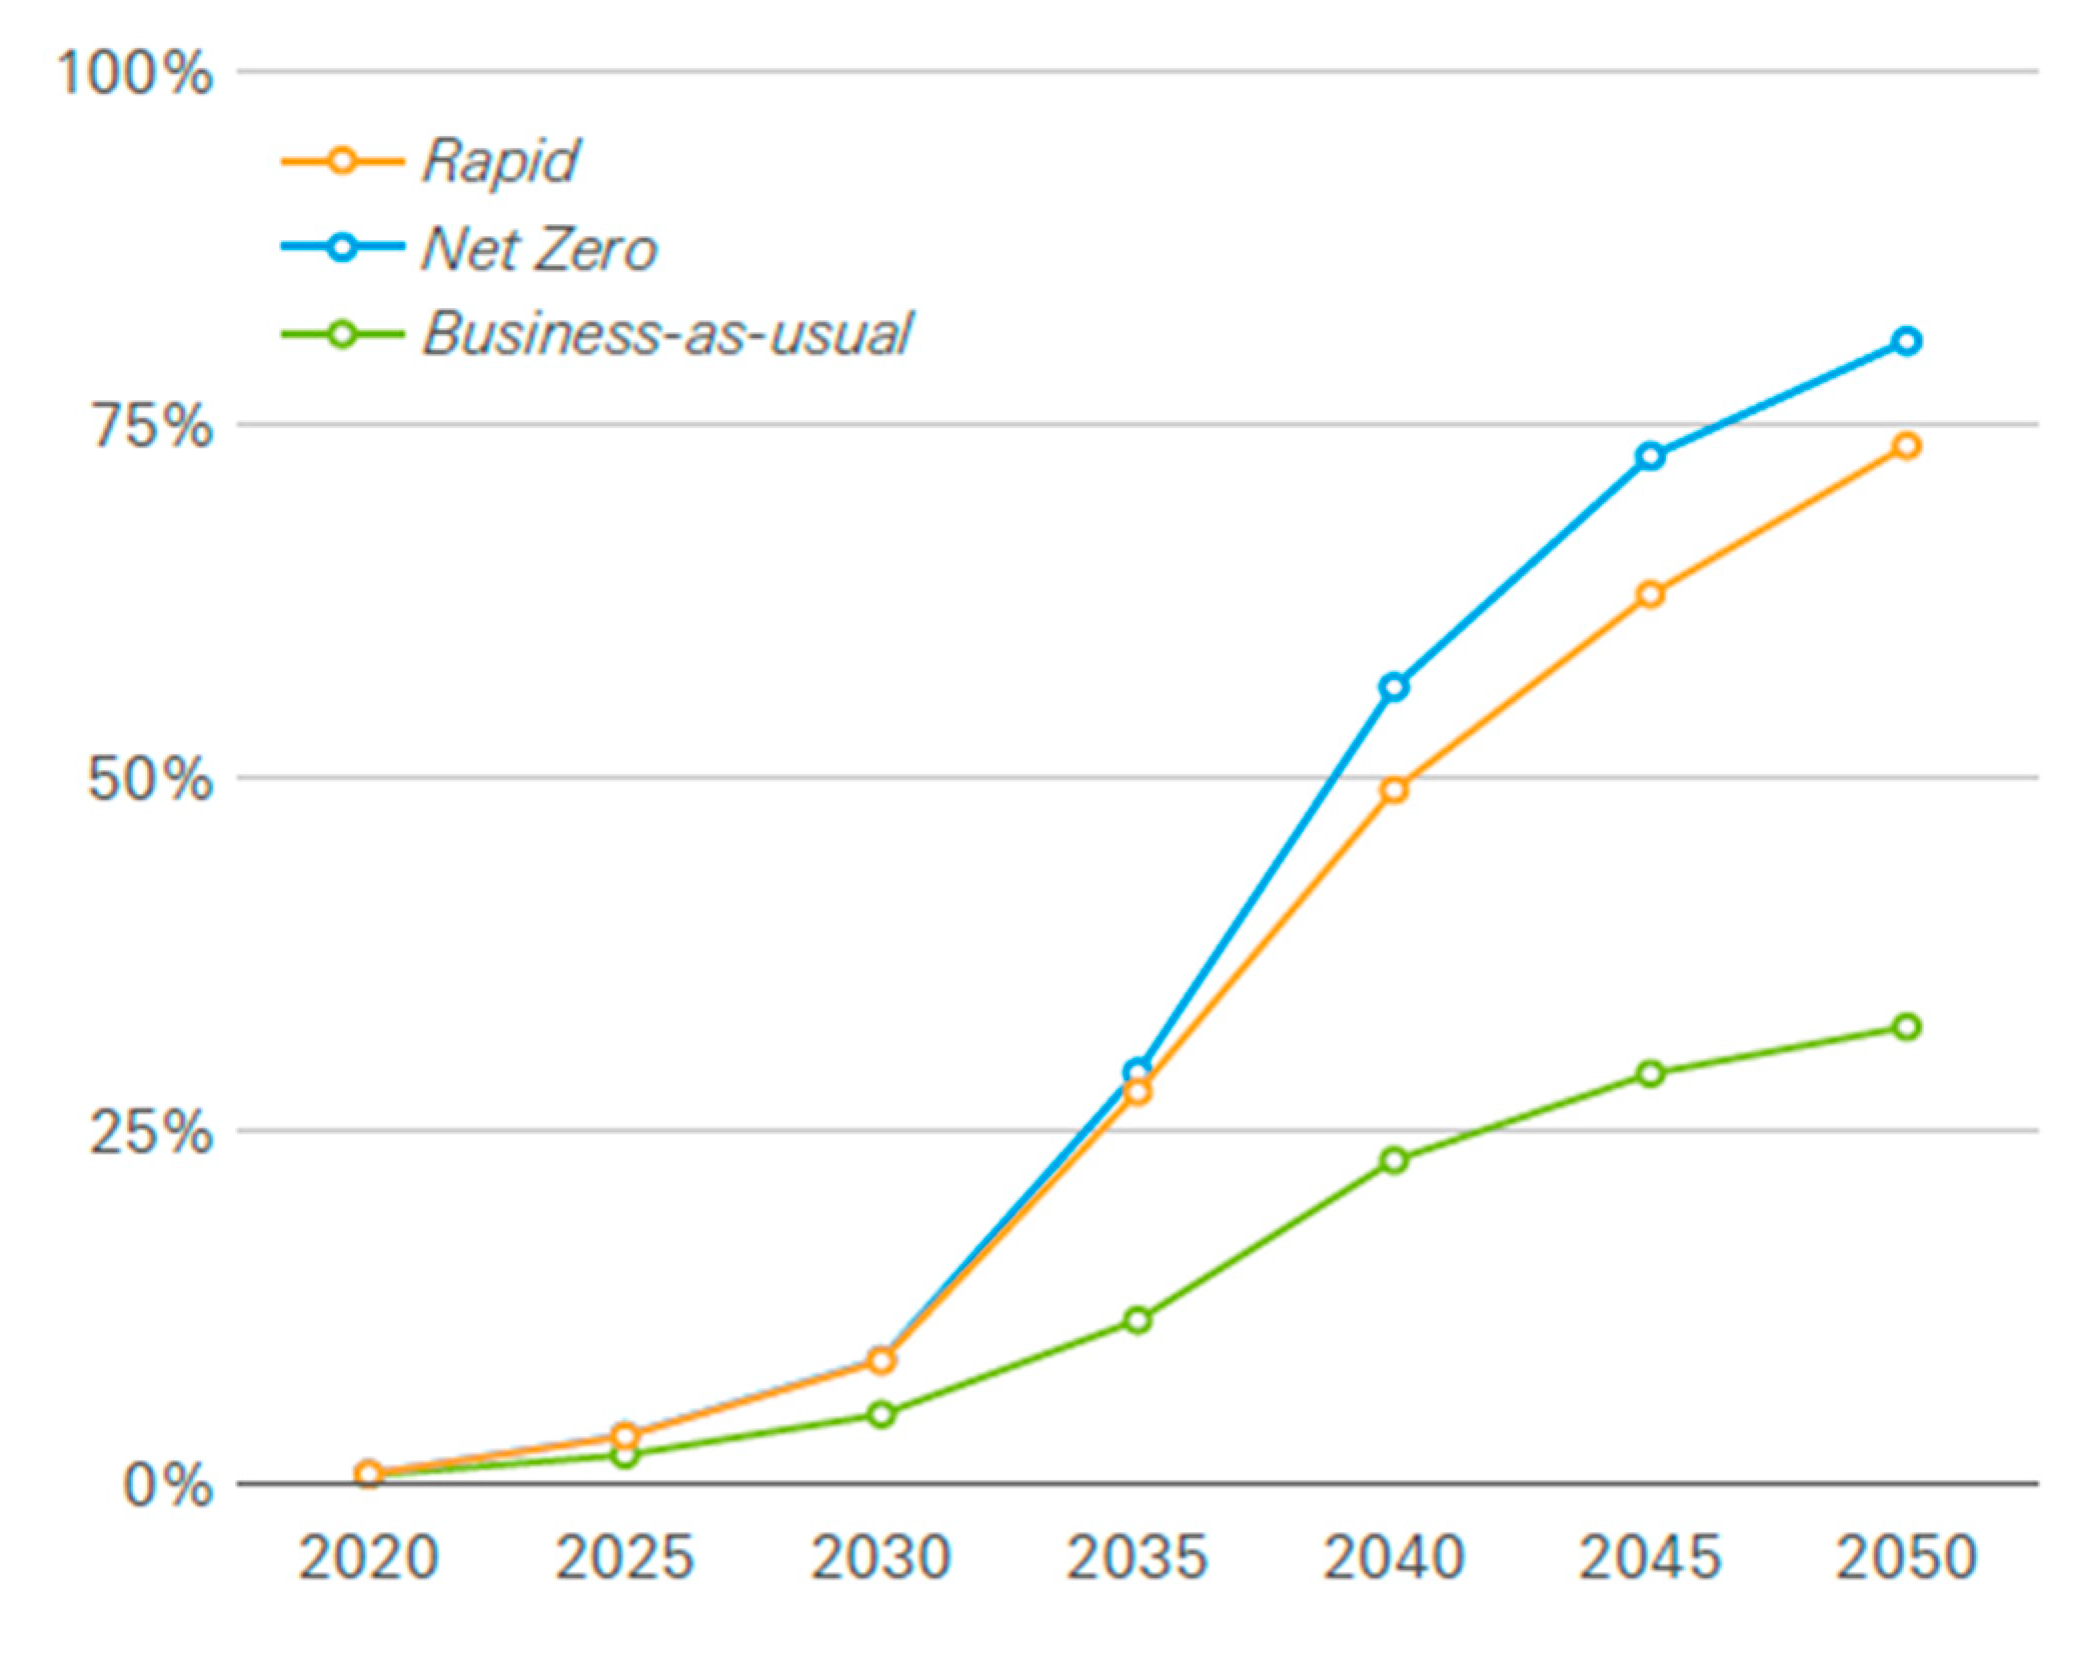
40], the total number of EVs entering the transport sector each year from 2020 to 2050 was grouped into 20 EV objects that represented a set of EVs with associated annual capacity growth. It is expected that by 2030, the number of EVs will be 150,000 (4% of the whole car fleet), and by 2050, the number of EVs will increase to 1.5 million (75% of the whole car fleet). This is in accordance with the data released in [
43] where, in rapid and net zero scenarios, the electric vehicles accounted for between 80 and 85% of the stock of passenger cars. When all vehicles were considered, the electric vehicles accounted for between 70 and 80% of four-wheeled vehicle kilometers (VKMs) travelled on roads in 2050, as shown in
Figure 6.
Additional sustainable fuel for vehicles can be hydrogen. According to the authors of [
43], it is very questionable how the hydrogen market will evolve, as well as how liquid and deep will it be. It has been suggested that it is expected that almost all personal light vehicles will use batteries, and possible hydrogen usage is envisioned for heavy-duty vehicles like large trucks that were out of the scope of this paper research.
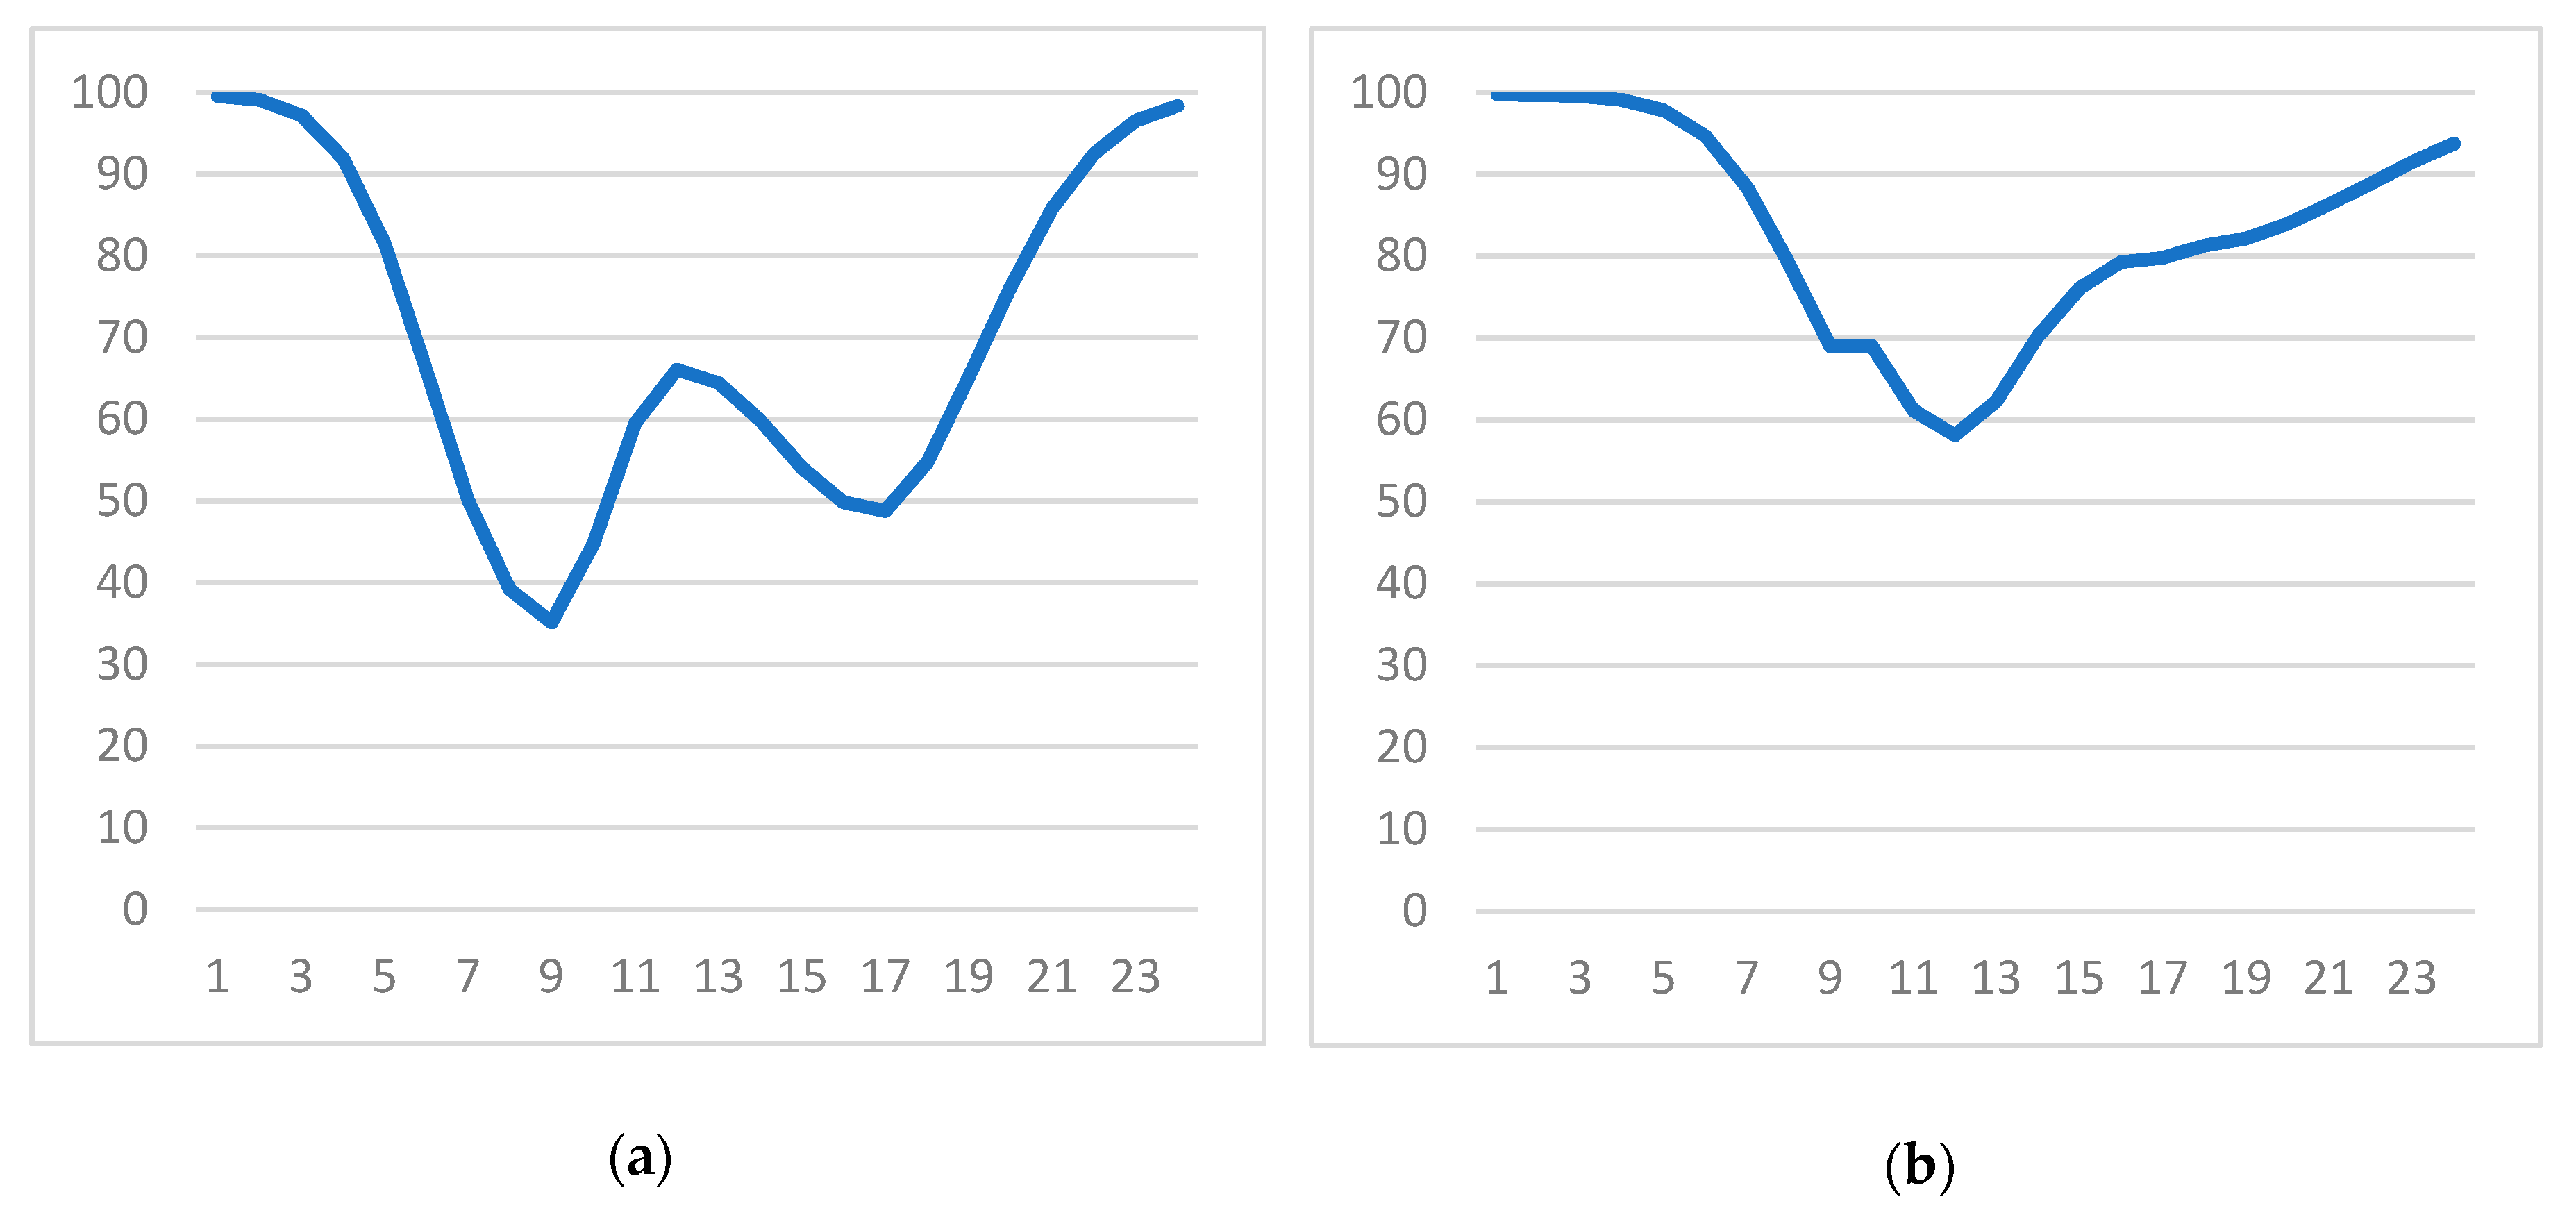
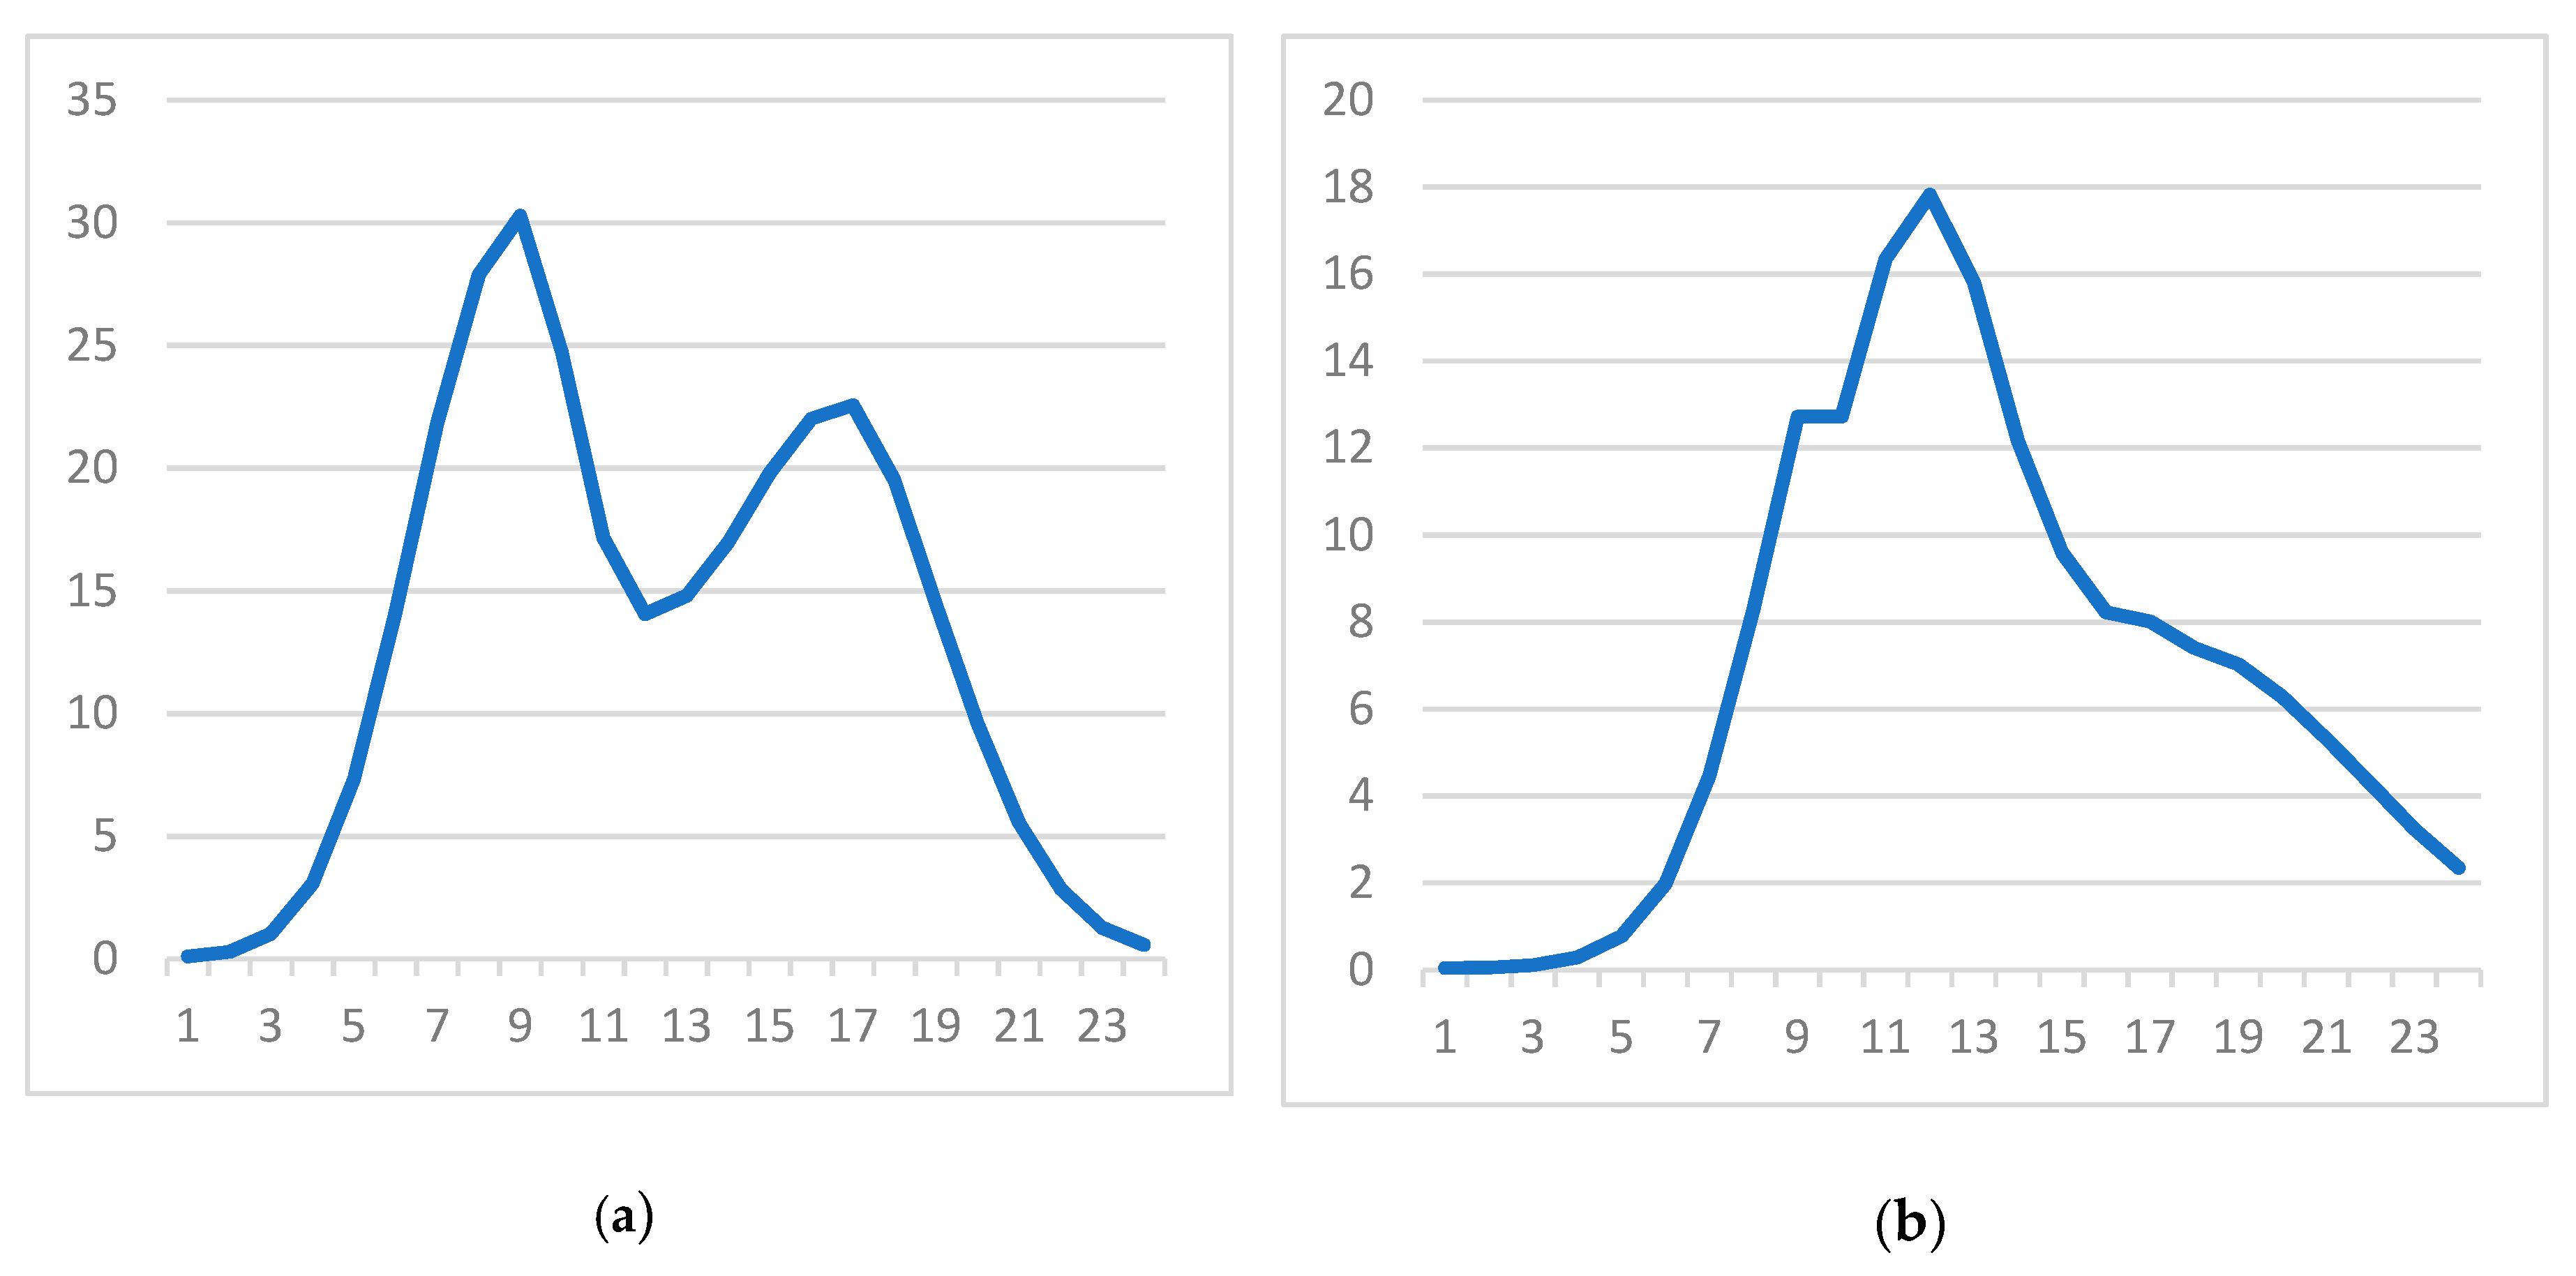
In addition, the maximum hourly power that each group of vehicles had during the day was also constrained and modelled (
Figure 7a,b). The patterns presented in
Figure 7a,b were defined and agreed upon during the development of the framework for the CLCS as part of the expert judgement study. Hourly diagrams, which differ between working days and weekends or holidays, show the assumed mobility of EVs for each group of EV objects, i.e., their transportation load (
Figure 8a,b). Namely, the own consumption of a group of EVs, shown on graphs, was used as a constraint parameter. The constraint was related to the possibility of each group of EVs to provide the energy into the grid, i.e., when EVs operate in the V2G mode. These patterns were based on those used for the development of the framework for the CLCS as part of expert judgement study that were derived from those available from the EnergyPLAN [
44].
From
Figure 7 and
Figure 8, it is obvious that there was an inverse proportional relationship between available V2G battery capacity and an electrical load of a group of EVs. This relationship was based on the trivial fact that the availability of V2G battery capacity was lowest when most of the EVs were in movement and not suitably parked. It was assumed that during night hours, most parked (non-driving) vehicles were parked on V2G-ready parking places. In addition, during peak driving hours, it was assumed that the share of EVs that were parked on V2G-ready parking places was lower than during night hours when most of the cars were parked on planned parking places. Furthermore, in order to appropriately model EVs that could be connected to the grid but could also be discharging batteries during transportation (off-grid), certain constraint objects had to be modelled to limit their production. Therefore, in each time step, the discharge from each battery had to be at least the same as the discharge power used by EVs for transportation. In this way, it was possible to determine the available potential from EVs for network reserve and support by using PLEXOS. The total electricity load in the Croatian power system was calculated as the sum of assumed electricity load from regular consumers and the transportation consumption of EVs in order to avoid confusion. In the EV modelling approach in PLEXOS, only personal vehicles were taken into account, and certain related costs were omitted. These costs included the costs of building new charging stations and supporting infrastructure.
It must also be argued that there was an obvious inverse correlation between the available capacity of parked EVs and available solar energy during the day. Still, there was around a 45–50% available capacity for charging during the working day and even more during the weekend. Therefore, the still high-enough capacity of EVs was available during midday for V2G and G2V processes, and the results confirm this. Another fact that was positive is that the power system load was rather high when solar energy was in its peak, and, therefore, most of it was immediately consumed by final electricity consumers.
5. Results
The logic behind defining the two previously-described scenarios was to exclusively examine the impact of EVs on CO2 emission reductions in two sectors—the transport and power system sectors. There could be a huge number of other scenarios (artificially created restrictions on CO2, increase in CO2 prices in ETS, etc.), but for comparison’s sake in this paper, it was necessary to compare the business as usual (BAU) case with an isolated case exclusively related to the increase in the number of EVs. Otherwise, it would have been difficult to estimate the potential of each EV itself, as there would be a high overlap of different sources of reduction impacts. For the same reason, trading electricity on external markets was disabled in the model.
The test model of the Croatian power system was created according to the above-mentioned data. In total, the model consisted of 13 nodes, 6 of which were high voltage, 3 of which were high voltage with connected wind power plants, 3 of which were medium voltage with connected PV power plants, and 1 of which that represented the connection between high and medium voltage. In addition, several scenarios were analyzed to help investigate input data for the purposes of analysis. Two main scenarios were observed and analyzed: first without EVs and second with EVs.
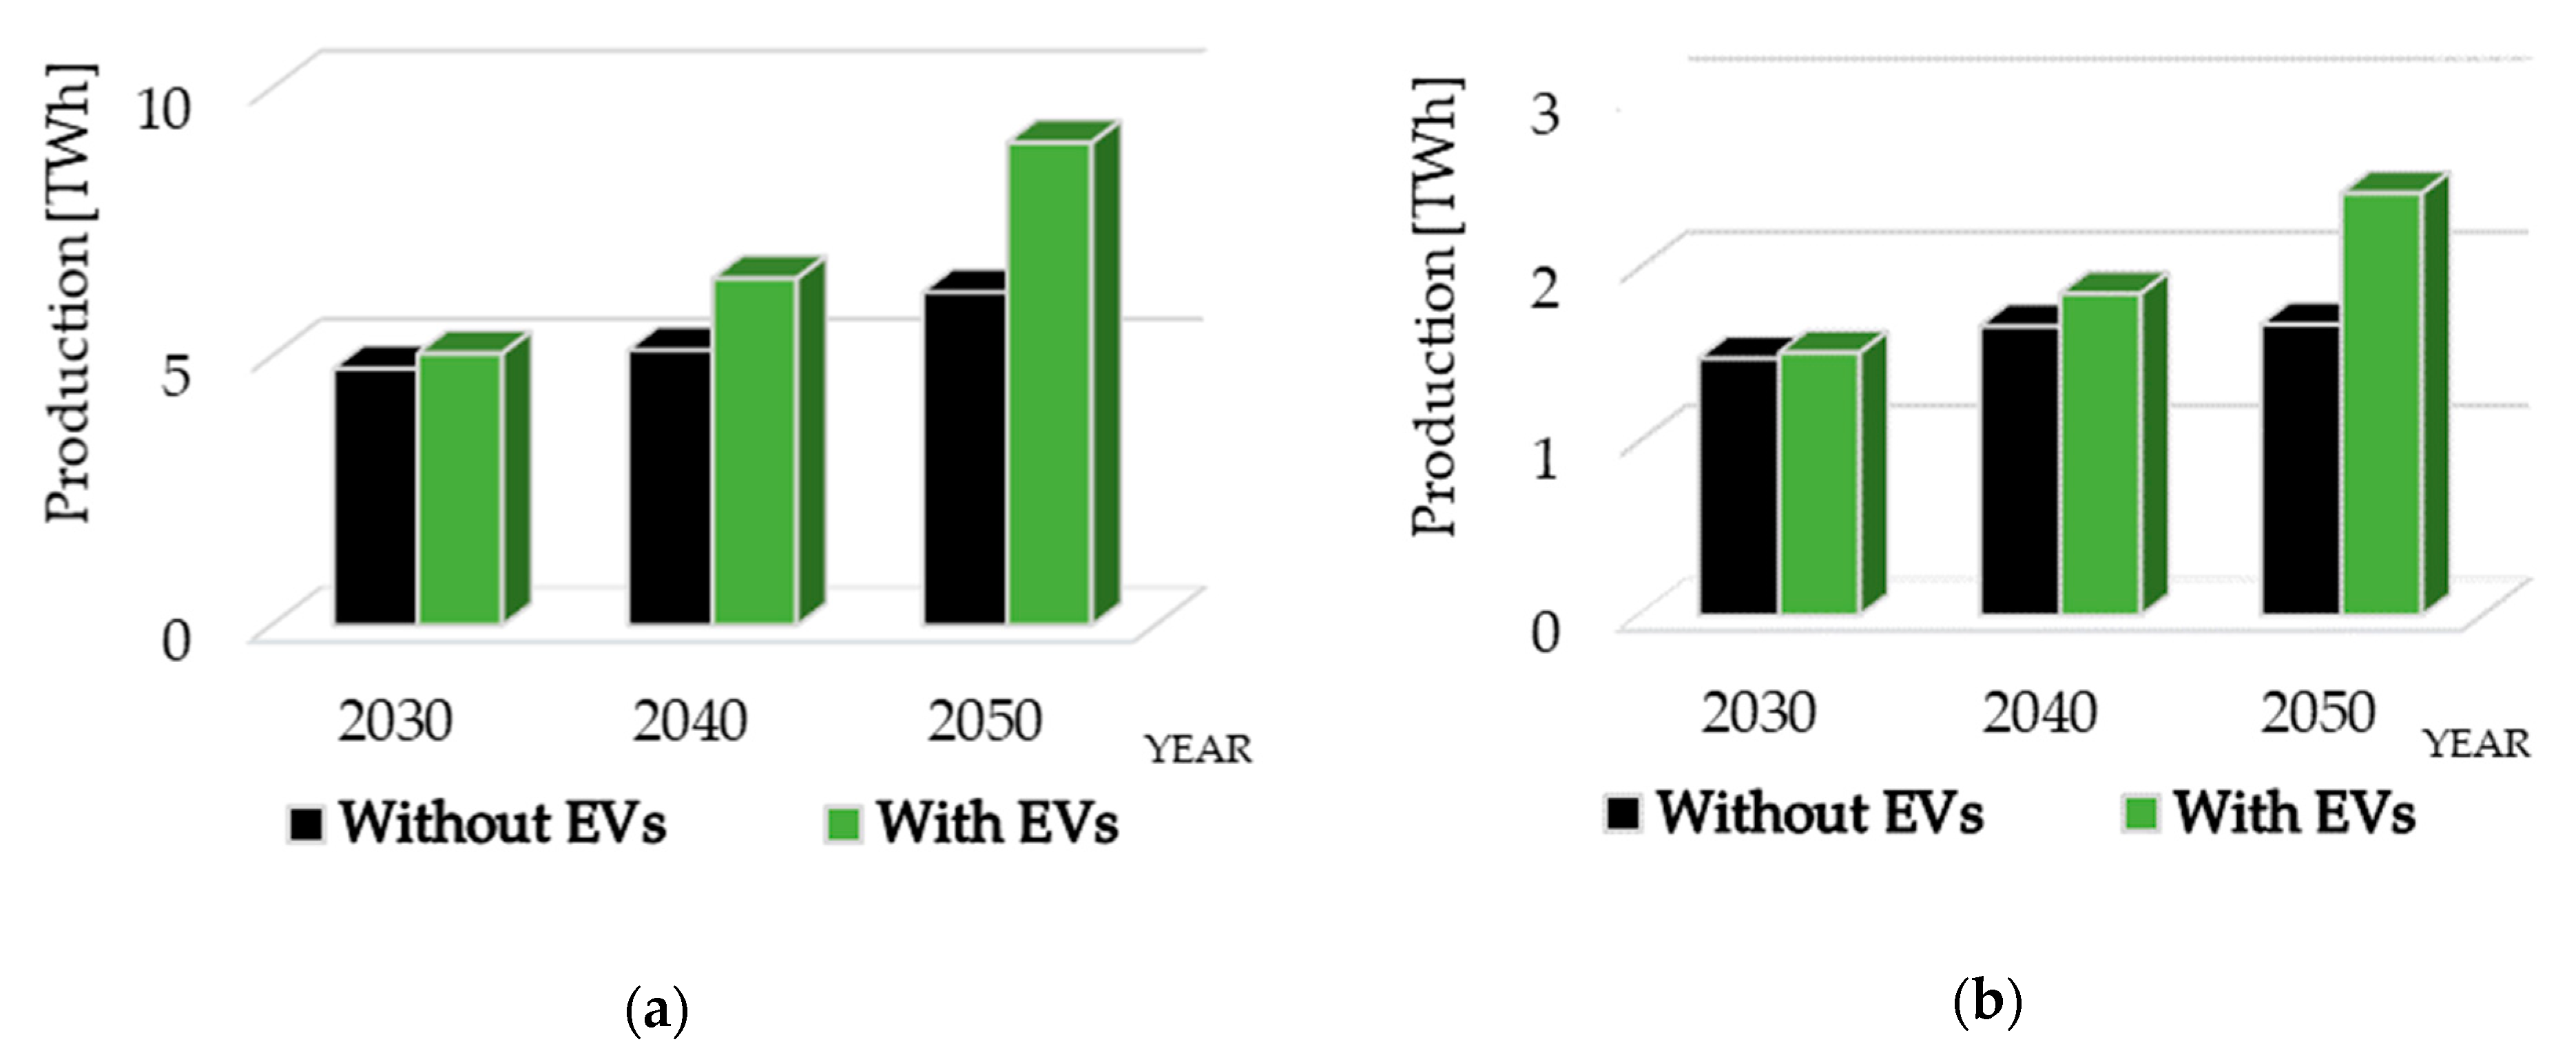
Effects on power system flexibility could be examined by looking at how much the number of EVs affected the power outputs from power plants so that the shortage or surplus production imposed by volatile production from wind and PV power plants was covered. In addition, the production of RES changed depending on whether EVs were connected to the power system. In other words, how EVs affected the curtailment of RES-based electricity could be observed. The total annual energy production from RESs is higher when there were EVs in the system (
Figure 9a,b). In addition, in 2050, the capacity factor for wind power plants in a scenario with EVs was around 30% compared to only 22% in a non-EV scenario. Regarding solar power plants in 2050, the capacity factor in a scenario with EVs was around 16% compared to only 11% in a non-EV scenario.
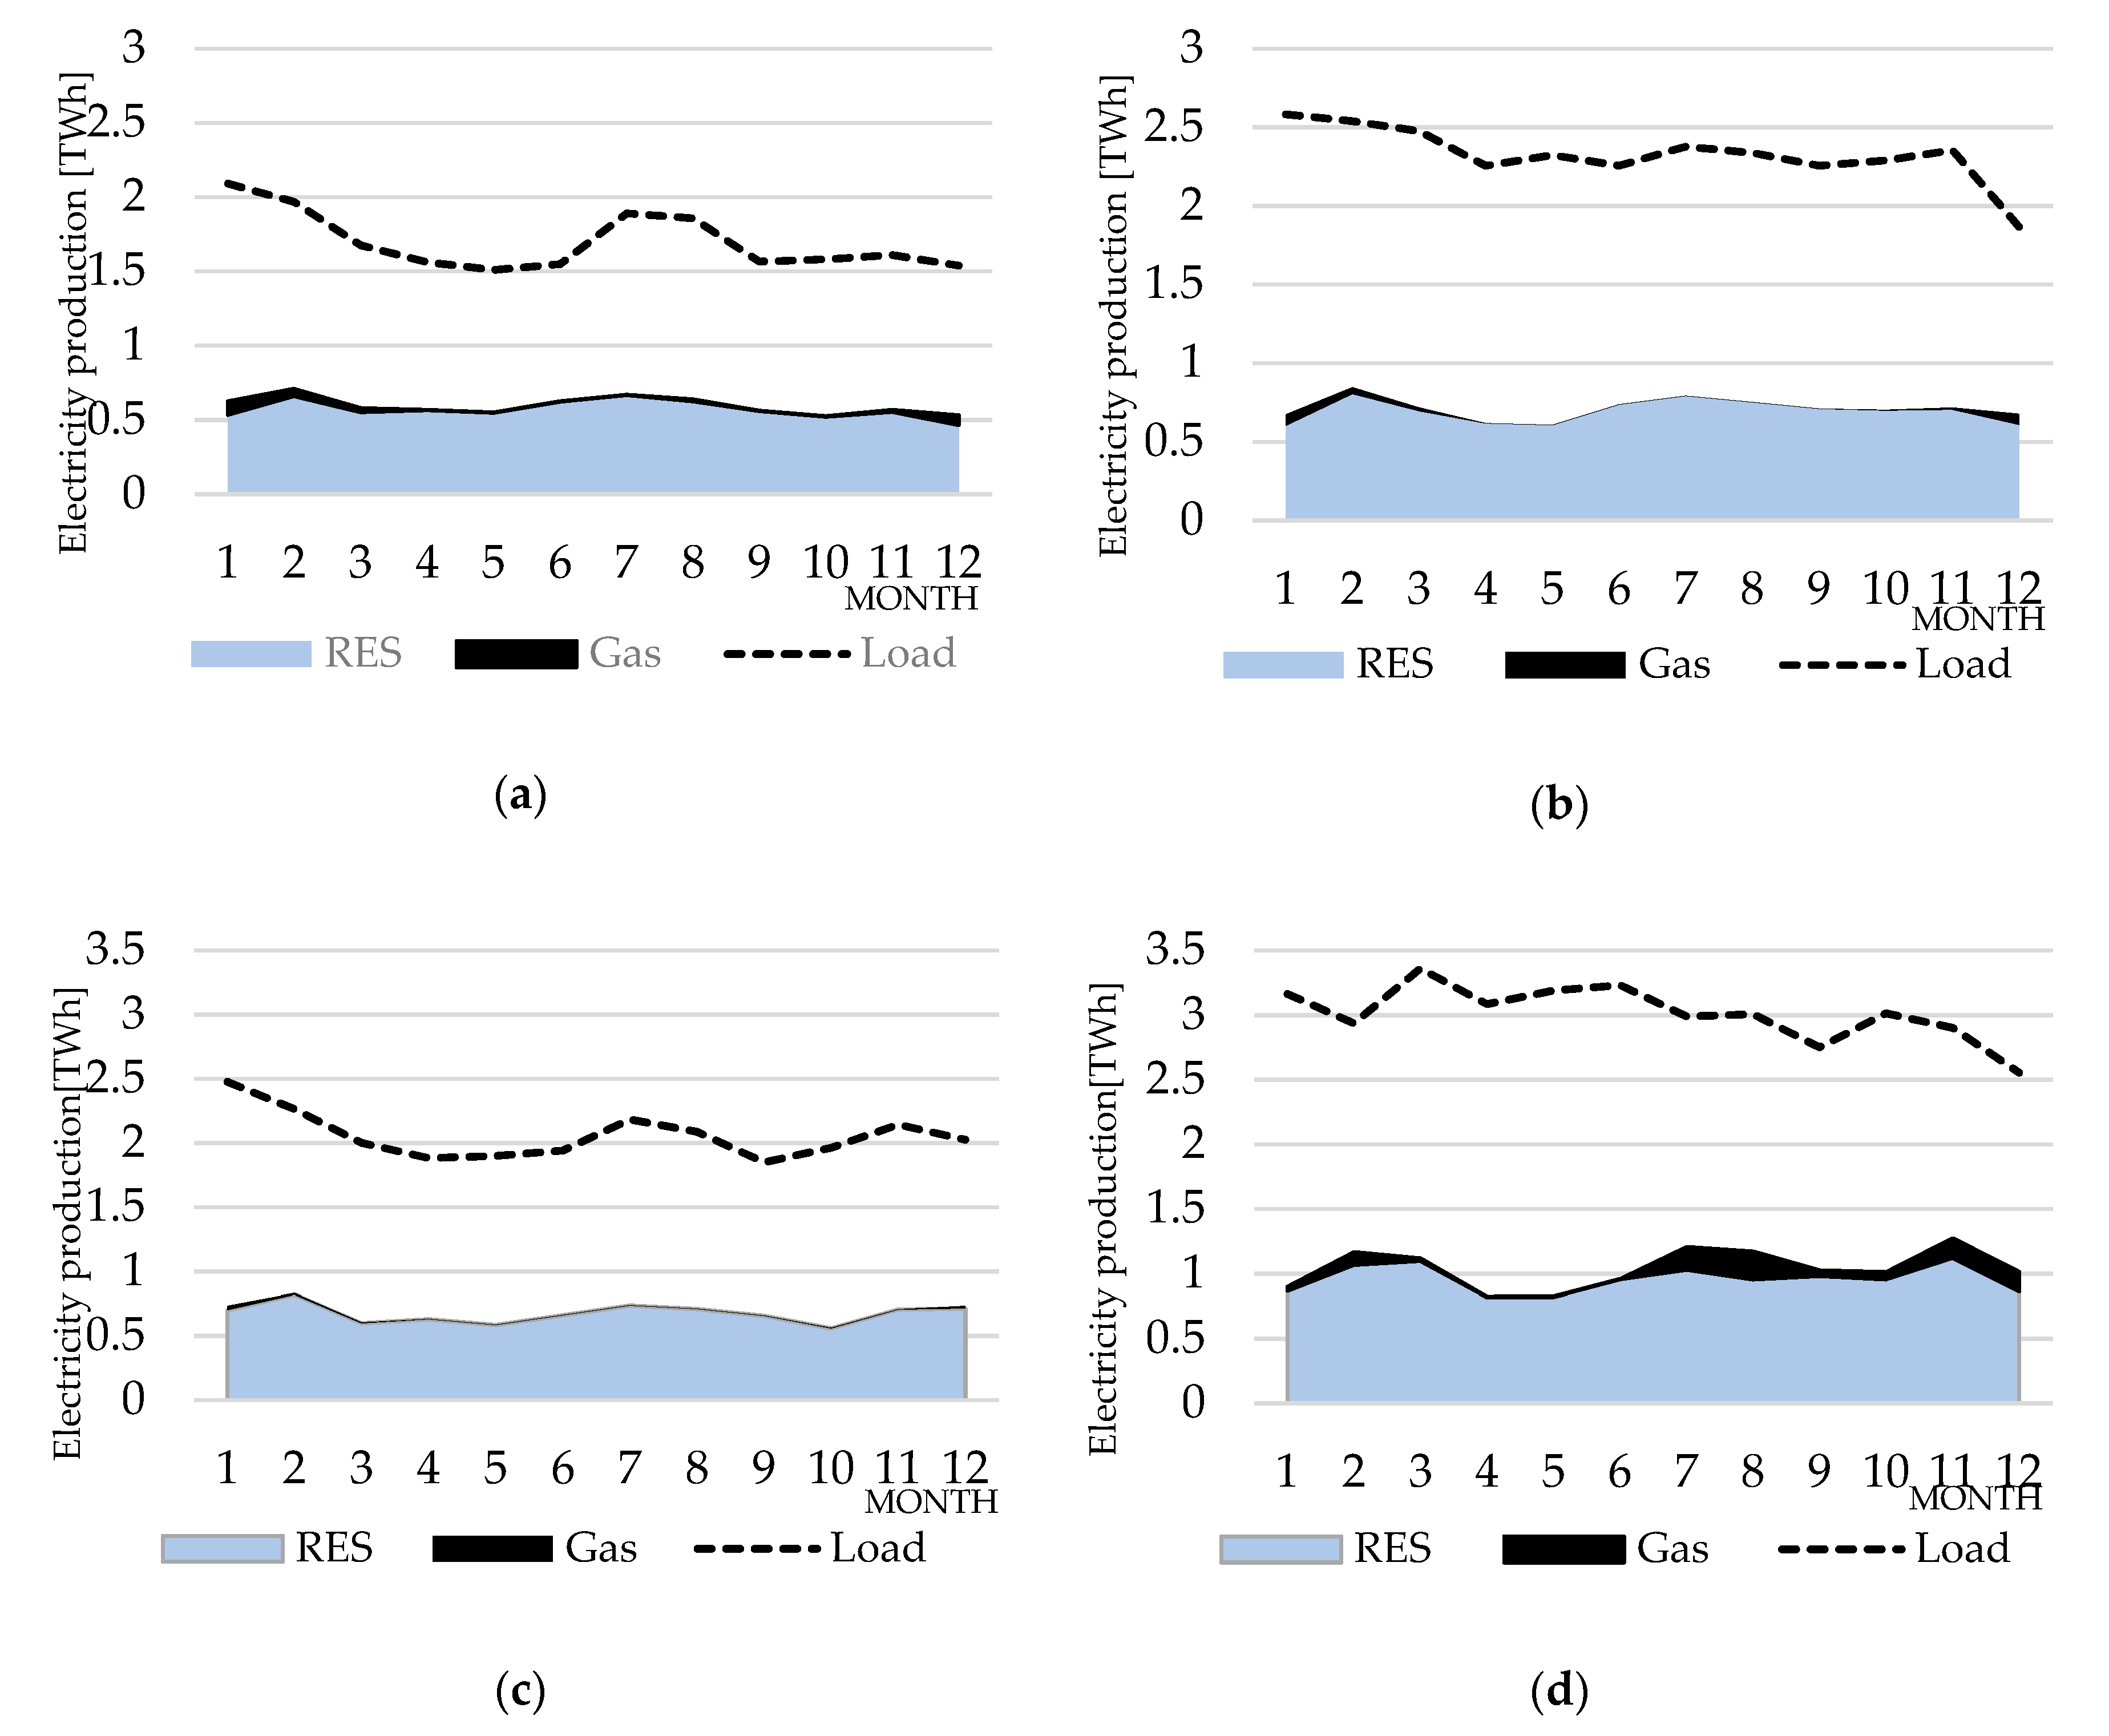
The role of fast ramping gas and slower ramping coal thermal power plants has a significant influence on power system flexibility and balancing potential. Specifically, in the majority of power systems without the proper capacity of ESS technologies, these fossil-fueled power plants play important role in balancing of the system due to the volatile and unpredictable production from RES. As previously mentioned, in 2030, the share of EVs was modelled to be relatively low (4%), which was the main reason for a rather small increase of 270 GWh in the scenario with EVs when compared to the scenario without EVs. A more in-depth analysis shows that in the scenario with EVs, the power output from gas-fired power plants was smaller when compared to the scenario without EVs. The results for 2040 are shown in
Figure 10a,b.
As expected, a larger number of EVs in 2040 resulted in a significant increase in total annual electricity load when compared to 2030. In the non-EV scenario, fossil fuel-based produced electricity in 2040 was 33 GWh higher when compared to a scenario with EVs. At the same time, RES-based produced electricity in 2040 was 1441 GWh higher in the scenario with EVs when compared to the non-EV scenario. The resulting increase in total electricity load due to EVs is obviously mostly satisfied with production from wind and PV power plants.
Figure 10c,d present results for 2050. In contrast to 2040 in the non-EV scenario, the electricity produced in gas-fired power plants in 2050 was 867 GWh higher than in the scenario with EVs. The main reason behind this increase was the significantly higher amount of EVs on roads (1.5 million). In this case in certain periods, an extra production from thermal power plants was required because RES output is not sufficient in these periods (usually peak load periods).
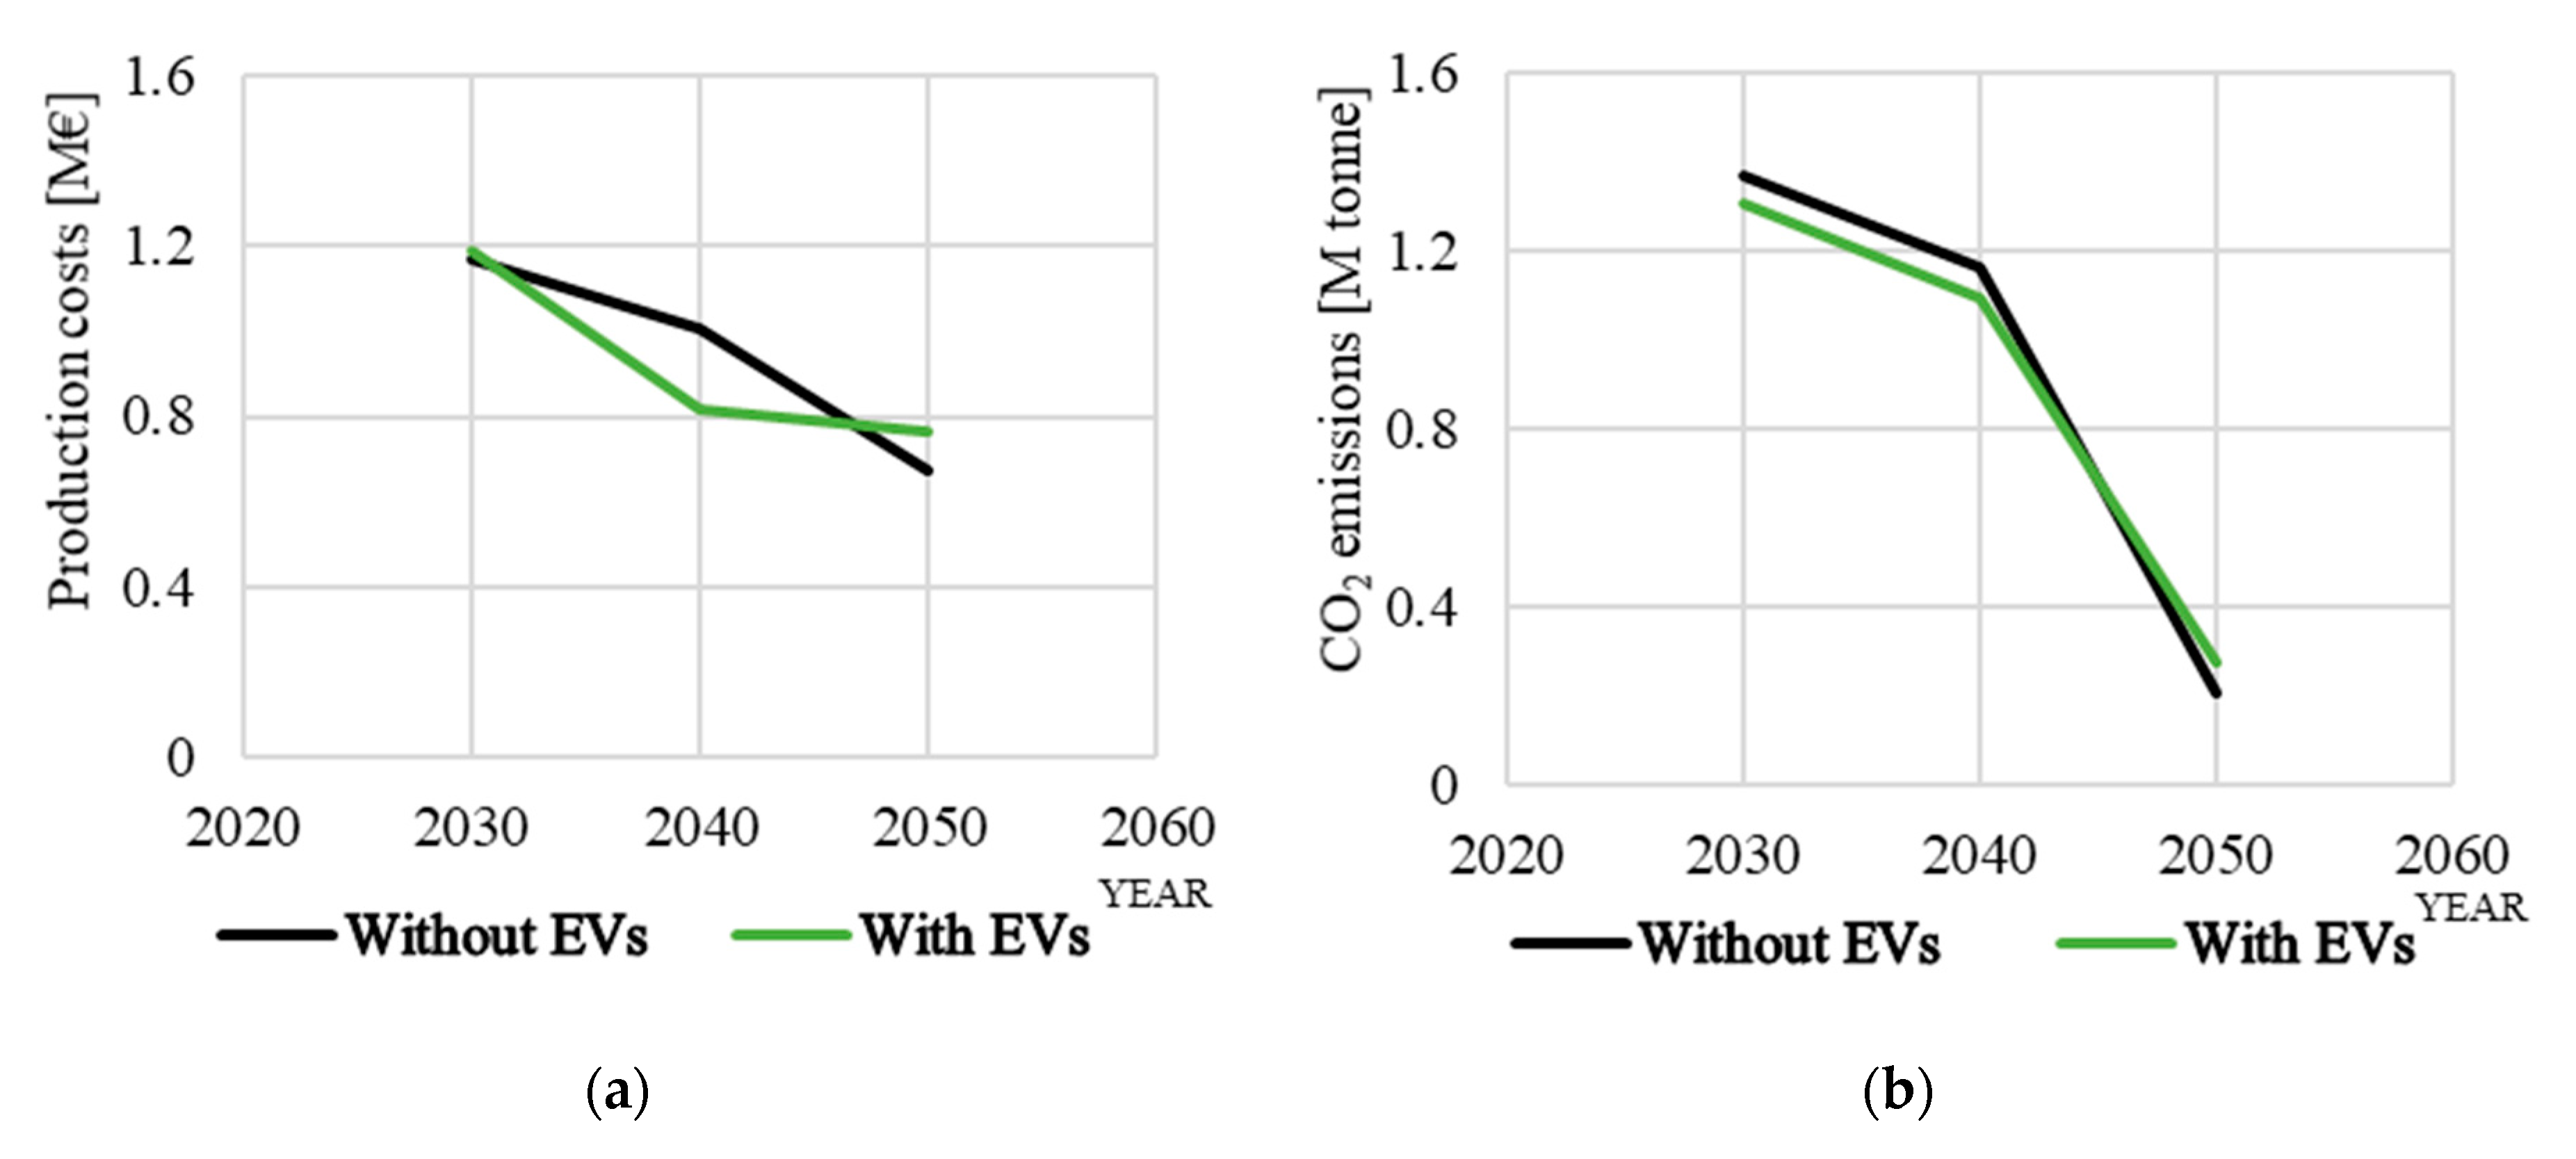
Figure 11a shows total electricity production costs that consist of production costs of all power plants, including start-up, shutdown, and produced emission costs. All costs were modelled by referring to the cost from the CLCS [
40], and they were taken and used without modification. By comparing both scenarios, it could be observed that in the scenario with EVs, the total electricity production costs curve was for almost the whole observed period below the curve for the non-EV scenario. The reason behind this was larger electricity production from RES-based power plants with low marginal costs in the scenario with EVs. However, at the end of time horizon, a large number of EVs were sought for the additional production of fast ramping gas-fired power plants. These power plants were generating electricity to cover the need that could not only be satisfied with RES production (as shown in
Figure 10d), thus resulting in higher total generation costs. As stated before, this was the direct consequence of the amount and charging profiles of the modelled EVs.
When analyzing the application of EV energy storage technology, it is also important to assess the impact on produced CO
2 emissions in both scenarios. The analysis showed that emission levels were almost the same. This was because in the scenario with EVs, there was an evident shift of emissions from the transport sector (non-ETS sector) to the power system sector (ETS sector) that helped to reach the targets set by the European Union. Therefore, due to ETS, it is expected that the peak gas units will be inherited and/or supported by new peaking hydropower plants. The results suggested that in the 2050, the additional consumption of electricity imposed by EVs will result in slightly higher CO
2 emissions when compared to the non-EV scenario. The reason behind this has already been discussed and explained by insufficient RES production in certain, mostly peak load, periods. The other reason can also be that EVs modelled in the PLEXOS model were not ‘instructed’ to charge almost completely in off-peak charging. Therefore, there are some periods when EVs were charging their batteries during peak load hours that seeks for additional production, especially from fast ramping gas-fired power plants and consequently results in increased CO
2 emission (
Figure 10b). Additionally, although the RES capacity increases every year, it could be concluded that the modelled growth around 2050 was not enough to satisfy the increased load of the assumed large number of EVs. Therefore, during some time at the end of the observed period, the fast-thermal power plants were producing electricity. Furthermore, the total amount of CO
2 emissions was significantly decreasing in both scenarios because the total production of conventional power plants in both scenarios reduced during the observed period, which could be expected as steadily increasing new RES capacity entered the power system. In addition, some of the currently existing thermal power plants will be decommissioned during the observed period. Finally, it could be observed that CO
2 emissions were slightly lower in the EV scenario in comparison to the non-EV scenario during the whole observed period except for the last few years.
The results from
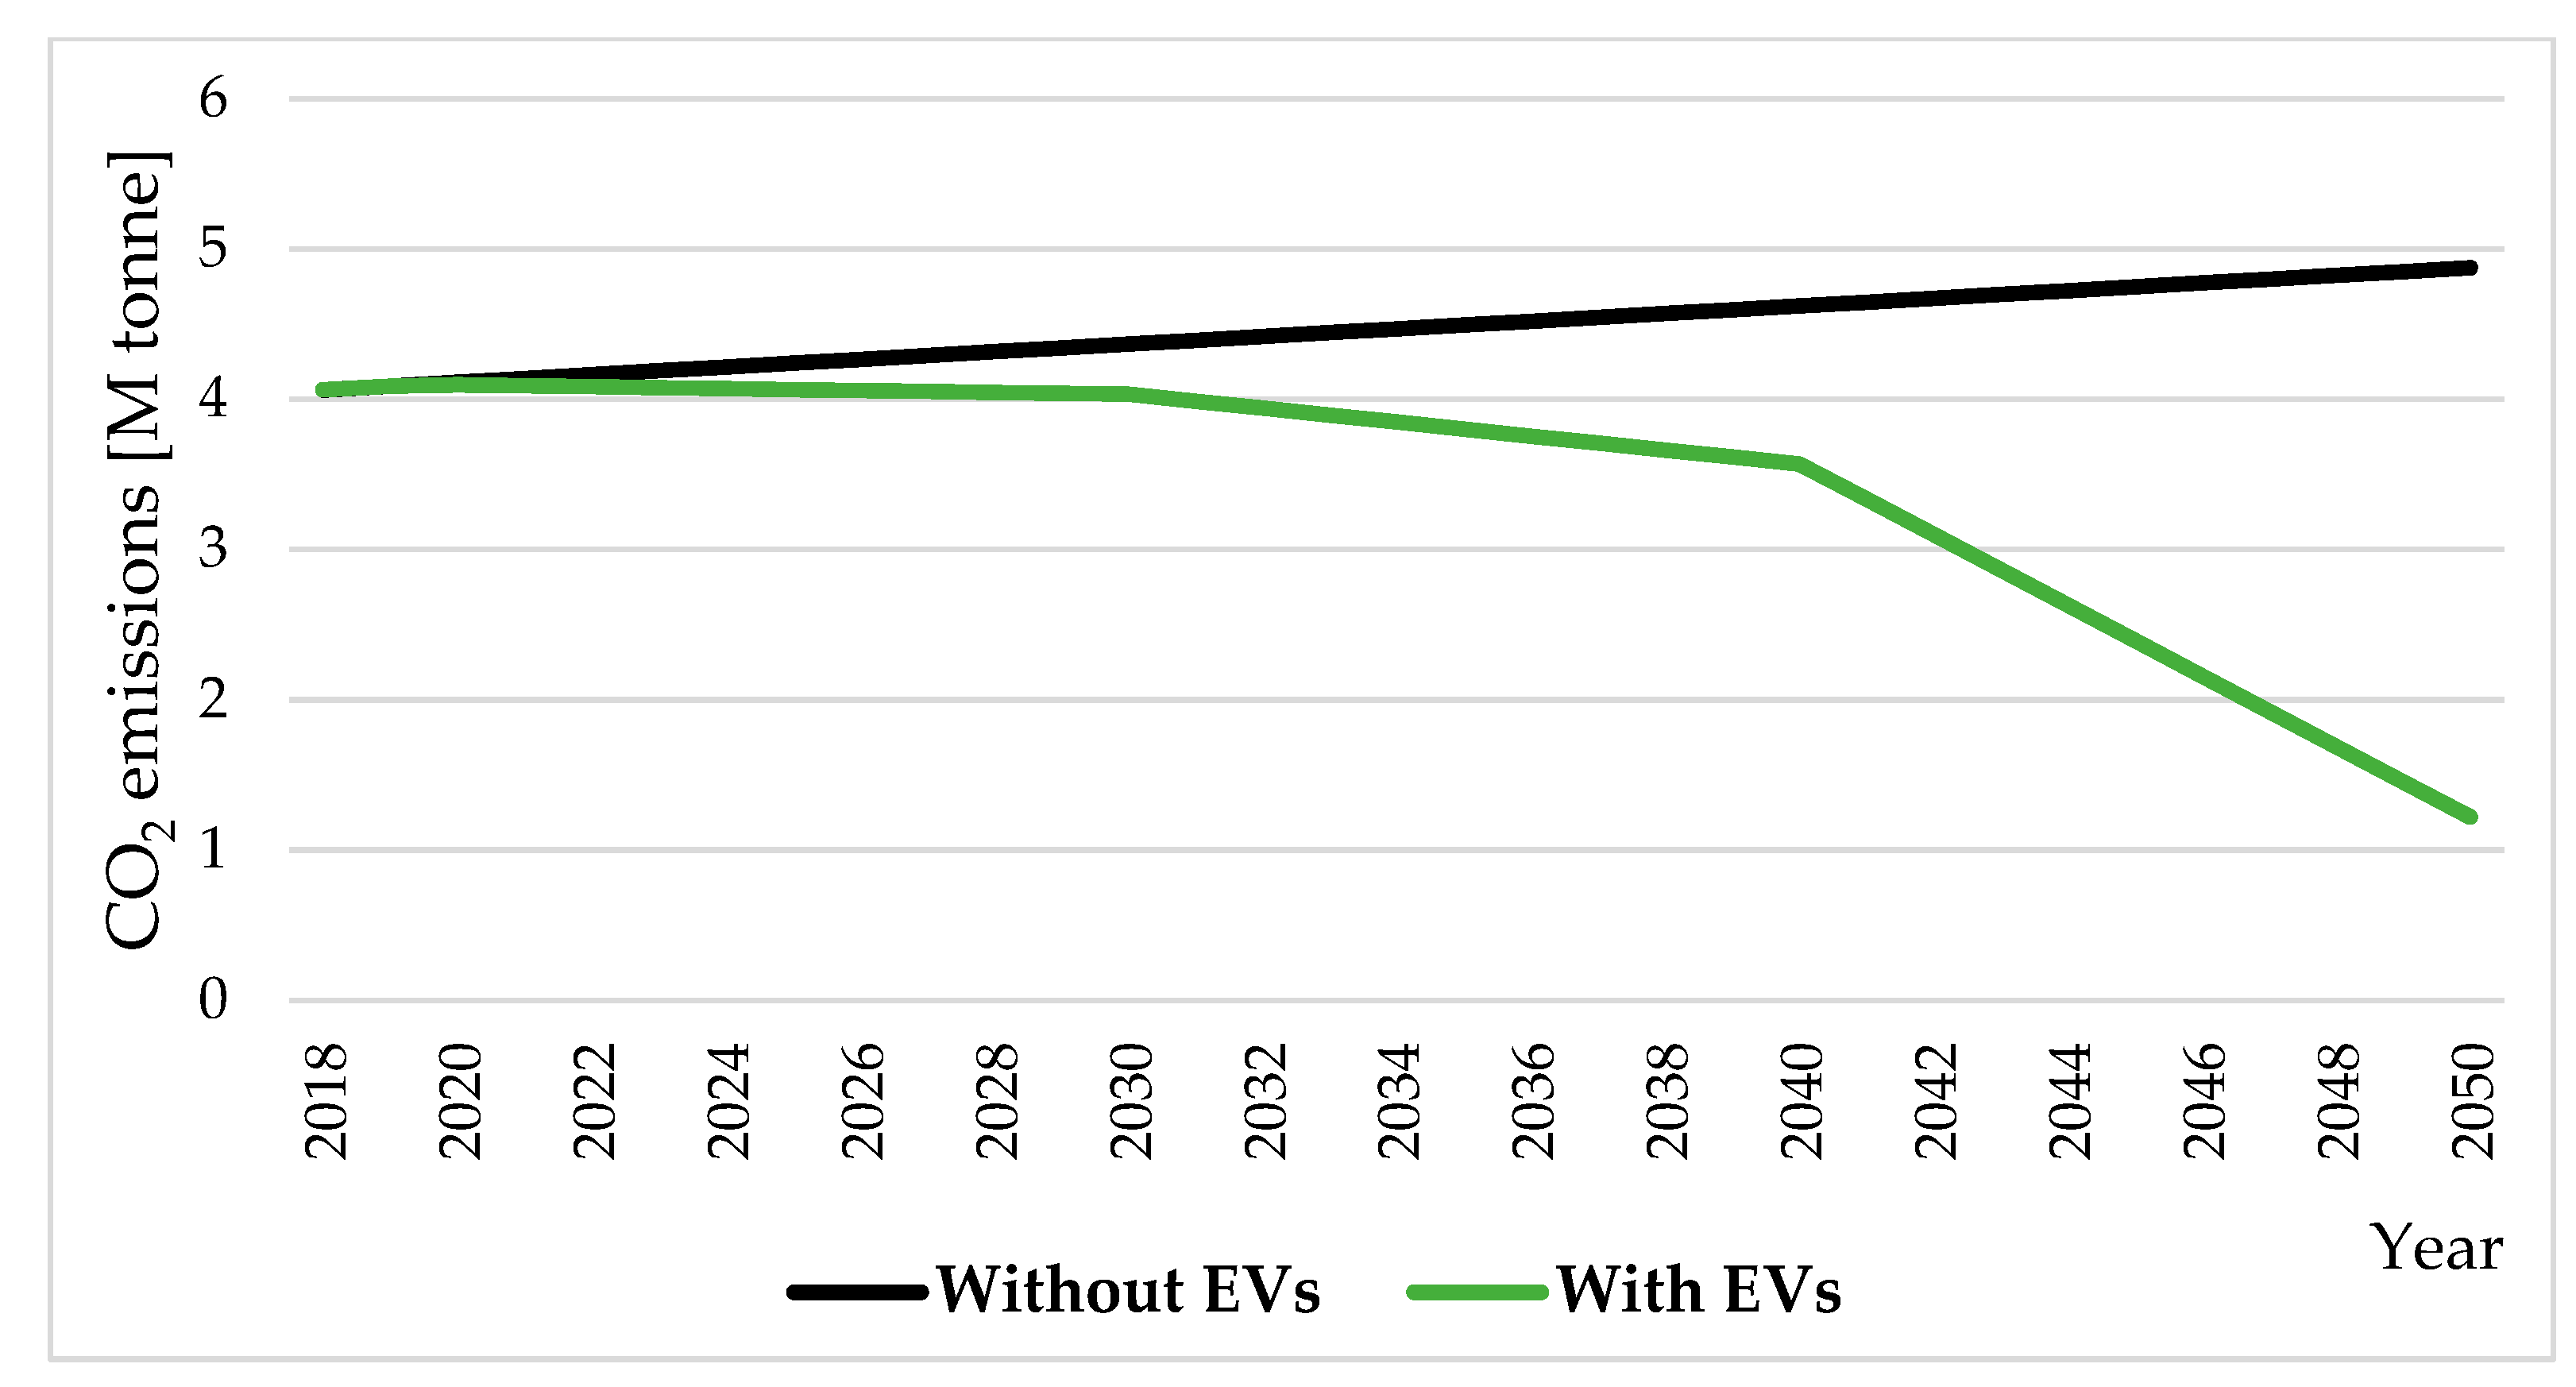
Figure 11 make more sense if combined with CO
2 emissions from the transport sector. From
Figure 12, it is evident that a continuous increase in the number of EVs gradually decreased CO
2 emissions from the transport sector accounting only for light vehicles.
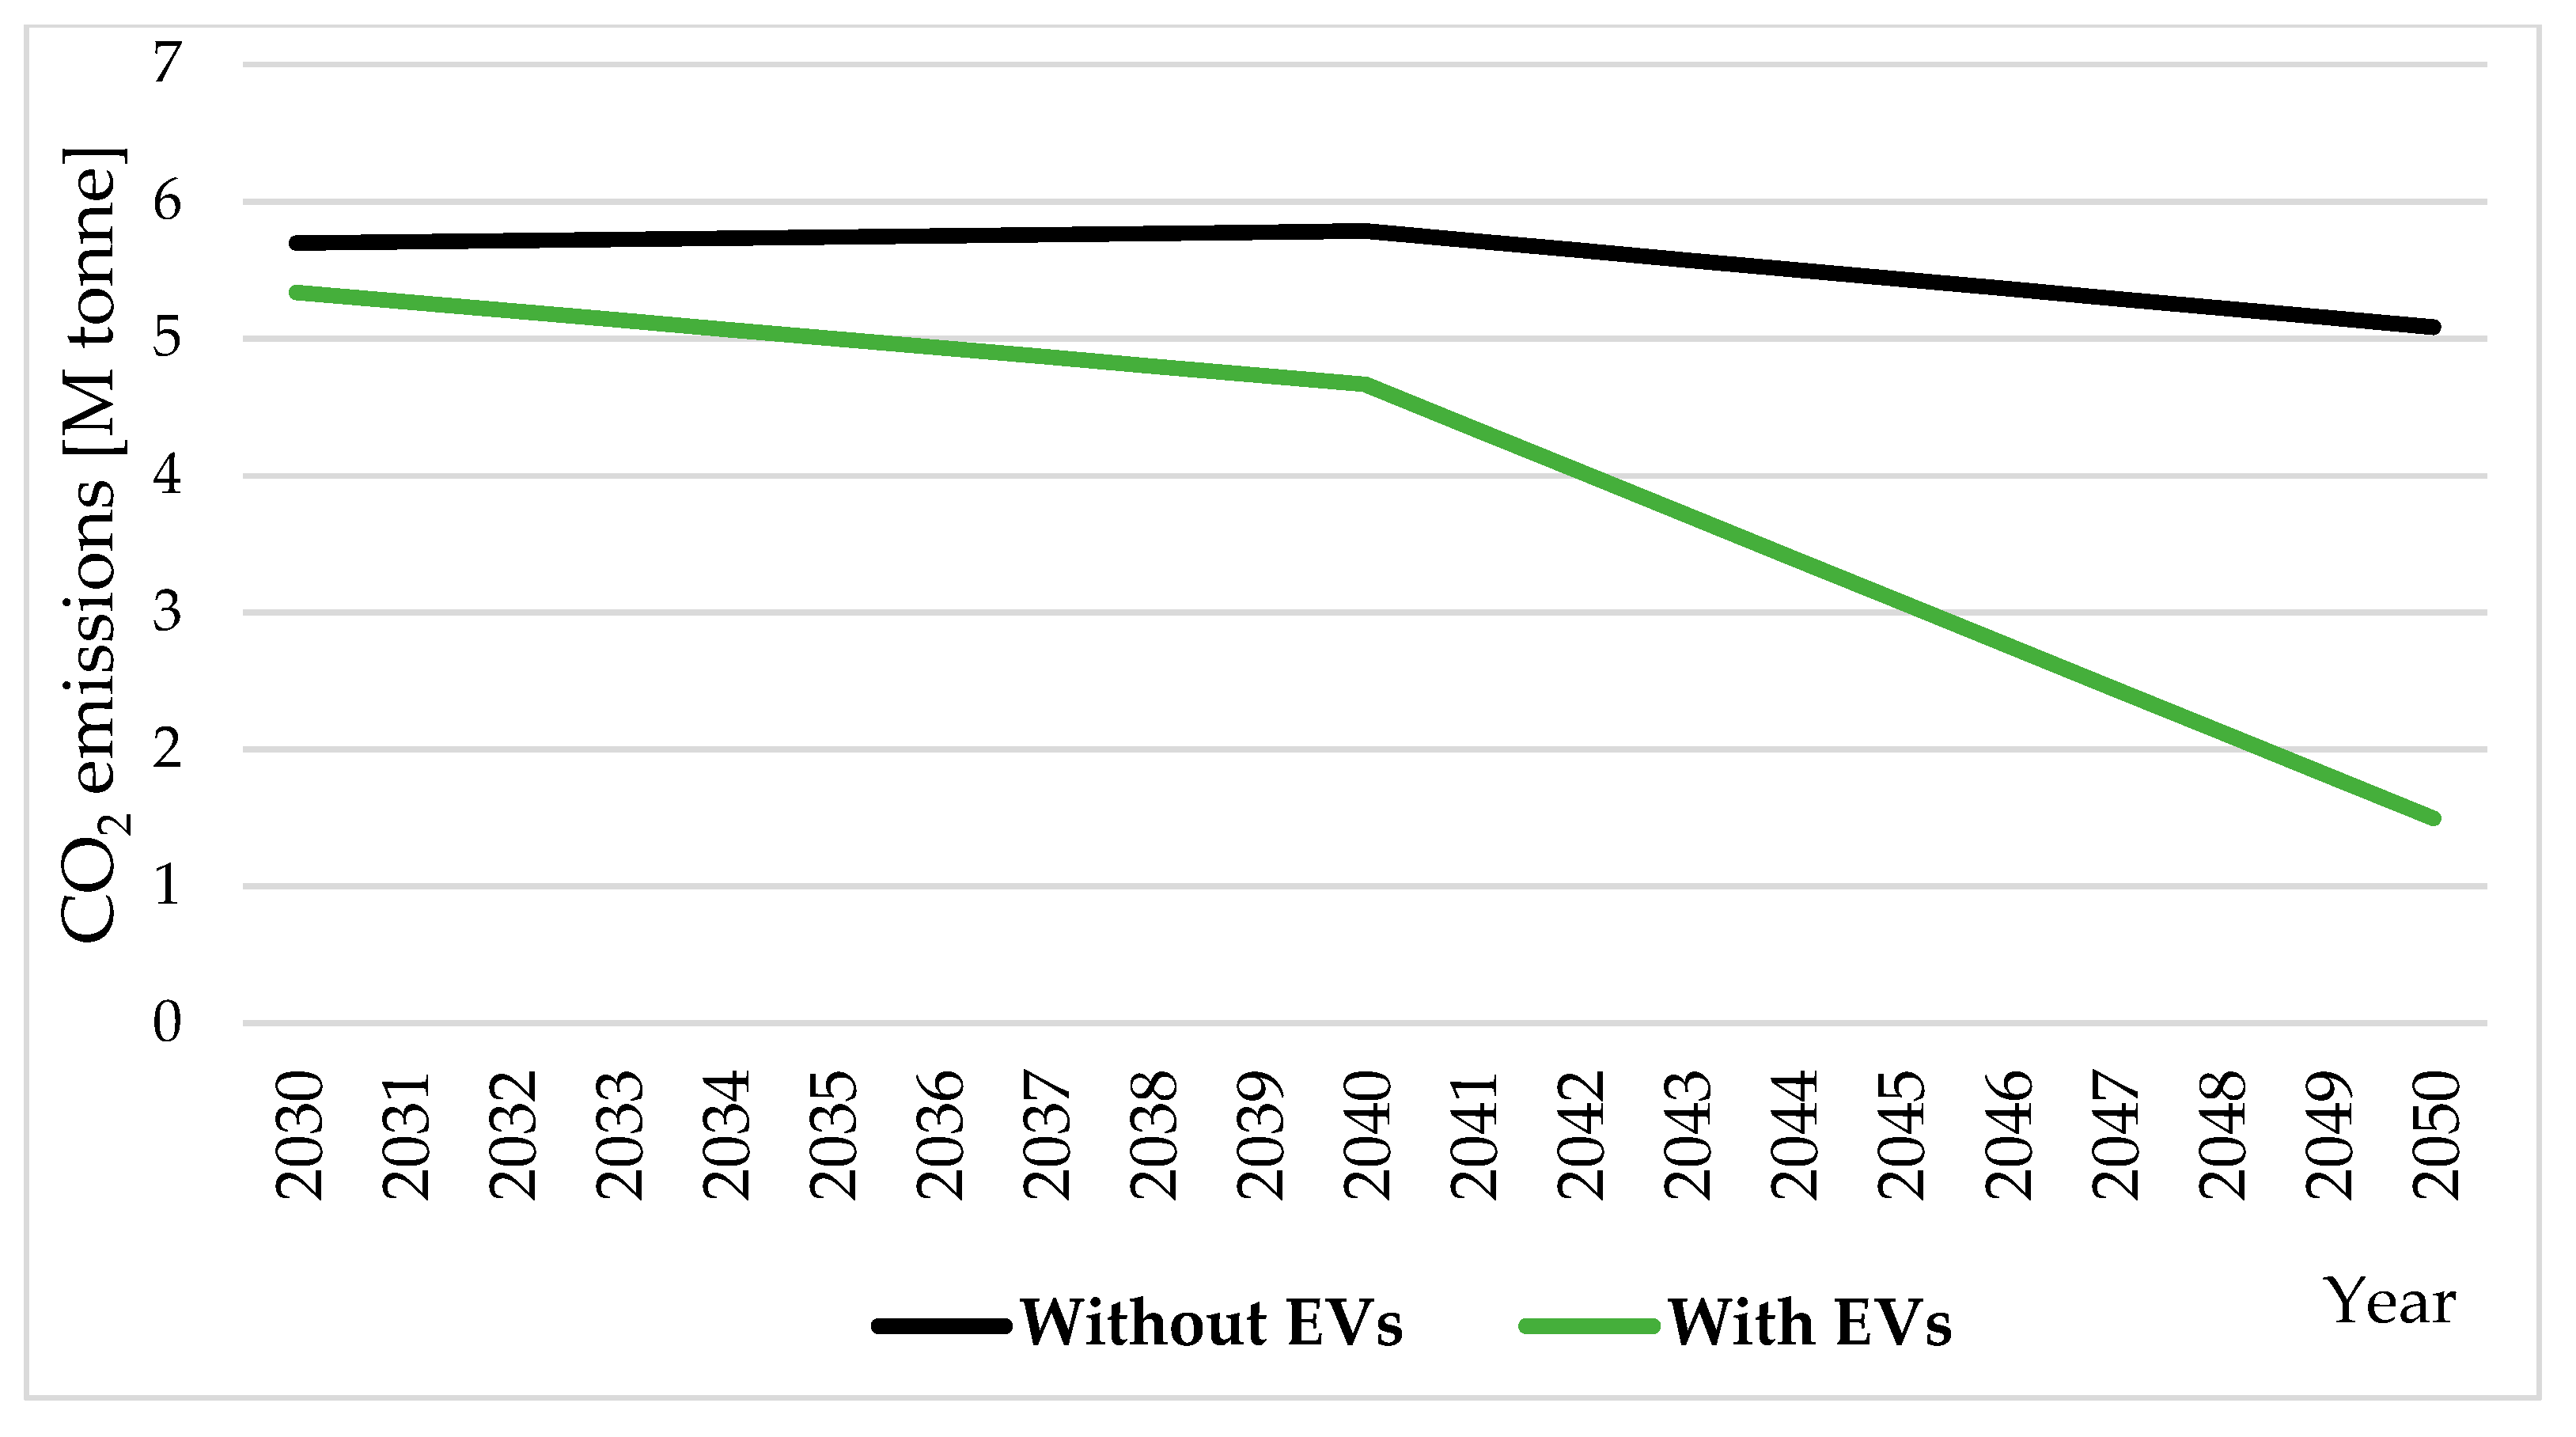
Figure 13 presents the combined CO
2 emissions from both the transport and power system sectors. This figure best represents the cumulative decrease in CO
2 emissions due to an increase in the number of EVs.
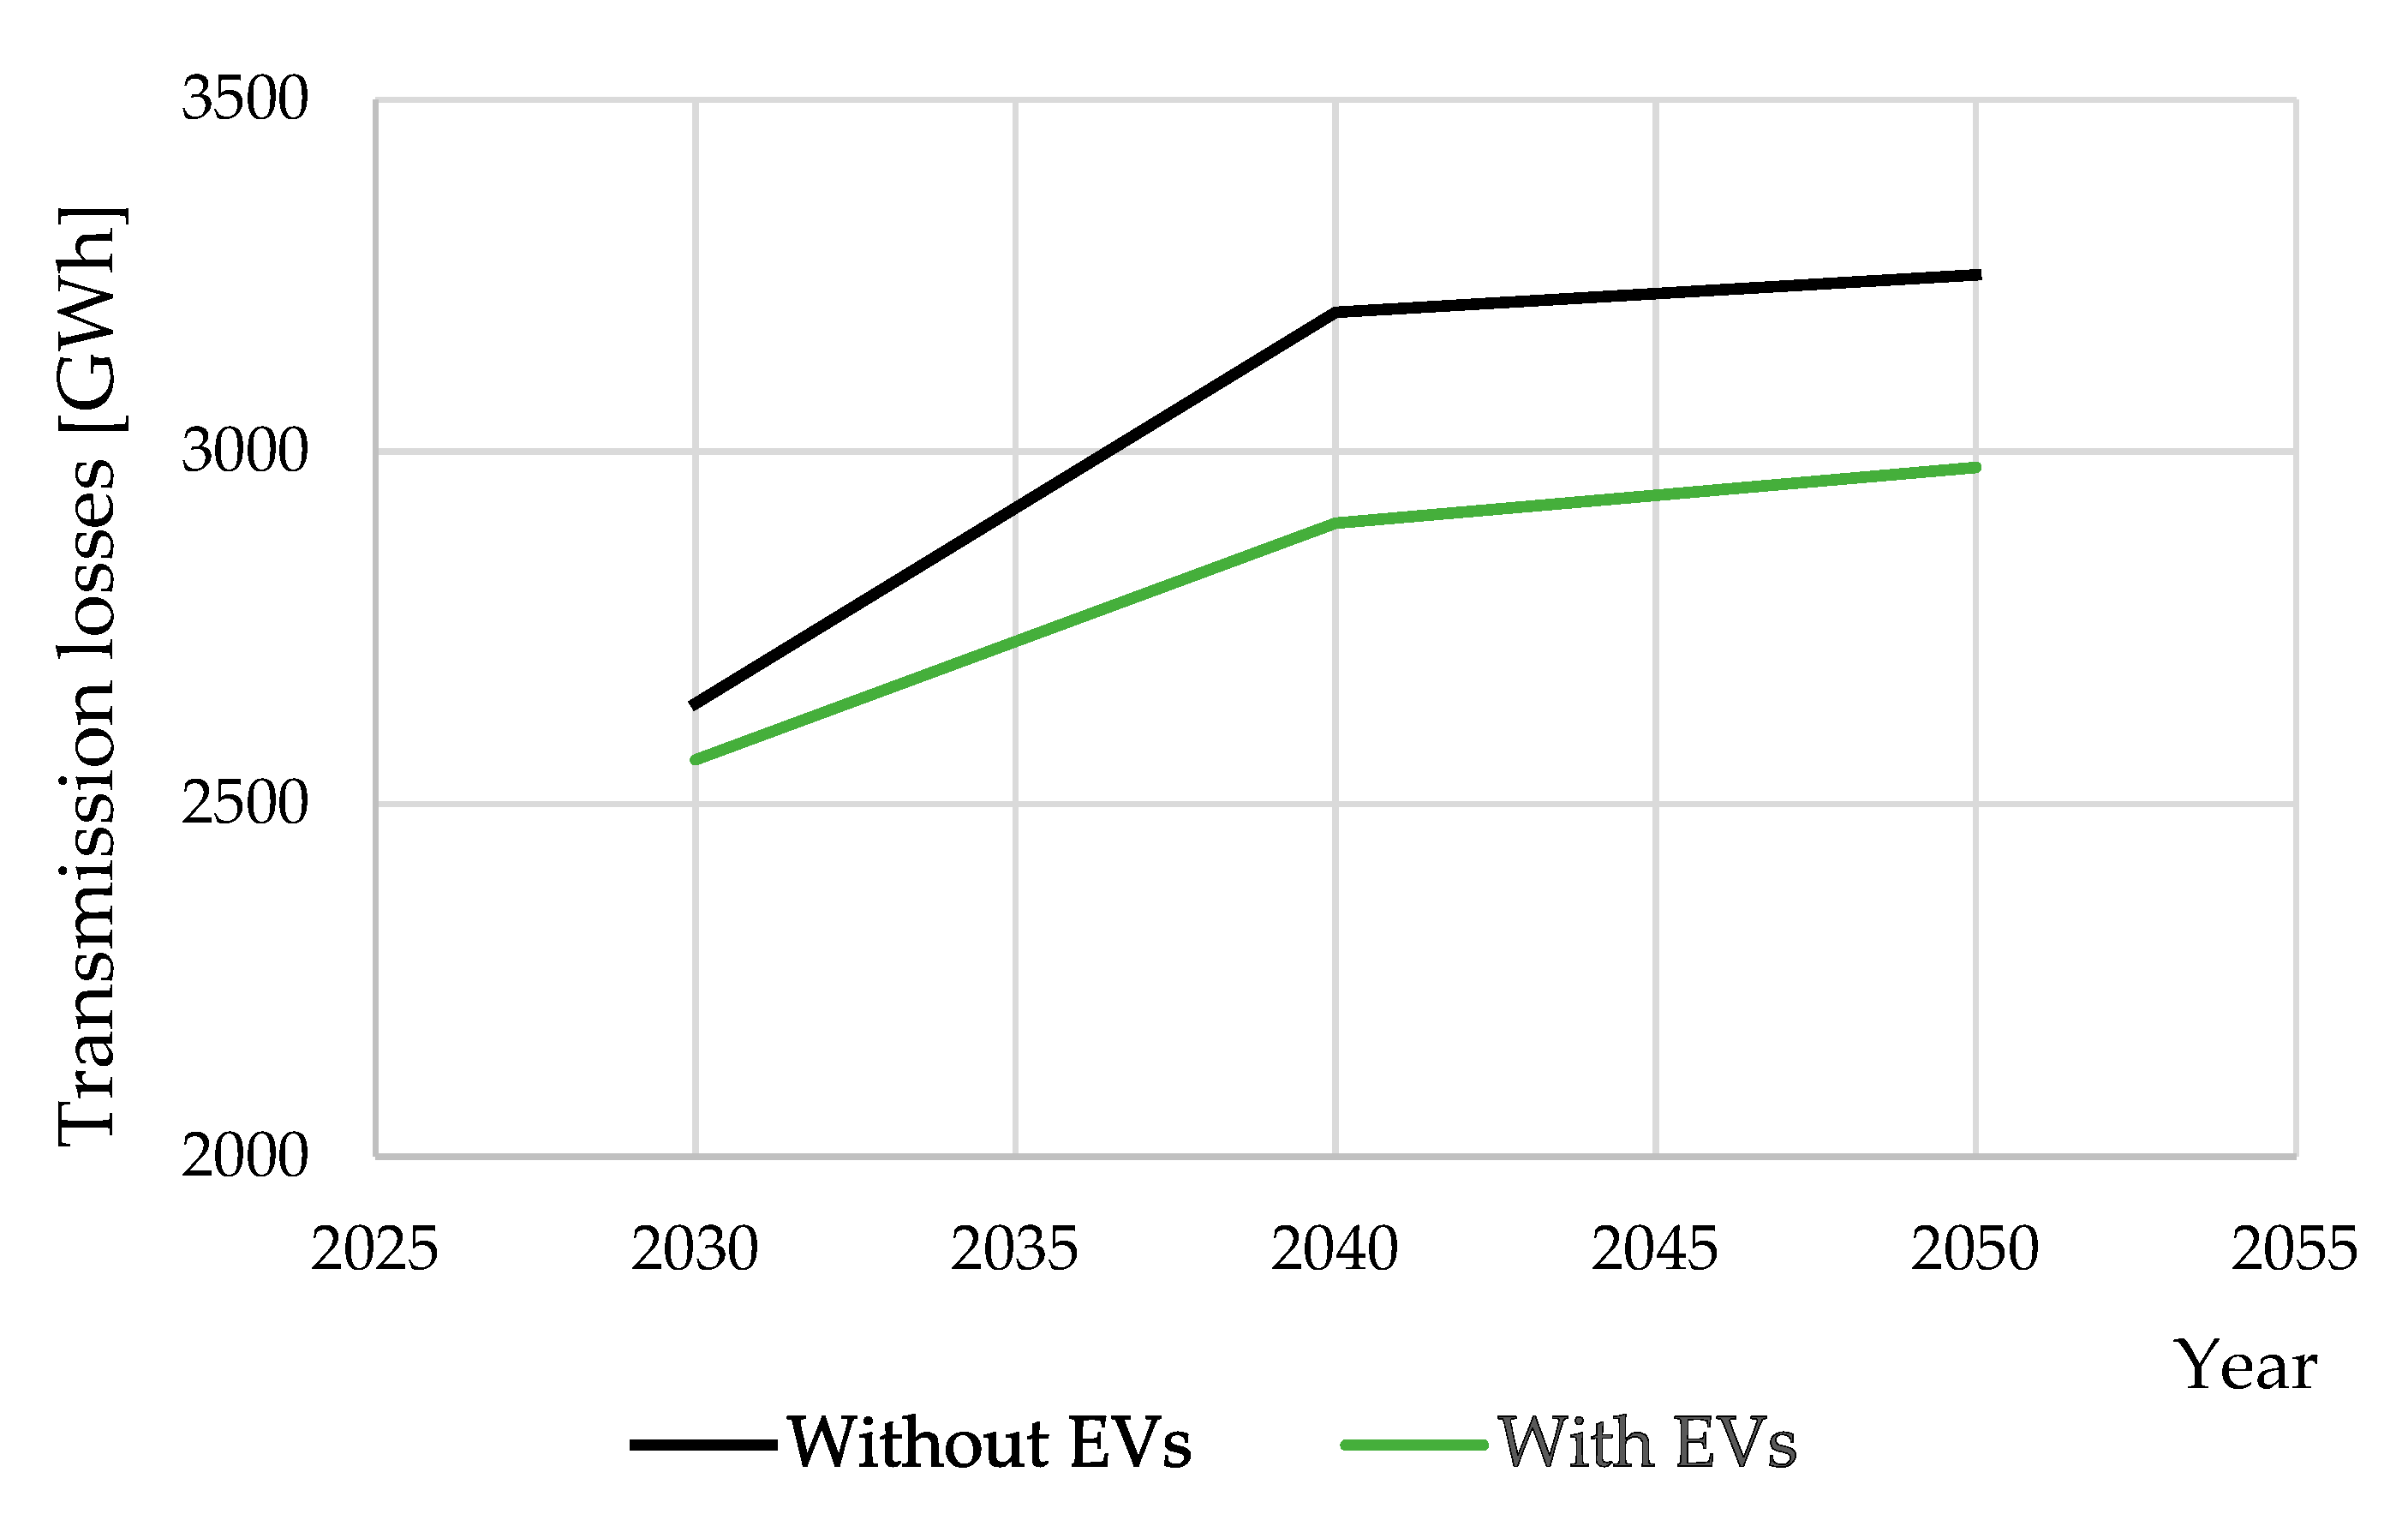
Furthermore, the impact of modelled EVs on the total annual transmission losses is positive. ESSs, in terms of EVs and a significant share of RES power plants, are located in the proximity of other, regular electricity consumers that results in reduced overall power flows and consequently in reduced transmission losses in the power system (
Figure 14).
7. Conclusions
Wind and PV power plants most recently account for the largest increase in newly installed power plant capacities. In addition to their contribution to sustainable development, they also introduce instability to a power system due to their intrinsic volatility and unpredictability on both long-term and short-term bases. This raises the question of the costs of maintaining the system in balance and also increases the possibility of system breakdowns. Different back-up options have been discussed, and one of the most promising and prominent options is the integration of electric vehicles into the grid.
The research presented in this paper was focused on the capabilities of significant levels of electric vehicle penetration in terms of CO2 emission reduction at the national level and the improvement of the flexibility of the system with a larger use of renewable energy sources. At the same time, the total production costs of power systems were examined and used as additional evaluation criteria. The optimization was performed using the PLEXOS software and power system model that was based on an already verified and validated a model of the real power system that was used for Croatian low-carbon strategy development. CO2 emission targets for years 2030, 2040, and 2050 from the same strategy were also taken into account as constraints in the model.
In order to provide credible conclusions, two scenarios were examined: a scenario including electric vehicles and associated additional power system flexibility and a scenario without extra flexibility provided by electric vehicles. Based on the results obtained from the analysis of both scenarios, it could be concluded that additional storage in form of electric vehicles may provide a significant back up for the increased production from RES. At the same time, CO2 emissions on the national level could be significantly reduced while keeping power system production cost at the same level and creating the potential for decreasing transmission losses. Additional benefits could be attributed to the reduction of network losses since a significant part of the power flow would be transferred to the distribution level because the EVs mostly connect to the distribution system. This aspect should be further explored in the future by using a more detailed multi-node model that also considers medium voltage levels.
In addition to the positive effects, some certain drawbacks of the presented high penetration of electric vehicles were also found. A relatively large number of electric vehicles could affect traditional load patterns, which could be especially delicate in periods of peak load when the conventional power plants, i.e., gas powered, with quick responses would have to be activated in order to keep the system stable.
It is important to stress that the effect of the switch from fossil powered vehicles to electric powered ones on the levelized cost of energy was not assessed within this paper. Most of the insights from this paper could be translated to similar, relatively small power systems, such as the Croatian one, that are relatively well-developed and connected to neighboring systems. The applicability of this approach for larger power systems with different structures of production technologies should be investigated in future research. Additionally, a sensitivity analysis based on different charging patterns of electric vehicles and different patterns of wind and solar availability may give some more details and insights. In the end, it must be highlighted that the results of a similar analysis for a different country could significantly differ regarding features of a related power system.
At the end, the main insights and findings of this paper were:
A larger number of EVs allows for an increase in the production from available RESs—there is less RES curtailment.
A larger number of EVs also allows a country to shift emissions from the transport sector to the power system sector while simultaneous drastically decreasing the total CO2 emissions combined in these two sectors.
It is possible to transfer CO2 emissions from a non-ETS system (the transport sector) to an ETS system (power system) without increasing production costs in the power system.
An increased number of EVs boosts the utilization of the installed RES capacity. Namely, in 2050, the factory capacity for wind power plants in a scenario with EVs was found to be around 30%, compared to only 22% in a non-EV scenario. Regarding solar power plants in 2050, the factory capacity in the scenario with EVs was around 16%, compared to only 11% in the non-EV scenario.


