Article

Technical and Economic Analysis of Battery Storage for Residential Solar Photovoltaic Systems in the Brazilian Regulatory Context

1
Department of Electrical Energy, Federal University of Juiz de Fora (UFJF), Juiz de Fora 36036-330, Brazil
2
Centre for Power and Energy Systems, Institute for Systems and Computer Engineering, Technology and Science (INESC-TEC), 4200-465 Porto, Portugal
*
Author to whom correspondence should be addressed.
Energies 2020, 13(24), 6517; https://doi.org/10.3390/en13246517
Submission received: 8 November 2020 / Revised: 1 December 2020 / Accepted: 7 December 2020 / Published: 10 December 2020

Abstract

:
This paper presents a comprehensive study of the technical and economic benefits that a typical residential prosumer may experience when investing in a solar photovoltaic (PV) system with a battery energy storage system (BESS). To this end, a home energy management system has been designed to simulate the prosumer’s daily operation, considering a novel method for calculating battery degradation while minimizing its operating costs. In order to contribute to the regulatory review process of the distributed generation underway in Brazil, a set of PV+BESS configurations has been assessed under the current and future regulatory scenarios proposed for discussion by the Brazilian regulatory agency. Although the results demonstrate that the prosumer’s self-consumption rate may increase up to 14% with the BESS coupling in the PV system, the investment proved to be economically unattractive in the current regulatory scenario and practically unfeasible in any of the proposed future scenarios. To make PV+BESS systems economically feasible, some business models are proposed and discussed, and for example, provide subsidies for policymakers, financial agents, and battery manufacturers. A sensitivity analysis for each business model showing its economic feasibility spectrum is provided to assist the different sector players, especially the consumers, in their decision-making process.

1. Introduction

In recent years, generating electricity from renewable sources, namely, hydropower, wind, solar, and biomass, are becoming increasingly expressive [1]. Among these renewable sources and their respective conversion technologies, the solar photovoltaic (PV) generation is the one that has been leading the expansion of installed capacity in the world [1,2]. In addition to presenting a competitive cost, it also brings together characteristics which give it a unique degree of application flexibility, such as great modularity, no direct pollution, and dependency only on endless solar irradiation, which is available at different levels, but in all locations [1,3,4,5]. These characteristics, when coupled with appropriate policies and market opportunities, make it attractive for both centralized generation (CG) and distributed generation (DG) [1,2,6,7].
The distributed PV generation accounts for about 40% of all PV capacity installed in the world [2]. It is mainly represented by small-scale grid-connected PV systems on residential and commercial buildings [2,8]. By acting simultaneously as consumers and producers of electricity, the users of these buildings, who are respectively the owners of PV systems, are usually called prosumers [9]. The incentive policies typically implemented in the DG sector, encourage prosumers to: (i) self-consume the electricity produced by the PV system to cover the electricity demand of the building; or (ii) inject it into the distribution grid in exchange for some type of energy or financial compensation, as an energy credit or a feed-in tariff [6,7,8]. Since the PV production profile hardly converges entirely with the building’s consumption profile, especially in the case of residential users, it is common to combine these two options, i.e., to self-consume as much of the electricity produced as possible and inject the electricity surplus into the distribution grid [6,10].
Nevertheless, the existence of prosumers connected to the distribution grid is a critical issue for the distribution system operator (DSO). As these users are characterized by electricity generation next to the load, several potential benefits can be experienced, such as decreasing energy losses and increasing power quality [11,12]. In contrast, as the prosumer penetration increases, the PV generation intermittency and the uncontrolled electricity injections into the grid may cause a number of problems, such as power fluctuations and reduced voltage stability [13,14].
A convenient way to overcome these problems is to couple the battery energy storage system (BESS) to the PV system of the prosumers. This solution allows a portion of the electricity surplus to be stored instead of directly injected into the distribution grid, thus mitigating its operating stress [15,16,17]. Furthermore, BESS allows prosumers to actively manage stored electricity to improve their incomes, which can be done through its self-consumption or by practicing arbitrage in its sales process [6,18], for example. Therefore, these two “end-user services” enabled by BESS, not only offer technical benefits for the prosumer integration in the distribution grid, but also contribute to its empowerment—which is extremely relevant for consolidating future smart grids [19,20]. However, the current high costs of BESS make it an economically unfeasible solution, especially for residential prosumers with PV system installed in a wide range of markets, such as those found in: Australia [21], Brazil [22], Germany [23], Italy [24], Netherlands [8], Portugal [25], Switzerland [26] and United Kingdom [20]. Therefore, the establishment of regulatory policies and economic incentives are essential to attract investment from residential prosumers in BESS, as well as promoting the consolidation of its industry at the local and international level [4,20,27,28,29].
Regarding Brazil, a very interesting regulatory landscape is currently observed. In net-metering scheme regulated in this country, the prosumer receives one energy credit for each electricity unit injected into the distribution grid [30]. This energy credit can be used within 60 months to offset the prosumer electricity bill in a one-for-one energy compensation [31]. Hence, it is observed that the distribution grid acts virtually like a “zero-cost battery”, so there is no incentive for the prosumer to invest in BESS [18]. As if that were not enough, the tax burden on storage batteries reaches 80% of their investment costs in the Brazilian market, making BESS an extremely expensive solution [32]. Nonetheless, some regulatory changes in progress may make BESS more attractive to Brazilian prosumers. A regulatory review process is underway, in which its regulatory agency, the Brazilian Electricity Regulatory Agency (ANEEL), signals that the energy credits valuation will be reduced, thus promoting an increase in self-consumption by prosumers [18,
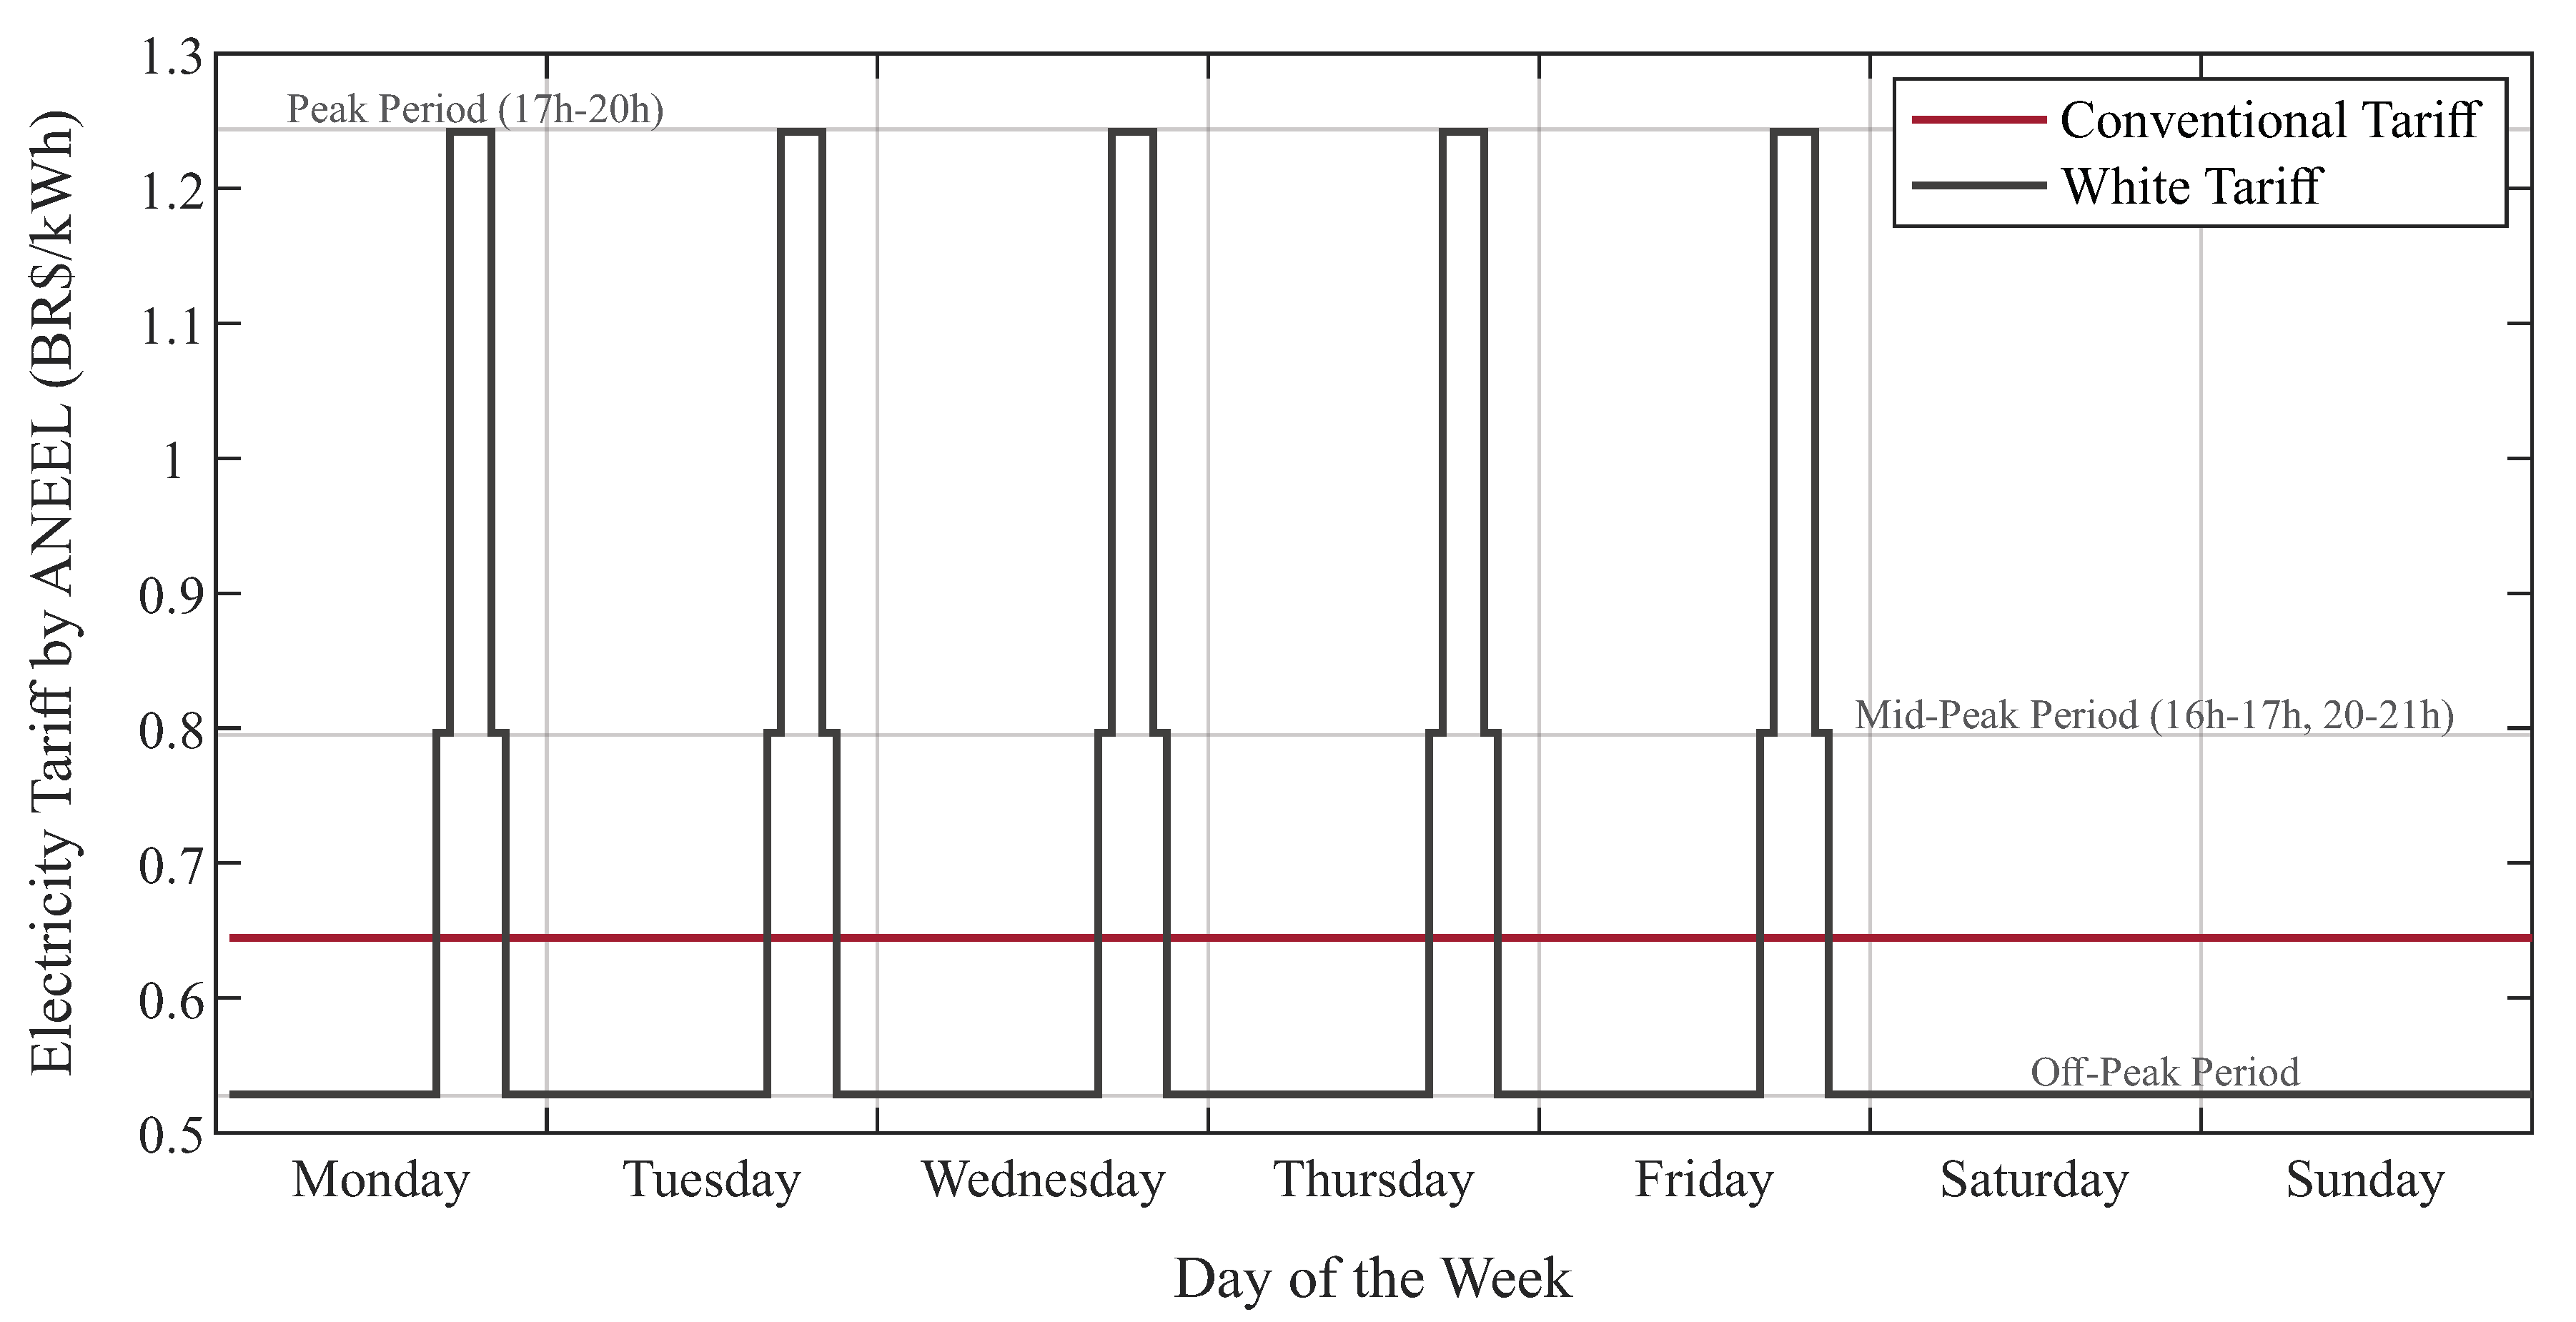
33]. Furthermore, from a process started in 2018, today all Brazilian residential prosumers (and consumers) may choose to be charged for the electricity consumed from distribution grid by a time-of-use (ToU) tariff scheme, called white tariff, instead of the conventional tariff scheme, which is characterized by a flat-rate tariff [34]. This new scheme may encourage a residential prosumer, the owner of a PV+BESS, to shift the self-consumption of electricity stored from low-tariff to high-tariff periods, in order to reduce its overall electricity expenses [6].
Given the topicality of these regulatory changes, few works in the specific literature address the technical and economic aspects of BESS coupling in new or even existing PV systems for residential prosumers under the Brazilian context. A study conducted by da Silva and Branco, found that a PV+BESS with 1.6 kWp of PV capacity and 6.67 kWh of storage capacity is not an attractive investment option for a prosumer located in the city of Belém (northern Brazil), with an electricity demand of 1.2 MWh/year, under the conventional tariff scheme [22].
In turn, the “10-Year Energy Expansion Plan 2029”, which is an official document of the Brazilian government, developed by Energy Research Company (EPE), concludes that for a prosumer located in the state of Minas Gerais (Southeastern Brazil), with an electricity demand of about 8.6 MWh/year and 3.8 kWp of installed PV capacity, an increasing self-consumption gain is verified for up to 15 kWh of installed storage capacity [18]. However, when analyzing these solutions economically, it was observed that battery cost would need to be one-fifth of its present value for the investment to be minimally feasible, in view of the conventional tariff scheme [18].
More recently, EPE released a preview of a new study on the attractiveness of applying BESS to increase the prosumer self-consumption rate, taking into account the alternatives for valuing energy credits proposed by ANEEL in the current DG regulatory review process [35]. Within this, the conditions that some residential and commercial prosumers, with electricity demand adjusted to 10 MWh/year and unspecified installed PV capacity, would experience when located in different cities and under the conventional tariff scheme were analyzed. The general conclusion was that, over a ten-year horizon, investment in BESS is not economically feasible for these prosumers in any one of the alternatives proposed by ANEEL [35].
Despite these preliminary results, several issues related to PV+BESS feasibility, in the current and the glimpsed regulatory scenarios for DG in Brazil, still need to be adequately clarified. None of the mentioned works, for example, investigated the technical and economic conditions that the prosumers respectively considered could experience when choosing the white tariff scheme instead of the conventional tariff scheme. On the other hand, the attractiveness of investment in BESS verified for each alternative of valuing energy credits proposed by ANEEL, also need to be better discussed in order to enrich the current DG regulatory review process. In addition, there is a lack of information about the potential economic benefits that the market’s main incentive policies for BESS dissemination could offer to a residential prosumer interested in investing in this solution.
Aware of that, the present paper conducts a comprehensive study of the energy impacts and potential financial returns that a residential prosumer may experience when investing in a PV+BESS, considering the different Brazilian regulatory scenarios. In this way, a new methodology is proposed to represent the energy operation of the prosumer building. The home energy management strategy (HEMS) problem is modeled through linear programming, aiming to minimize the daily operating costs of a prosumer, accounting for the PV+BESS dispatch while meeting the residential load. In addition, considerations on the degradation of PV+BESS components and their eventual replacement are introduced. Therefore, the main contributions of this work are three-fold:
  • To model a complete linear HEMS problem, incorporating PV and BESS systems, and propose a new method for calculating battery degradation, inspired by consistent literature works;
  • to analyze and compare the economic investment of a BESS system in the current and future Brazilian regulatory scenarios, considering both conventional and white tariff schemes;
  • to promote a sensitivity analysis of the prosumer investment, considering different economic incentives policies, such as subsidies, credit rates, and battery replacement discounts.
In addition to this introductory section, the rest of the paper is organized as follows. Section 2 presents a broader technical and economical literature review regarding PV+BESS system for residential prosumers. Section 3 describes the main aspects of the Brazilian regulatory framework, taking into account the electricity tariff structure and the fundamental issues related to the DG development in this country. Section 4 details the prosumers energy management system with the proposed model and methodology to optimize the daily operation. In Section 5, the cases studied in the present paper are presented with the main results obtained considering the different regulatory scenarios. Section 6 draws the main conclusions.

2. Technical and Economical Aspects of Solar Photovoltaic System with Battery Energy Storage System Integration in Residential Prosumers

Although PV systems are a feasible solution for most residential prosumers in different markets around the world [1,3,36], the same cannot be said about PV+BESS systems [8,20,21,22,23,24,25,26]. The technological incipience of BESS means that the potential benefits brought by its coupling in a new or even existing residential PV system, depend not only on favorable regulatory conditions but also on a whole set of technical and economic factors. Thus, in order to ascertain the main issues related to its feasibility, a discussion about such factors is presented below.

2.1. System Topology

The residential PV+BESS system is typically installed behind-the-meter, usually assuming an architecture such as that depicted in Figure 1 [12,21,23,26,29,37,38,39,40,41,42,43]. As indicated, the residential PV system is commonly characterized by one or more strings of PV modules connected to a “string inverter” [2,36,44]. BESS, in turn, is characterized by battery itself (cell, module, pack), its thermal management subsystem (TMS) and a bidirectional inverter [12,40,41]. This latter component is responsible for coupling the BESS directly to the alternating current (AC) electrical circuit of the PV system and, consequently, the internal electrical circuit of the residential building. It is worth noting that this coupling mode is very flexible and allows easy insertion of the BESS in an existing PV system [41].

2.2. Battery Energy Storage System Technology

The lithium-ion batteries are the most widely considered by recent works [18,20,21,23,26,27,37,45,46,47]. This dominance is partly explained by its great energy density, efficiency, and life cycle, compared to other battery technologies [20,24]. In addition, as it is becoming the standard in portable devices and mobility applications, its technological learning curve has shown an accelerated behavior, so their current high costs are expected to decline significantly in the coming years [24,48]. Notwithstanding, it is possible to find works that address other technologies, such as lead-acid batteries [22,25,26,38,49,50]. In view of that, Hesse et al. analyzed the employment of a lead-acid and two lithium-ion batteries, lithium-iron-phosphate (LFP) and lithium-nickel-manganese-cobalt cathode (NMC), in the German context. These authors found that optimally sized NMC-based BESS appear most economical for prosumers with small local demand (2 MWh/year), whereas lead-acid BESS show some advantages in the presence of a large PV system (>7.5 kWp) [23]. For prosumers with higher local electricity demand (≥4 MWh/year) coincident with a larger PV system (≥3 kWp), the authors concluded that LFP-based BESSs provide better results than the other two [23].

2.3. Battery Energy Storage System Sizing

A comprehensive review conducted by Luthander et al. demonstrated that it is possible to increase the prosumer self-consumption by 13–24% with a BESS capacity of 0.5–1 kWh per kWp of PV system [12]. Complementarily, in a study performed by Lund for various locations around the world, it found that the optimal BESS benefit is obtained with its capacity of up to 2 kWh per kWp of PV system when the latter is sized to match the annual local electricity demand [45]. In this condition, a prosumer located in a southern hemisphere climate could reach a maximum self-consumption tax of 90% [45]. Optimal sizing of BESS is not, however, an easy task. Different factors, such as building location, orientation, and tilting angle of the PV strings, battery specifications, congruence between demand and production, regulatory context, and the adopted HEMS, have a great influence on this [8,21,23,27,28,46,47,51].

2.4. Home Energy Management Strategy

In practice, HEMS can be executed by a specific component installed in the internal electrical circuit of the residential building, or, in a simple way, by the bidirectional inverter itself [41,42,43]. In the baseline strategy supported by these components: (i) the electricity produced by the PV system in a given period is primarily oriented to meet the residential load, i.e., to self-consumption; (ii) if such amount is greater than necessary, the respective electricity surplus is used to charge the battery and/or is dispatched into the distribution grid; (iii) on the other hand, if the electricity produced by the PV system is insufficient or even null, as occurs at night, the residential load is supplied in a complementary or integral manner, by the electricity eventually stored in the battery and/or from the distribution grid [21,23,24,26,27,42,43,47]. The predilection between the battery and the distribution grid in both aforementioned situations is typically made to minimize the daily operating cost of the residential building and in accordance with the technical constraints of BESS [21,23,26,42,43,47,52].
Nevertheless, one of the main issues that differentiate the HEMS supported by the components responsible for its execution or even, considered in studies, is the direct electricity exchange between the BESS and the distribution grid [21,23,25,42,43]. In this regard, it is essential to note that in regulatory contexts favorable to self-consumption, discharging the battery into the distribution grid and charging the former from the latter are often discouraged. In contrast, in regulatory contexts favorable to the practice of arbitrage, they are indispensable. Furthermore, some advanced requirements can be eventually incorporated into HEMS, such as residential demand forecasting and minimization of the battery degradation cost [43,53].
Thus, according to the complexity attributed to HEMS, it can be computationally translated from rule-based heuristic, optimization-based, and machine learning approaches [8,21,23,26,27,28,46,51,53]. Interestingly, Azuatalam et al. thoroughly evaluated seven of these different approaches and concluded that adopting a sophisticated HEMS may not necessarily improve the performance and economic feasibility of PV+BESS, because the quality of input data and battery degradation can adversely affect the battery lifetime [47].

2.5. Lifetime of the Solar Photovoltaic System with Battery Energy Storage System

The PV+BESS lifetime is usually considered to be between two and three decades [8,22,23,25,38,45,47]. This long period corresponds to the lifetime warranty of its most durable fundamental component, i.e., PV modules [45]. Thus, for analysis purposes, the derating capacity of its fundamental components during this long period and their eventual and/or successive replacements are issues that must be taken into account to obtain more realistic and reliable results.
Regarding the PV system, some works present in the literature calculate the derating capacity of PV modules from degradation rate typically verified for its respective technology or installation location [22,25,54,55]. On the other hand, no degradation is usually considered for string inverter. Thereby, a date can be established between 10 and 15 years after the beginning of its operation for its replacement [36,38].
With respect to BESS, a more complex situation is observed. The battery generally suffers from two types of aging process: calendric aging and cyclic aging [21,23,41,53,56,57]. The former is related to the natural corrosion process of the materials that constitute it [53]. As this process is independent of battery operation, it can be represented by a degradation rate estimated from the manufacturer’s lifetime warranty [53,56]. In contrast, the latter is related to charging-discharging cycles experienced by the battery during its operation [53]. The total number of cycles that the battery can perform over its lifetime is dependent on the depth of discharge corresponding to these [53]. As can be inferred from Figure 2, the deeper a cycle, the greater the cyclic battery aging.
In view of this, some works calculate a date for battery replacement considering a fixed depth of discharge and a constant number of cycles defined for its daily operation [58,59]. Nonetheless, such conditions are unlikely to be enforced in practice. Following the basic HEMS guidelines described earlier, the battery is more likely to perform a varying number of cycles with different depths of discharge during its operation (see Figure 8). Thus, to assess the cyclic aging related to irregular daily battery operation, the Rainflow Algorithm is usually employed [53,60,61,62,63,64,65]. This algorithm makes it possible to estimate the number of complete cycles (charging and discharging) and half-cycles (just charging or just discharging) performed by the battery, as well as their corresponding depths, from its state of charge profile [53,63].
Therefore, by systematically computing the degradation rates due to calendric and cyclic aging, it becomes possible to estimate the date on which the battery should be replaced [21,23]. In this sense, the battery end-of-life (EOL) is typically defined when its capacity reaches 80% of its original capacity [8,41,60]. Moreover, since the battery and the bidirectional inverter are usually sold as a single package on the market, the estimated date for battery replacement is commonly generalized to entire BESS [21,23].

2.6. Revenue Enhancement

Bearing in mind that BESS is not yet an economically feasible solution for residential prosumers in most countries, various works have also analyzed the potential benefits of adopting time-varying tariffs in specific regulatory contexts [21,28,29]. Although these tariffs represent a great incentive for the arbitrage practice by prosumers at first glance, this must be appropriately assessed for each case. For instance, a study conducted by Pena-Bello et al. for the Swiss context found that the most significant monetary value per kWh of BESS capacity is obtained when a BESS is used to improve the prosumer self-consumption rate under a single flat-rate tariff [29].
In another way, some works have investigated the possibility of adding different value streams to BESS, enabling it to provide some “grid services”, such as peak shaving at the district level or balancing grid frequency, in addition to the previously mentioned “user-services” [20,46]. Although this alternative has shown encouraging results in certain contexts, enabling BESS to “stack revenues” is not straightforward [20,46]. In many cases, both the markets for these “grid services” and linkages between prosumer, aggregator, and DSO need to be created [66].

2.7. Support Policies

In view of the aforementioned regulatory barriers, the establishment of explicit policies to support residential prosumers interested in BESS investing, such as subsidies, low-cost loans, and tax rebates, prove to be fundamental to promote a drop in their costs in some markets [4,20,27,28,29]. More precisely, such mechanisms are often used to foment the popularization of BESS as an economically attractive solution.

3. Brazilian Regulatory Context

The knowledge of the main DG regulation guidelines, as well as the tariff schemes available to residential prosumers, are essential to assess the economic feasibility of PV+BESS in the Brazilian context. In general, these are the main factors that delimit the potential savings that the energy produced and/or stored may provide to its investor. Moreover, the future regulatory scenarios explored in the current DG regulatory review process are based on the fundamental components of electricity tariffs practiced in Brazil, which demonstrates a close relationship between these two fields. Therefore, a brief description of the Brazilian tariff structure is performed below. Following, an overview of the present and possible future regulatory scenarios for DG in this country is properly explained.

3.1. Electricity Tariff Structure

As mentioned in Section 1, residential prosumers and, consequently, residential consumers can currently choose to be charged for the electricity consumed from the distribution grid through the conventional tariff or white tariff. As shown in the Figure 3, the conventional tariff is characterized by a single value, while the white tariff is characterized by three distinct values, which are associated with the following consumption periods: (i) peak—from 17 h to 20 h; (ii) mid-peak—from 16 h to 17 h and from 20 h to 21 h; and (iii) off-peak—remaining hours of the day [34,67]. It is worth mentioning that this differentiation only applies on working days, being the white tariff given by off-peak value for all hours on weekends and national holidays [34].
The values of conventional and white tariffs practiced by a certain distribution company, which normally has the federal concession to act as DSO of a delimited region, are defined through resolutions homologated by ANEEL [68]. When calculating these values, ANEEL takes into account the distribution company expenses since the last periodic tariff review, with: (i) distribution; (ii) transmission; (iii) use incumbencies; (vi) energy losses; (v) energy incumbencies; and (vi) energy purchased to properly meet the consumer and prosumer loads in its concession region [33,67,68,69]. For clarity, Figure 4 shows the impact of these expenses on the composition of the conventional tariff, which is paid by a residential prosumer located in the state of Minas Gerais, under the concession region of the distribution company called Companhia Energética de Minas Gerais (CEMIG) [67,70]. As expected, electricity distribution and purchase costs are the most significant.
Nevertheless, the electricity tariff actually paid by this residential prosumer ( T ( t ) )—or any other residential prosumer or consumer—for the electricity consumed in an hour “t” is not given directly by the electricity tariff value defined by ANEEL ( T D ( t ) ) for this hour in the tariff scheme eventually chosen. As indicated in Equation (1), it is subject to the internalization of three tax costs: (i) Social Integration Program (PIS); (ii) Contribution for the Financing of Social Security (COFINS); and (iii) Tax on Circulation of Goods and Transportation (ICMS) [22,68]. The first two are federal taxes and have variable monthly values with an upper bound of 1.65% and 7.60%, respectively [68]. In turn, the third is a state tax and has a fixed rate specifically determined by each state for each user class. For example, in the state of Minas Gerais, the ICMS rate is equal to 30.00% for residential consumers and prosumers [71]. Therefore, the combined charges of these taxes tend to increase the electricity tariff paid by the mentioned prosumer by 35%, as shown in Figure 4.
T ( t ) = T D ( t ) 1 ( PIS + COFINS + ICMS )
In addition, other costs may eventually be applied to the electricity tariff actually paid by the residential consumers and prosumers, such as those associated with the so-called tariff flags. The tariff flags are a monthly indicator of the general cost of generating electricity in the country [72]. In other words, as Brazil produces its electricity mainly from hydroelectric power plants (66.7%) and has a national interconnected electricity transmission system, the actual capacity for generating electricity in a certain period depends strongly on the levels of water stored in their respective reservoirs [73]. Therefore, in a logic comparable to that of a traffic light, when hydrological conditions are favorable, the green tariff flag is signaled by ANEEL, thereby disregarding any additional charges [72]. In contrast, when reservoir levels drop significantly, additional thermal power plants must be activated to compensate for the low generation of hydroelectric power plants. In this case, a yellow or red tariff flag is signaled according to the severity of the situation and, therefore, an additional flag charge proportional to the electricity consumption from the distribution grid is applied [72]. However, in a common position to that adopted by other related works [22,36], the green tariff flag will be considered a standard in this paper. One reason for this lies in the complexity of the long-term forecast of tariff flags, which is directly influenced by climate change events [22]. Another is that if PV+BESS proves to be feasible under this condition in a given regulatory scenario, any other tariff flag experienced in practice will only increase its respective savings, so it will only increase its attractiveness.

3.2. Distributed Generation Overview

The DG regulation in Brazil was first introduced in 2012, by Normative Resolution 482 of ANEEL [30], and reviewed in 2015, by Normative Resolution 687 of ANEEL [31]. According to these resolutions, any small generation system based on renewable energy sources or high-efficiency co-generation is eligible to join the sector [30,31]. For differentiation purposes, it was defined as microgeneration—any generation system with up to 75 kW of installed capacity, and as minigeneration—any generation system from 75 kW to 5 MW, except those based on hydropower, whose upper limit is 3 MW [31].
As presented in Section 1, the compensation system to be offered to consumers interested in investing in a micro or minigeration system is defined by the net-metering scheme [30]. Therefore, apart from self-consumption, the generation system owner will receive an energy credit for each electricity unit (kWh) injected into the distribution grid, valid for 60 months [31]. Although the commercialization of energy credits is forbidden, the regulation enables the prosumers to explore four “business models”: (i) local self-consumption, which is characterized by the use of energy credits to offset the electricity bill of consumer unit associated with the building where the micro or minigeneration system is installed; (ii) remote self-consumption, which is characterized by the transfer of energy credits to another consumer unit, owned by the same private or legal individual of the micro or minigeneration system; (iii) shared generation, through which private or legal individuals can establish a cooperative (or a consortium) and install a micro or minigeration system, sharing the energy credits from this; and (iv) enterprise with multiple consumer units, which allows the installation of micro or minigeration system in condominiums [31,74]. It is worth mentioning that, regardless of the business model explored, the compensation performed by the energy credit does not imply a financial transaction, but a physical one (one-for-one energy compensation) [74]. Therefore, the micro and minigeneration systems cannot directly generate revenue for the prosumer, but rather, savings proportional to reducing their electricity consumption expenses.
In response to this developed regulatory policy, about 290,000 micro and minigeneration systems were installed until September 2020 in Brazil, being 95% of these characterized by PV systems. All these DG units represent almost 3.7 GW of installed capacity and benefit approximately 380,000 consumers, among which around 66.4% belong to the residential class [75]. About the business models, the most common is the local self-consumption, which is explored by more than 85.6% of the micro and minigeneration systems owners [75]. Regarding the location, the state of Minas Gerais has the highest number of DG units (20.4%) and benefited consumers (24.2%) [75]. Consequently, the DSO, which has the largest number of micro and minigeneration systems installed in its distribution grids, is the CEMIG, which is the distribution company that holds the concession for the operation of most of the state’s distribution network [75].
Nonetheless, the DG accelerated growth under the net metering scheme and the business models currently regulated in Brazil may cause serious economic distortions among sector players in the near future. For instance, the improper transfer of subsidy costs to distribution companies and consumers that are not taking part in the compensation system [33]. Aware of that, ANEEL started discussions regarding the review of Normative Resolution 687 still in the year of 2018, but without a new resolution to date. In this way, one of the main proposed measures concerns the modification of the mentioned one-for-one energy compensation scheme [33]. Thus, considering the electricity tariff structure early described (see Figure 4), ANEEL has proposed the six possible alternatives presented in Table 1 for “valuing” energy credits [33]. As can be verified, Alternative 0 represents the continuation of the current scenario, in which the energy credit compensates all electricity tariff components. In contrast, Alternative 5 represents the most penalizing modification, in which the energy credit will comprise only one component of the electricity tariff, namely, the energy purchase to meet the prosumer load properly. Alternatives 2, 3, and 4 represent intermediate scenarios.
According to ANEEL, any of those proposed alternatives could be adopted. Even more, different alternatives could be adopted for different business models [33]. Moreover, its implementation may occur according to different criteria, such as a specific year or level of DG installed capacity in Brazil. However, it should preferably be achieved in the next five years, when a new review process of the DG regulation is likely to happen [33].
Since no decision on these issues has been formally made by ANEEL, a major debate has been taking place among the leading players in the sector in recent years. On the one hand, the distribution companies claim that the current scenario does not allow adequate remuneration for the use of the distribution grid and, thereby, the continuation of Alternative 0 should not even be considered by ANEEL for any period [33]. On the other hand, PV installers and consumers interested in the market emphasize the DG benefits for society and consider the Alternative 0 should remain for at least a few more years, in order to allow further consolidation of the sector [33].
Parallel to this debate, other peripheral issues, such as the BESS regulation, began to stand out in the review process of the Normative Resolution 687. In Brazil, there are some PV+BESS installed in commercial buildings and research and development (R&D) projects, but on a small scale [18,32]. Nevertheless, these few units are in a “regulatory vacuum” since there is no normative resolution, directive, or official procedure of ANEEL, which deals in a specific and structured way, the rules for the incorporation of BESS in the DG context [32]. Therefore, sector groups, such as the Brazilian Solar Energy Association (ABSOLAR), strongly claim that the new DG regulation should clarify these issues [32].
As a consequence of this situation, ANEEL was forced to extend the review process deadline, initially scheduled for 2019, allowing for a better discussion of these issues with stakeholders. Furthermore, due to the tragic and unfortunate COVID-19 pandemic experienced in 2020, the review process for DG (including PV and BESS directives) should only be completed in 2021—hence the pertinence of the present paper.

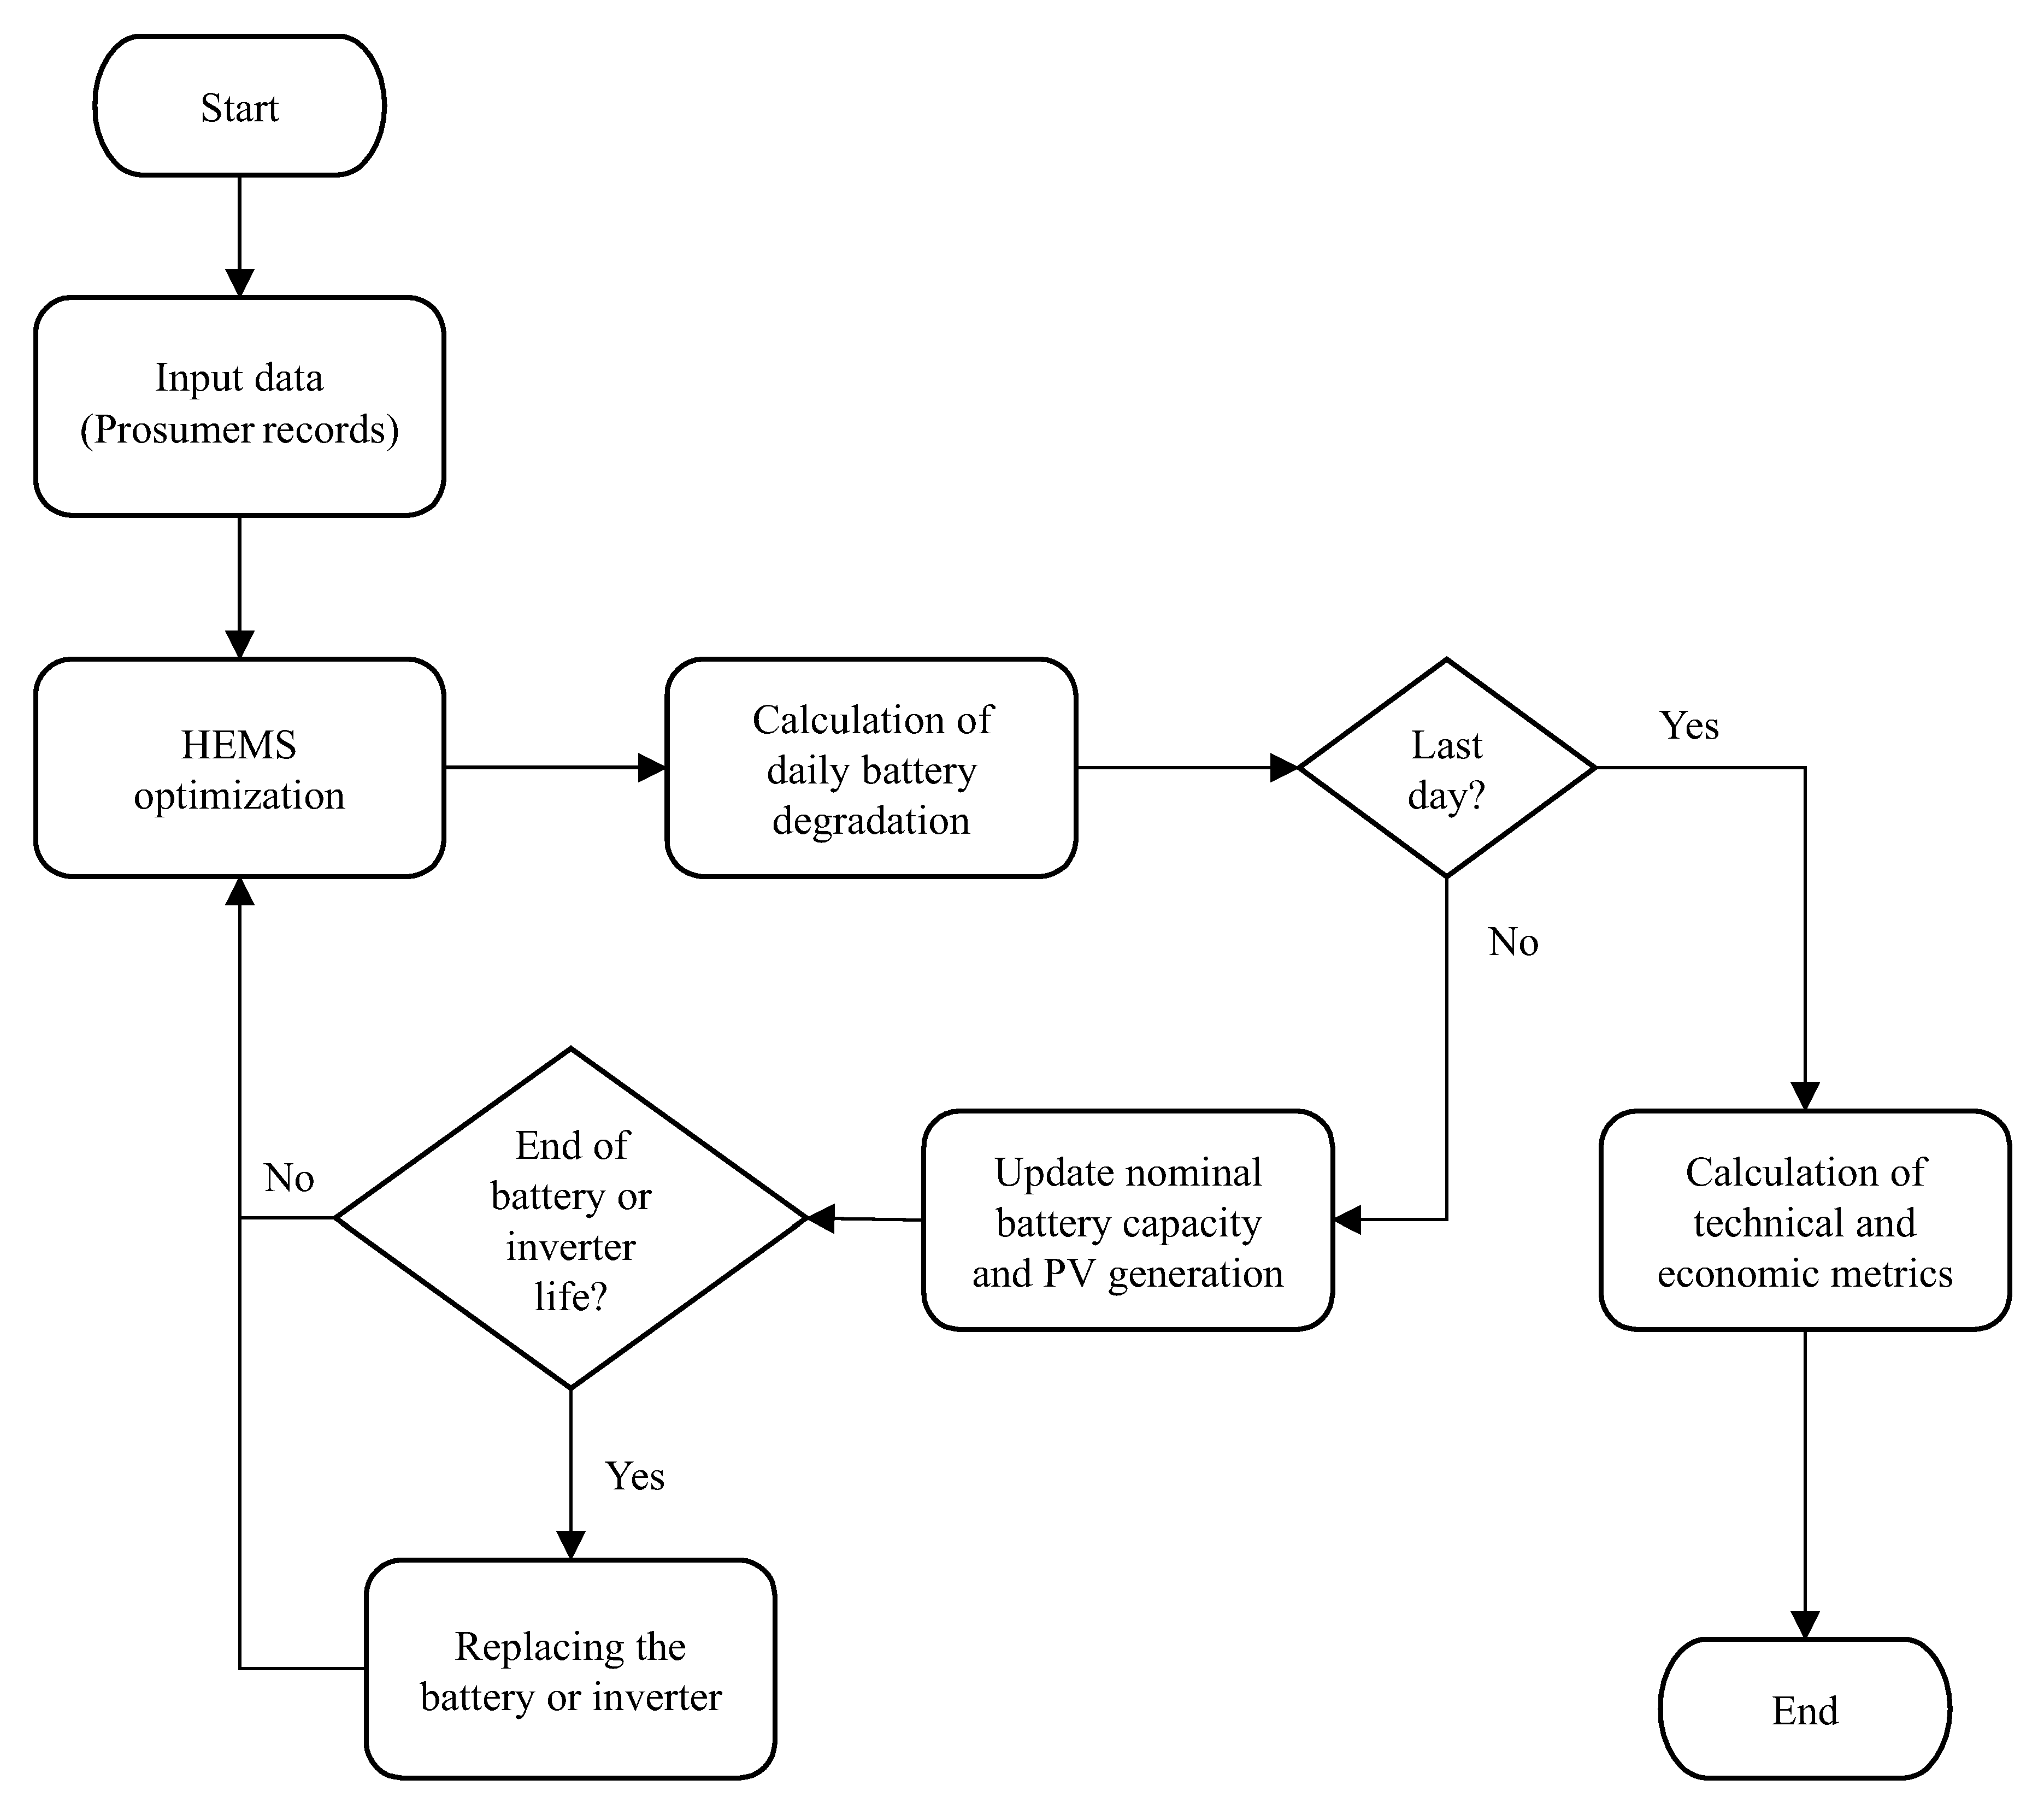
4. Prosumer Energy Management System

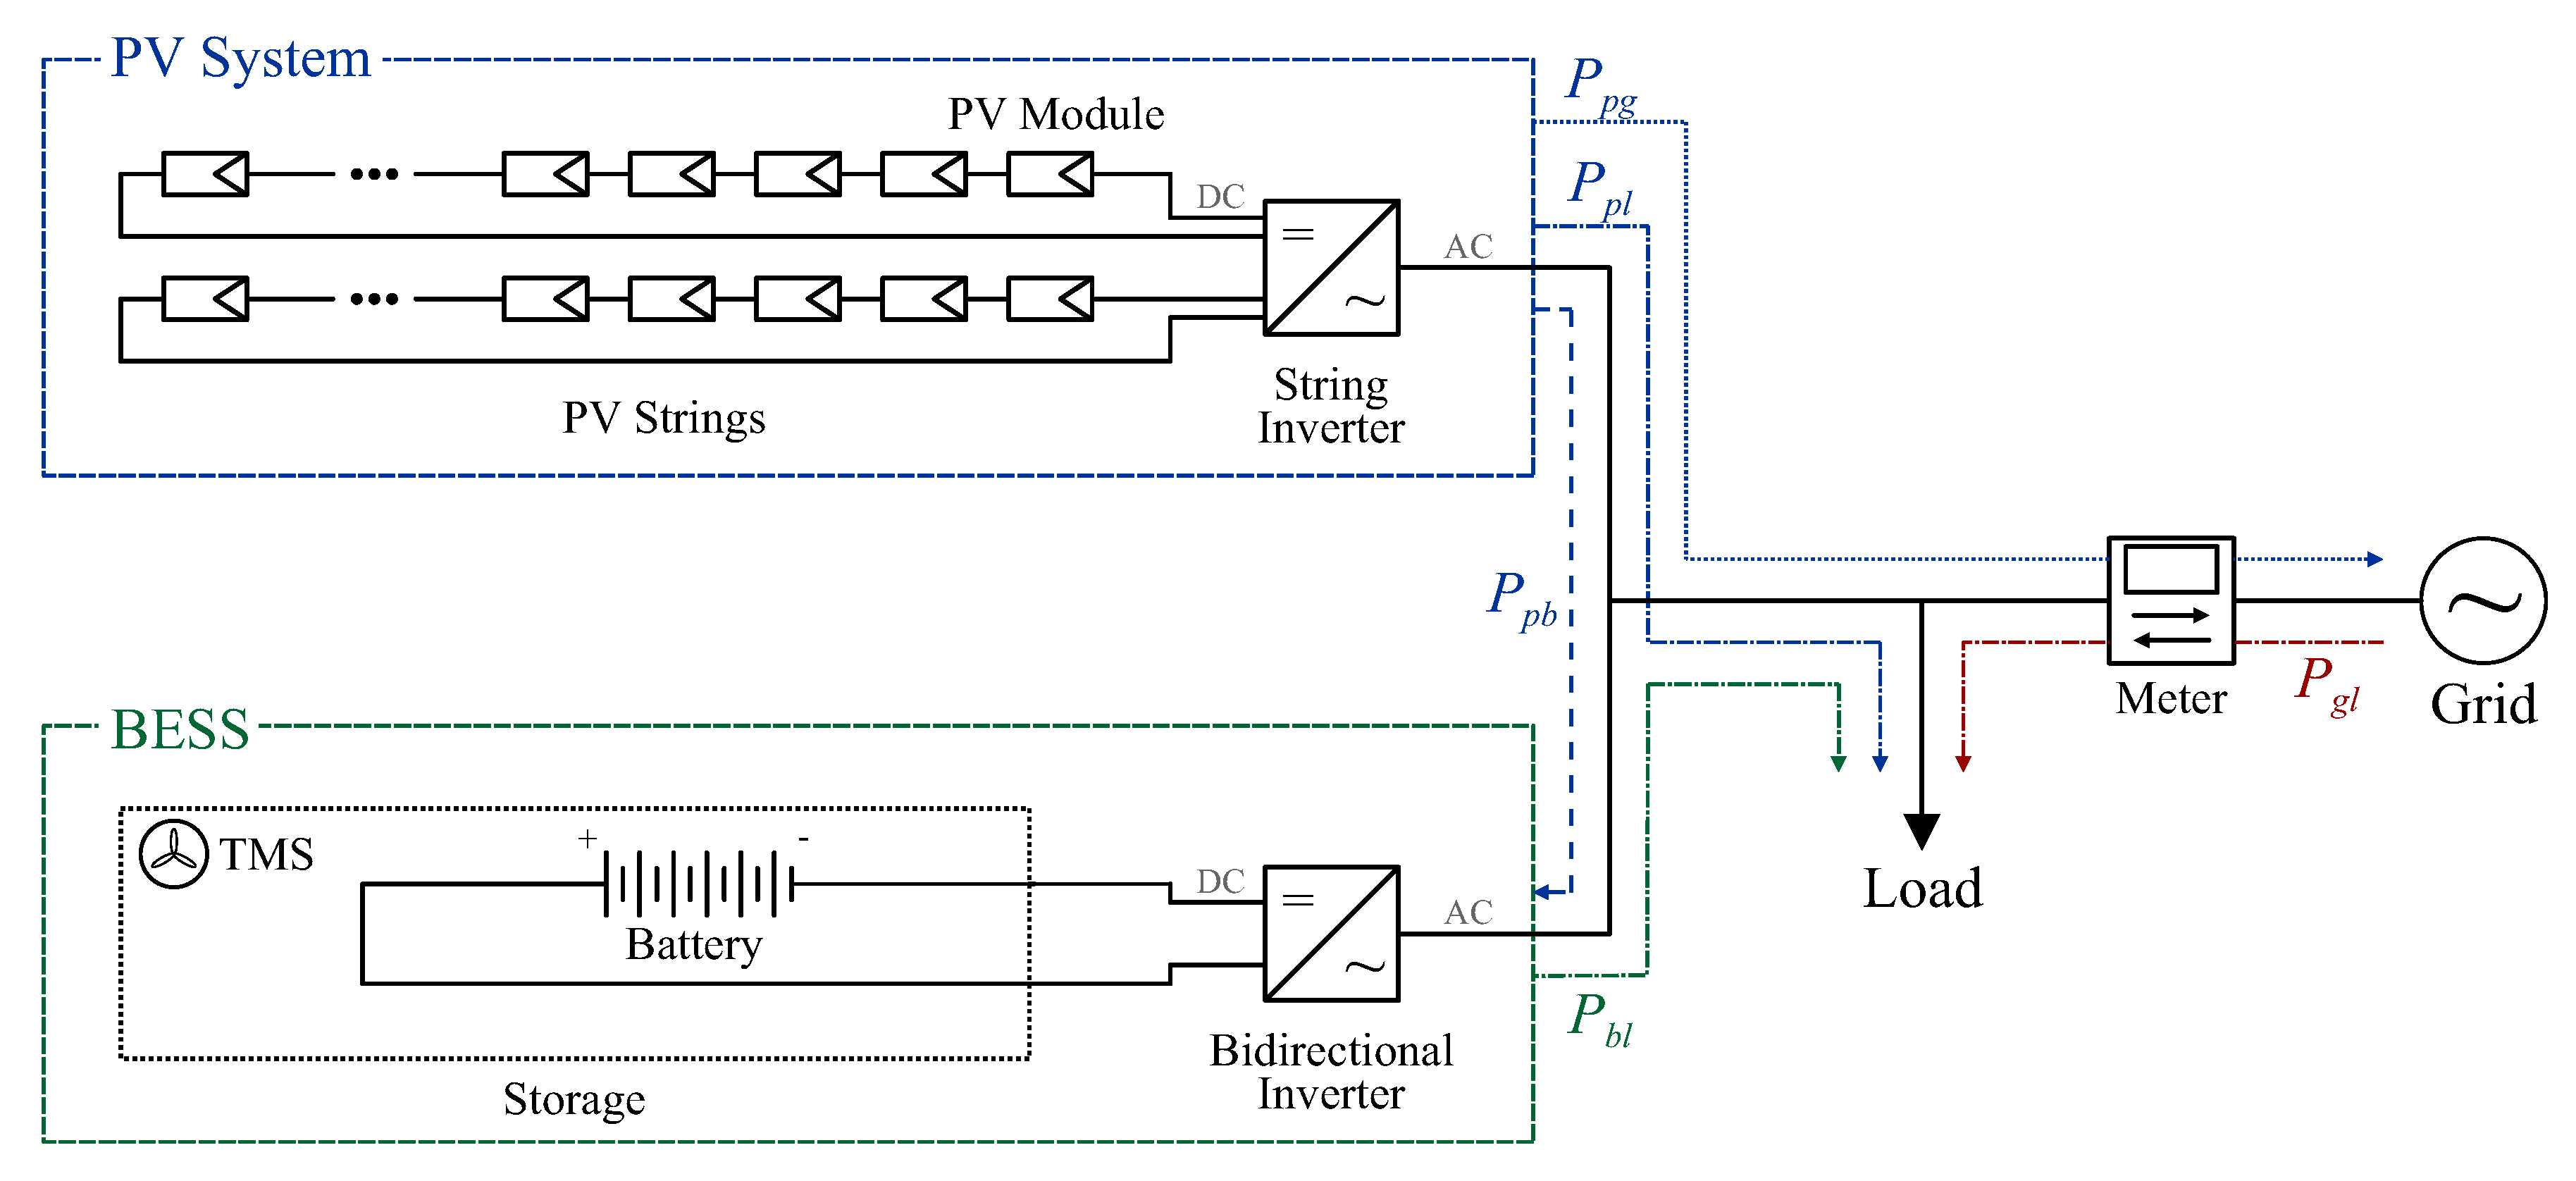
The analysis of a residential PV+BESS system is made possible through a procedure that simulates its operational behavior, with a convenient degree of precision and detail. This procedure seeks to consider more realistic conditions in the application context, thus elaborating a methodology to demonstrate the operation of energy exchanges in the system. An overview of the proposed analysis process is presented in Figure 5.
The methodology aims to minimize the daily operating costs of the PV+BESS system, being modeled through linear programming to ensure efficient computational solutions, yet considering all system characteristics. More precisely, the proposed model considers the correct dispatch of the electricity produced by the PV system, the adequate attendance of the residential load and the technical constraints of the BESS, as well as the method developed for the estimation of the battery degradation and the technical and economic analysis metrics adopted in this work.

4.1. Proposed Model for Home Energy Management Strategy

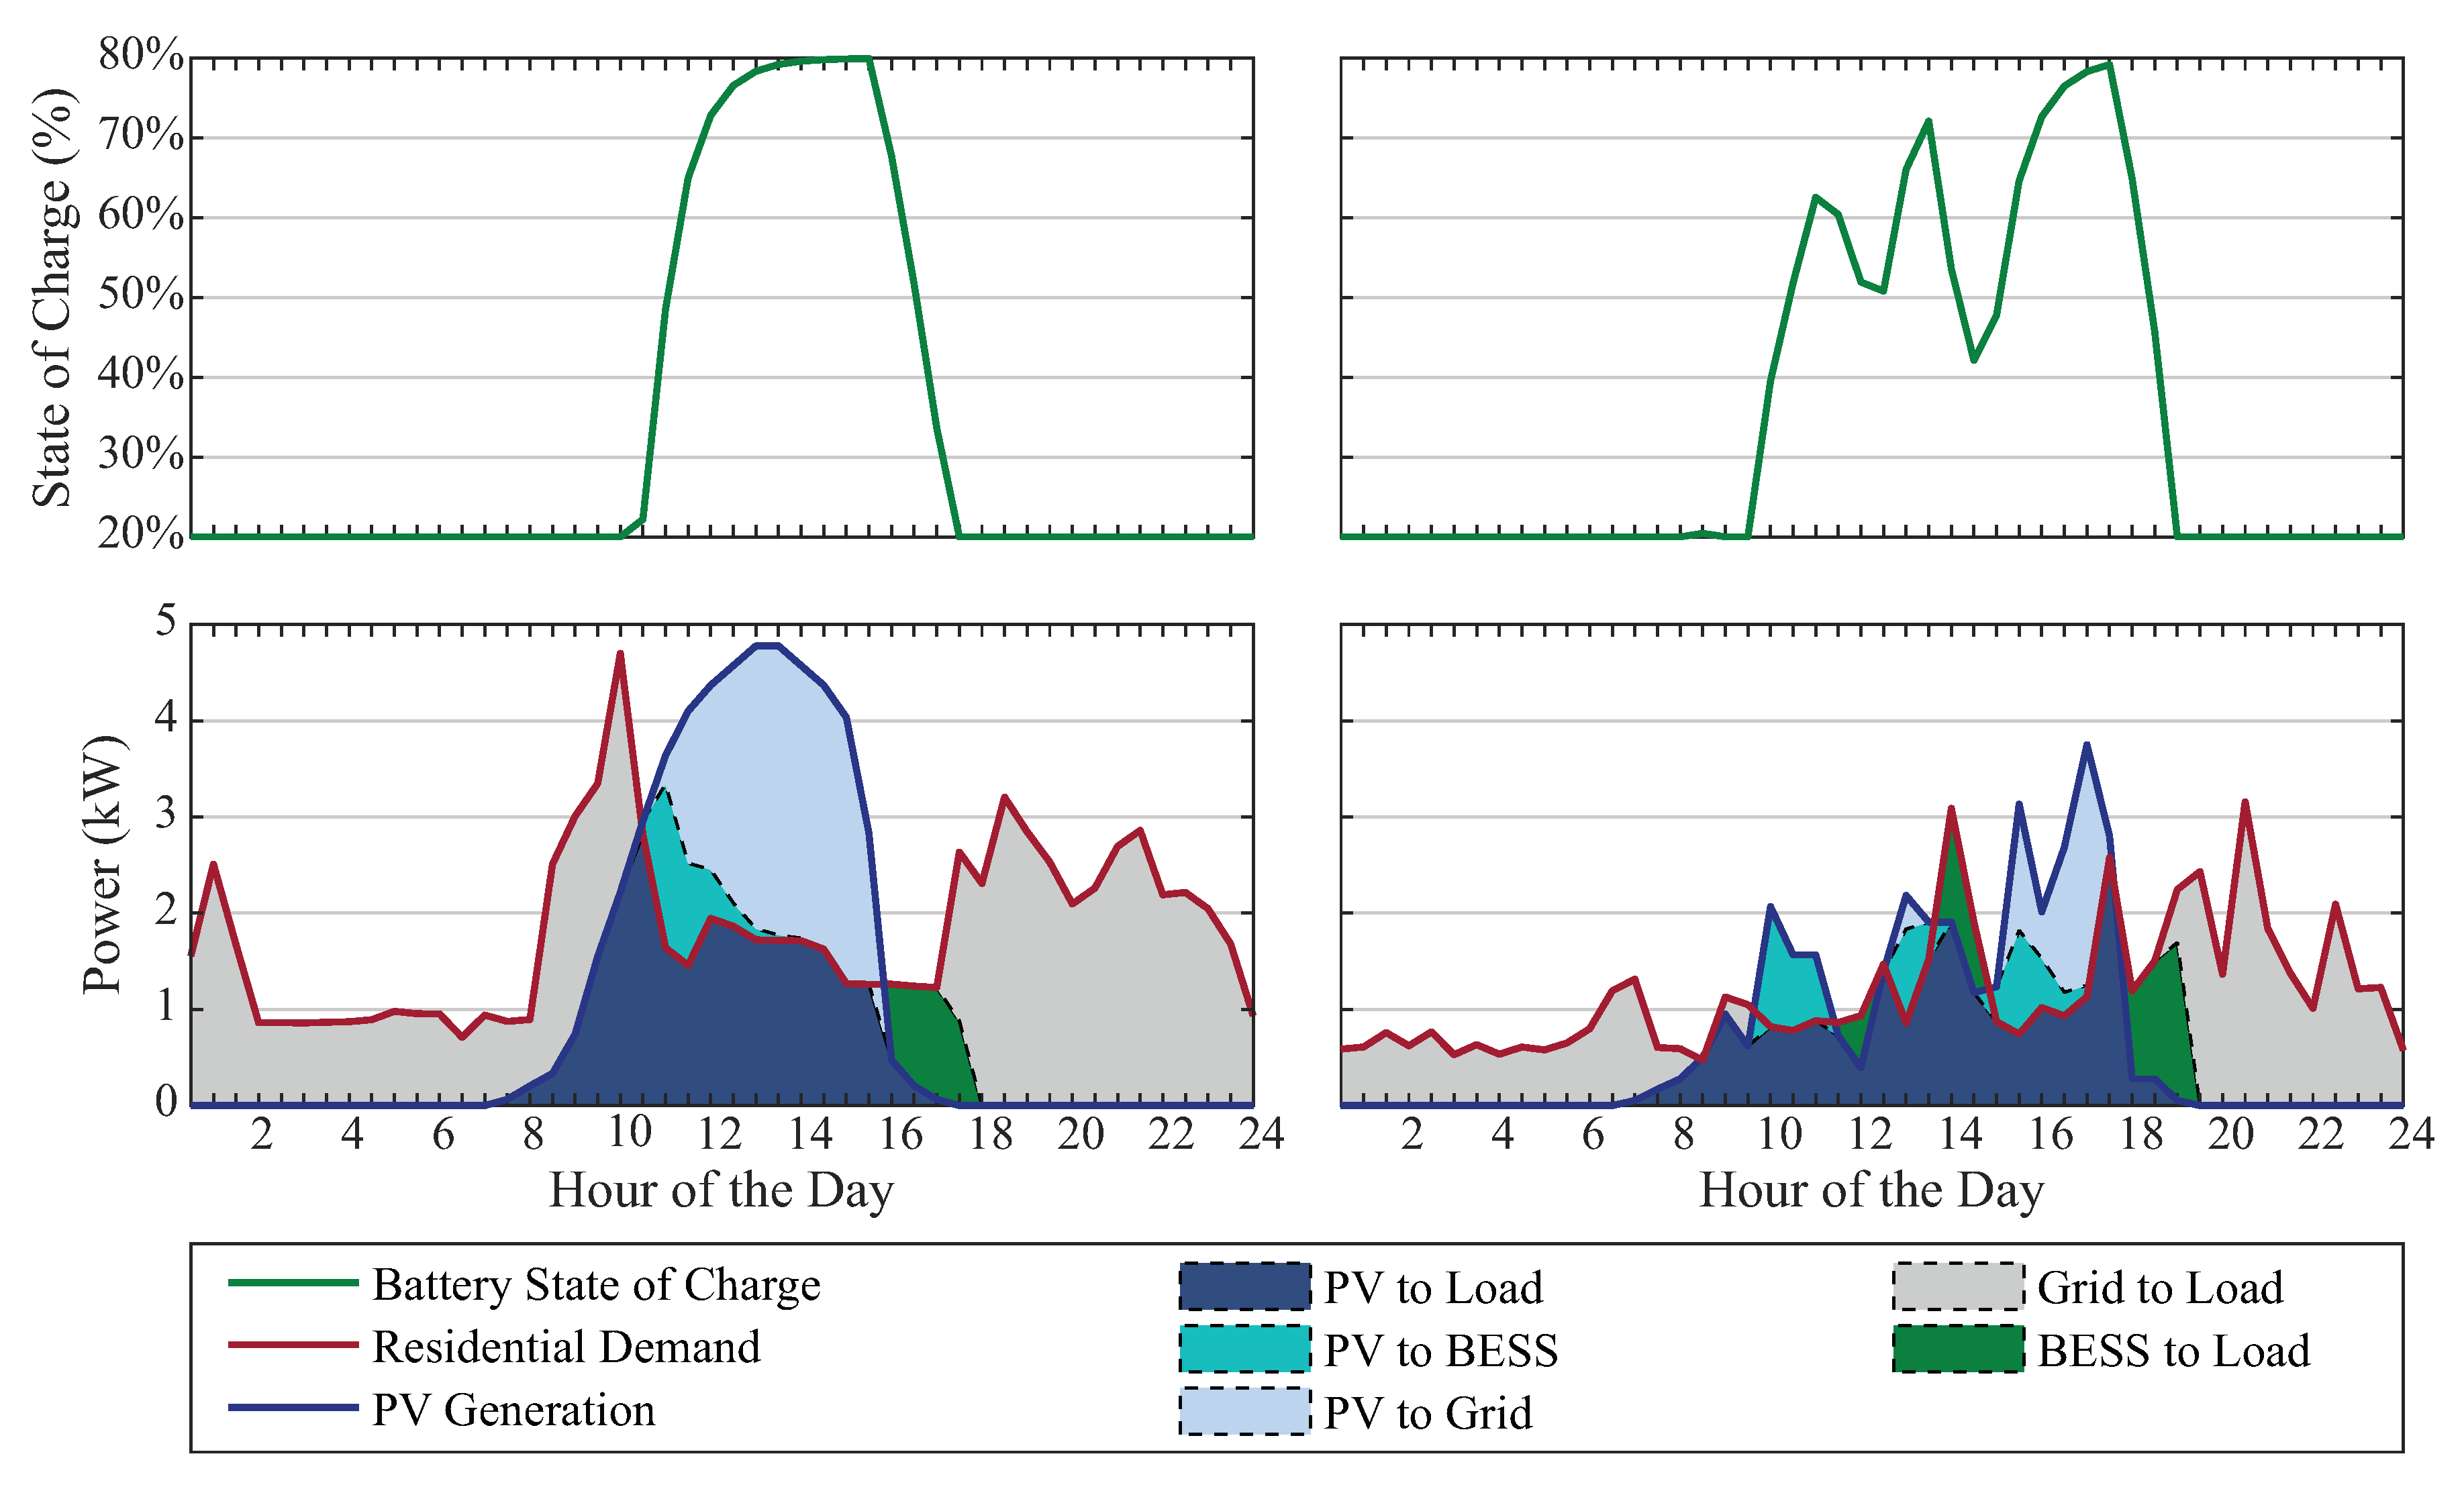
Since the Brazilian regulatory scenarios under evaluation are favorable to self-consumption (see Section 3) and arbitrage is not a widespread practice among residential prosumers, direct electricity exchange between the BESS and the distribution grid was assumed as unfeasible in the present study. Therefore, HEMS must take into account only the energy flows represented in the Figure 1; that is, from PV system to residential load ( P p l ), from PV system to BESS ( P p b ), from PV system to distribution grid ( P p g ), from BESS to load ( P b l ), and from distribution grid to residential load ( P g l ). In view of this, the linear optimization model represented by Equations (2a) to (2m) is proposed to simulate the daily energy operation of the residential building [52,76,77]. Where x = P p l t , P p b t , P p g t , P b l t , P g l t , S o C t , S t is the set of decision variables for each period t of the day.
( 2 a ) minimize x t = 1 T f ( x ) + g ( x ) ( 2 b ) subject to P p l t + P p b t + P p g t = P p v t ( 2 c ) P p l t + P b l t + P g l t = P l o a d t ( 2 d ) S o C t = S o C t Δ t × ( 1 S D ) + S t B n o m ( 2 e ) S t × η c × η i n v ( S o C m a x S o C ) × B n o m ( 2 f ) S t × η d × 1 / η i n v ( S o C S o C m i n ) × B n o m ( 2 g ) S t × η i n v λ c × B n o m × Δ t ( 2 h ) S t × 1 / η i n v λ d × B n o m × Δ t ( 2 i ) S t = P p b t P b l t ( 2 j ) P p b t | S t | ( 2 k ) P b l t | S t | ( 2 l ) S t   f r e e ( 2 m ) P p l t , P p b t , P p g t , P b l t , P g l t 0
The objective function (2a) aims to minimize the operating costs that are divided into the sum of two components: f ( x ) , which is related to the electricity cost, i.e., the energy cost of the daily functioning of the prosumer’s residence; and g ( x ) , which is a virtual cost related to HEMS. Considering the issues discussed about the net metering scheme in Section 3, f ( x ) can be written as given in (3), where:
f ( x ) = T ( t ) × P g l t P p l t P b l t γ × P p g t
The weighting factor, γ , is used to perform the analysis of the different regulatory scenarios and is multiplied by the portion that interacts with the network ( P p g t ).
The second component of the objective function, represented by g ( x ) , can be designated to ensure BESS availability. As the system has been modeled to prioritize the self-consumption mode, i.e., it prioritizes the load supply by the PV system. In case there is energy surplus, i.e., when the PV generation is greater than the prosumer consumption, this surplus is used to charge the batteries. Only after these priorities are met, surplus generation is injected into the power grid. To this end, these priorities are established by means of bonus penalties (economic incentives) in the objective function. For all energy supplied directly by the PV system to the prosumer’s load P p l t , an incentive of 5 times the energy tariff paid to the retailer δ p l t is considered. Similarly, for all the energy provided by the PV system to the BESS system P p b t , an incentive of 2 times the retailer’s tariff δ p b t is considered. Note that there is no incentive for injecting into the grid, so the sequence of incentives for establishing the desired priorities is fulfilled. Equation (4) expresses this relationship for g ( x ) , ensuring that the optimization process itself will be in charge of following the criteria for coordinating energy flows, as mentioned above, depending on the weights assigned to each possible option.
g ( x ) = T ( t ) × δ p l t × P p l t δ p b t × P p b t
With regard to the constraints of the problem, it is worth noting that Equation (2b) represents the energy balance of the energy generated by the PV system, while Equation (2c) sets the energy balance of the residential demand in a given time interval t.
The remaining constraints (from (2d) to (2k)) refer to battery operational management. Equation (2d) sets the state of charge (SoC) of the battery S o C t , in function of its previous S o C t Δ t , its self-discharge (SD) rate, and the amount of charged or discharged energy in the present space of time. Bearing in mind that batteries cannot charge and discharge at the same time, these actions are represented by a single variable S t , which is a free variable. Therefore, if: (i) S t is null, it means that the battery is not used in the time interval in question; (ii) S t assumes positive values, it means that the battery is charging; and (iii) S t assumes negative values, the battery is discharging. It is important to highlight that this S t logic is effective thanks to the support of the constraints described in (2i), (2j) and (2k), which guarantee the mutually exclusive occurrence of P p b t and P b l t . It is also essential to emphasize that the S t logic and these support constraints characterize the main differential brought by this model proposed for HEMS concerning others available in the literature, which generally make use of binary variables to guarantee the mentioned mutually exclusive occurrence [28,78,79]
With respect to (2e) and (2f), they are inequalities that represent the battery efficiency limits, taking into account its minimum ( S o C m i n ) and maximum state of charge ( S o C m a x ), its charging ( η c ) and discharging efficiencies ( η d ), the efficiency of the bidirectional inverter ( η i n v ) and nominal battery capacity ( B n o m ). Likewise, Equations (2g) and (2h) represent the limits imposed by the battery charging ( λ c ) and discharging rates ( λ d ) allowed between two subsequent time intervals ( Δ t ), respectively. It is worth mentioning that the S t signals have been adjusted in these constraints to ensure that they are active only when necessary.
It is pertinent to highlight that since the derating capacity of PV modules is the most significant among the components of a PV system, usually calculated from a typical degradation rate (see Section 2), it is proposed in the present study that its effect is directly computed on the known information or, in other words, on the operational records of the PV system. Thus, assuming that the drop in PV generation is directly proportional to the derating capacity of the PV modules, the electricity produced by the PV system in each time interval corresponding to a day of PV system operation is respectively given by Equation (5).
P p v t = P p v , 0 t · 1 ξ p v n 1
where P p v , 0 t is the PV generation recorded, ξ p v is the considered daily degradation rate and n is the respective day of the simulation.
In order to make the optimization model as close as possible to the real one, other considerations were made, such as the degradation of the battery’s nominal capacity, as already mentioned. This premise becomes necessary due to the action of time and with the charging and discharging cycles to which the storage system is subjected, thus suffering a natural wear in its storage capacity. Constraints (2d), (2e), (2f), (2g), and (2h) are updated daily with the new nominal battery capacity. The way this update is carried out and its calculation procedures are described below.

4.2. Estimation of Battery Degradation

To calculate the battery degradation and update its nominal capacity daily, some procedures are performed. First, the effects of calendric aging and cyclic aging must be duly calculated. Therefore, considering that the battery EOL is when it reaches 80% of its nominal capacity (see Section 2), the daily degradation rate due to calendric aging ( ξ c a l ) can be estimated from (6) [56], where T s h e l f is the battery lifetime reported in its datasheet by the manufacturer.
ξ c a l = 1 0.8 1 T s h e l f
On the same line, the daily degradation rate due to cyclic aging ( ξ c y c ) can be estimated by (7) [56], where L ( D o D = 100 % ) is the total number of discharging-charging cycles that it can take considering a depth of discharge (DoD) of 100%. It is worth to mention that this information is also usually reported on the datasheet by the manufacturer.
ξ c y c = 1 0.8 1 L ( D o D = 100 % )
Since the battery can perform a variable number of discharge–charge cycles with different levels of DoD in a typical day operation, the Rainflow Algorithm needs to be applied to identify them (see Section 2). As discussed in [53,61,62,63,64,65], this technique is widely used to assess stress and fatigue of components and structures. In the case of the present study, it was used to determine the number of complete cycles and half cycles of charging and discharging. To apply this algorithm, it is necessary to first obtain the SoC profile of the battery, then as shown in [63,65], three consecutive intervals are calculated:
  • Δ s 1 = | s 0 s 1 | , Δ s 2 = | s 1 s 2 | , and Δ s 3 = | s 2 s 3 | ;
  • if Δ s 2 Δ s 1 and Δ s 2 Δ s 3 , then there is a complete cycle associated with Δ s 2 . The points s 1 and s 2 are extracted and the identification of the points continues, with new intervals, using s 0 , s 3 , s 4 , s 5 ...;
  • if the condition above was not satisfied, change the identification points to s 1 , s 2 , s 3 , s 4 until there is no more identification of complete cycles.
The remaining points are considered residual rainflow and are counted as half a cycle, as detailed in [62]. A half cycle is formed by the points at the local ends of the residuals. Emphasizing that the simulation is daily, a SoC profile is obtained every day, allowing to estimate battery degradation and update its daily nominal capacity. After performing the cycle count related to the SoC profile of the storage system, their respective DoDs is obtained.
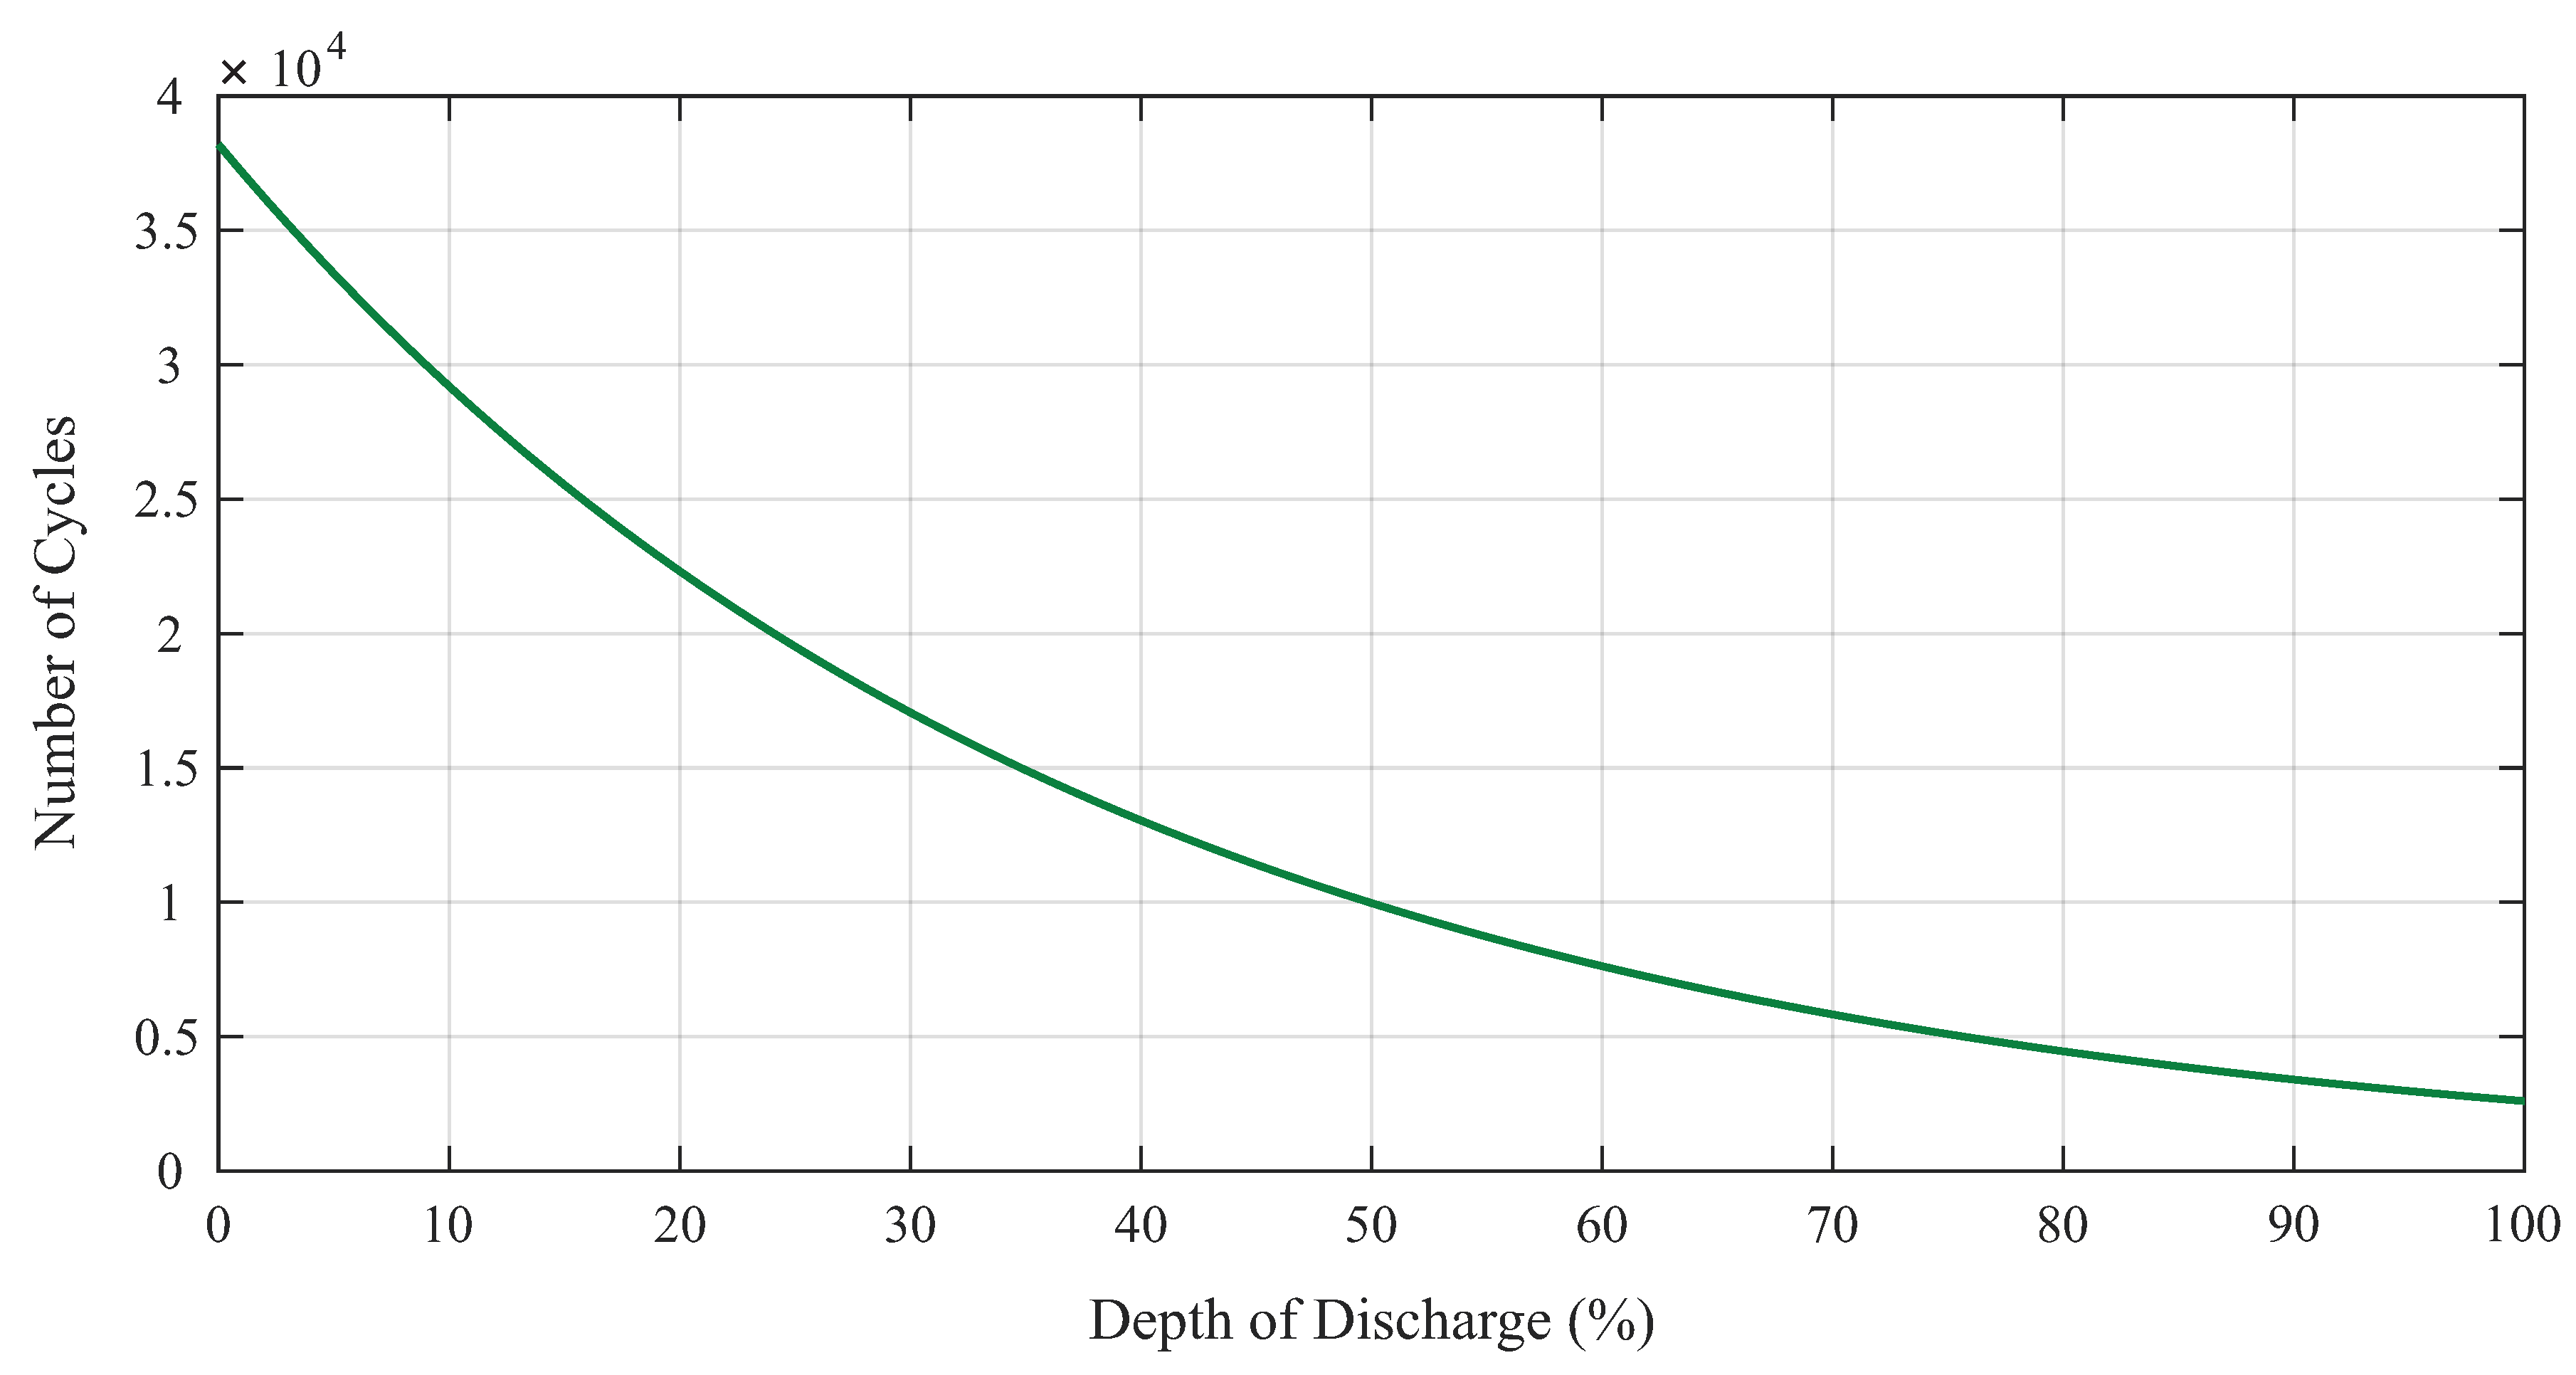
At the end, the remaining points are considered residual rainflow and are counted as half cycles of discharging or charging in the respective depth. The equivalence between these results returned by the Rainflow Algorithm and the number of cycles that would be verified if they were related to a DoD of 100%, is made considering that the loss of cycle life is a constant [57,80]. This is done using (8), where L ( D o D ) is a nonlinear function that describes the "total number of cycles versus DoD" curve (see Figure 2).
n e q = F ( D o D = 100 % ) · n D o D L ( D o D )
A common approach to L ( D o D ) is shown in (9) [80]. Its coefficients a 1 , a 2 , a 3 , a 4 , and a 5 can be estimated through of “total number of cycles versus DoD” curve, which is often presented in the battery datasheet. Notwithstanding, some manufacturers sometimes report only a few points on this curve instead of presenting their entire graph. Therefore, if the number of points reported is less than four, the coefficients a 4 and a 5 can be considered null, without major impact on the function effectiveness.
L ( D o D ) = a 1 + a 2 · e a 3 · D o D + a 4 · e a 5 · D o D
After performing these procedures, it is obtained the degradation of the nominal battery capacity ( B n o m n ) [56], represented in (10), where, B n o m n 1 is the storage capacity verified on the previous simulation day.
B n o m n = B n o m n 1 · 1 ξ c a l + n e q · ξ c y c
Therefore, it is interesting to note that these procedures described above essentially consist of an innovative set of expressions and good practices previously validated by the literature, which allows estimating battery degradation in a very convenient way. Moreover, it is pertinent to note that from these procedures, it becomes possible to estimate the battery lifetime straight through Equation (11).
L i f e t i m e = 1 E O L 100 % n = 1 N ξ c a l + n e q · ξ c y c
That way of calculating the lifetime was used in economic evaluations to estimate the time for replacing the battery, also making the economic analysis more realistic. These assessments will be further explained later.

4.3. Evaluation Metrics

The metrics most commonly used to assess the impacts caused by the installation of a PV+BESS on the electricity dynamics of a residential building are: self-consumption rate and degree of self-sufficiency, as presented in [37]. The former seeks to assess the amount of electricity produced by the PV system, which was used for exclusive purpose of the prosumer, i.e., meeting the residential load and charging the battery. In contrast, the latter seeks to describe the share of the residential demand that is supplied by the PV+BESS. The mathematical expressions used to calculate these metrics are given by (12) and (13), respectively, where N is the total number of days of the simulation.
Γ = n = 1 N t = 1 T P p l t , n + P p b t , n P p v t
φ = n = 1 N t = 1 T P p l t , n + P b l t , n P l o a d t , n
The economic evaluation is carried out to determine the return on investment considering different possibilities of business models. These models will be further explored to determine a better cost-benefit of the PV+BESS system. The analyses were performed considering the Net Present Value (NPV), payback, and the Internal Rate of Return (IRR), as in [81]. NPV is the most common way to analyze investment in a residential solar system, as it is a method used to observe the present value of the future cash flow, allowing to know the expected profit of the investment. Payback is defined as the period of time to recover the amount invested while the IRR is defined as the percentage of return on investment. Through this metric it is possible to establish a rate of attractiveness of the investment, in a very intuitive way, to determine the viability of the project.

5. Assessment of the Prosumer Energy Management System

In order to analyze the impacts of the proposed alternatives for the energy compensation system (see Section 3) and to evaluate the viability of the PV+BESS system in these scenarios, open data from Australia’s prosumers were used as a basis for this case study [82].

5.1. Case Characterization

A residential prosumer was chosen as the object of study, allowing a deeper analysis of the results to be carried out. As stated by [8], it is common practice to adapt data from load profiles to the context of the country to be analyzed. Thus, the data of the chosen residential prosumer were treated and manipulated in order to enable the study to be carried out in a manner consistent with the Brazilian reality. Based on the data presented in [33], the typical size of a small photovoltaic system is 7.5 kWp and percentage of simultaneity between consumption and generation is 38.92%. Table 2 shows the general PV power and investment characteristics of the prosumer.
Table 3 shows the base data used in the simulation for BESS. The weighting factor ( γ ) presented in Equation (3) is considered as in Table 4. Table 5 contains the amounts used for energy tariffs without tax. According to Equation (1), it is possible to calculate the real values, taking into account the value of the taxes, ICMS, Programa de Formação do Patrimônio do Servidor Público (PASEP) (in free translation Civil Servant’s Investment Program contributions), and COFINS. It is known that, PASEP is a tax equivalent to PIS especially applied in the state of Minas Gerais. In this case, the real values considered for these parameters were 30% for the ICMS, 0.86% for the PASEP, and 3.95% for the COFINS. Note that the last two are based on the value average calculated between June 2019 and June 2020 [84]. Table 6 defines computational parameters adopted in the simulation.

5.2. Study Case 1—Feasibility under the Current Brazilian Context

In this section, the PV+BESS results will be presented considering the model premises highlighted previously and the regulatory framework in force in Brazil. Two scenarios will be analyzed, considering the conventional tariff—alternative 0—and the white tariff. These results will serve as a comparative basis for further analysis to be carried out.

5.2.1. Conventional Tariff

Figure 6 shows the system’s energy profile and battery behavior on a clear day (left side) and a cloudy day (right side), considering the conventional flat tariff applied in Brazil. It is possible to observe that on a clear day, PV generation meets the demand, exports the surplus to the grid, and charges the battery. The BESS is used as soon as the PV generation decreases and no longer meets the load. The cloudy sky affects PV generation, so it does not have the same performance, changing the energy exchanges of the system. In this case, the battery complements PV generation in certain periods aiming at the priority of service to the load. The battery is not fully charged and discharged only once during the day, as previously.
This difference in behavior observed concerning the use of the battery confirms the pertinence of the proposed model for estimating its degradation, especially the method developed for the calculation of cyclic aging. If more straightforward approaches such as the one discussed in Section 2 were adopted, the estimated date for the replacement of the battery, as well as the technical and economic analyses, would be impaired.
Observing the sensitivity analysis depicted in Figure 7, it is possible to verify that from a technical point of view, there is an increase in self-consumption rate and self-sufficiency degree as the nominal capacity of the battery increases. More precisely, when comparing the case of only PV (worst case) with the case of PV+BESS considering the highest nominal capacity (best case), there is an increase of around 14% and 11%, in the self-consumption rate and in self-sufficiency degree, respectively.
In addition, it is possible to observe the inverse behavior of the economic metric on the figure. As the self-consumption rate and self-sufficiency degree increase, NPV decreases due to the high investment and reinvestment value of BESS. These reinvestments occur every five years, according to the results of Equation (11), totaling five replacements.
Table 7 presents the IRR and the payback metrics, in addition to the previous ones, considering a hurdle rate of 10%. The PV+BESS system is considered feasible until the 9.9 kWh nominal capacity of the battery, yet with a payback of almost 20 years for a project with a lifetime of approximately 25 years, being an unattractive investment. Even with a 6.6 kWh battery, the PV+BESS system is not attractive to investors looking for only financial returns, as it has a return of almost half of the estimated lifetime of the project.
With these results, it is possible to observe the need to analyze a whole set of economic metrics, since, in some cases, a profitable investment can become unattractive if it is associated with a long payback. However, depending on the purpose of the investment, through these analyses, it is possible to find a feasibility point. For example, in the second analysis, represented by the PV+BESS system (6.6 kWp), the investment has a reasonable financial return and an increase of approximately 8% and 6% in the self-consumption rate and self-sufficiency degree, respectively. It also presents additional gains in terms of quality and safety of connection.

5.2.2. White Tariff

Opposite to the conventional flat tariff, the white tariff is an optional (ToU) scheme for residential consumers with three price levels. Thus, this option creates differences in the behavior and energy exchange in the methodology, as can be seen in Figure 8. On a clear day (left side of Figure 8), there is a shift in the use of the battery to supply the load at the time when the tariff is more expensive (main difference from Figure 6, that considers conventional tariff), respecting the technical constraints of the battery, with the aim of minimizing the energy costs of the day. On the cloudy day (right side of Figure 8), a behavior similar to that of the conventional tariff is observed, since the PV generation cannot supply the demand and the priority is to meet the load, it is necessary to use the battery to complement the supply. Still, the battery is charged to meet, in the best possible way, the load in the most expensive period.
As in the previous subsection, a sensitivity analysis was performed as shown in Figure 9. One can observe that due to the high price of the battery, the project’s NPV decreases with the increase of the nominal capacity of the storage system, but the self-consumption rate and self-sufficiency degree grow similarly to that presented in the analysis of the conventional tariff.
Comparing to Figure 7 (conventional tariff case results), the great disparity is found in the economic metric, reaching values more than 20% lower. It is possible to note that in the case where the battery has a higher nominal capacity, the white tariff returns a better result than the conventional tariff, but it is still unfeasible. This makes the feasibility of the battery system dependent on some changes in regulatory and/or economic scenarios in the future to become a feasible alternative.
Through the Table 8, it is possible to analyze the set of economic metrics adopted to observe the feasibility of the projects. Comparing Table 8 (white tariff) with Table 7 (conventional tariff), one can observe a worsening of the NPV, IRR, and payback.
The disparity in economic results is mainly due to the fact that, although the white tariff is lower than the conventional tariff in most periods, the period of lowest price presented by the white tariff matches the period of greatest PV generation. That is, there is little/no need for the electrical network to inject energy into the residence. On the other hand, in the period with the highest value of the white tariff, there is a reduction in PV generation and even with the use of the battery, it only supplies the load in a short period, due to its technical limits.
The largest difference between white and conventional tariffs during the period reaches about 92.7%. In this period, where the price of the white tariff reaches its maximum, the storage system is not able to fully supply the residence. Therefore, the impact of the differences between the tariffs is noticeable in the feasibility results, making the white tariff a less attractive option.

5.3. Study Case 2—Regulatory Impact Assessment

In this subsection, the impacts caused by the regulatory alternatives proposed by ANEEL, explained in Section 3, will be analyzed. The six possible alternatives addressed by ANEEL, according to Table 1 and their respective results, are presented in this section. In addition to these changes, analyses were carried out considering the implementation period for each one of them between year 0, i.e., immediately, and year 5.
All analyses were performed considering the conventional tariff, as it is the most used tariff model in the country and the nominal capacity of the BESS considered is 6.6 kWh.
Figure 10, Figure 11 and Figure 12 show a comparison of the implementation of all alternatives in the chosen time period without and with battery. In addition, the red dashed line represents the alternative 0, i.e., the base case.
According to the analysis, it is possible to observe that the longer it takes to implement the new regulation, the better the results presented by the economic metrics. Based on NPV and IRR, it is possible to have a good view regarding the return on investment. Analyzing the results for the PV system, in the same way as Figure 10, Figure 11 exposes all the less viable alternatives than the base case (alternative 0), but it is possible to notice that, in all alternatives, the IRR is higher than the hurdle rate, complementing the NPV analysis. Thus, it is possible to conclude that: (i) all scenarios analyzed in this context are economically viable; (ii) the difference in viability between the base case (alternative 0) and all alternatives decreases over time.
The economic metrics analyzed from Figure 12 and Figure 13 show the same conclusions regarding the feasibility of the PV+BESS system. In almost all alternatives (besides the base case—alternative 0), the system is economically unfeasible because it has negative NPV and IRR below the hurdle rate.
Another issue that can be concluded from the graphic analysis is the impact of the regulatory change that is more significant for the PV+BESS system than for the PV system. Based on the results, it is possible to observe a great need for business models that increase the attractiveness of investments, mainly with the possibility of implementing a new model for the energy compensation system.

5.4. Study Case 3—Business Models

In this section, three business models are analyzed in order to investigate their impacts on the viability of PV+BESS systems. As concluded in the analysis of regulatory impacts, actions in favor of the viability of the projects will be necessary. Therefore, the business models considered are:
  • Business model 1: Government subsidy on battery price. The purpose of this analysis is to observe the impact of the battery price on the feasibility of the project, considering alternative 0 with a conventional tariff as a basis.
  • Business model 2: Financing of the storage system. Following a line already widely adopted in Brazil for PV generation, the objective of this model is to vary the interest rate and analyze the impact on the project’s viability.
  • Business model 3: Discount for battery replacement. In this case, the objective is to analyze discount rates to be applied to the battery price at the time of its replacement, observing its impact on the investment viability.

5.4.1. Business Model 1

To perform this analysis, the variation of the battery price between BR$ 5000.00/kWh and BR$ 250.00/kWh is considered. With a tax burden reaching 80% of the investment value of the BESS, as mentioned in Section 1, the chosen price variation aims to cover a set of prices that could be considered for the battery by reducing the taxes levied on it.
In Figure 14, it is possible to observe the impact of the battery price on the return on investment. Analyzing the graph, the maximum value to obtain a considerable payback is BR$1500/kWh. This payback period, around 6 years, would be attractive for most residential investors as the investment would have a return in about 1/4 of the system’s lifetime.
Therefore, according to this analysis, encouraging the reduction of taxes on the BESS, a point that makes the project feasible is obtained. However, it should be noted that the value of the battery needs to drop a lot until it can be considered a feasible solution, i.e., to reach the feasibility point.

5.4.2. Business Model 2

With the premise of analyzing financial interest rates and their impact on the project’s viability, several lines of financing were analyzed with interest rate variation between 1% and 10%.
With Figure 15, it is possible to observe that at a very low financing rate, 1% per year, the investment still has a long return, just over 10 years. However, compared to the BESS base case, whose NPV returned BR$ 57,224.44 and had a payback of 12 years and 7 months, it is possible to observe a considerable improvement in results. In this way, it is possible to conclude that the financing in addition to improving the return on investment, can also be a good option, as it allows the investor to avoid the high initial cost of the investment.

5.4.3. Business Model 3

The third model analyzed, as already highlighted, aims to encourage the use of BESS by providing a discount on the price of the battery at the time of its replacement. In the analysis, the discount rate varies between 10% and 60%, in order to analyze how this business model influences the viability of the PV+BESS system.
Compared to the other business models analyzed, this business model achieved the least improvement in the project’s payback, as can be seen in the Figure 16. The best case, that is, the case with the highest discount practiced in the battery price, has a return in more than 10 years due to the high initial investment that a BESS system requires. Still, it has a payback of approximately 2 years less than the BESS base case.
Thus, according to the results presented in the simulations, it is possible to conclude that the price of the battery needs to be considerably reduced so that the investment in a residential PV+BESS system becomes attractive, as can be concluded from the results of the business model 1.
The last two business models (business models 2 and 3) had a payback of around 10 years, in their best cases, thus reducing the payback in relation to the base scenario by approximately 2 years. Even so, these business models are not very attractive for investors used to paybacks of about 4 and 5 years in residential PV-only systems.

6. Conclusions

In this work, a linear optimization model was proposed to simulate the daily energy operation of a residence. This model minimizes the energy costs associated with HEMS, considering the cost of energy, different regulatory scenarios, criteria for coordinating energy flows, and technical restrictions on generation PV and BESS. The consideration of the technical restrictions of the battery through a continuous approach and the proposed method for estimating the degradation of BESS is highlighted as one of the main contributions of the present work.
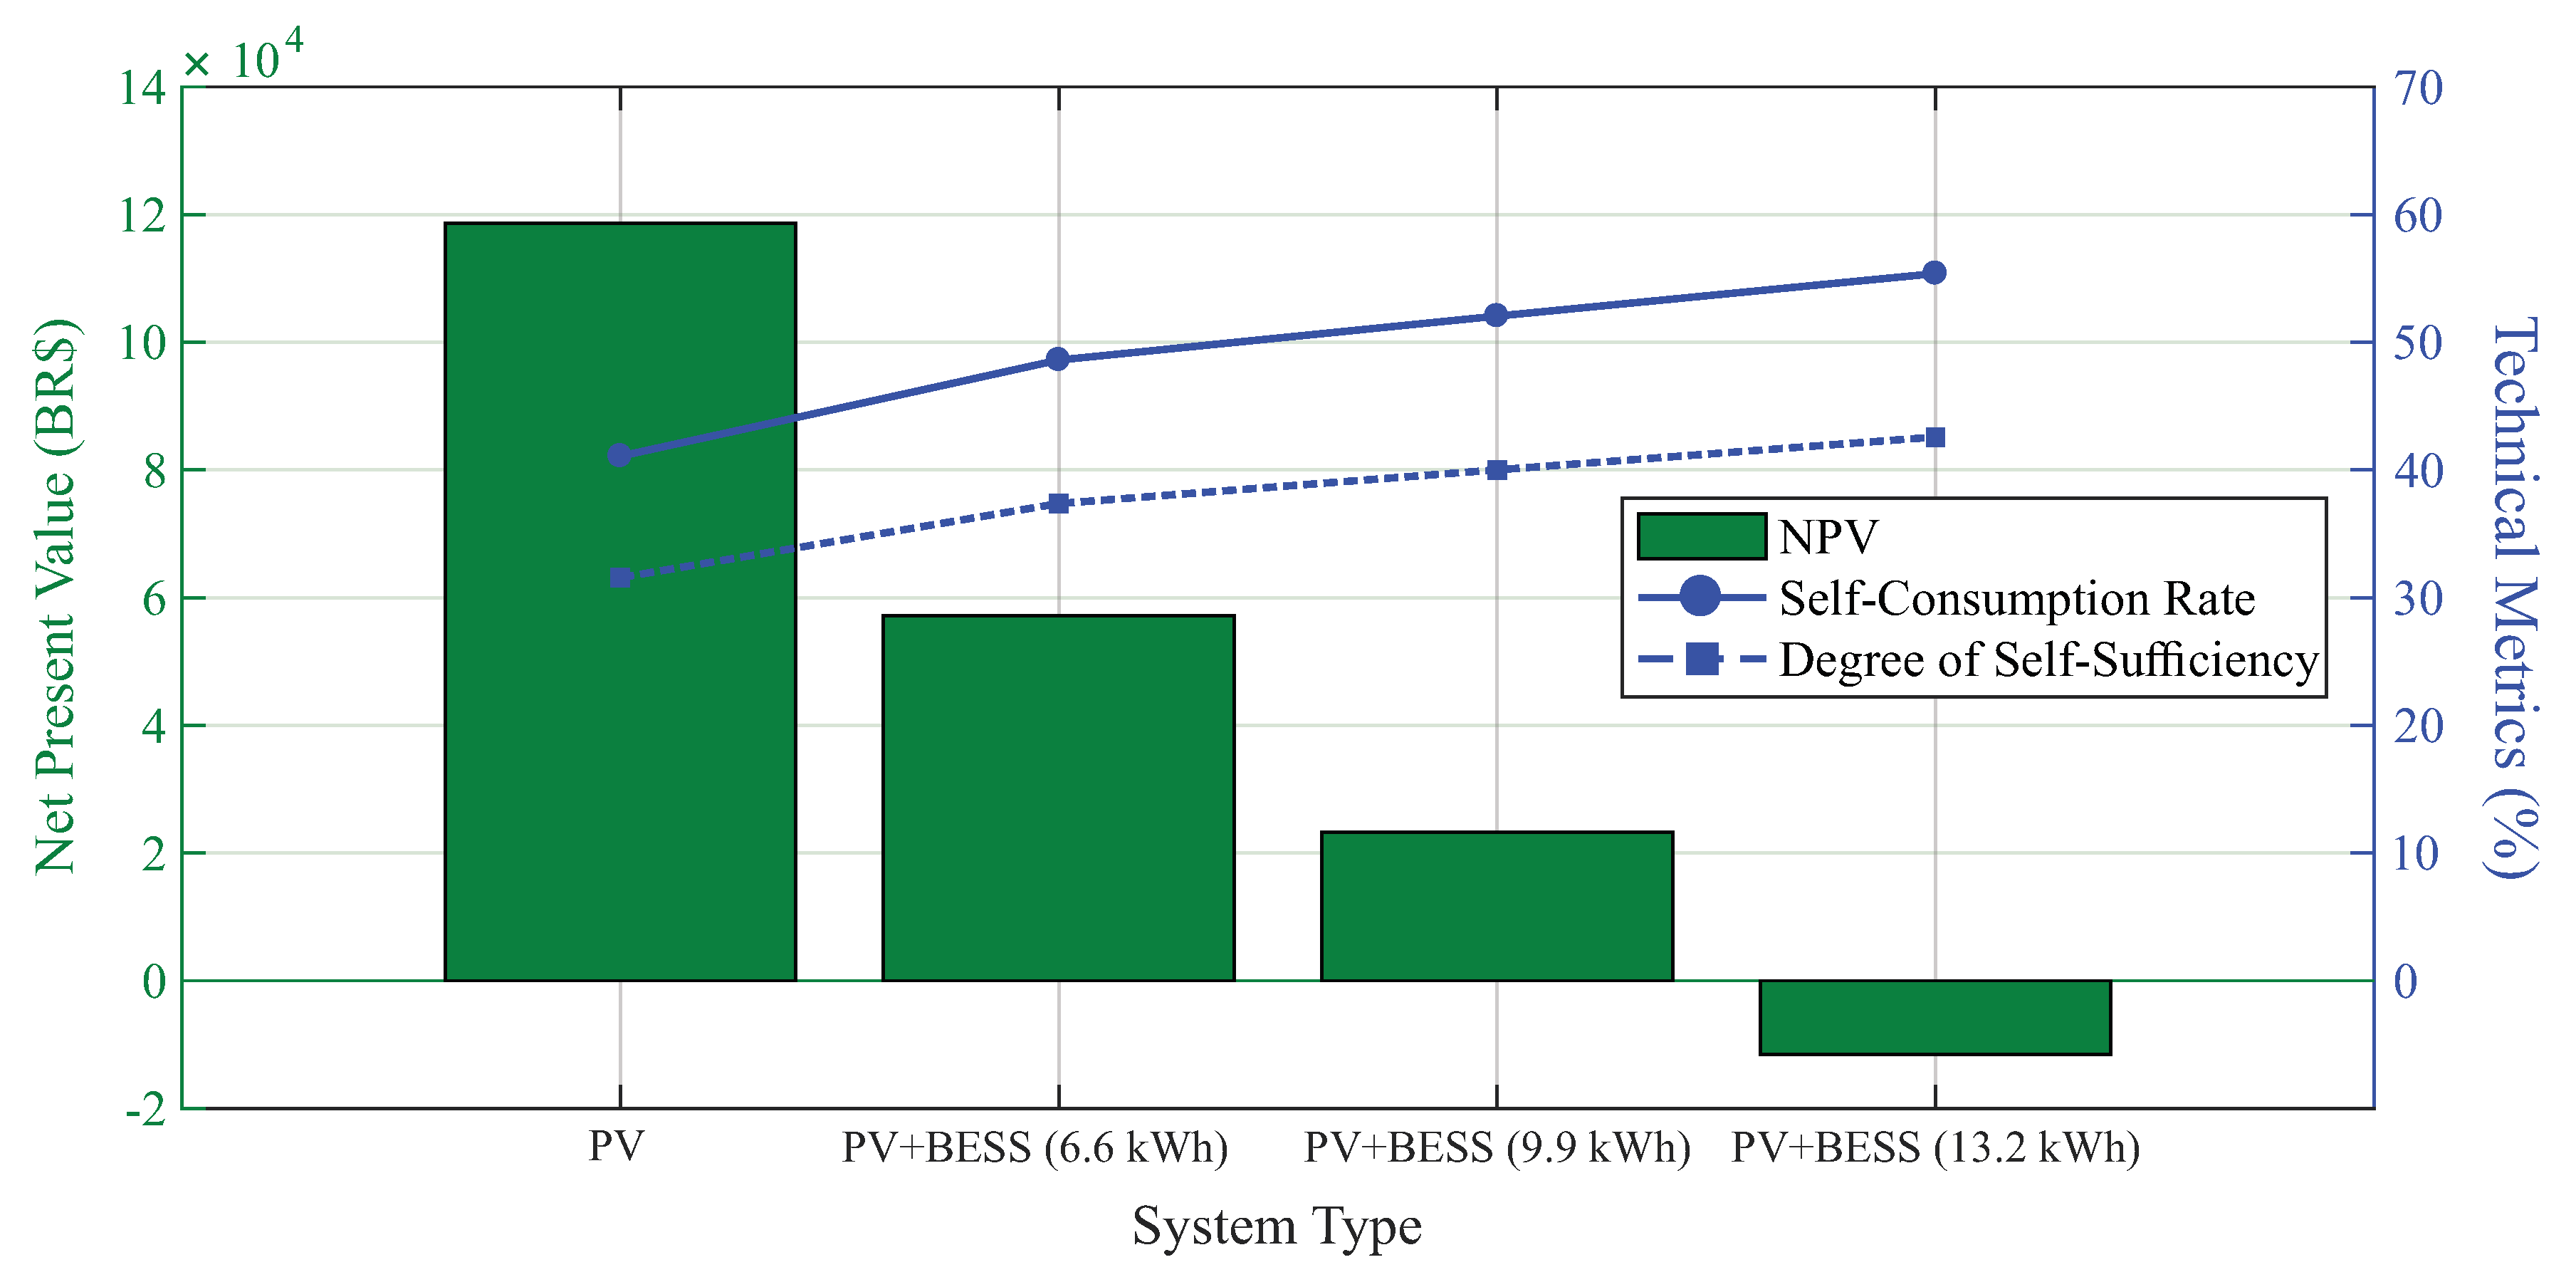
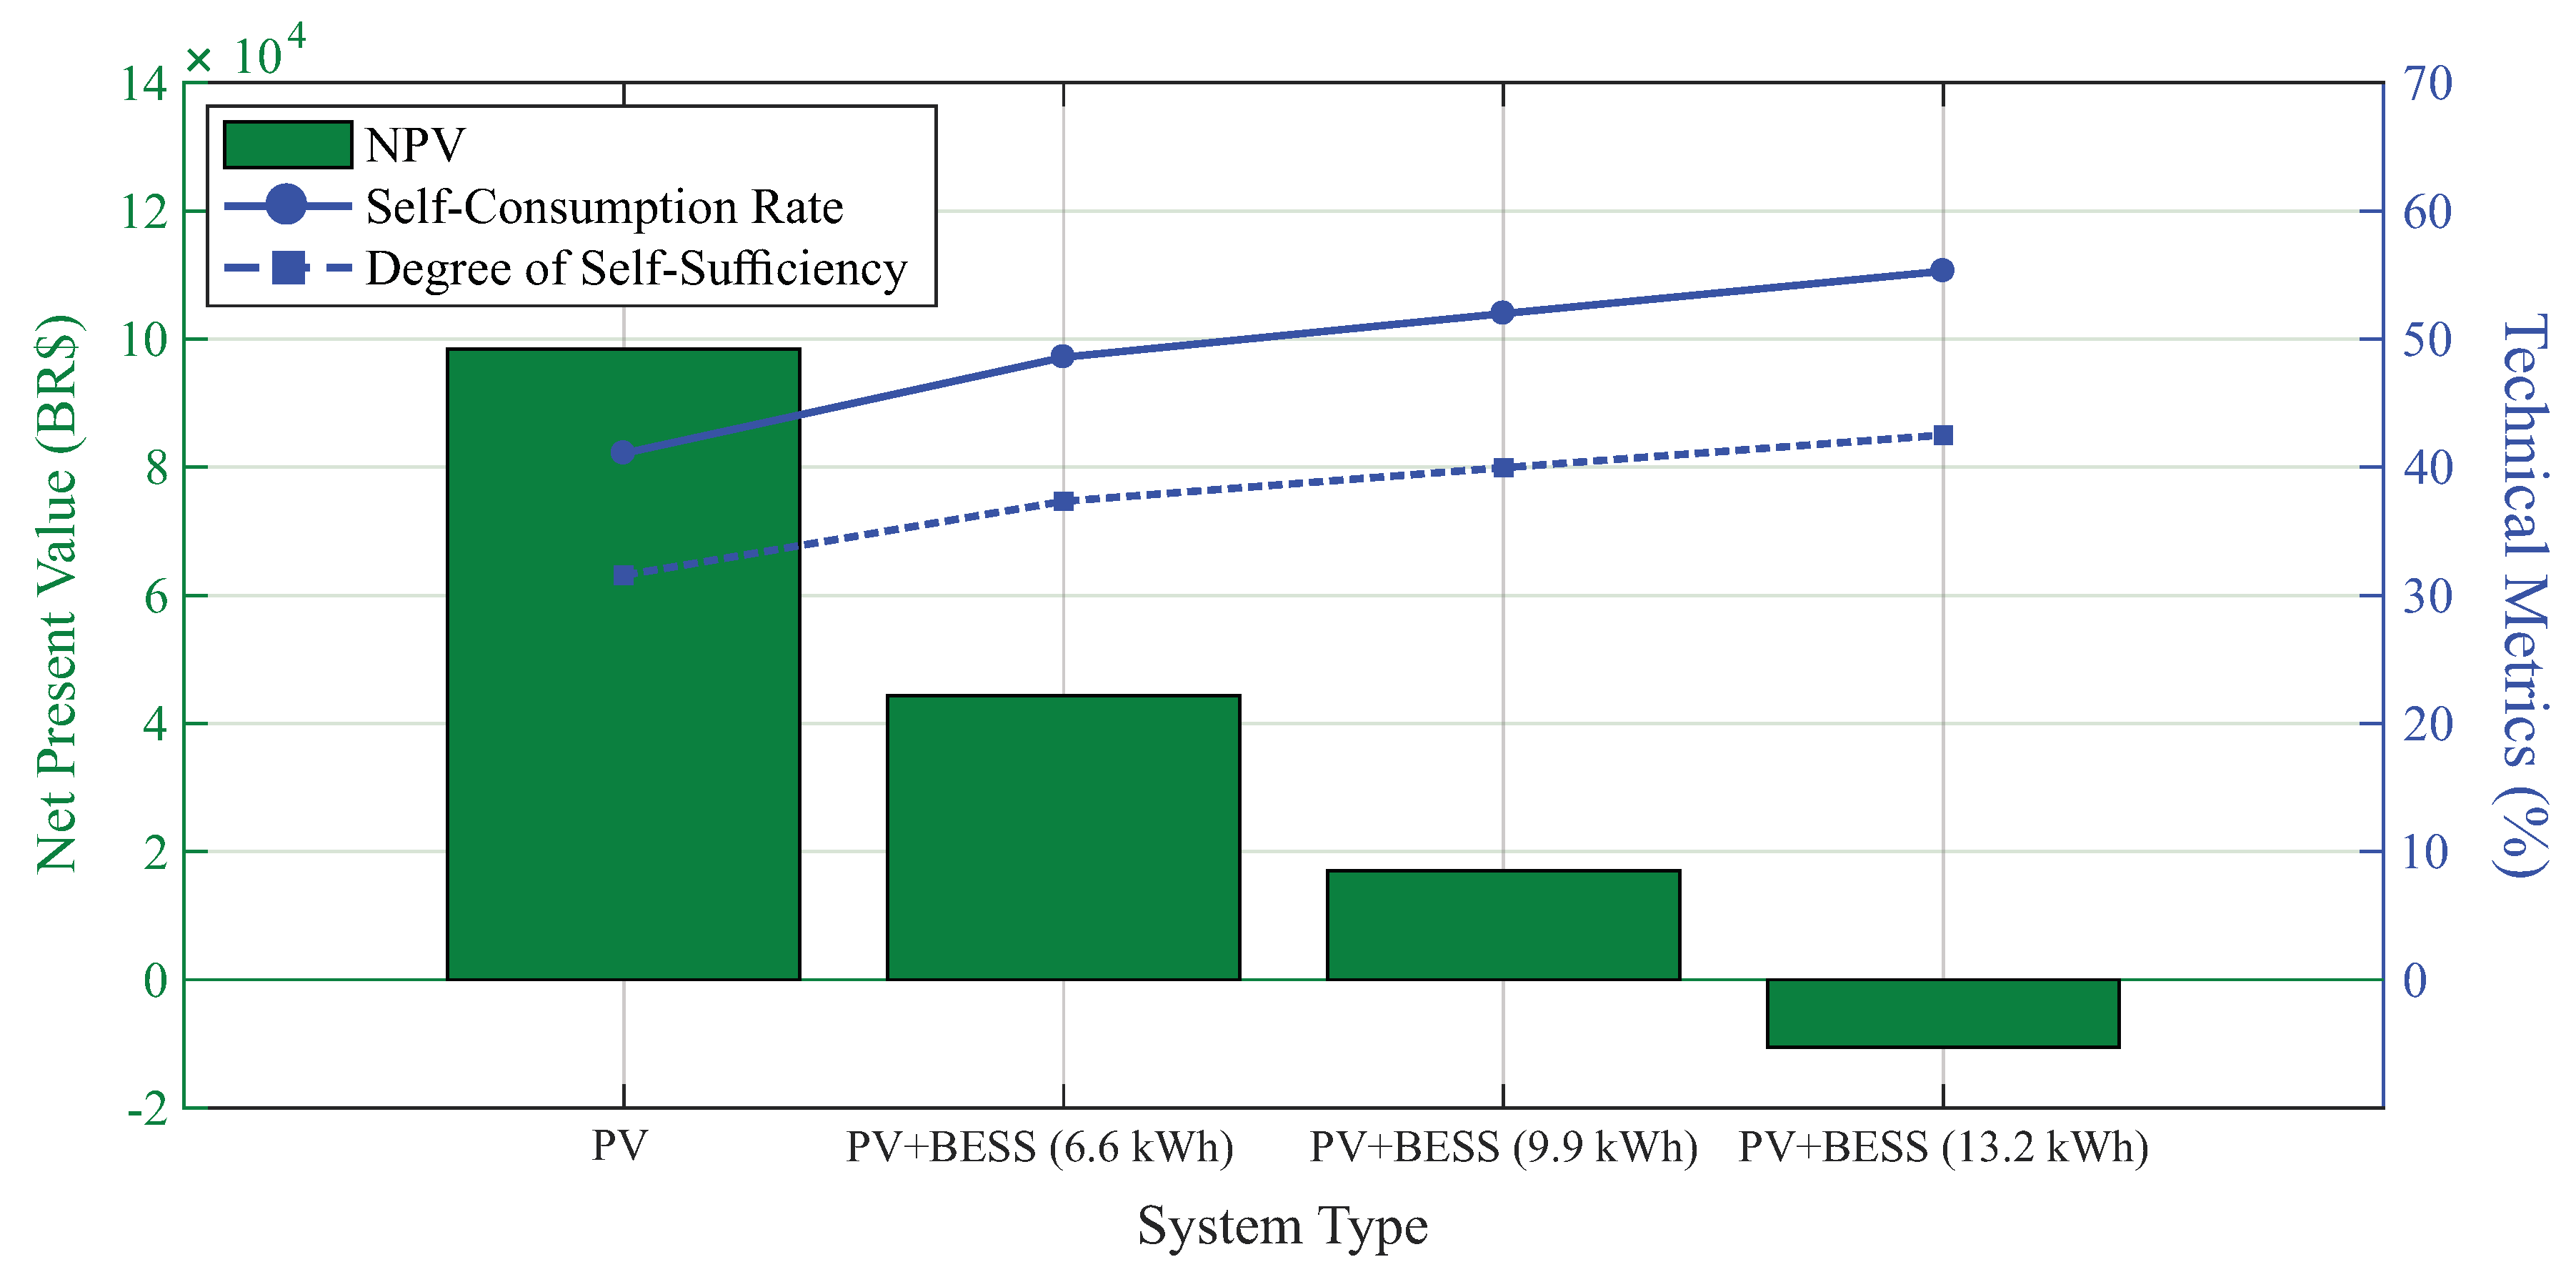
In the first study case conducted, the feasibility of the PV system with and without BESS was analyzed considering the current Brazilian regulatory scenarios and two different tariff schemes. From the results obtained it was possible to observe: (i) technical metrics did not show any difference regardless of the tariff system; (ii) the insertion of the battery into the system increase, approximately, between 8 and 14% the self-consumption rate and, approximately, between 6 and 11% the degree of self-sufficiency. Comparing the financial metrics, there is a better economic performance of the system PV+BESS considering the conventional tariff (flat) than the white tariff (ToU), in the first two cases of this analysis, resulting in a difference of approximately 29% and 36% in the NPV, respectively. However, in the scenario in which the BESS has greater capacity, the white tariff presents a result, even if not viable, slightly better than the conventional tariff.
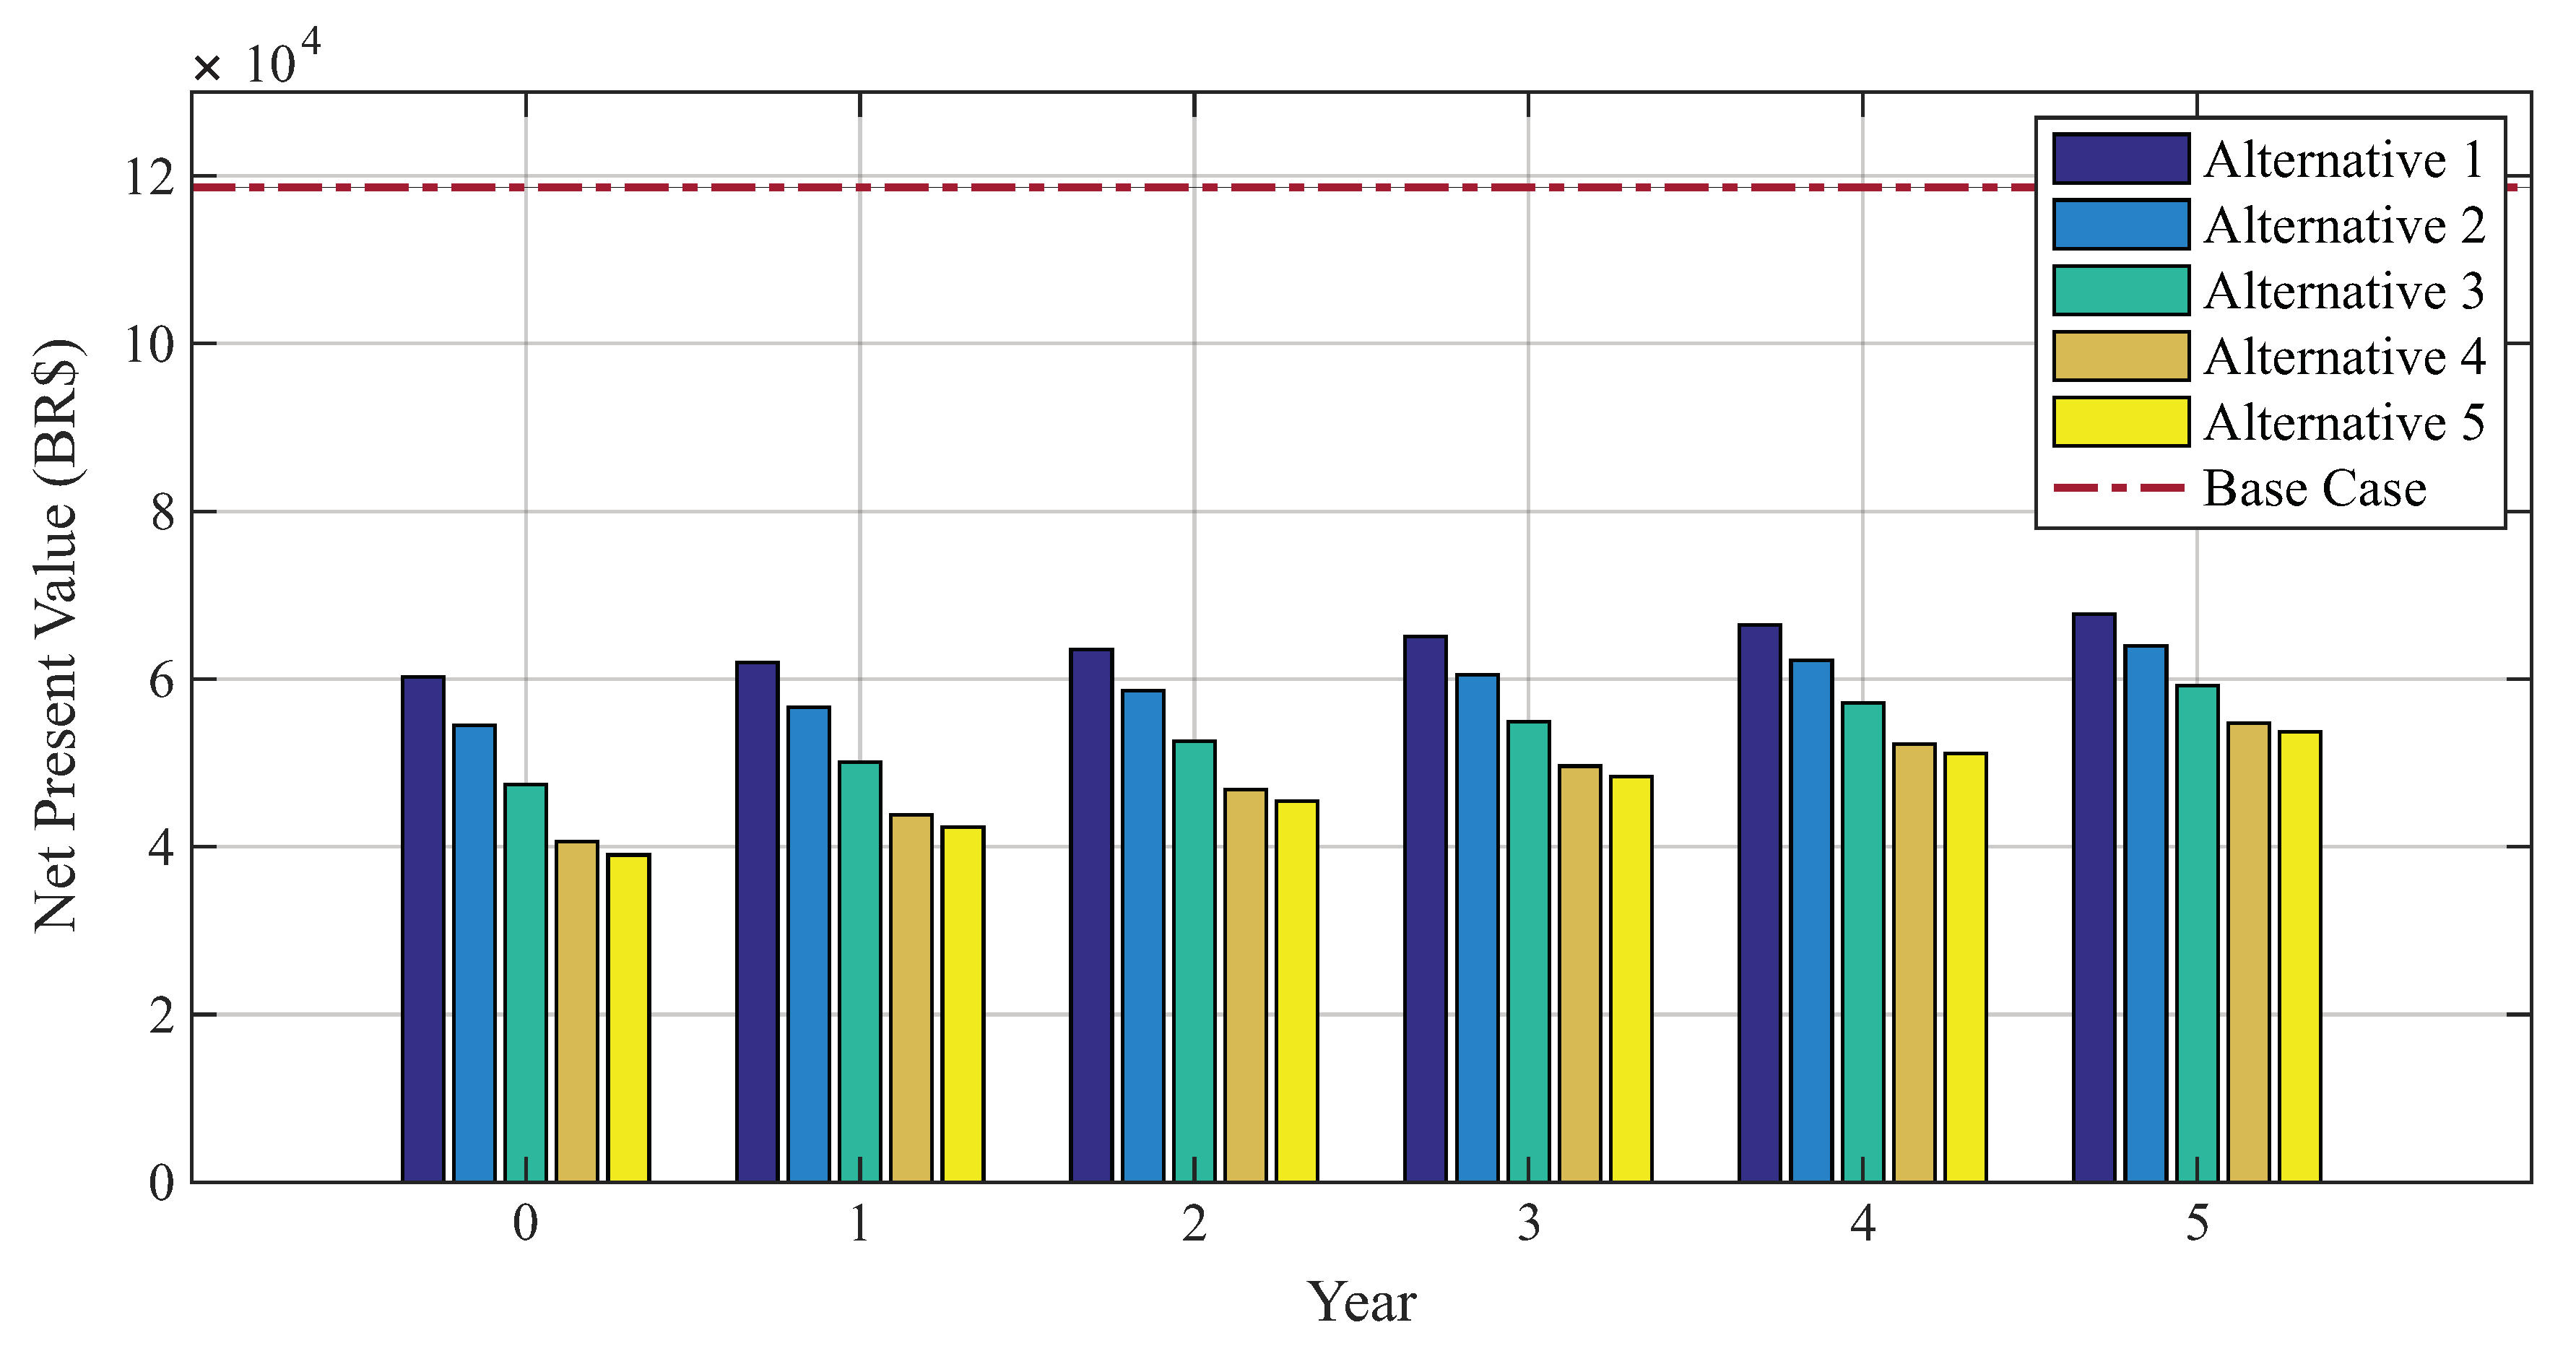
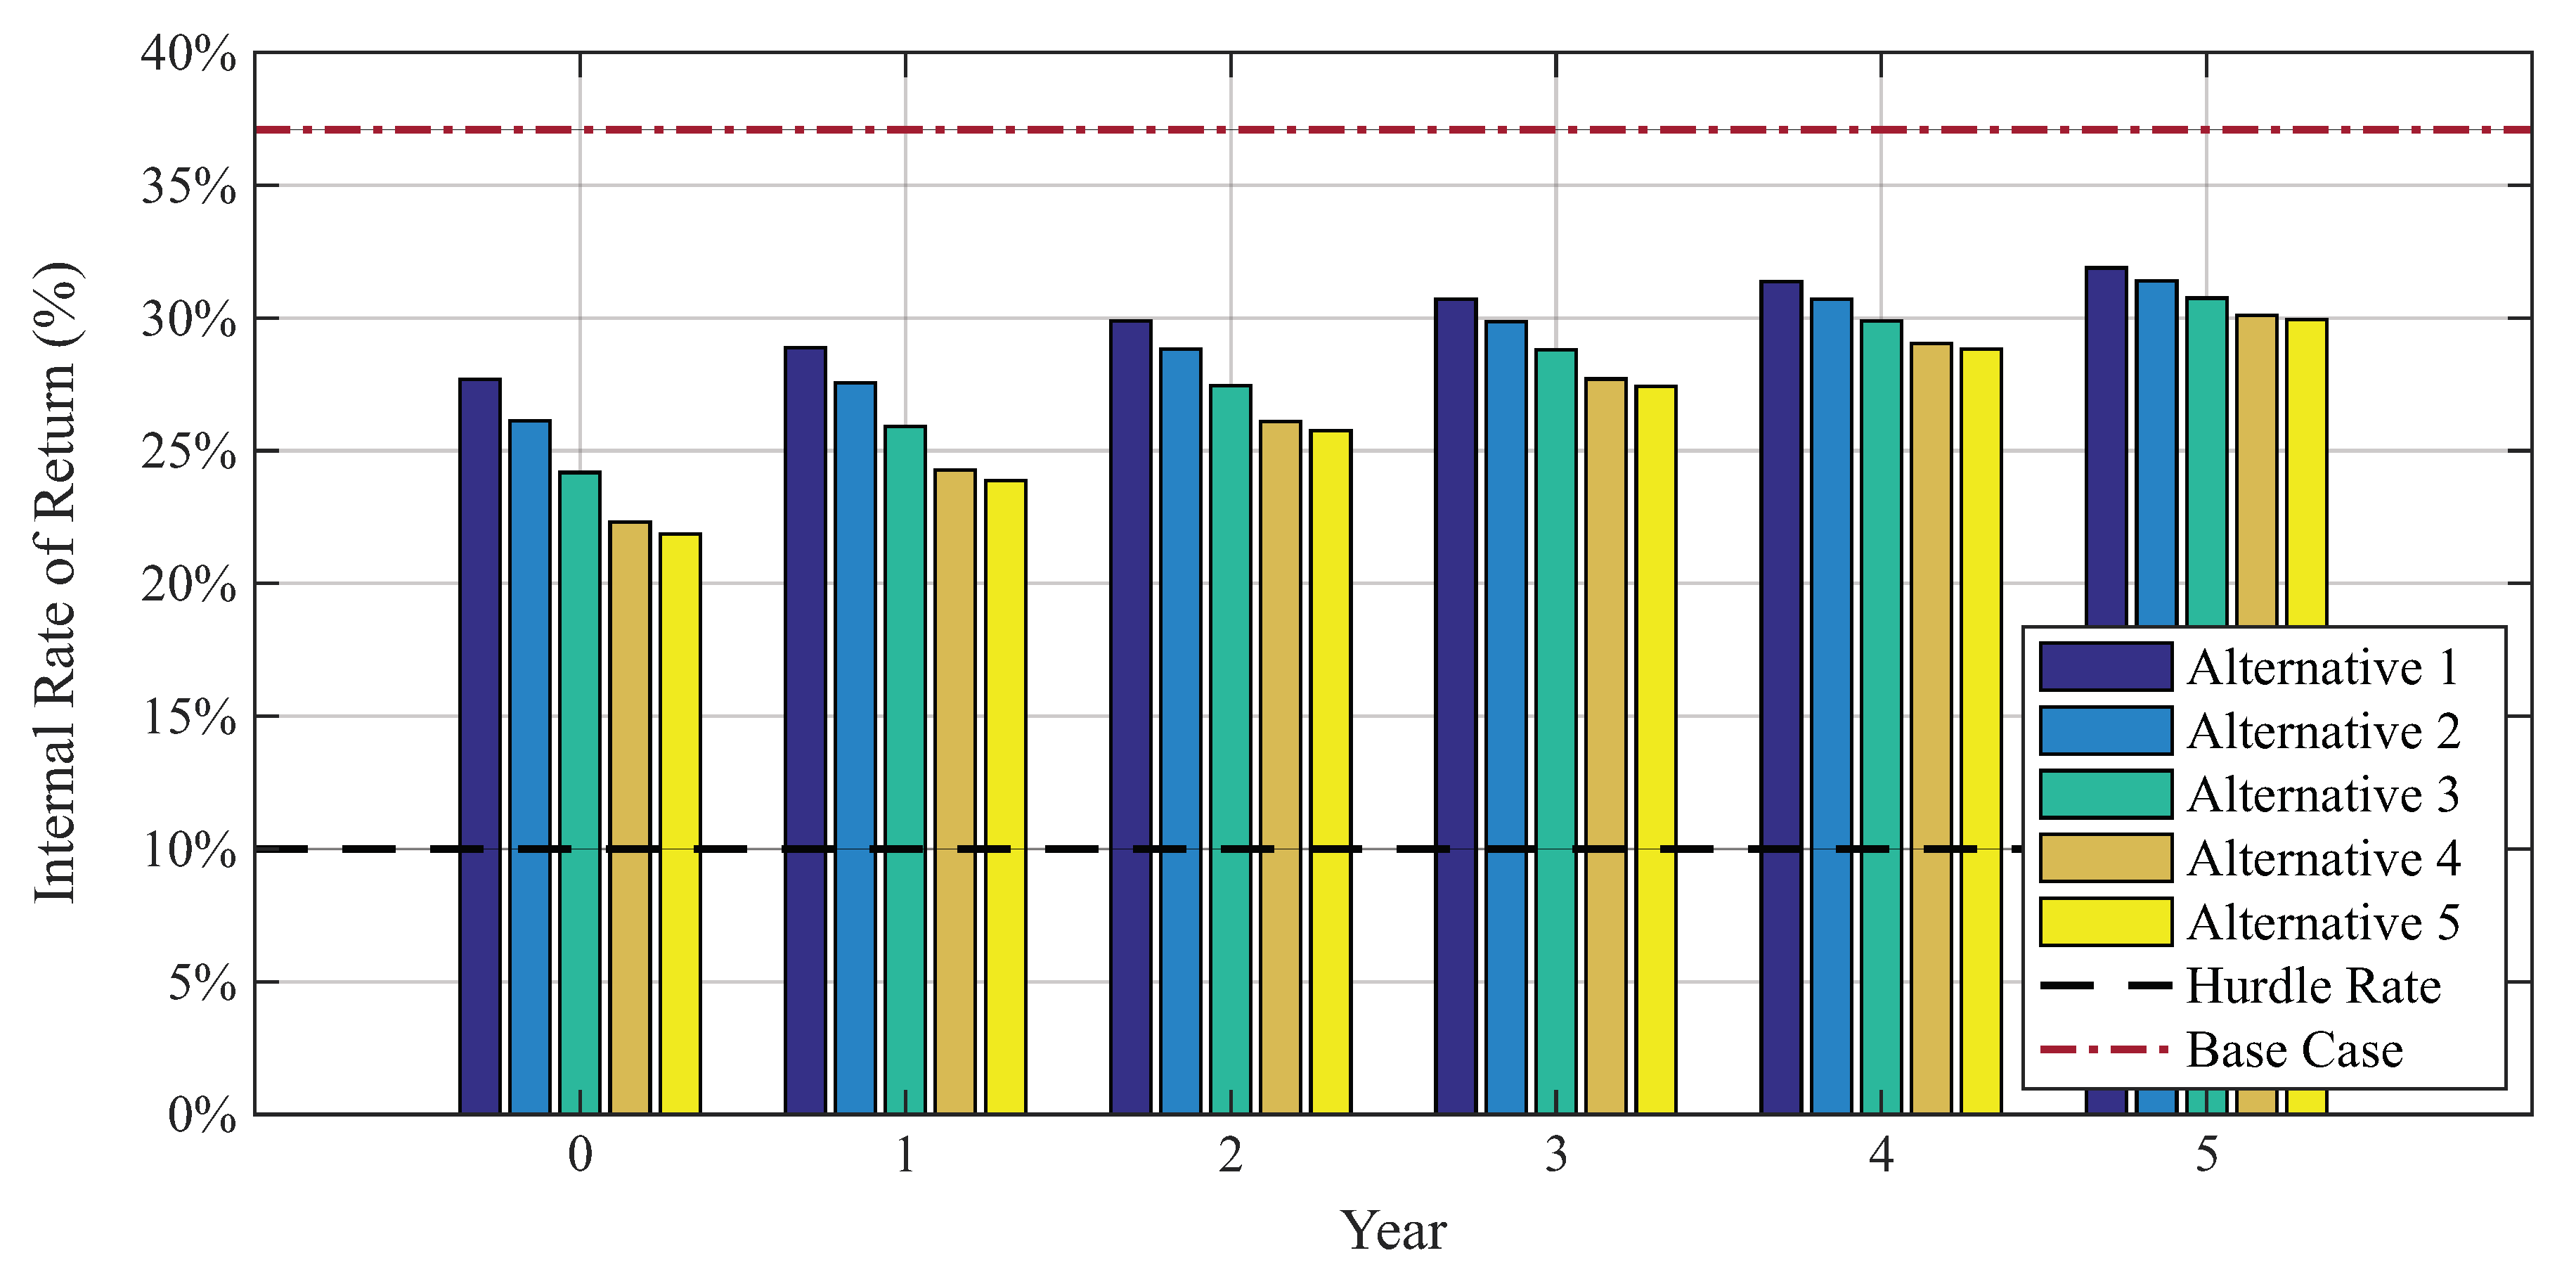
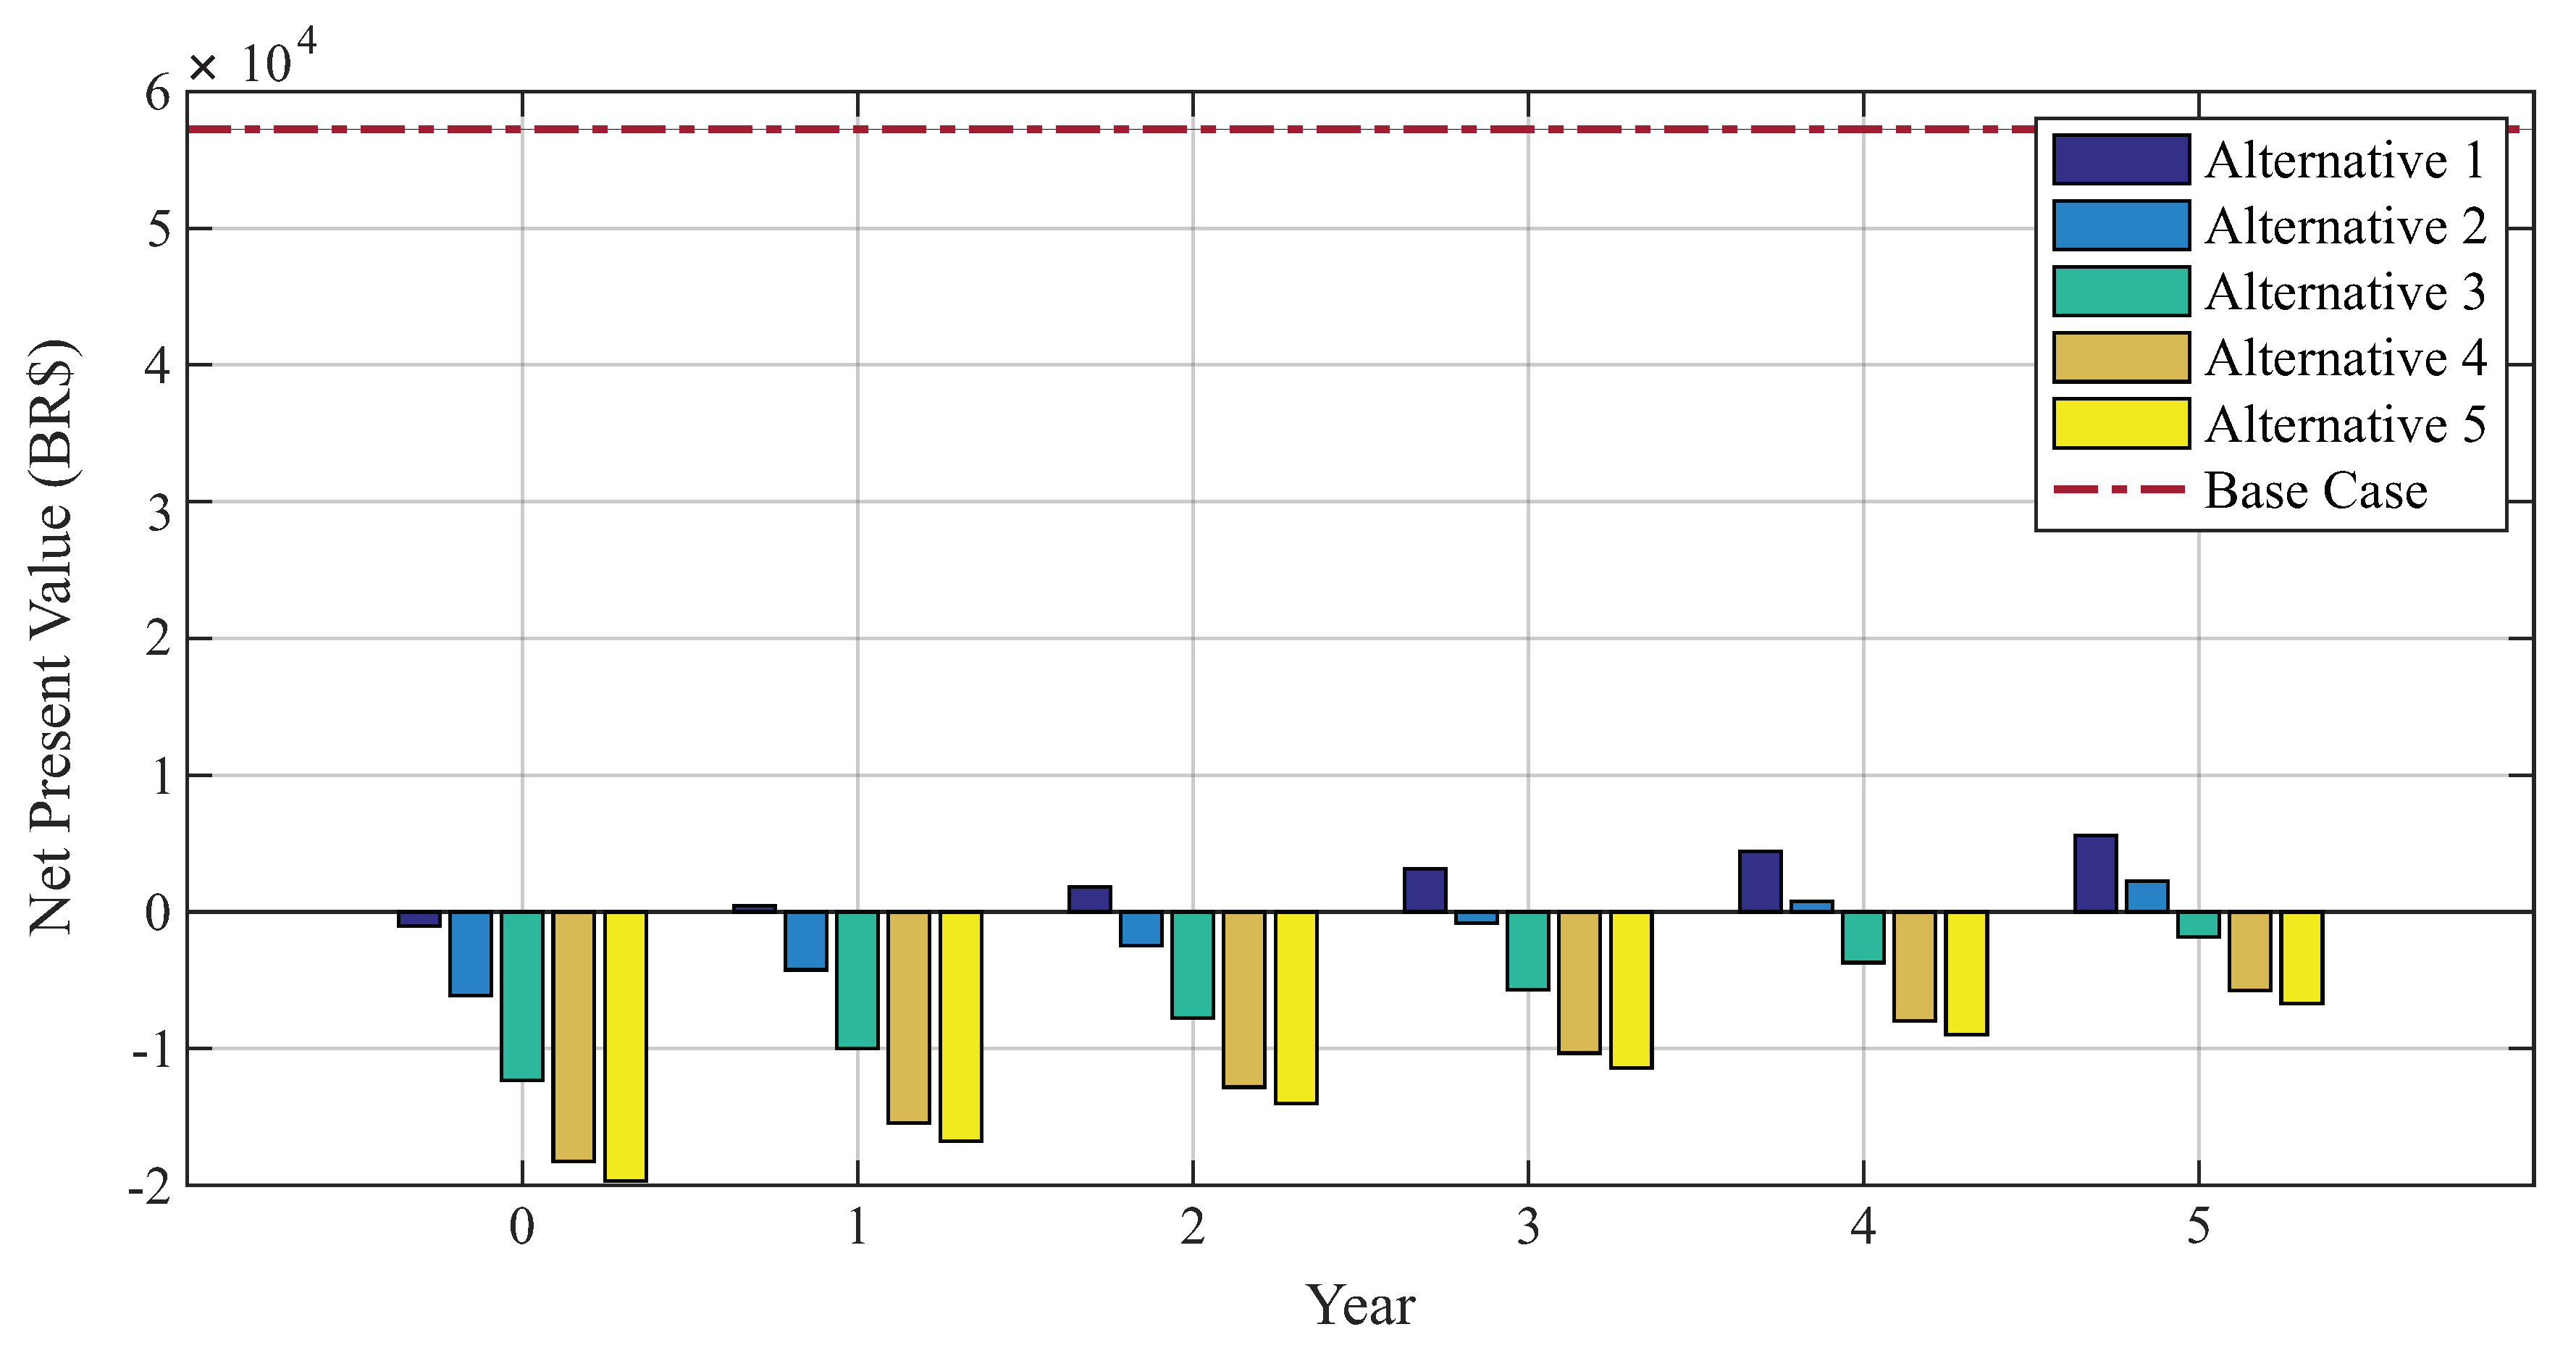
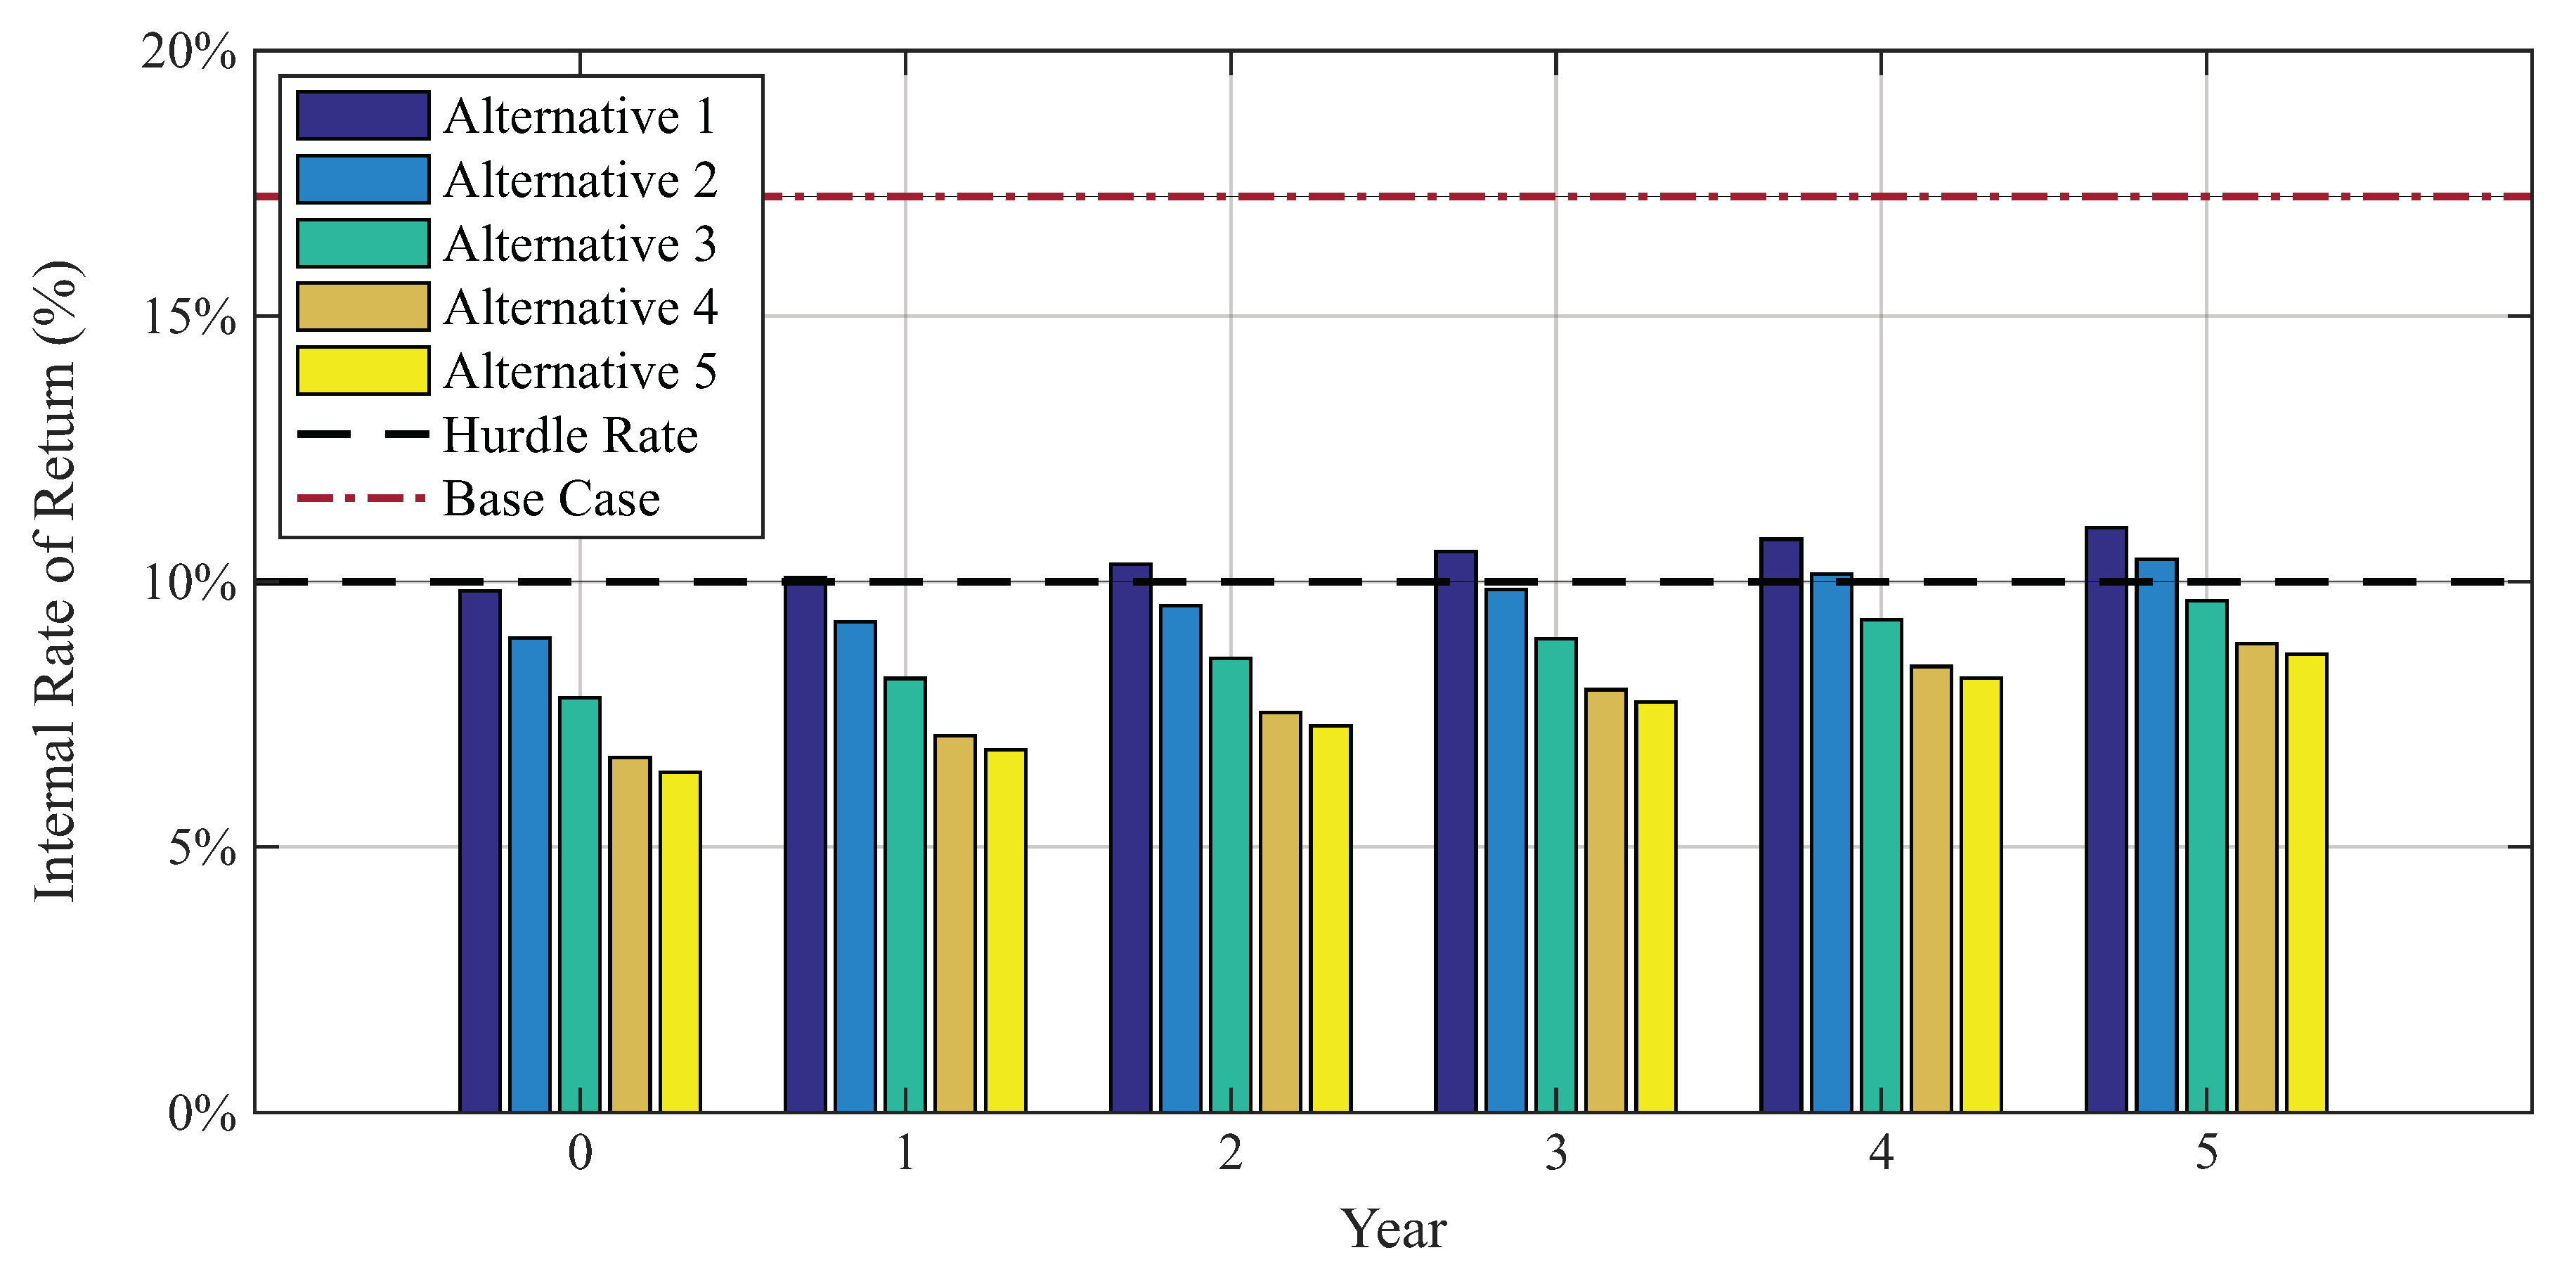
In turn, in the second study case conducted, the impacts of the different regulatory scenarios proposed by ANEEL for the future of DG in Brazil were analyzed. From the results found, it was possible to determine that the longer the current scenario is maintained, the better the performance of the projects. Due to the high investment value of BESS, NPV returned negative for practically all regulatory scenarios analyzed, with the exception of alternative 1, starting in the second year, and alternative 2, starting in the fourth year of analysis.
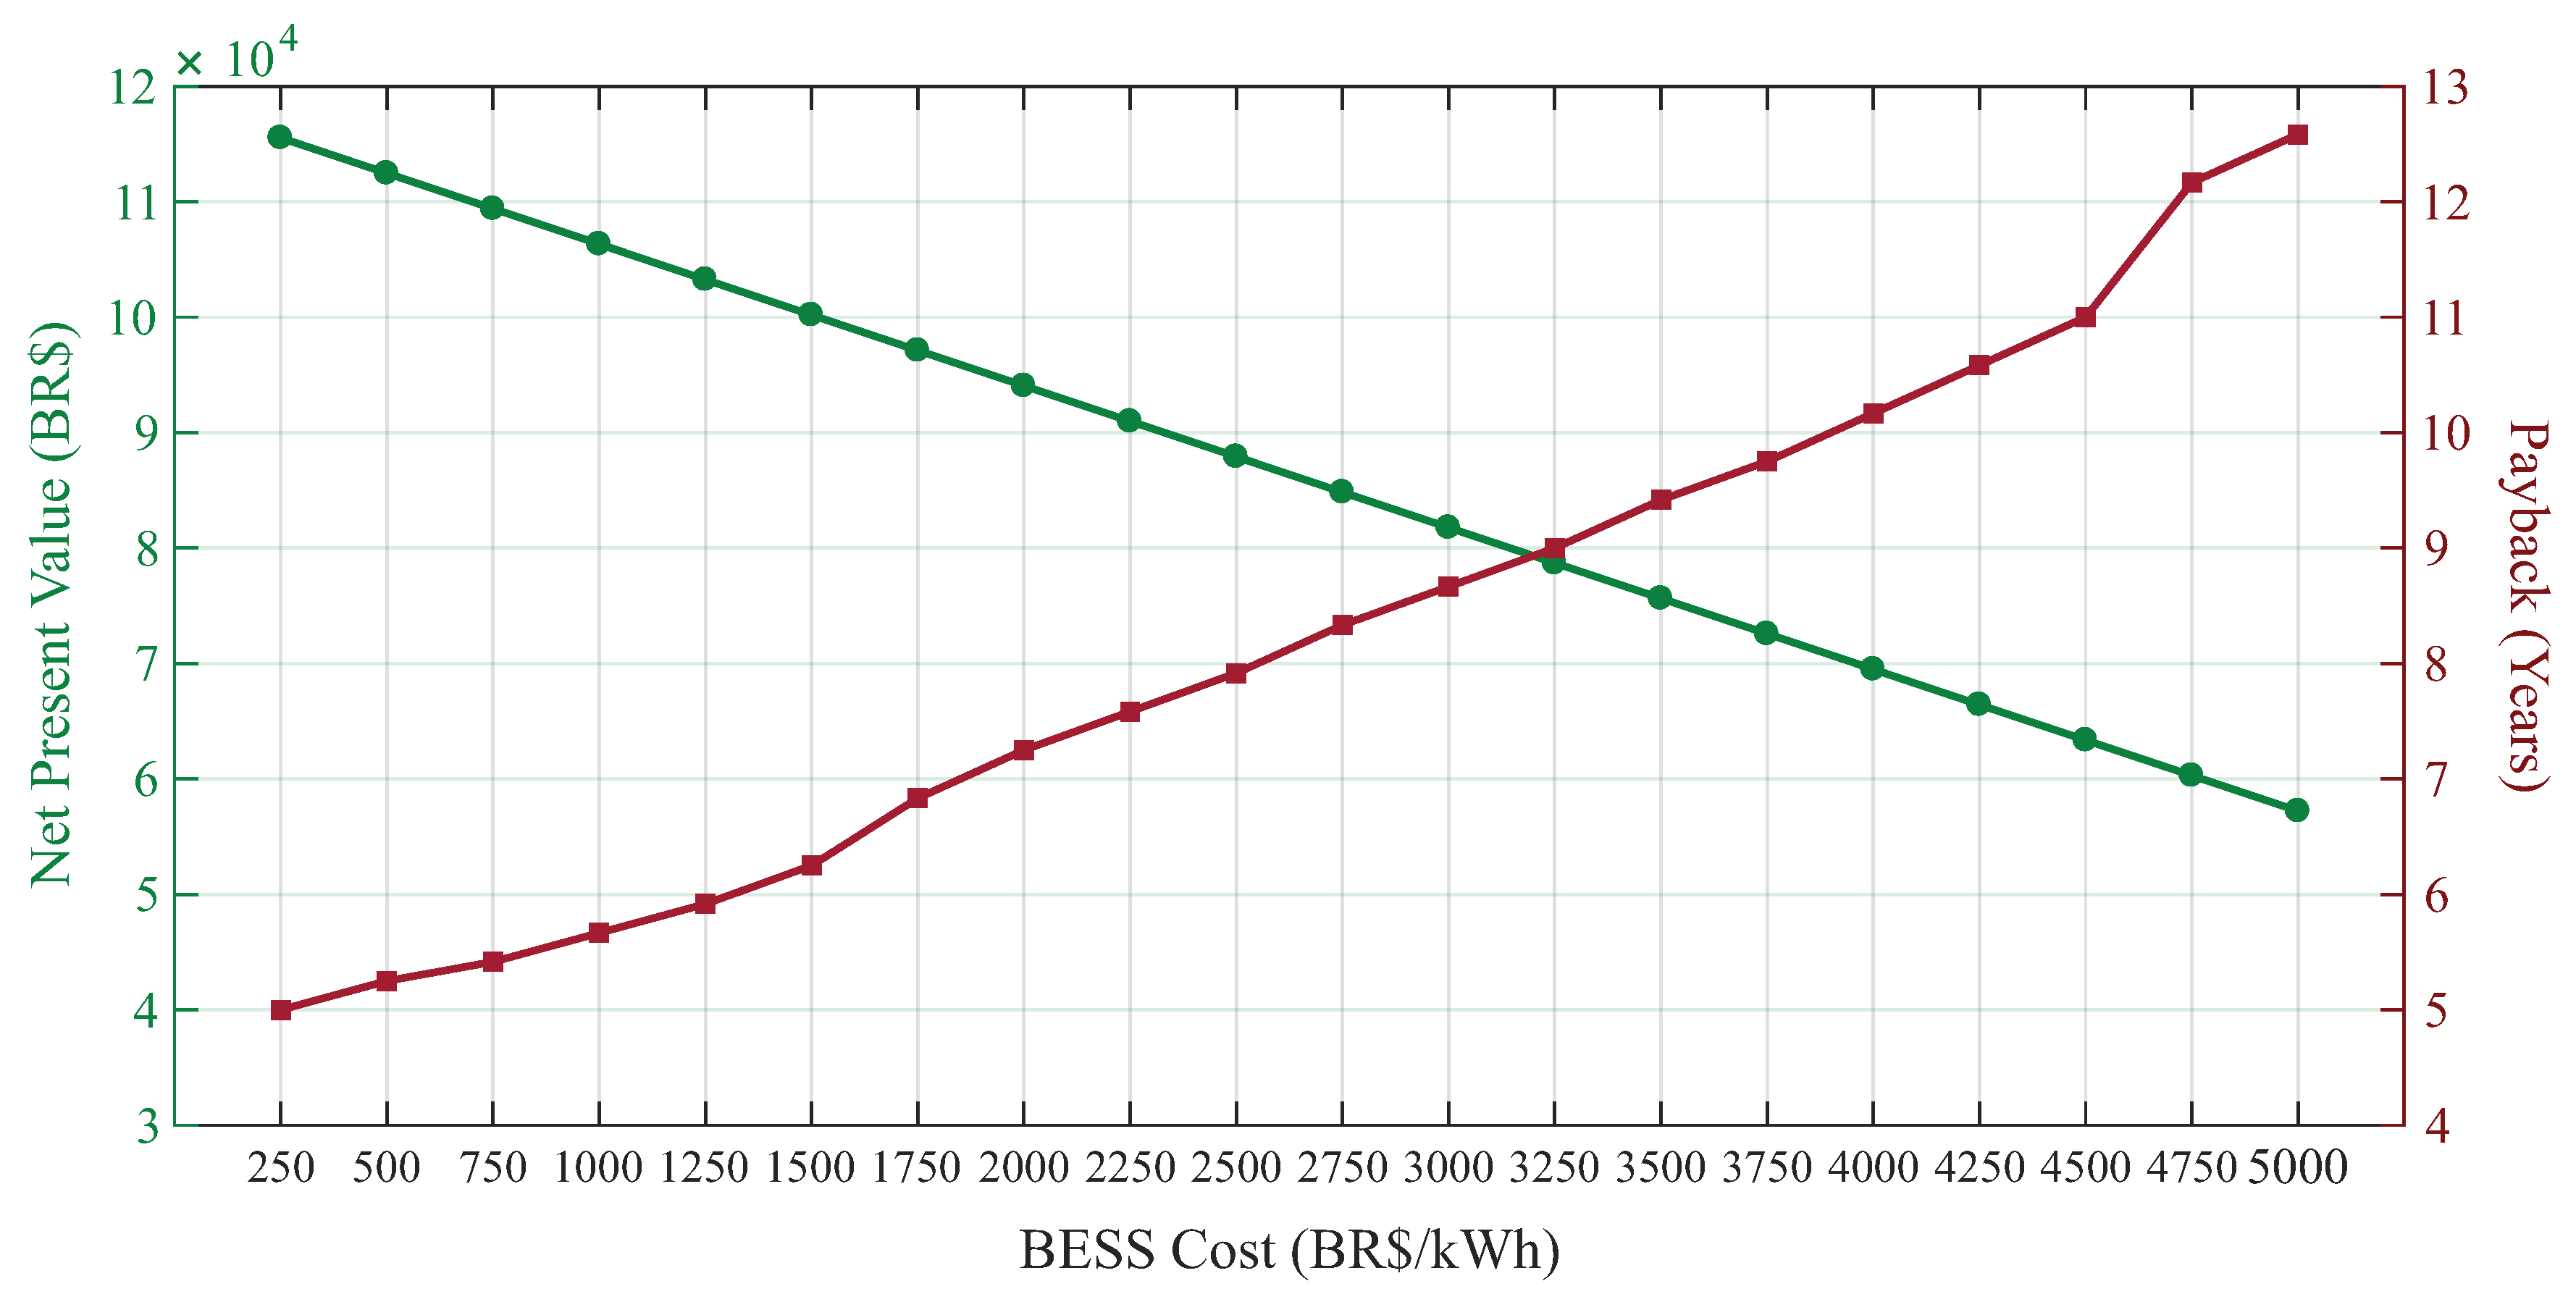
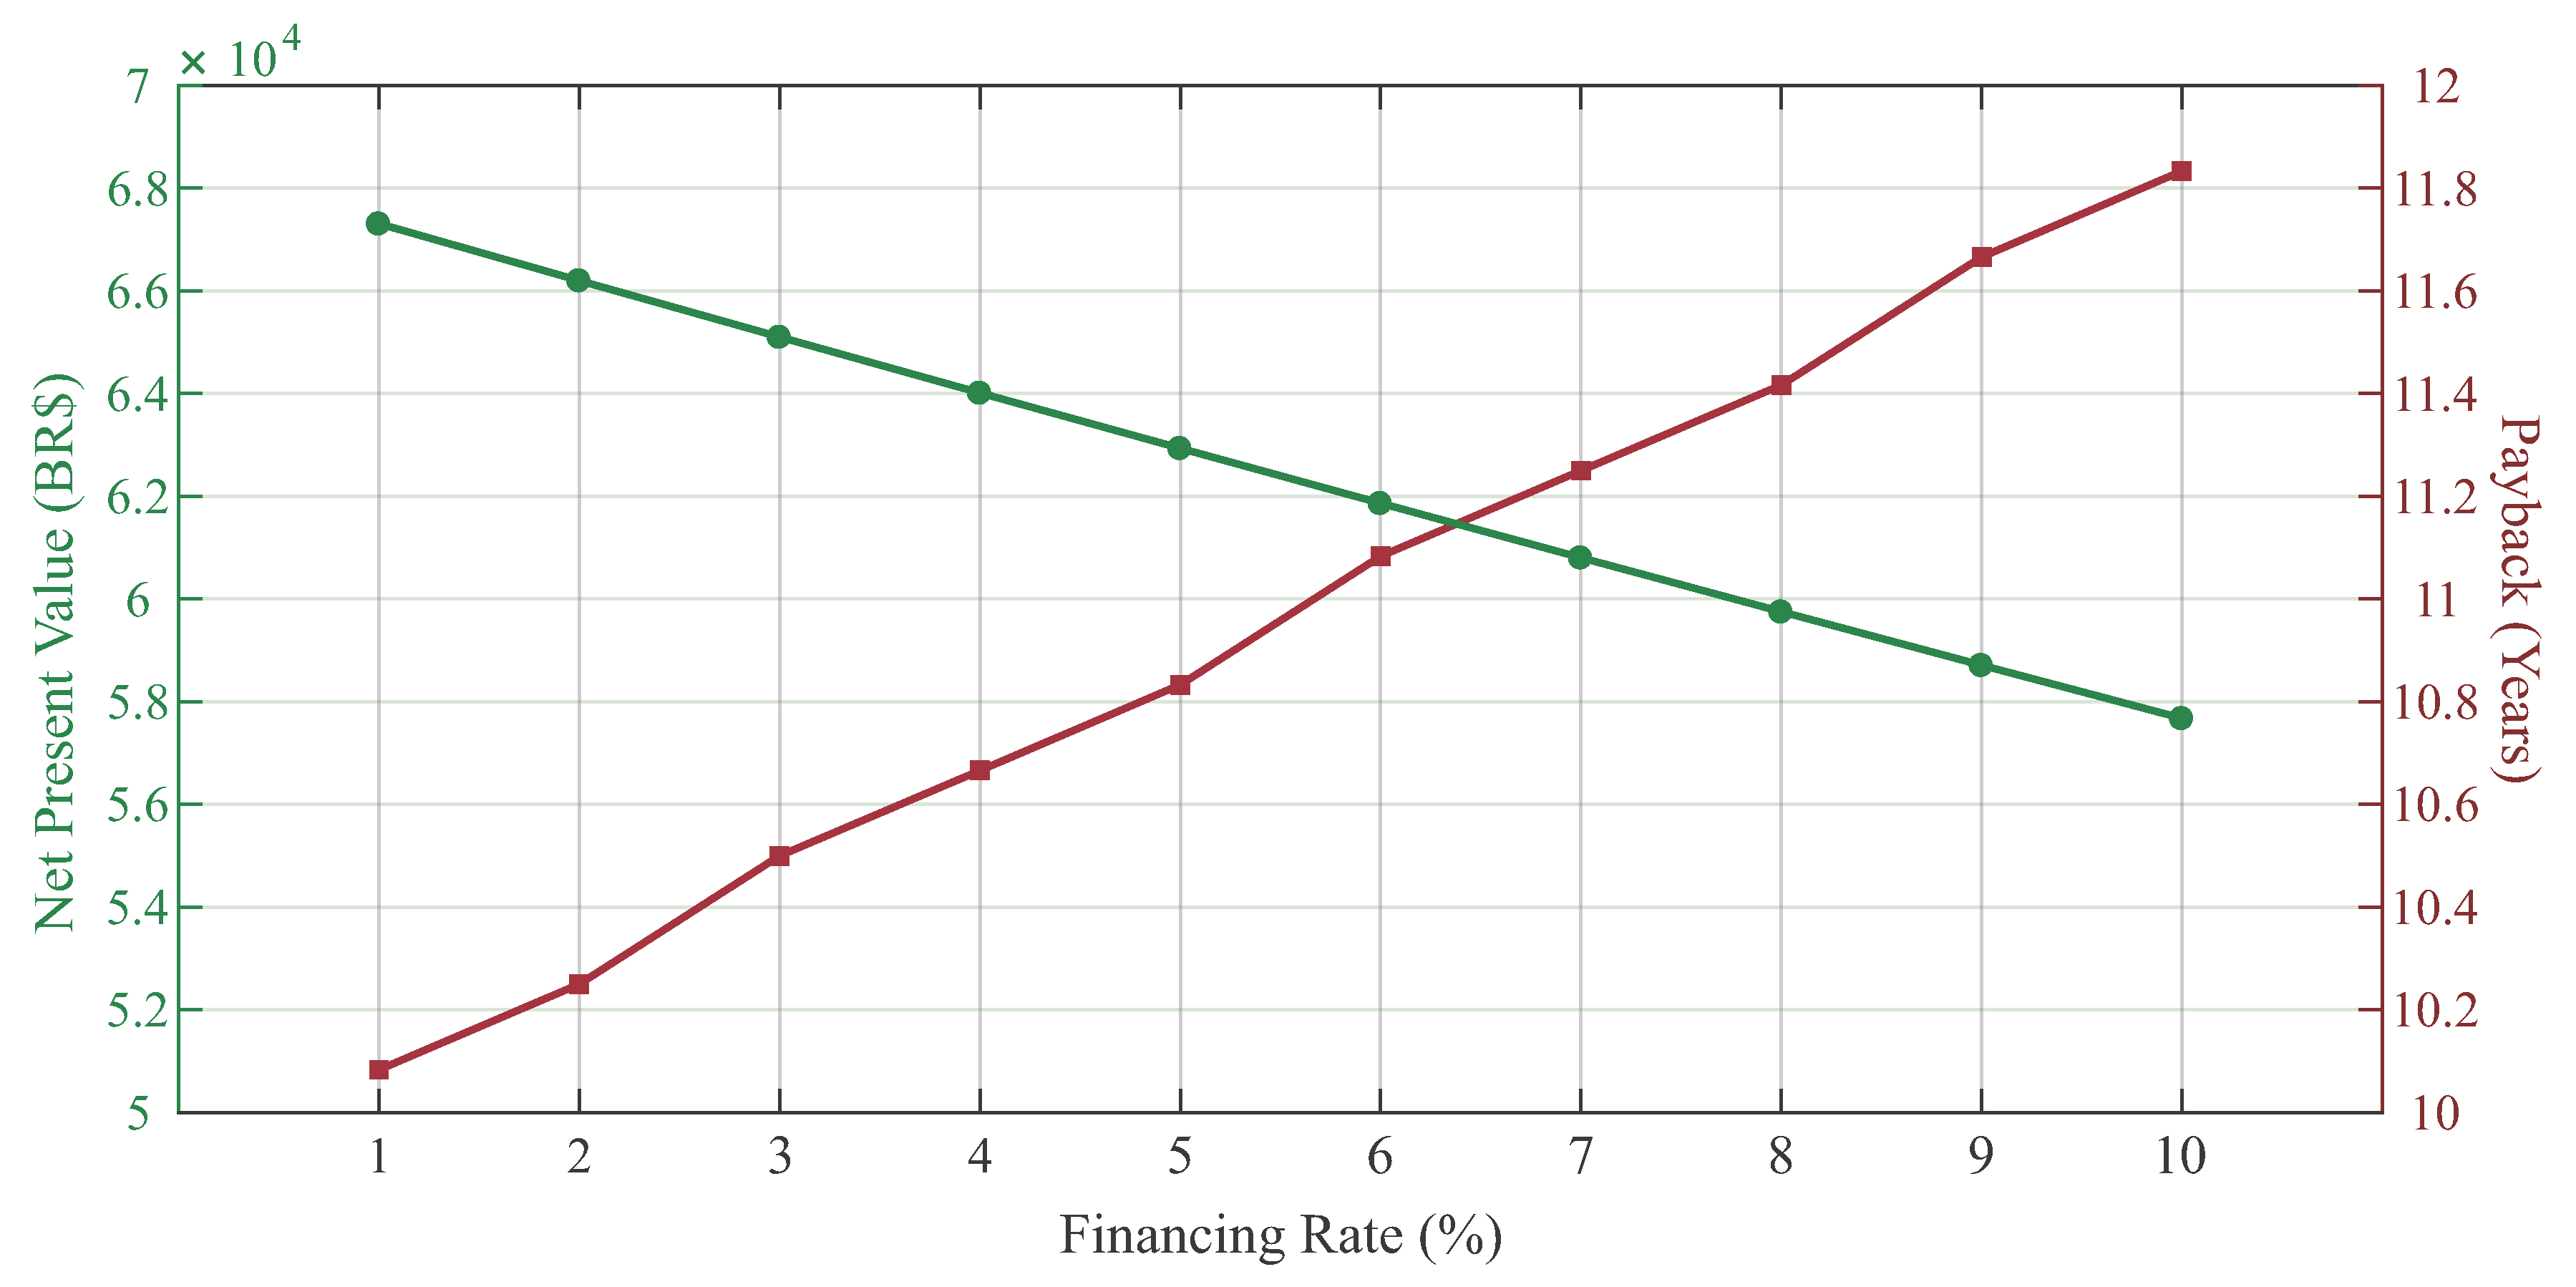
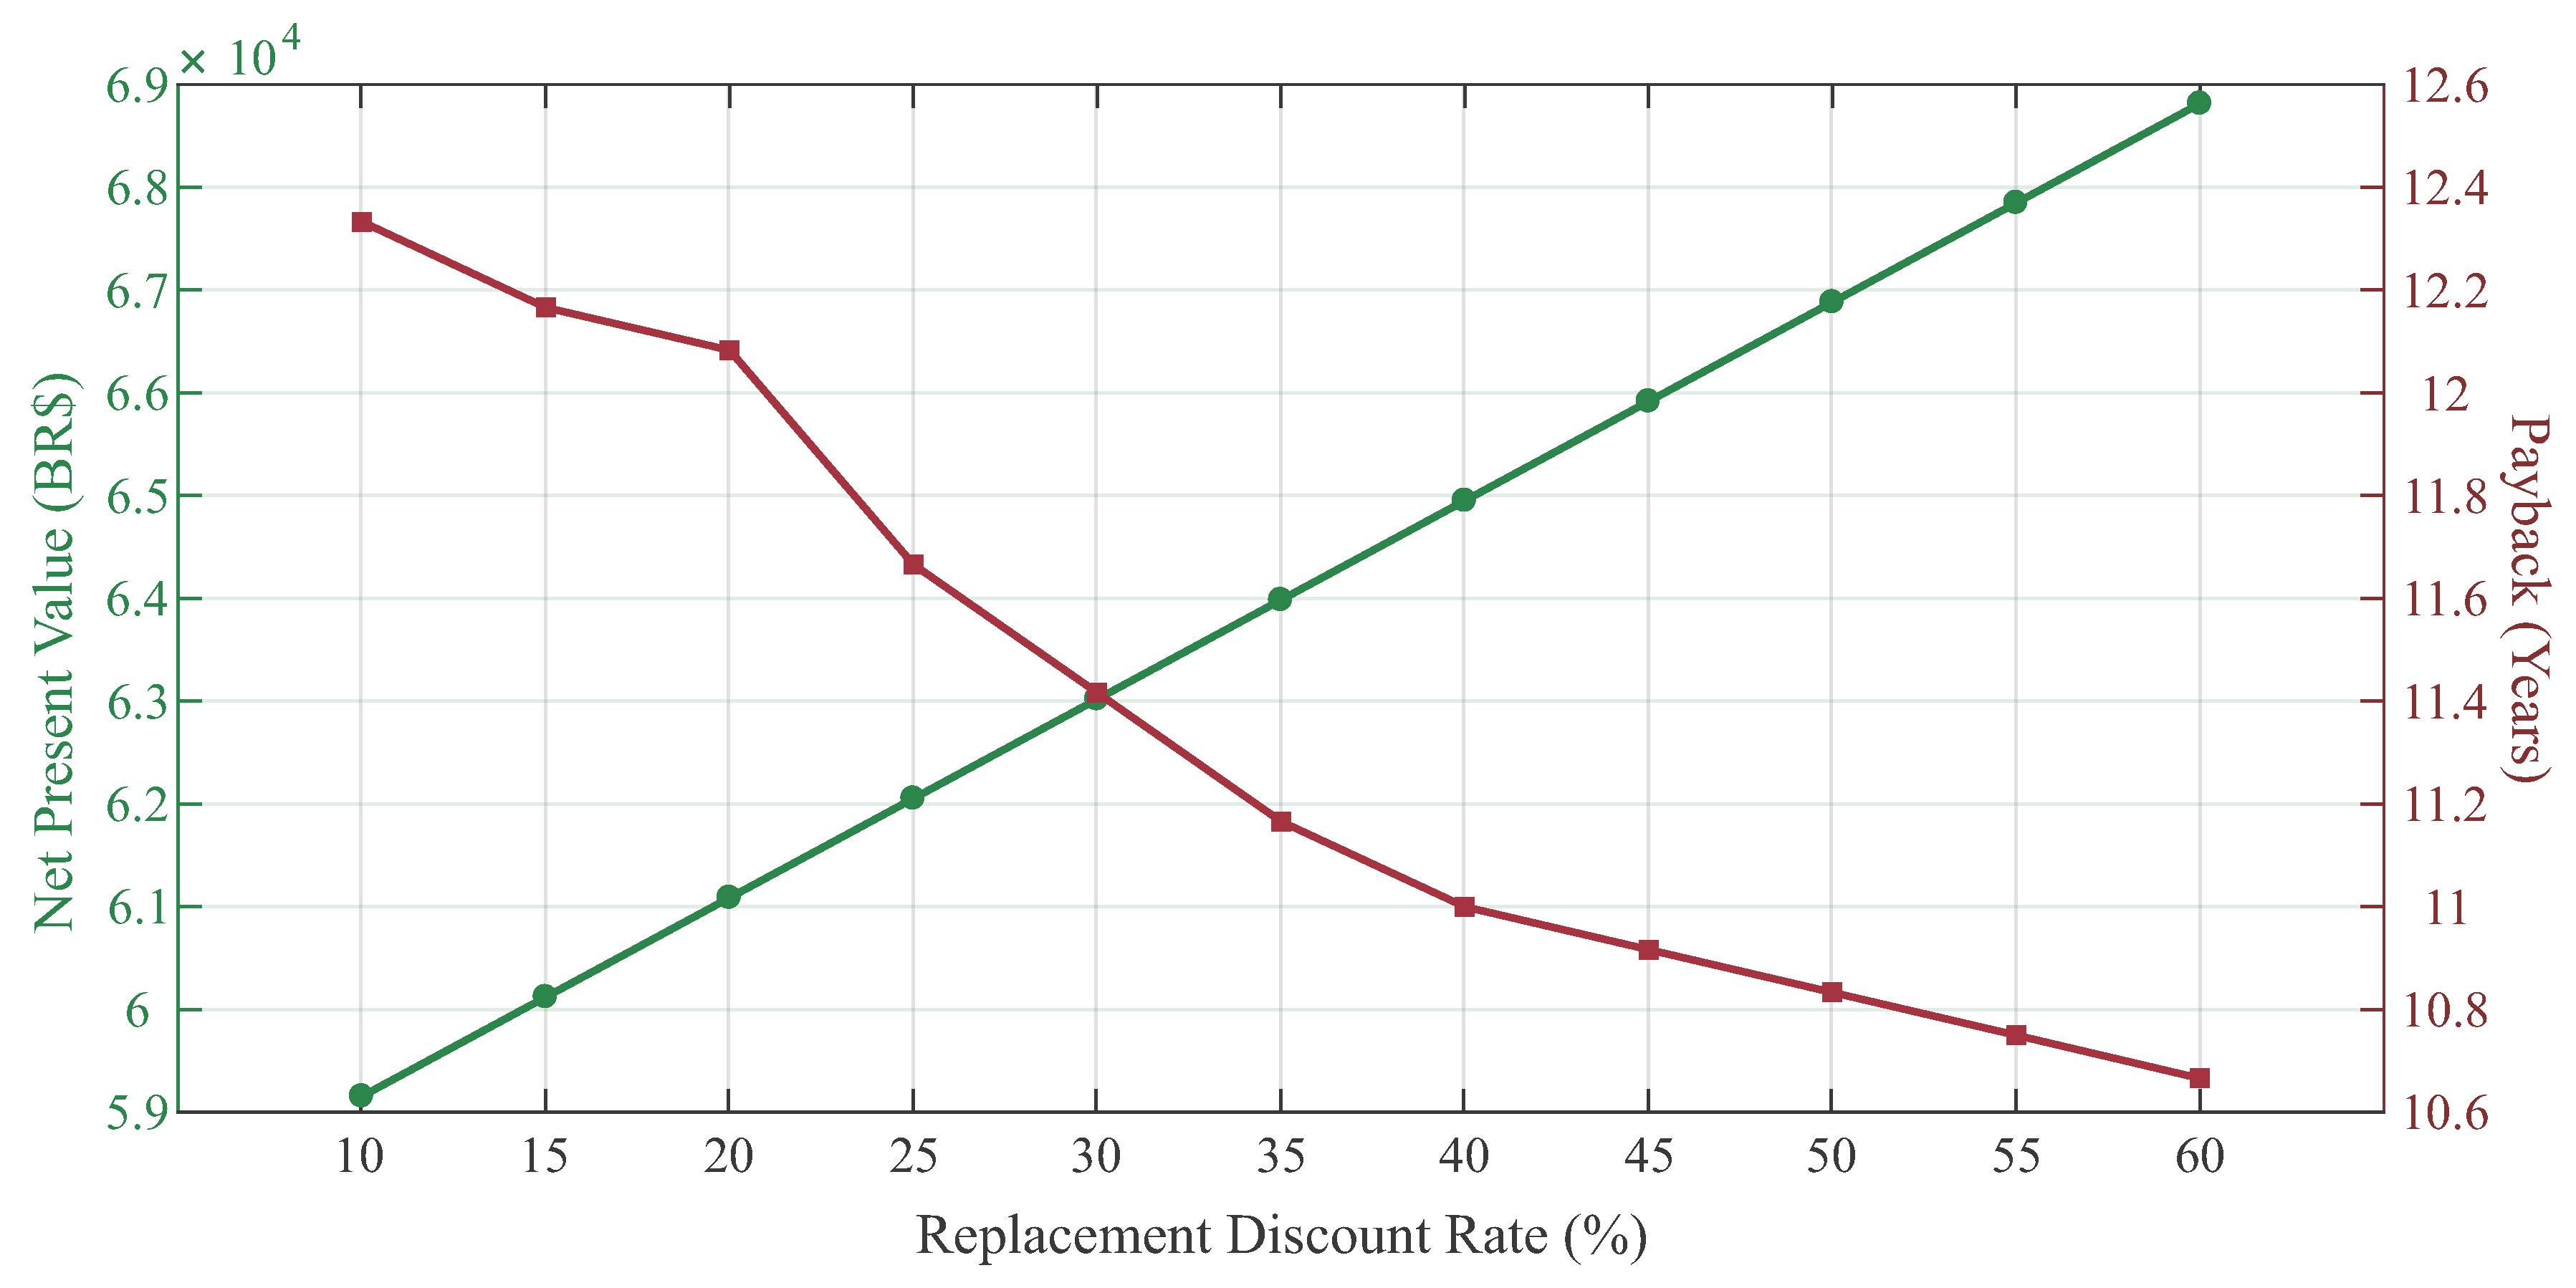
Finally, in the third study case conducted, three business models were investigated considering: (i) government subsidies; (ii) financing rates; and (iii) discount rates for BESS replacing. Comparing the best case of each business model with the BESS base case, one can conclude that there is a decrease in the payback about 50%, 20%, 16%, respectively. Business model 1 is the one presenting the highest NPV, hence providing the best incentives and investment opportunities from the consumer’s perspective.
From the results presented, it was possible to justify the importance of considering the battery degradation model. In addition, the study can contribute as a basis for relevant discussions in the sector through the comparative analyses carried out of the technical and economic impacts of the possible regulatory scenarios considering two types of tariff schemes. Individually, the business models showed that it is very difficult to make this type of investment attractive in the Brazilian context, but the results obtained were of great importance to envision new possibilities, such as considering a combination of the models. Another opportunity for future work would be the use of the product service provider model, being a complement to the business models analyzed.

Author Contributions

Conceptualization, L.D., W.G., B.D., and T.S.; methodology, L.D. and W.G.; validation, L.D., W.G., and B.D.; formal analysis, L.D., W.G., B.D., and T.S.; investigation, L.D. and W.G.; data curation, L.D., W.G., and B.D.; writing—original draft preparation, L.D., W.G., B.D., and T.S.; writing—review and editing, L.D., W.G., B.D., and T.S.; supervision, B.D. and T.S. All authors have read and agreed to the published version of the manuscript.

Funding

This research received partial support from the Federal University of Juiz de Fora (UFJF), National Council for Scientific and Technological Development (CNPq), Coordenação de Aperfeiçoamento de Pessoal de Nível Superior—Brasil (CAPES)—Finance Code 001, Fundação de Amparo à Pesquisa no Estado de Minas Gerais (FAPEMIG) and INERGE. In addition, this work is also supported through the Portuguese funding agency, FCT—Fundação para a Ciência e a Tecnologia, within project ESGRIDS—Desenvolvimento Sustentável da Rede Elétrica Inteligente/SAICTPAC/0004/2015-POCI-01-0145-FEDER-016434.

Conflicts of Interest

The authors declare no conflict of interest.

References

  1. Renewables 2020. In Global Status Report; 2020; Available online: https://www.ren21.net/gsr-2020/ (accessed on 28 August 2020).
  2. Masson, G.; Kaizuka, I. Trends 2019 in Photovoltaic Applications. In Photovoltaic Power Systems Programme; 2019; Available online: https://iea-pvps.org/wp-content/uploads/2020/02/5319-iea-pvps-report-2019-08-lr.pdf (accessed on 28 August 2020).
  3. Irena, I. Renewable Power Generation Costs in 2019; Report; International Renewable Energy Agency: Abu Dhabi, UAE, 2020; Available online: https://www.irena.org/-/media/Files/IRENA/Agency/Publication/2020/Jun/IRENA_Power_Generation_Costs_2019.pdf (accessed on 28 August 2020).
  4. Malinowski, M.; Leon, J.I.; Abu-Rub, H. Solar photovoltaic and thermal energy systems: Current technology and future trends. Proc. IEEE 2017, 105, 2132–2146. [Google Scholar] [CrossRef]
  5. Deotti, L.M.P.; Pereira, J.L.R.; da Silva Júnior, I.C. Parameter extraction of photovoltaic models using an enhanced Lévy flight bat algorithm. Energy Convers. Manag. 2020, 221, 113114. [Google Scholar] [CrossRef]
  6. Murdock, H.E.; Adib, R.; Lins, C.; Guerra, F.; Misra, A.; Vickery, L.; Collier, U.; Le Feuvre, P.; Bianco, E.; Mueller, S.; et al. Renewable Energy Policies in a Time of Transition. 2018. Available online: https://www.irena.org/-/media/Files/IRENA/Agency/Publication/2018/Apr/IRENA_IEA_REN21_Policies_2018.pdf (accessed on 10 July 2020).
  7. Cox, S.; Walters, T.; Esterly, S.; Booth, S. Solar Power. Policy Overview and Good Practices; Technical Report; National Renewable Energy Lab. (NREL): Golden, CO, USA, 2015. [Google Scholar]
  8. Schopfer, S.; Tiefenbeck, V.; Staake, T. Economic assessment of photovoltaic battery systems based on household load profiles. Appl. Energy 2018, 223, 229–248. [Google Scholar] [CrossRef]
  9. Achiluzzi, E.; Kobikrishna, K.; Sivabalan, A.; Sabillon, C.; Venkatesh, B. Optimal Asset Planning for Prosumers Considering Energy Storage and Photovoltaic (PV) Units: A Stochastic Approach. Energies 2020, 13, 1813. [Google Scholar] [CrossRef] [Green Version]
  10. Linssen, J.; Stenzel, P.; Fleer, J. Techno-economic analysis of photovoltaic battery systems and the influence of different consumer load profiles. Appl. Energy 2017, 185, 2019–2025. [Google Scholar] [CrossRef]
  11. Hung, D.Q.; Mithulananthan, N.; Bansal, R. Analytical strategies for renewable distributed generation integration considering energy loss minimization. Appl. Energy 2013, 105, 75–85. [Google Scholar] [CrossRef]
  12. Luthander, R.; Widén, J.; Nilsson, D.; Palm, J. Photovoltaic self-consumption in buildings: A review. Appl. Energy 2015, 142, 80–94. [Google Scholar] [CrossRef] [Green Version]
  13. Teng, J.H.; Luan, S.W.; Lee, D.J.; Huang, Y.Q. Optimal charging/discharging scheduling of battery storage systems for distribution systems interconnected with sizeable PV generation systems. IEEE Trans. Power Syst. 2012, 28, 1425–1433. [Google Scholar] [CrossRef]
  14. Sugihara, H.; Yokoyama, K.; Saeki, O.; Tsuji, K.; Funaki, T. Economic and efficient voltage management using customer-owned energy storage systems in a distribution network with high penetration of photovoltaic systems. IEEE Trans. Power Syst. 2012, 28, 102–111. [Google Scholar] [CrossRef]
  15. Li, J.; Danzer, M.A. Optimal charge control strategies for stationary photovoltaic battery systems. J. Power Sources 2014, 258, 365–373. [Google Scholar] [CrossRef]
  16. Moshövel, J.; Kairies, K.P.; Magnor, D.; Leuthold, M.; Bost, M.; Gährs, S.; Szczechowicz, E.; Cramer, M.; Sauer, D.U. Analysis of the maximal possible grid relief from PV-peak-power impacts by using storage systems for increased self-consumption. Appl. Energy 2015, 137, 567–575. [Google Scholar] [CrossRef]
  17. Júnior, J.C.L.; Medina, D.O.G.; Sousa, T. Evaluation of the Use of a Battery Energy Storage System in a Photovoltaic Plant for Minimization of Impacts in the Distribution Network. In Proceedings of the 13th Latin-American Congress on Eletricity Generation and Transmission (CLAGTEE 2019), Santiago de Chile, Chile, 20–23 October 2019. [Google Scholar]
  18. MME/EPE. Plano Decenal de Expansão de Energia 2029. In Ministério de Minas e Energia/Empresa de Pesquisa Energética; 2019. Available online: https://www.epe.gov.br/sites-pt/publicacoes-dados-abertos/publicacoes/Documents/PDE%202029.pdf (accessed on 23 July 2020).
  19. Shaukat, N.; Ali, S.; Mehmood, C.; Khan, B.; Jawad, M.; Farid, U.; Ullah, Z.; Anwar, S.; Majid, M. A survey on consumers empowerment, communication technologies, and renewable generation penetration within Smart Grid. Renew. Sustain. Energy Rev. 2018, 81, 1453–1475. [Google Scholar] [CrossRef]
  20. Gardiner, D.; Schmidt, O.; Heptonstall, P.; Gross, R.; Staffell, I. Quantifying the impact of policy on the investment case for residential electricity storage in the UK. J. Energy Storage 2020, 27, 101140. [Google Scholar] [CrossRef]
  21. Mulleriyawage, U.; Shen, W. Optimally sizing of battery energy storage capacity by operational optimization of residential PV-Battery systems: An Australian household case study. Renew. Energy 2020, 160, 852–864. [Google Scholar] [CrossRef]
  22. Da Silva, G.D.P.; Branco, D.A.C. Modelling distributed photovoltaic system with and without battery storage: A case study in Belem, northern Brazil. J. Energy Storage 2018, 17, 11–19. [Google Scholar] [CrossRef]
  23. Hesse, H.C.; Martins, R.; Musilek, P.; Naumann, M.; Truong, C.N.; Jossen, A. Economic optimization of component sizing for residential battery storage systems. Energies 2017, 10, 835. [Google Scholar] [CrossRef]
  24. Abdin, G.C.; Noussan, M. Electricity storage compared to net metering in residential PV applications. J. Clean. Prod. 2018, 176, 175–186. [Google Scholar] [CrossRef]
  25. Camilo, F.M.; Castro, R.; Almeida, M.; Pires, V.F. Economic assessment of residential PV systems with self-consumption and storage in Portugal. Sol. Energy 2017, 150, 353–362. [Google Scholar] [CrossRef]
  26. Parra, D.; Patel, M.K. Effect of tariffs on the performance and economic benefits of PV-coupled battery systems. Appl. Energy 2016, 164, 175–187. [Google Scholar] [CrossRef]
  27. Tervo, E.; Agbim, K.; DeAngelis, F.; Hernandez, J.; Kim, H.K.; Odukomaiya, A. An economic analysis of residential photovoltaic systems with lithium ion battery storage in the United States. Renew. Sustain. Energy Rev. 2018, 94, 1057–1066. [Google Scholar] [CrossRef]
  28. Zhou, L.; Zhang, Y.; Lin, X.; Li, C.; Cai, Z.; Yang, P. Optimal sizing of PV and BESS for a smart household considering different price mechanisms. IEEE Access 2018, 6, 41050–41059. [Google Scholar] [CrossRef]
  29. Pena-Bello, A.; Burer, M.; Patel, M.K.; Parra, D. Optimizing PV and grid charging in combined applications to improve the profitability of residential batteries. J. Energy Storage 2017, 13, 58–72. [Google Scholar] [CrossRef]
  30. ANEEL. Resolução Normativa N° 482, de 17 de abril de 2012; Agência Nacional de Energia Elétrica: Brasilia, Brazil, 2012. Available online: http://www2.aneel.gov.br/cedoc/ren2012482.pdf (accessed on 3 July 2020).
  31. ANEEL. Resolução Normativa N° 687, de 24 de novembro de 2015; Agência Nacional de Energia Elétrica: Brasilia, Brazil, 2015. Available online: http://www2.aneel.gov.br/cedoc/ren2015687.pdf (accessed on 3 July 2020).
  32. ABSOLAR. Contribuições à Consulta Pública N° 025/2019; Associação Brasileira de Energia Solar: São Paulo, Brazil, 2019. Available online: https://www.aneel.gov.br/consultas-publicas?p_p_id=participacaopublica_WAR_participacaopublicaportlet&p_p_lifecycle=2&p_p_state=normal&p_p_mode=view&p_p_cacheability=cacheLevelPage&p_p_col_id=column-2&p_p_col_pos=1&p_p_col_count=2&_participacaopublica_WAR_participacaopublicaportlet_ideDocumento=39104&_participacaopublica_WAR_participacaopublicaportlet_tipoFaseReuniao=fase&_participacaopublica_WAR_participacaopublicaportlet_jspPage=%2Fhtml%2Fpp%2Fvisualizar.jsp (accessed on 3 July 2020).
  33. ANEEL. Relatório de Análise de Impacto Regulatório N° 0004/2018 - SRD/SCG/SMA; Agência Nacional de Energia Elétrica: Brasilia, Brazil, 2018. Available online: https://www.aneel.gov.br/documents/656877/18485189/6+Modelo+de+AIR+-+SRD+-+Gera%C3%A7%C3%A3o+Distribuida.pdf/769daa1c-51af-65e8-e4cf-24eba4f965c1 (accessed on 3 July 2020).
  34. Agência Nacional de Energia Elétrica (ANEEL). Tarifa Branca. Available online: www.aneel.gov.br/tarifa-branca (accessed on 5 August 2020).
  35. Ministério de Minas e Energia/Empresa de Pesquisa Energética. Estudos do Plano Decenal de Expansão de Energia 2030: Micro e Minigeração Distribuída & Baterias. 2020. Available online: https://www.epe.gov.br/sites-pt/publicacoes-dados-abertos/publicacoes/PublicacoesArquivos/publicacao-490/topico-522/Caderno%20MMGD%20Baterias%20-%20PDE%202030%20Rev.pdf (accessed on 14 September 2020).
  36. Deotti, L.M.P.; Gomes, F.V. Technical and Economic Feasibility Analysis of a Photovoltaic Solar Microgeneration System with Remote Self-Consumption. In Proceedings of the VII Brazilian Congress of Solar Energy (CBENS), Gramado, RS, Brazil, 17–20 April 2018. [Google Scholar]
  37. Weniger, J.; Tjaden, T.; Quaschning, V. Sizing of residential PV battery systems. Energy Procedia 2014, 46, 78–87. [Google Scholar] [CrossRef] [Green Version]
  38. Hoppmann, J.; Volland, J.; Schmidt, T.S.; Hoffmann, V.H. The economic viability of battery storage for residential solar photovoltaic systems–A review and a simulation model. Renew. Sustain. Energy Rev. 2014, 39, 1101–1118. [Google Scholar] [CrossRef]
  39. Olaszi, B.D.; Ladanyi, J. Comparison of different discharge strategies of grid-connected residential PV systems with energy storage in perspective of optimal battery energy storage system sizing. Renew. Sustain. Energy Rev. 2017, 75, 710–718. [Google Scholar] [CrossRef]
  40. Vega-Garita, V.; Ramirez-Elizondo, L.; Mouli, G.R.C.; Bauer, P. Review of residential PV-storage architectures. In Proceedings of the 2016 IEEE International Energy Conference (ENERGYCON 2016), Leuven, Belgium, 4–8 April 2016; pp. 1–6. [Google Scholar]
  41. Hesse, H.C.; Schimpe, M.; Kucevic, D.; Jossen, A. Lithium-ion battery storage for the grid—A review of stationary battery storage system design tailored for applications in modern power grids. Energies 2017, 10, 2107. [Google Scholar] [CrossRef] [Green Version]
  42. SMA. Store Solar Power Use Flexibly. SMA Solar Technology AG. Available online: www.sma.de/en/home/store-solar-power-use-flexibly.html (accessed on 5 August 2020).
  43. Tesla. Powerwall Datasheet. Available online: https://www.tesla.com/sites/default/files/pdfs/powerwall/Powerwall%202_AC_Datasheet_en_GB.pdf (accessed on 28 May 2020).
  44. Fraunhofer ISE. Photovoltaics Report; Fraunhofer ISE: Freiburg, Germany, 2020; Available online: https://www.ise.fraunhofer.de/content/dam/ise/de/documents/publications/studies/Photovoltaics-Report.pdf (accessed on 28 August 2020).
  45. Lund, P.D. Capacity matching of storage to PV in a global frame with different loads profiles. J. Energy Storage 2018, 18, 218–228. [Google Scholar] [CrossRef]
  46. Schram, W.L.; Lampropoulos, I.; van Sark, W.G. Photovoltaic systems coupled with batteries that are optimally sized for household self-consumption: Assessment of peak shaving potential. Appl. Energy 2018, 223, 69–81. [Google Scholar] [CrossRef]
  47. Azuatalam, D.; Paridari, K.; Ma, Y.; Förstl, M.; Chapman, A.C.; Verbič, G. Energy management of small-scale PV-battery systems: A systematic review considering practical implementation, computational requirements, quality of input data and battery degradation. Renew. Sustain. Energy Rev. 2019, 112, 555–570. [Google Scholar] [CrossRef] [Green Version]
  48. Schmidt, O.; Hawkes, A.; Gambhir, A.; Staffell, I. The future cost of electrical energy storage based on experience rates. Nat. Energy 2017, 2, 1–8. [Google Scholar] [CrossRef]
  49. de Oliveira e Silva, G.; Hendrick, P. Lead–acid batteries coupled with photovoltaics for increased electricity self-sufficiency in households. Appl. Energy 2016, 178, 856–867. [Google Scholar] [CrossRef]
  50. Zhang, Y.; Lundblad, A.; Campana, P.E.; Yan, J. Employing battery storage to increase photovoltaic self-sufficiency in a residential building of Sweden. Energy Procedia 2016, 88, 455–461. [Google Scholar] [CrossRef] [Green Version]
  51. Hassan, A.S.; Cipcigan, L.; Jenkins, N. Optimal battery storage operation for PV systems with tariff incentives. Appl. Energy 2017, 203, 422–441. [Google Scholar] [CrossRef]
  52. Martins, R.; Musilek, P.; Hesse, H.C. Optimization of photovoltaic power self-consumption using linear programming. In Proceedings of the 2016 IEEE 16th International Conference on Environment and Electrical Engineering (EEEIC 2016), Florence, Italy, 7–10 June 2016; pp. 1–5. [Google Scholar]
  53. Hossain, M.A.; Pota, H.R.; Squartini, S.; Zaman, F.; Guerrero, J.M. Energy scheduling of community microgrid with battery cost using particle swarm optimisation. Appl. Energy 2019, 254, 113723. [Google Scholar] [CrossRef]
  54. Jordan, D.C.; Kurtz, S.R.; VanSant, K.; Newmiller, J. Compendium of photovoltaic degradation rates. Prog. Photovoltaics Res. Appl. 2016, 24, 978–989. [Google Scholar] [CrossRef]
  55. Da Fonseca, J.E.F.; de Oliveira, F.S.; Prieb, C.W.M.; Krenzinger, A. Degradation analysis of a photovoltaic generator after operating for 15 years in southern Brazil. Sol. Energy 2020, 196, 196–206. [Google Scholar] [CrossRef]
  56. Schmidt, O.; Melchior, S.; Hawkes, A.; Staffell, I. Projecting the future levelized cost of electricity storage technologies. Joule 2019, 3, 81–100. [Google Scholar] [CrossRef] [Green Version]
  57. He, G.; Chen, Q.; Kang, C.; Pinson, P.; Xia, Q. Optimal bidding strategy of battery storage in power markets considering performance-based regulation and battery cycle life. IEEE Trans. Smart Grid 2015, 7, 2359–2367. [Google Scholar] [CrossRef] [Green Version]
  58. Davis, M.; Hiralal, P. Batteries as a service: A new look at electricity peak demand management for houses in the UK. Procedia Eng. 2016, 145, 1448–1455. [Google Scholar] [CrossRef]
  59. Lorenzi, G.; Silva, C.A.S. Comparing demand response and battery storage to optimize self-consumption in PV systems. Appl. Energy 2016, 180, 524–535. [Google Scholar] [CrossRef]
  60. DiOrio, N.; Dobos, A.; Janzou, S.; Nelson, A.; Lundstrom, B. Technoeconomic Modeling of Battery Energy Storage in SAM; Technical Report; National Renewable Energy Lab. (NREL): Golden, CO, USA, 2015. [Google Scholar]
  61. McInnes, C.H.; Meehan, P. Equivalence of four-point and three-point rainflow cycle counting algorithms. Int. J. Fatigue 2008, 30, 547–559. [Google Scholar] [CrossRef]
  62. Marsh, G.; Wignall, C.; Thies, P.R.; Barltrop, N.; Incecik, A.; Venugopal, V.; Johanning, L. Review and application of Rainflow residue processing techniques for accurate fatigue damage estimation. Int. J. Fatigue 2016, 82, 757–765. [Google Scholar] [CrossRef] [Green Version]
  63. Xu, B.; Zhao, J.; Zheng, T.; Litvinov, E.; Kirschen, D.S. Factoring the cycle aging cost of batteries participating in electricity markets. IEEE Trans. Power Syst. 2017, 33, 2248–2259. [Google Scholar] [CrossRef] [Green Version]
  64. Xu, B.; Shi, Y.; Kirschen, D.S.; Zhang, B. Optimal regulation response of batteries under cycle aging mechanisms. In Proceedings of the 2017 IEEE 56th Annual Conference on Decision and Control (CDC 2017), Melbourne, Australia, 12–15 December 2017; pp. 751–756. [Google Scholar]
  65. Amzallag, C.; Gerey, J.; Robert, J.; Bahuaud, J. Standardization of the rainflow counting method for fatigue analysis. Int. J. Fatigue 1994, 16, 287–293. [Google Scholar] [CrossRef]
  66. Staffell, I.; Rustomji, M. Maximising the value of electricity storage. J. Energy Storage 2016, 8, 212–225. [Google Scholar] [CrossRef] [Green Version]
  67. Agência Nacional de Energia Elétrica (ANEEL). Componentes da Tarifa Residencial. Available online: https://www.aneel.gov.br/luz-na-tarifa (accessed on 16 September 2020).
  68. ANEEL. Por Dentro da Conta de Luz, 7th ed.; Agência Nacional de Energia Elétrica: Brasilia, Brazil, 2016. Available online: https://www.aneel.gov.br/documents/656877/15290115/Por+dentro+da+conta+de+luz+2016/19593350-705c-e18b-bca5-b18ba7ed7217 (accessed on 16 September 2020).
  69. De Castro Vieira, S.J.; Carpio, L.G.T. The economic impact on residential fees associated with the expansion of grid-connected solar photovoltaic generators in Brazil. Renew. Energy 2020, 159, 1084–1098. [Google Scholar] [CrossRef]
  70. Companhia Energética de Minas Gerais (CEMIG). CEMIG Atende. Available online: www.atende.cemig.com.br (accessed on 5 August 2020).
  71. Companhia Energética de Minas Gerais (CEMIG). Valores de Tarifas e Serviços. Available online: https://novoportal.cemig.com.br/atendimento/valores-de-tarifas-e-servicos/ (accessed on 15 September 2020).
  72. Agência Nacional de Energia Elétrica (ANEEL). Bandeiras Tarifárias. Available online: www.aneel.gov.br/bandeiras-tarifarias (accessed on 5 August 2020).
  73. EPE. Balanço energético nacional 2020: Ano base 2019. In Empresa de Pesquisa Energética; 2020. Available online: https://www.epe.gov.br/sites-pt/publicacoes-dados-abertos/publicacoes/PublicacoesArquivos/publicacao-479/topico-528/BEN2020_sp.pdf (accessed on 7 August 2020).
  74. Da Silva, P.P.; Dantas, G.; Pereira, G.I.; Câmara, L.; De Castro, N.J. Photovoltaic distributed generation—An international review on diffusion, support policies, and electricity sector regulatory adaptation. Renew. Sustain. Energy Rev. 2019, 103, 30–39. [Google Scholar] [CrossRef]
  75. Agência Nacional de Energia Elétrica (ANEEL). Geração Distribuída. Available online: www.aneel.gov.br/geracao-distribuida (accessed on 11 September 2020).
  76. Dulout, J.; Luna, A.; Anvari-Moghaddam, A.; Alonso, C.; Guerrero, J.; Jammes, B. Optimal Scheduling of a Battery-Based Energy Storage System for a Microgrid with High Penetration of Renewable Sources. In Proceedings of the ELECTRIMACS 2017, Toulouse, France, 4–6 July 2017. 6p. [Google Scholar]
  77. Prapanukool, C.; Chaitusaney, S. An appropriate battery capacity and operation schedule of battery energy storage system for PV rooftop with net-metering scheme. In Proceedings of the 2017 14th International Conference on Electrical Engineering/Electronics, Computer, Telecommunications and Information Technology (ECTI-CON 2017), Phuket, Thailand, 27–30 June 2017; pp. 222–225. [Google Scholar]
  78. Bordin, C.; Anuta, H.O.; Crossland, A.; Gutierrez, I.L.; Dent, C.J.; Vigo, D. A linear programming approach for battery degradation analysis and optimization in offgrid power systems with solar energy integration. Renew. Energy 2017, 101, 417–430. [Google Scholar] [CrossRef] [Green Version]
  79. Maheshwari, A.; Paterakis, N.G.; Santarelli, M.; Gibescu, M. Optimizing the operation of energy storage using a non-linear lithium-ion battery degradation model. Appl. Energy 2020, 261, 114360. [Google Scholar] [CrossRef]
  80. Xiao, J.; Zhang, Z.; Bai, L.; Liang, H. Determination of the optimal installation site and capacity of battery energy storage system in distribution network integrated with distributed generation. IET Gener. Transm. Distrib. 2016, 10, 601–607. [Google Scholar] [CrossRef]
  81. Rodrigues, S.; Torabikalaki, R.; Faria, F.; Cafôfo, N.; Chen, X.; Ivaki, A.R.; Mata-Lima, H.; Morgado-Dias, F. Economic feasibility analysis of small scale PV systems in different countries. Sol. Energy 2016, 131, 81–95. [Google Scholar] [CrossRef]
  82. Ratnam, E.L.; Weller, S.R.; Kellett, C.M.; Murray, A.T. Residential load and rooftop PV generation: An Australian distribution network dataset. Int. J. Sustain. Energy 2017, 36, 787–806. [Google Scholar] [CrossRef]
  83. Aldo. Distribuidora de Equipamentos Fotovoltaicos e Eletrônicos. Available online: https://www.aldo.com.br/loja/ (accessed on 2 July 2020).
  84. Companhia Energética de Minas Gerais (CEMIG). Tarifas e Tributos. Available online: http://www.cemig.com.br/pt-br/atendimento/corporativo/Paginas/tarifas.aspx (accessed on 10 June 2020).
  85. Power Plus Energy. LiFe Premium 2RU19 Specification. Available online: https://www.powerplus-energy.com.au/wp-content/uploads/2019/03/LiFe-Premium-2RU19-Specifications-REV03.pdf (accessed on 2 July 2020).
  86. Long, C.; Wu, J.; Zhou, Y.; Jenkins, N. Peer-to-peer energy sharing through a two-stage aggregated battery control in a community Microgrid. Appl. Energy 2018, 226, 261–276. [Google Scholar] [CrossRef]
  87. Xu, B.; Oudalov, A.; Ulbig, A.; Andersson, G.; Kirschen, D.S. Modeling of lithium-ion battery degradation for cell life assessment. IEEE Trans. Smart Grid 2016, 9, 1131–1140. [Google Scholar] [CrossRef]
  88. SMA. Sunny Boy Storage 3.7/5.0/6.0. Available online: https://files.sma.de/downloads/SBS37-60-DEN1751-V21web.pdf (accessed on 2 July 2020).
  89. WEC. World Energy Resources E-Storage: Shifting from Cost to Value Wind and Solar Applications; World Energy Council: London, UK, 2016; Available online: https://www.worldenergy.org/assets/downloads/Resources-E-storage-report-2016.02.04.pdf (accessed on 23 July 2020).
  90. Agência Nacional de Energia Elétrica (ANEEL). Tarifa Residencial. Available online: https://www.aneel.gov.br/relatorio-evolucao-tarifas-residenciais (accessed on 15 September 2020).
Figure 1. Circuit topology of a residential building with photovoltaic (PV)+battery energy storage system (BESS) system.
Energies 13 06517 g001
Figure 2. Battery cycle life before reaching 80% of its original capacity at reference operating conditions.
Energies 13 06517 g002
Figure 3. Weekly profile of tariff schemes available to residential prosumers and consumers located in the city of Juiz de Fora, state of Minas Gerais [34].
Energies 13 06517 g003
Figure 4. Components of the electricity tariff homologated by ANEEL for conventional tariff scheme of CEMIG (left) and its final composition considering the tax internalization on the residential class (right) [70,71].
Energies 13 06517 g004
Figure 5. Flowchart of the proposed analysis.
Energies 13 06517 g005
Figure 6. Prosumer’s profile considering conventional tariff—clear day (left side) and cloudy day (right side).
Energies 13 06517 g006
Figure 7. Sensitivity analysis considering conventional tariff—Net Present Value (NPV) and technical metrics.
Energies 13 06517 g007
Figure 8. Prosumer’s profile considering white tariff—clear day (left side) and cloudy day (right side).
Energies 13 06517 g008
Figure 9. Sensitivity analysis considering white tariff—NPV and technical metrics.
Energies 13 06517 g009
Figure 10. NPV for the PV system over 5 years, considering the 6 regulatory options.
Energies 13 06517 g010
Figure 11. IRR for the PV system over 5 years, considering the 6 regulatory options.
Energies 13 06517 g011
Figure 12. NPV for the PV+BESS (6.6 kWh) system over 5 years, considering the 6 regulatory options.
Energies 13 06517 g012
Figure 13. IRR for the PV+BESS (6.6 kWh) system over 5 years, considering the 6 regulatory options.
Energies 13 06517 g013
Figure 14. BESS sensitivity analysis considering government subsidy (business model 1).
Energies 13 06517 g014
Figure 15. BESS sensitivity analysis considering financing rates (business model 2).
Energies 13 06517 g015
Figure 16. BESS sensitivity analysis considering BESS replacement discount (business model 3).
Energies 13 06517 g016
Table 1. Alternatives proposed by ANEEL for energy credit valuation [33].
AlternativeDistribution CostTransmission CostUse IncumbenciesEnergy LossesEnergy IncumbenciesEnergy
0YesYesYesYesYesYes
1NoYesYesYesYesYes
2NoNoYesYesYesYes
3NoNoNoYesYesYes
4NoNoNoNoYesYes
5NoNoNoNoNoYes
Table 2. General PV system characteristics.
ParametersProsumerReference
Nominal Power of the PV System ( P n o m p v )7200 Wp[82]
PV System Investment Cost ( I p v )BR$ 4.41/Wp[18,83]
O&M Cost ( o p v )-relative to I p v 1%[9]
Table 3. General BESS characteristics.
ParametersValueReference
Nominal Capacity ( B n o m )6.6 kWh[85]
Minimum/Maximum Charge State ( S o C m i n / S o C m a x )0.2/0.8[86]
Charge/Discharge Efficiency ( η c / η d )0.96[85]
Charge/Discharge Rate ( λ c / λ d )0.5/0.9375[85]
Self-Discharge Rate SD8.6086 × 10−6[85]
Datasheet Lifetime/End-of-life ( T s h e l f /EOL)10 years/80%[23,87]
Maximum Number of Cycles (DoD = 100%)2700[85]
Coefficients of the Cyclic Degradation Curvea = 38,200; b = −0.02686[80,85] *
Inverter Efficiency ( η i n v )0.95[23,88]
Investment CostBR$ 5000/kWh[18,76,83]
O&M Cost2%[89]
* Calculated based on [80] with data from [85].
Table 4. Weighting factor.
Alternative γ Reference
01[90]
10.6967[90]
20.6173[90]
30.52[90]
40.4271[90]
50.4051[90]
Table 5. Energy tariff without tax.
Type of Energy TariffCharging ScheduleReference
(00–16 h)–(21–00 h)(16–17 h)–(20–21 h)17–20 h
Conventional Tariff0.644630.644630.64463[71]
White Tariff0.528760.796781.24212[71]
Table 6. Computational parameters considered in the simulation.
ParameterValue
Time Interval ( Δ t )30 min
Size of a Day (T)24 h
Analysis Period (N)July 2012 to June 2013
Symbolic Cost ( δ p l t / δ p b t )5/2
Table 7. Results—conventional tariff.
Evaluation MetricsPVPV+BESS
(7.2 kWp)(7.2 kWp, 6.6 kWh)(7.2 kWp, 9.9 kWh )(7.2 kWp, 13.2 kWh)
Average Self-Consumption Rate (%)41.0848.6152.0555.38
Average Self-Sufficiency Degree (%)31.5737.3740.0142.58
Net Present Value (BR$)118,589.8857,224.4423,229.57−11,499.04
Internal Rate of Return (%)37.1017.2512.408.97
Payback Period (Year)4 years and 9 months12 years and 7 months19 years and 11 months>25 years
Table 8. Results—white tariff.
Evaluation MetricsPVPV+BESS
(7.2 kWp)(7.2 kWp, 6.6 kWh)(7.2 kWp, 9.9 kWh )(7.2 kWp, 13.2 kWh)
Average Self-Consumption Rate (%)41.0848.5851.9955.30
Average Self-Sufficiency Degree (%)31.5737.3439.9642.51
Net Present Value (BR$)98,404.5044,288.8617,036.30−10,571.24
Internal Rate of Return (%)32.9215.7111.849.01
Payback Period (Year)5 years and 5 months14 years and 1 month21 years and 1 month>25 years
Publisher’s Note: MDPI stays neutral with regard to jurisdictional claims in published maps and institutional affiliations.

