Abstract
Smart grids (SGs) are attracting attention as high value-added platforms, which mass-produce new business models through real-time information sharing. However, the open-ended information structure of SGs increases the risk of exposure to cyberattacks through the creation of multiple communication access points. In a power system where a real-time balance of supply and demand is essential, cyberattacks result in cascading failures leading to power outages. Therefore, this paper proposes a method to evaluate the robustness of large-scale SGs against cybersecurity disturbances. The proposed evaluation method established a hierarchy quantification technique considering the structural characteristics of SGs. With respect to the cyber hierarchy, relevant standards (NERC CIP, NIST FIPS) were applied to classify the grades of information security risk. In the case of physical hierarchy, the power system was calculated by using optimal power flow and analyzed the frequency stability. This study was aimed at identifying the vulnerabilities in the physical topology aspect of intelligent power systems due to cybersecurity disturbances.
1. Introduction
A smart grid (SG) is a representative convergence technology that provides various services and high-value through the advancement of power infrastructure. However, due to the physical characteristics of electricity (maintaining a balance of real-time supply and demand, etc.), this industry faces complex and diverse challenges compared with other convergence industries. A typical example is the uncertainty of a stable power supply due to cyber terrorism in the power system. On 14 August 2003, a massive blackout in nine areas in the United States and Canada caused more than $6 billion in monetary losses [1]. Although this incident is not a direct case of cyber terrorism in the power system, it indicates that control system malfunctions in the power industry can lead to national damage. In the United States and Europe, information and communications technology (ICT) has been used owing to the vastness of the geographic area and the advancement of the power market and there have been various cyber-attacks [2,3,4]. Moreover, related international conferences (Black Hat) have also proven the technical possibility of cybersecurity threats to SGs [5].
Recently, with the emergence of security issues due to the active deployment of SGs, various studies have been conducted on the optimized security solutions of SGs. The Illinois Institute of Technology has conducted a study on a contingency-based power system reliability evaluation algorithm for the malfunction of WAMS [6]. In addition, the Schweitzer Engineering Lab has analyzed the CPS modeling-based vulnerabilities of the power infrastructure [7]. Furthermore, SG security studies have been reported from various perspectives, such as the analysis of the impact of cyber disturbances on the power market [8,9,10]. In recent years, related studies have been actively conducted on SG security reflecting cyber disturbances for the power-system-analysis techniques such as optimal power-flow-calculation normalization according to cyber-attacks [11,12].
In this study, the organic relationship of the SG infrastructure was analyzed, and a robustness-evaluation technique was proposed in terms of the physical topology based on the contingency analysis of cyber disturbances. To this end, Section 2 presents the analysis of the structural characteristics and infrastructure elements of the SG, and Section 3 introduces a physical robustness-evaluation method for a large-scale SG with respect to cyber disturbances. Particularly, for the evaluation, the cyber and physical hierarchies are quantified to reflect the structural characteristics of SGs. Section 4 validates the proposed evaluation method through a case study for the modified IEEE RTS 39-bus.
2. Structural Characteristics of SG
An SG is a convergence of power systems and information systems. Hence, the relationship between different fields needs to be analyzed. In this study, the correlation between the physical hierarchy (power system) and cyber hierarchy (information system) is analyzed considering a cybersecurity disturbance based on the power system in Korea. The power system is organically connected to the system of power generation, transmission, and distribution, centered on the energy management system (EMS) to maintain a real-time balance of power supply and demand. The EMS is a core system for the optimal operation of the power system and various optimization programs are installed to control the overall process from the power generation plan to subsystem analysis. The communication system of the EMS is based on IEC 61850 and 60870 and it transmits and receives data to/from power generators exceeding 20 MW and substations of 345/765 kV through a dedicated remote terminal unit (RTU). Substations below 154 kV acquire data through the regional control center (RCC) [13].
The power generation system maintains the specified frequency (60 ± 0.2 Hz in Korea) by adjusting the output reference point for each generator through the automatic generation control (AGC) function of the EMS as a synchronous power generation method [14]. The control system of a power generator over 20 MW periodically measures and controls approximately 3000 to 50,000 data elements on generator components (boiler, turbine, condenser, etc.) through the distributed control system (DCS) [15].
The transmission system monitors and controls various types of information on transmission and substation facilities through supervisory control and data acquisition (SCADA) and communicates based on IEC 61850, in connection with wide-area monitoring and control (WAMAC). WAMAC minimizes the spread of failures by adjusting the power distribution with an interruptible load shedding (ILS) in case of sudden disturbance [16].
These structural characteristics of SGs and the real-time two-way information-sharing system increase the information access points and, thus, these systems become exposed to cybersecurity threats. Therefore, the analysis of the correlation between hierarchies according to the occurrence of disturbances in an SG is as follows.
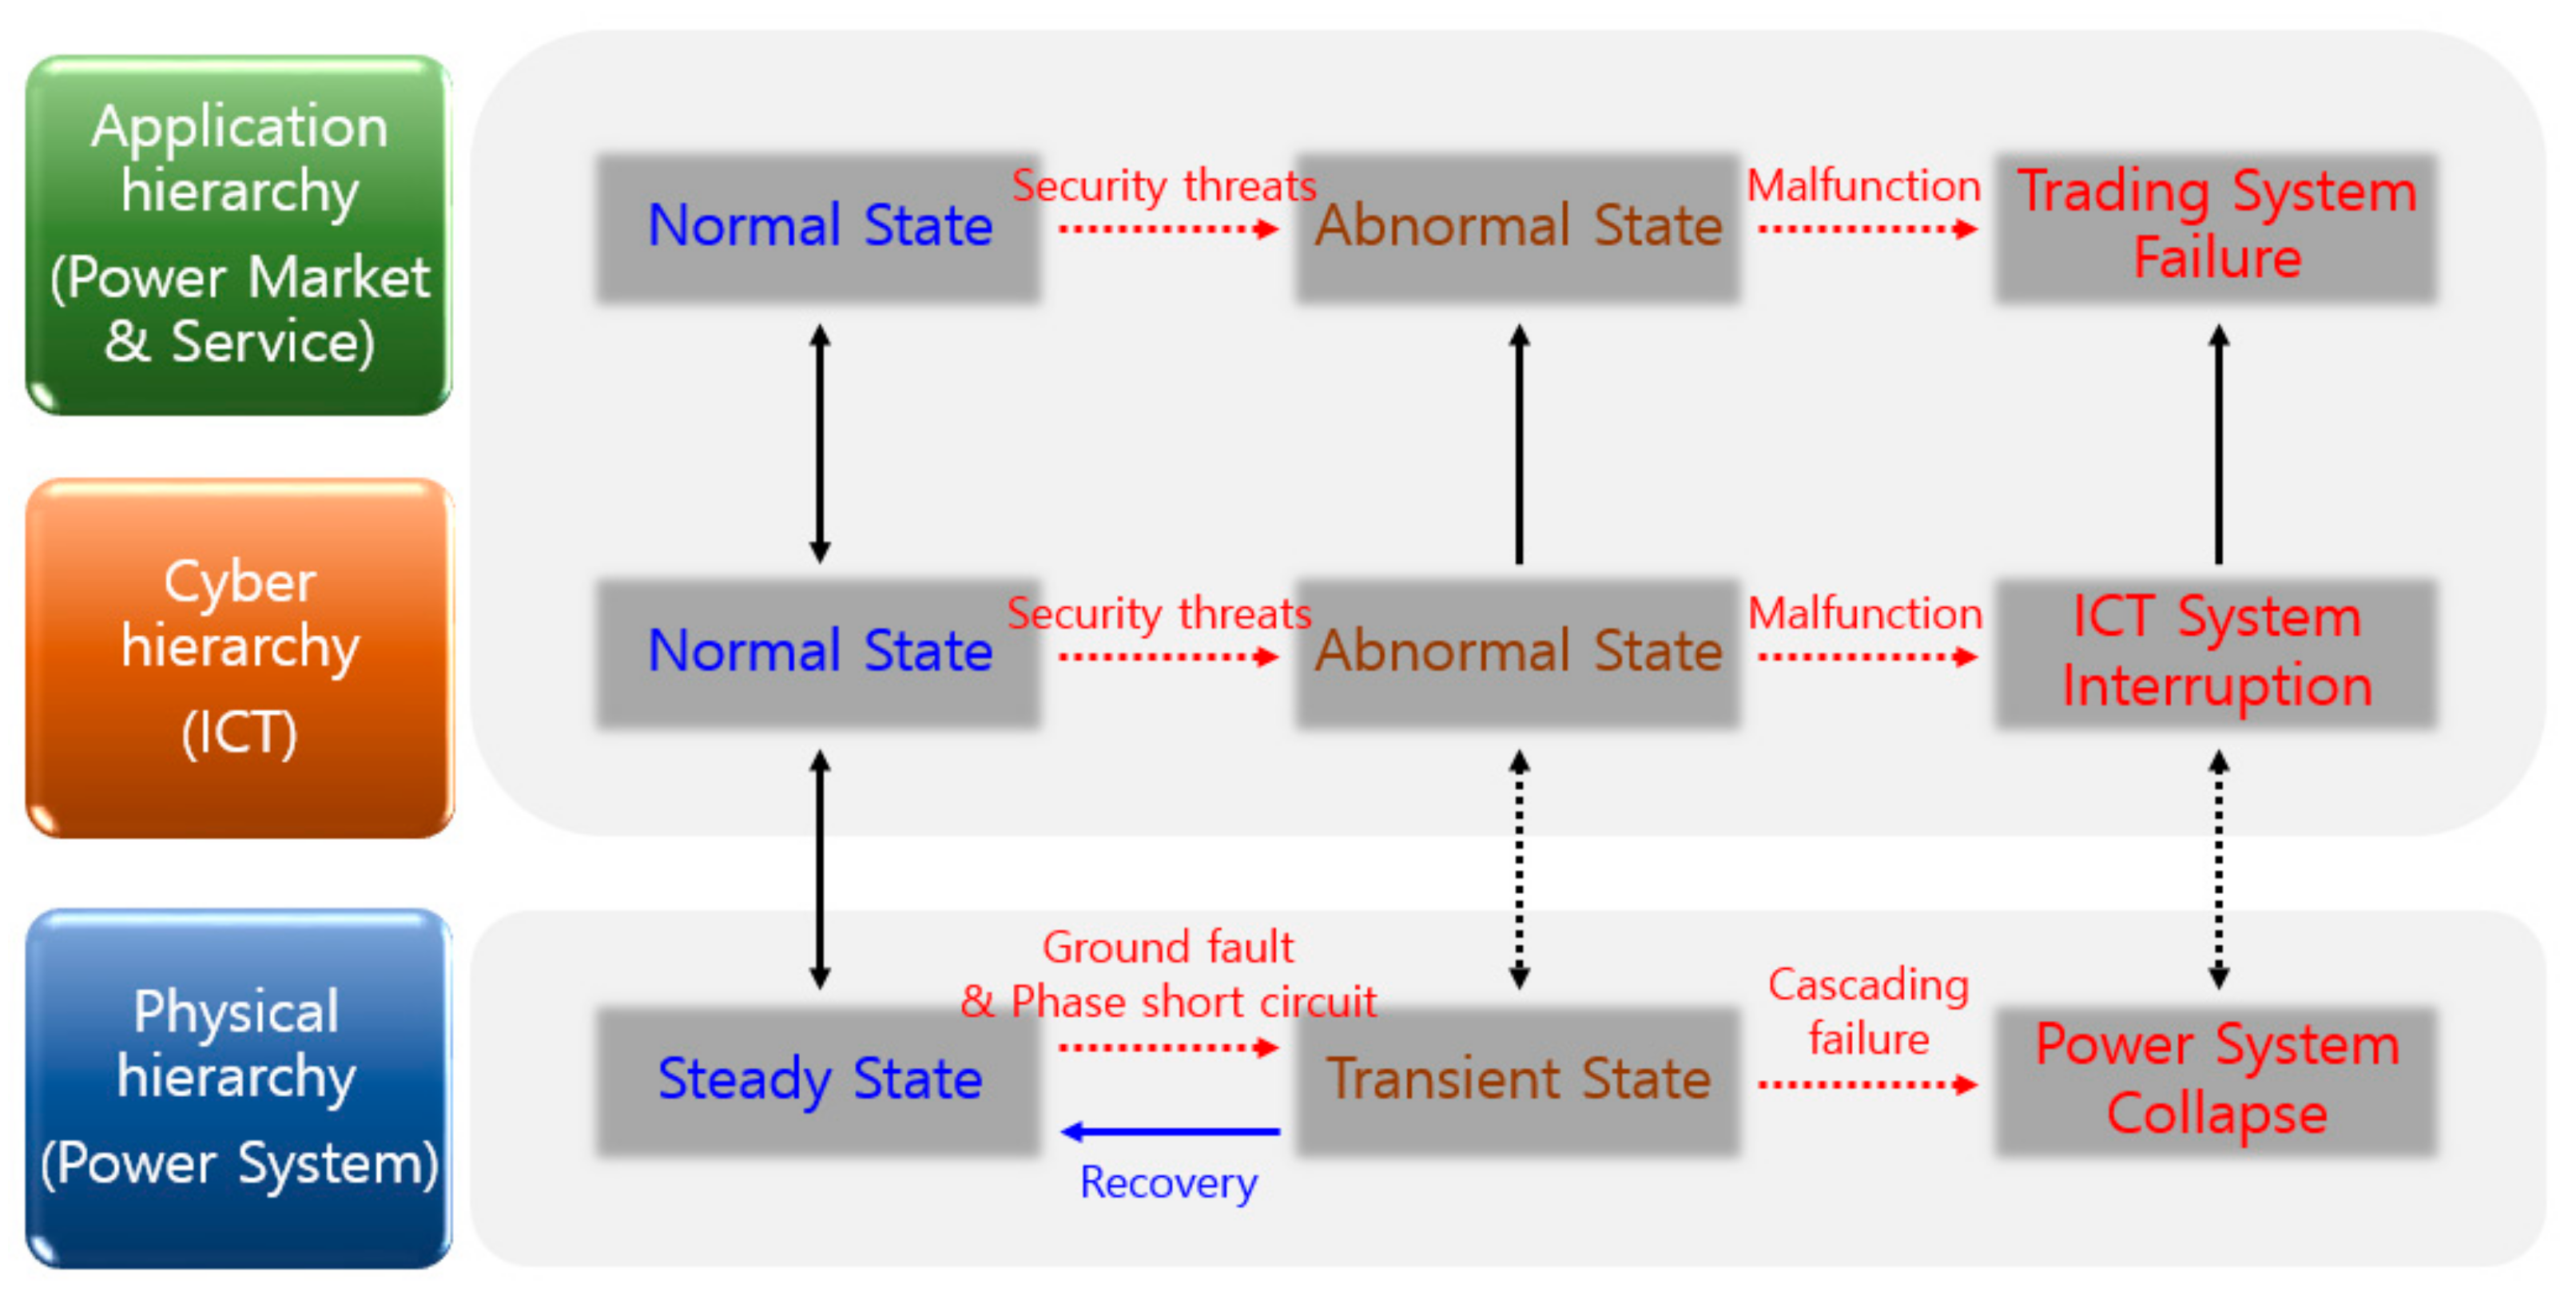
Figure 1 shows the structural and functional aspects of the SG, categorized into physical, cyber, and applied hierarchies. The figure also represents the correlation of each hierarchy based on the state change (steady, transient, and collapse) of the power system. Abnormal conditions in the cyber and application layers are directly connected to system malfunction, disabling the functions of each hierarchy, and a failure of the communication system is likely to cause a wide-area power outage.

Figure 1.
Correlation by SG hierarchy.
3. Evaluation Methodology on Risk Impact of Cybersecurity Threats in Large-Scale SGs
3.1. Definition of Risk Impact of Cybersecurity Threats
NIST and NERC have announced strategies and technical standards for securing the cybersecurity of integrated power and information systems for the reliable operation of SGs [17,18,19,20]. In particular, NERC stipulated bulk electric system (BES) operators to evaluate the effect of the power system periodically due to cyber disturbances [19]. This study defines the concept of the risk impact of cybersecurity threats specialized in SGs based on related previous studies.
First, the power system at the physical hierarchy adheres to the reliability, adequacy, and security evaluation to secure soundness [21]. Reliability encompasses adequacy, security, and the ability to provide quality power to consumers via normal operation of the related facilities according to the power system regulations [21,22]. Security is the ability of the electric system to withstand sudden disturbances, such as electric short circuits or unanticipated loss of system elements. For this, the stability of frequency, voltage, etc., due to contingency is analyzed [21,22].
Next, securing cybersecurity at the cyber hierarchy refers to a series of technologies that satisfy the three elements of security objectives (confidentiality, integrity, and availability) for the information and communication infrastructure [17]. Confidentiality prevents information from being disclosed to unauthorized devices or users. Integrity ensures that information has not been altered by unauthorized actions during data processing. Availability only allows timely access and the use of data and information systems to authorized users.
Accordingly, the risk impact of cybersecurity threats in SGs is the integration of the concepts of power system security and cybersecurity and is defined as identifying vulnerable points from the perspective of physical topology due to cyber contingency in a large-scale intelligent power system.
3.2. Evaluation of Risk Impact of Cybersecurity Threats
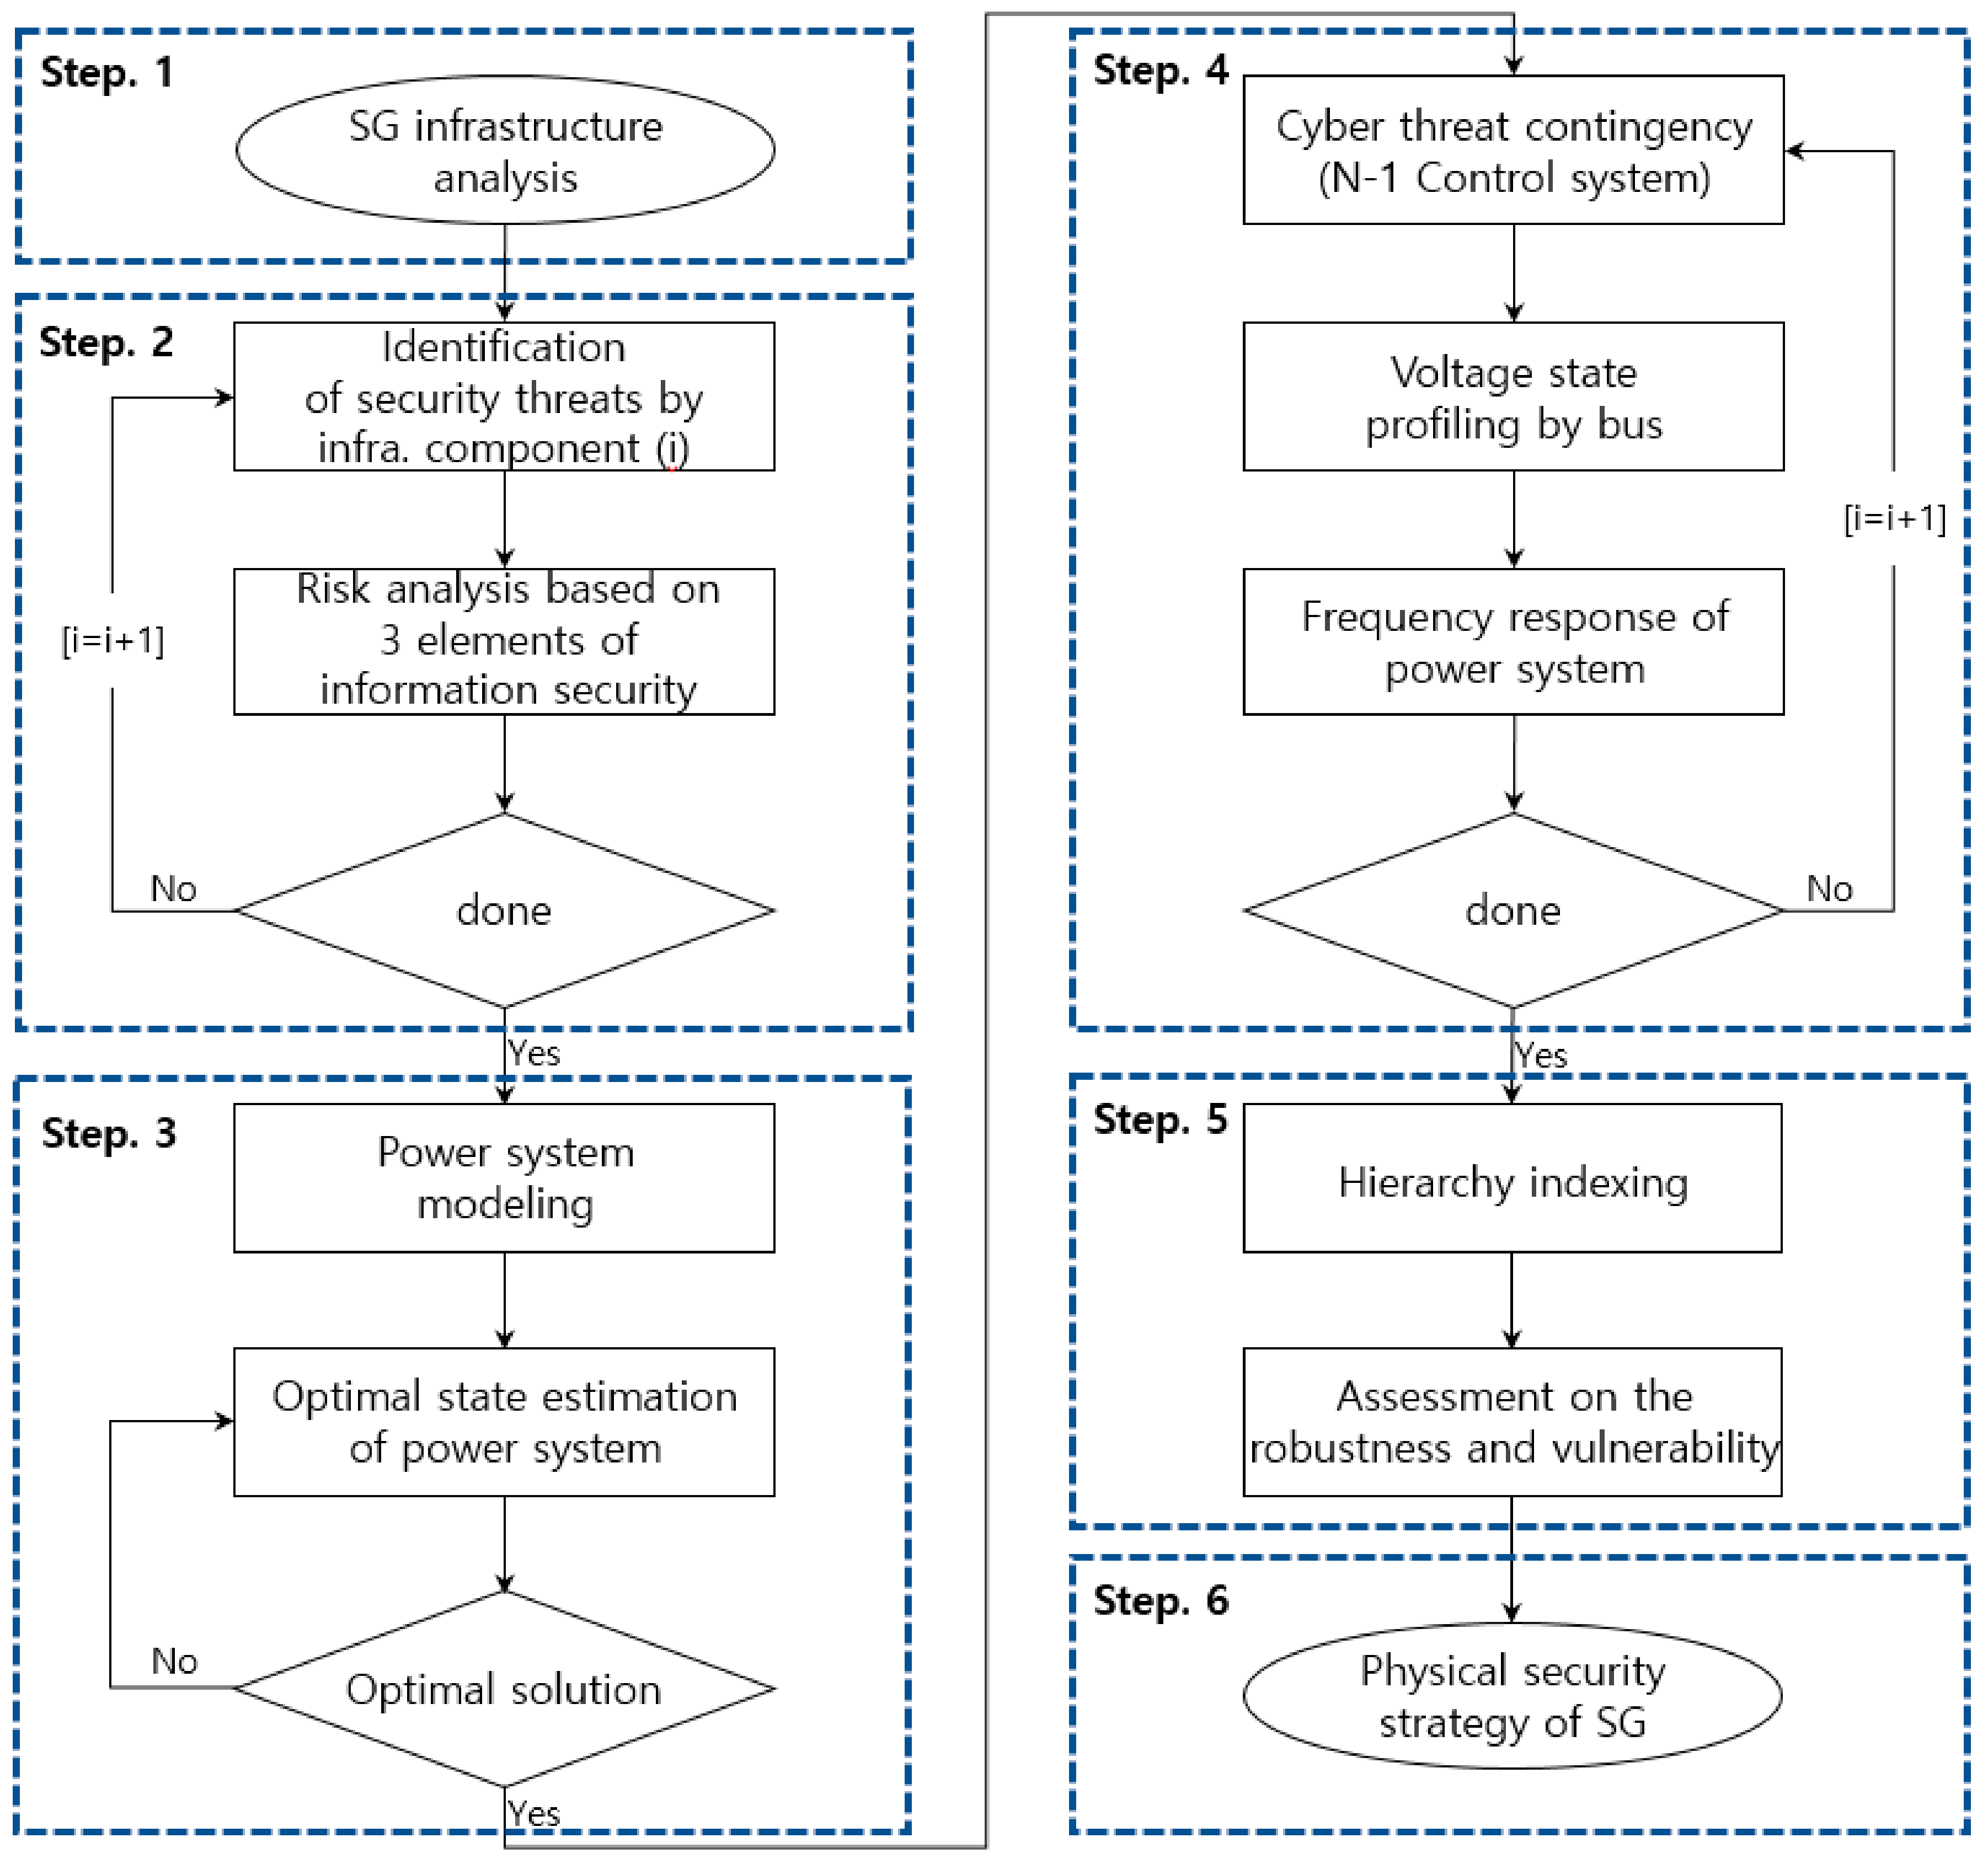
In this study, the evaluation of the robustness of cybersecurity threats was established in six steps, as shown in Figure 2, focusing on quantitatively deriving vulnerable points in terms of physical topology.
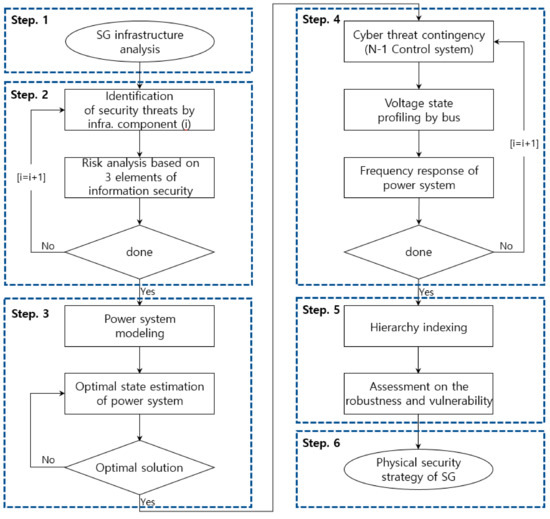
Figure 2.
Evaluation process on risk impact of cybersecurity threats.
Step 1 is the basic work to identify the evaluation targets of risk impact. It defines the components of the physical hierarchy (power system) and cyber hierarchy (information system).
Step 2 is a quantification technique from the aspect of cyber hierarchy, and the potential damage size based on the three elements of security objectives (confidentiality, integrity, availability) is determined to estimate the information security risk. The security objectives were applied to the FIPS 199 of the NIST and CIP technical standards of the NERC [19,23]. FIPS 199 defines the potential damage size based on the three elements of security objectives, as shown in Table 1. CIP-002-5.1a (critical cyber asset categorization) is a standard for estimating the values for the power facility and classifies the values grade of each component of the SG. In other words, for the information security risk, the values of the components of the SG are calculated, and then the potential damage size is determined with respect to the malfunction of the corresponding equipment. Eleven security threat elements were considered for the SG infrastructure [24]; however, in the case of the occurrence of any one of these security threats, it is simplified as a malfunction of the corresponding equipment. Here, the simplification is identical in the contingency analysis of the power system (step 4), and accordingly, the robustness-evaluation result of SG comprising two hierarchies (information and physical hierarchies) is finally derived.

Table 1.
The potential impact criteria for security objectives [17].
Step 3 estimates the optimal state of the power system by using the interior point method-based optimal power flow (IPM-OPF) to analyze the physical topology. The objective function of the IPM-OPF is to minimize the power generation costs and the AC power flow is considered as a constraint [25,26].
Objective function
Constraints
Step 4 analyzes the physical state of the power system in response to a contingency. The frequency of the power system and the voltage of each bus are profiled based on the malfunction of power facilities, such as generators and transformers, owing to cyber disturbance.
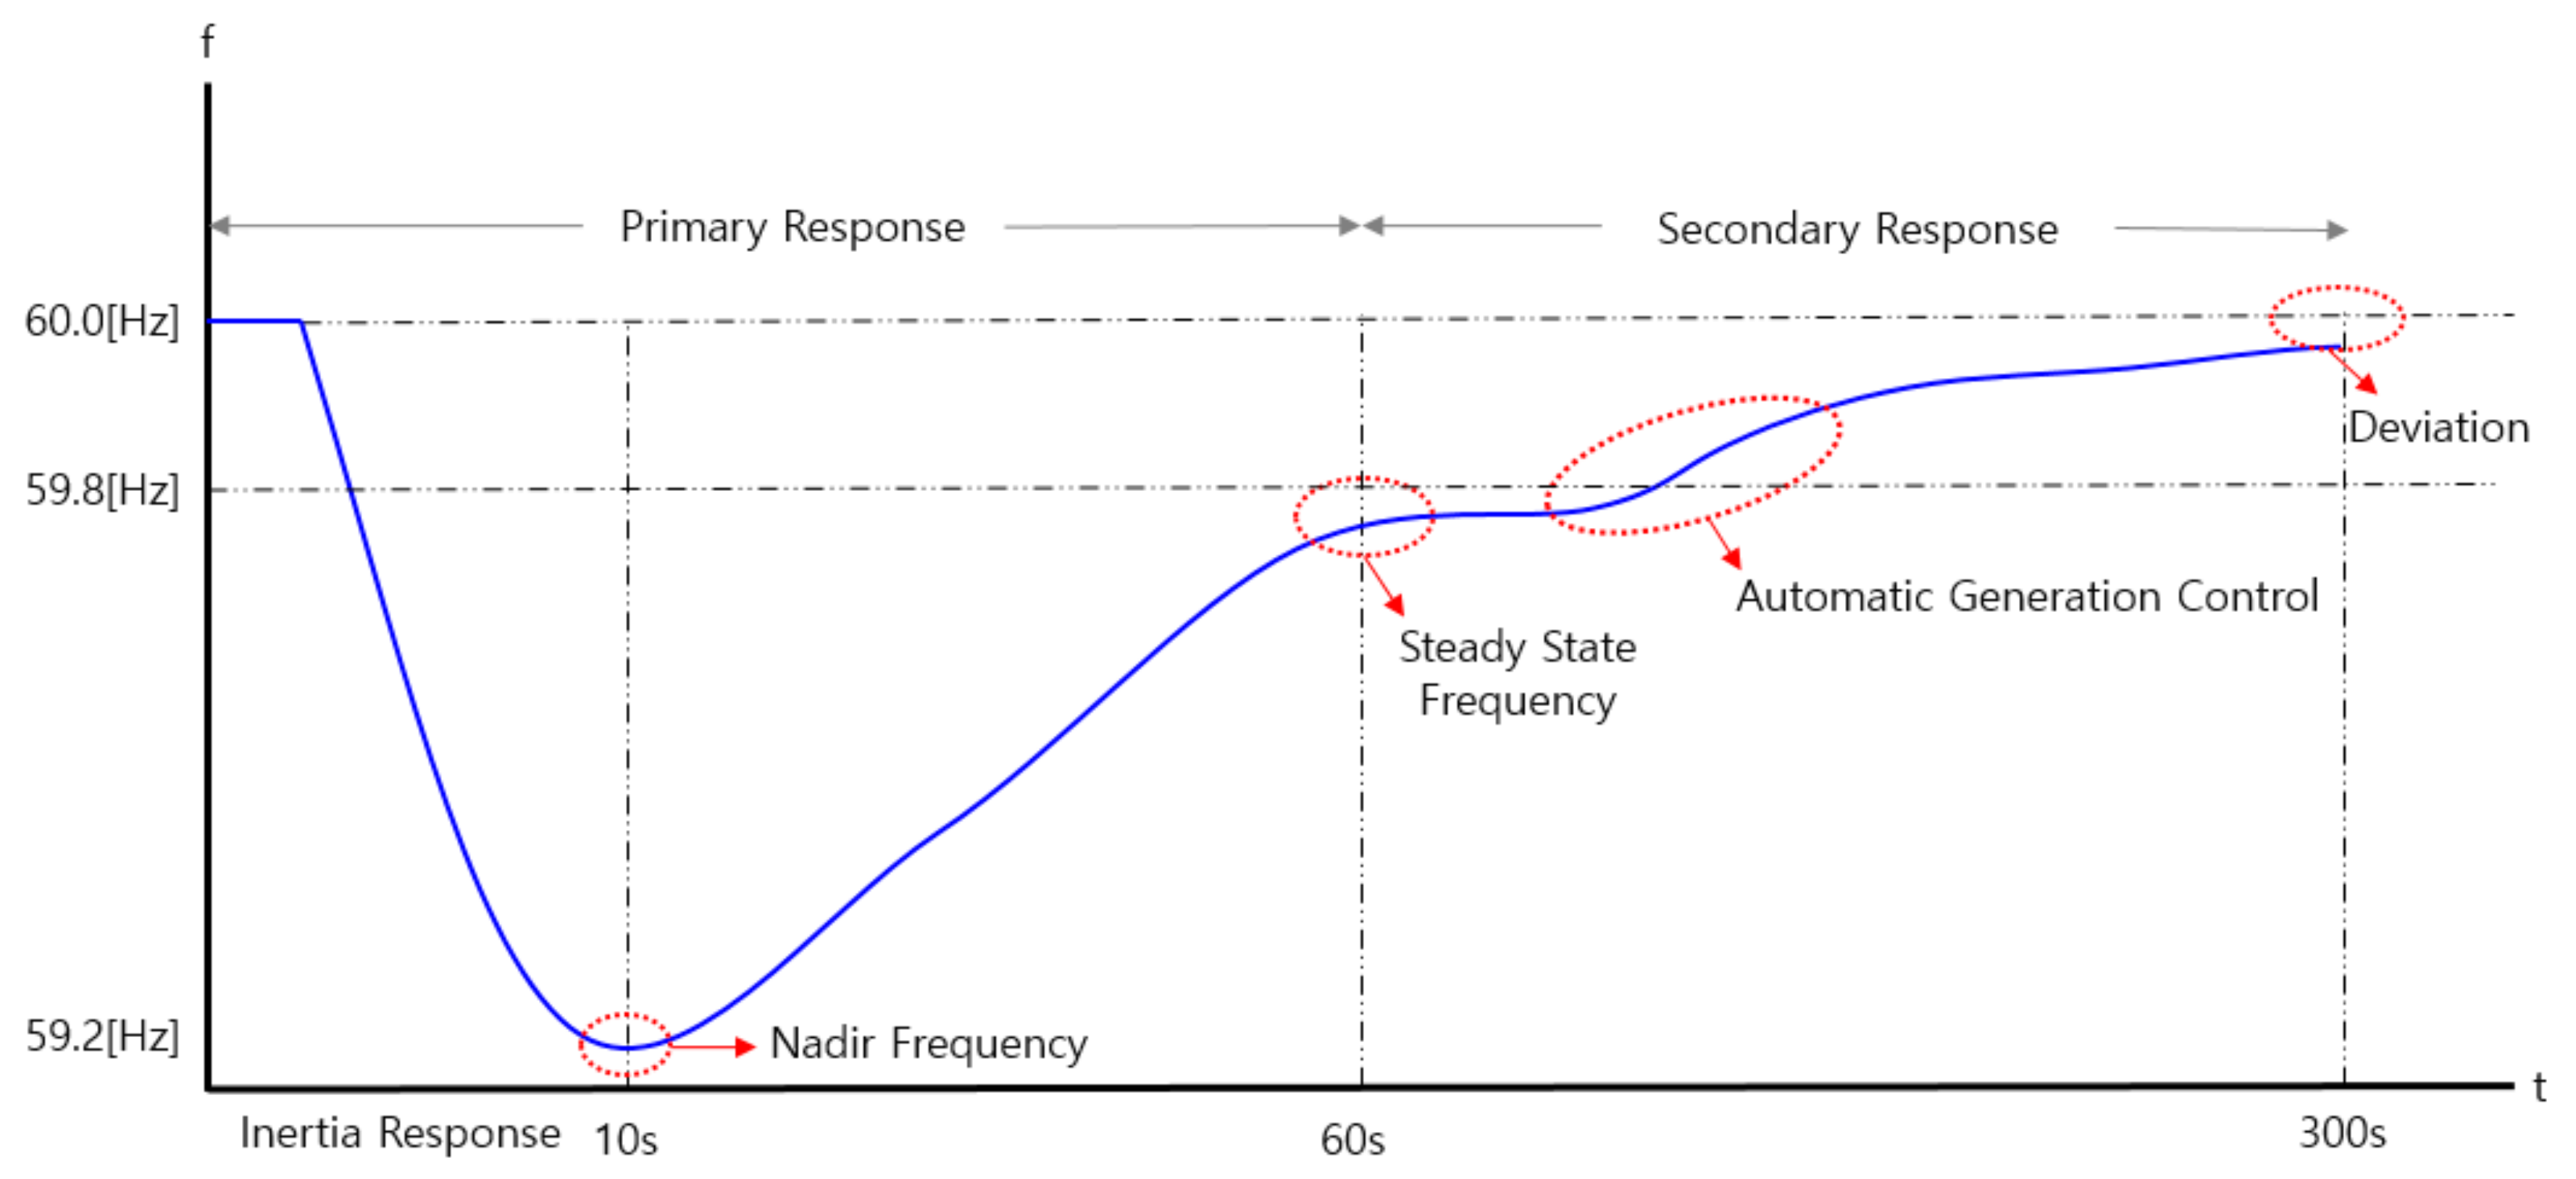
Step 5 evaluates the robustness and vulnerability of SGs by indexing the quantification results for each hierarchy. Information security risk indexing applies the result of Step 2. Frequency stability indexing rates the nadir and steady-state frequencies in the primary frequency response of the power system, as shown in Figure 3 [27]. The rating criteria (Table 2) are defined based on the electricity market regulations of Korea [14].
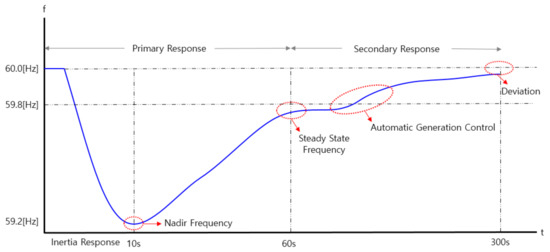
Figure 3.
Frequency response during a disturbance in a power system
Table 2.
Risk criteria of frequency stability.
Step 6 establishes a security strategy for the result of step 5 (vulnerability analysis) from the perspective of the national SG operator. However, as security strategies are a separate research field, in which technical and economic matters must be considered, the usual level of physical security countermeasures are presented according to the simulation results in this study.
4. Case Study
4.1. Simulation System Modeling and Prerequisites
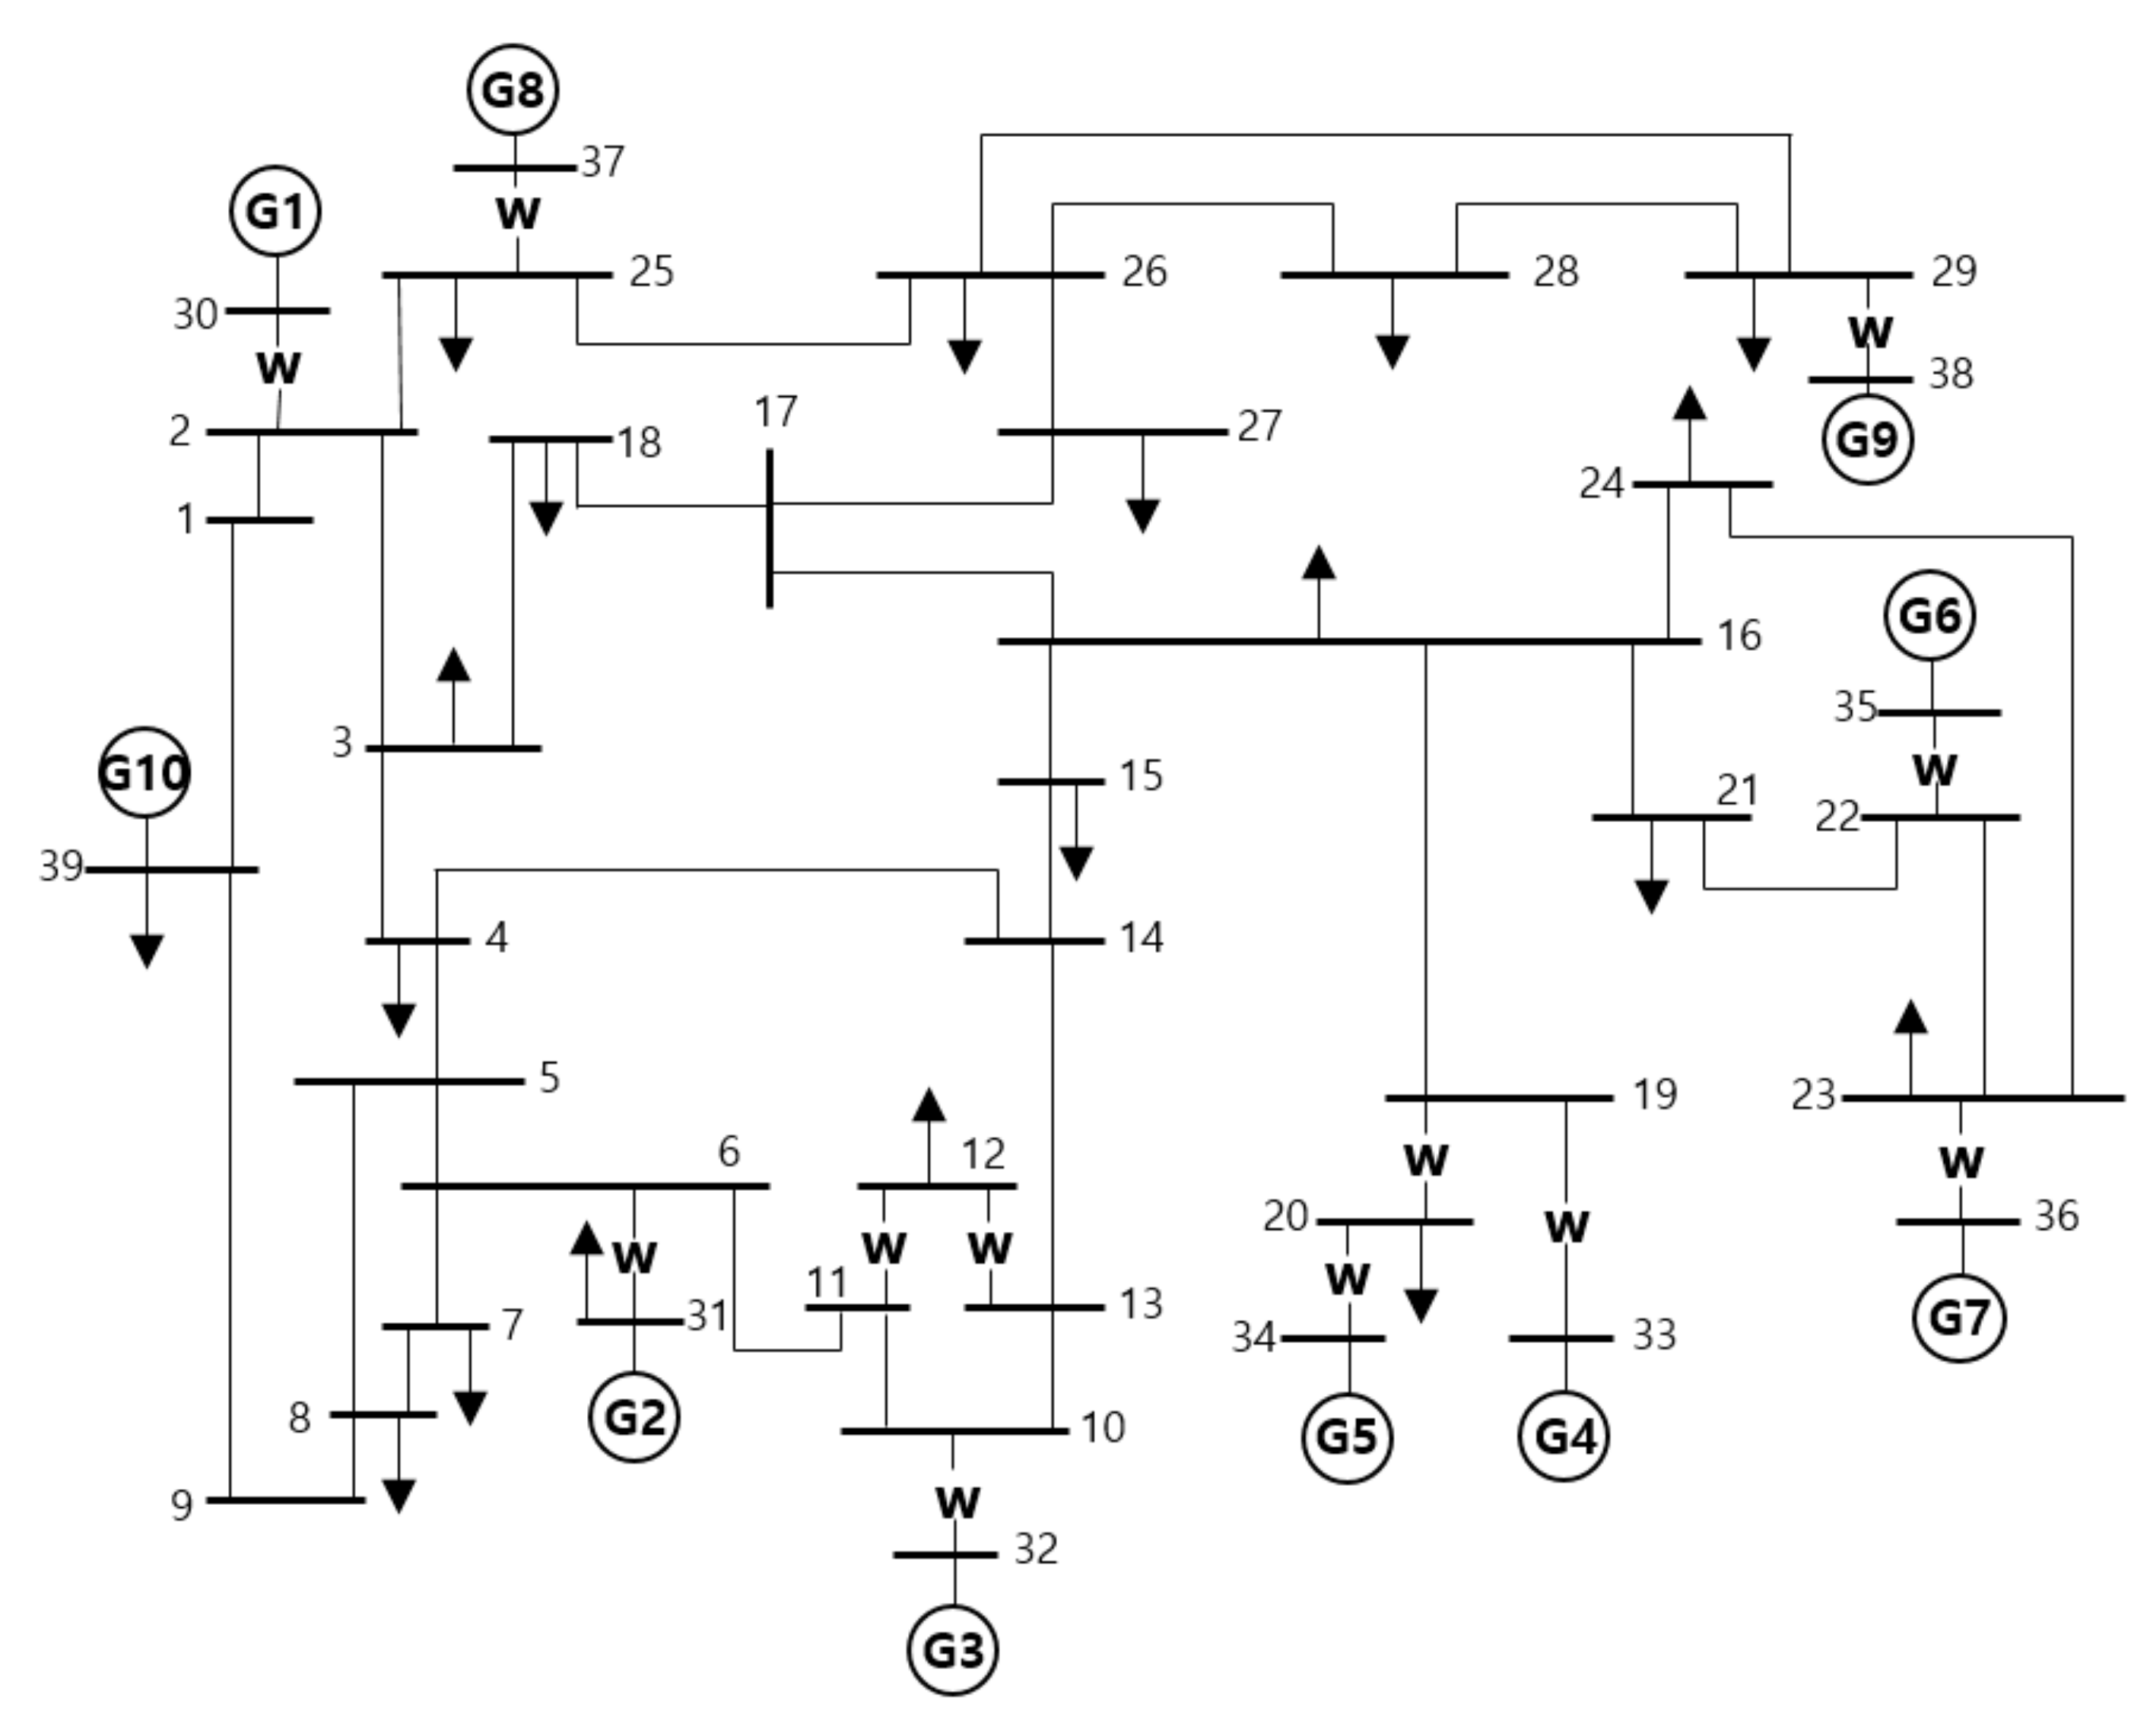
This study performed a simulation by partially modifying the IEEE RTS 39-bus [28] to verify the evaluation methodology on the risk impact of cybersecurity threats in large-scale SGs. As a modification, the generators (10 units) of the simulation system were modeled as a 560 MW thermal power generator with the same mechanical characteristics (Table 3) [29]. The load of the simulation system (modified IEEE RTS 39-bus) is summarized in Appendix A (Table A1). The simulation system for the case study is shown in Figure 4. For the quantification of the power system, this study utilizes the Fortran-based IPM-OPF computation model and the power system analysis tool PSS/E.
Table 3.
Cost coefficient and model of generator.

Figure 4.
IEEE RTS 39-bus.
① The main premise is as follows. In the simulation system, the SG components are limited to EMS and DCS, as shown in Table 4.
Table 4.
Definition of a generator in the simulated system.
② The SG security standard (FIPS 119, SGSF-121-1-1) and the reliability standard (NERC’s CIP-002) are applied for threat identification and information security risk calculation for each SG component.
③ A contingency is an N-1 level generator trip in the case of a cyber disturbance.
④ The reference frequency of the power system is the center of inertia (COI) frequency [30].
⑤ The frequency stability assessment is shown in Table 2.
4.2. Simulation Results and Analysis
The information security risk by the SG component is listed in Table 5 by applying prerequisites ① and ②. Table 5 shows the result of applying the security risk (Table 1) based on NERC’s CIP-002 (Influence on the power system by the capacity of power facilities) after identifying the security threats defined in the SG security standard (SGSF-121-1) for SG components.
Table 5.
Information security risk by SG component.
The optimal power generation of the simulation system and the frequency response characteristics due to the contingency analysis are listed in Table 6. The optimal power generation for each generator was calculated using the Fortran-based IPM-OPF computation model. The optimal power flow result is covered in the Appendix A (Table A2). For the contingency analysis, the frequency stability for each tripped generator (N-1) was evaluated according to the prerequisites ③, ④, and ⑤. In the case of the generators G1, G4, G5, G6, G7, and G8 failing, the nadir frequency of the simulation system is less than 59.3 Hz and the frequency stability is grade H severity.
Table 6.
IPM-OPF based optimal power generation and frequency response for contingency.
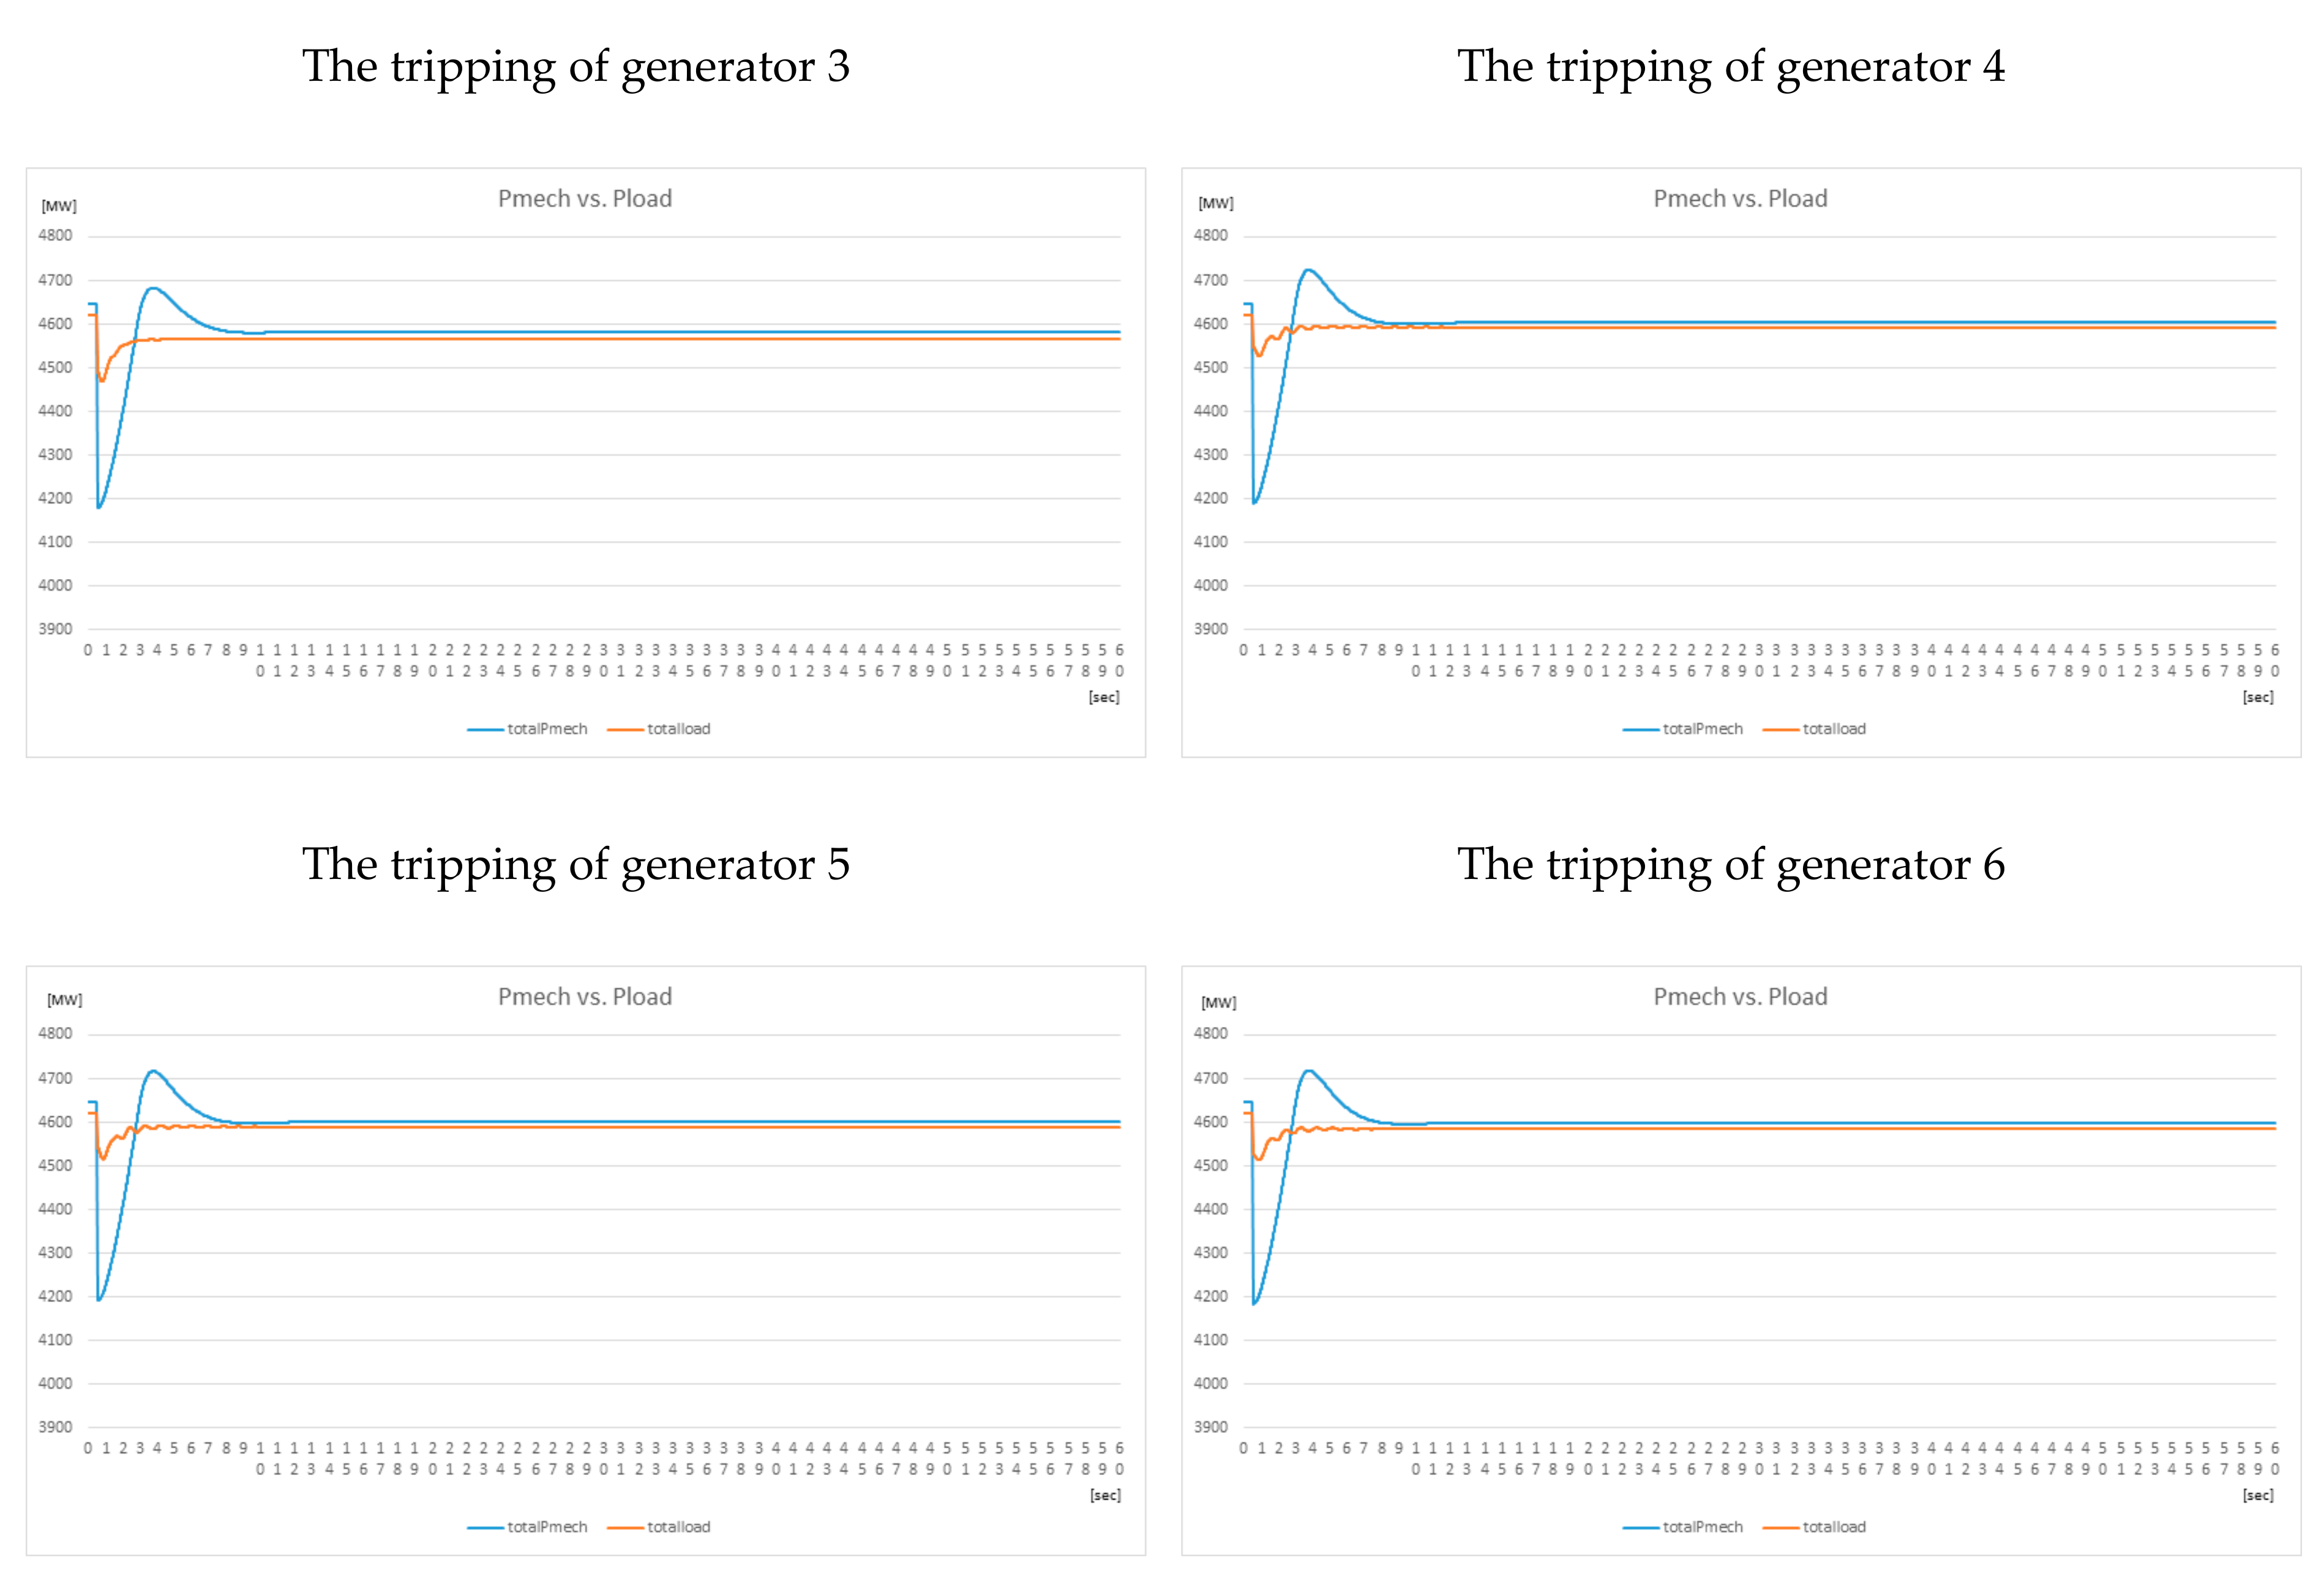
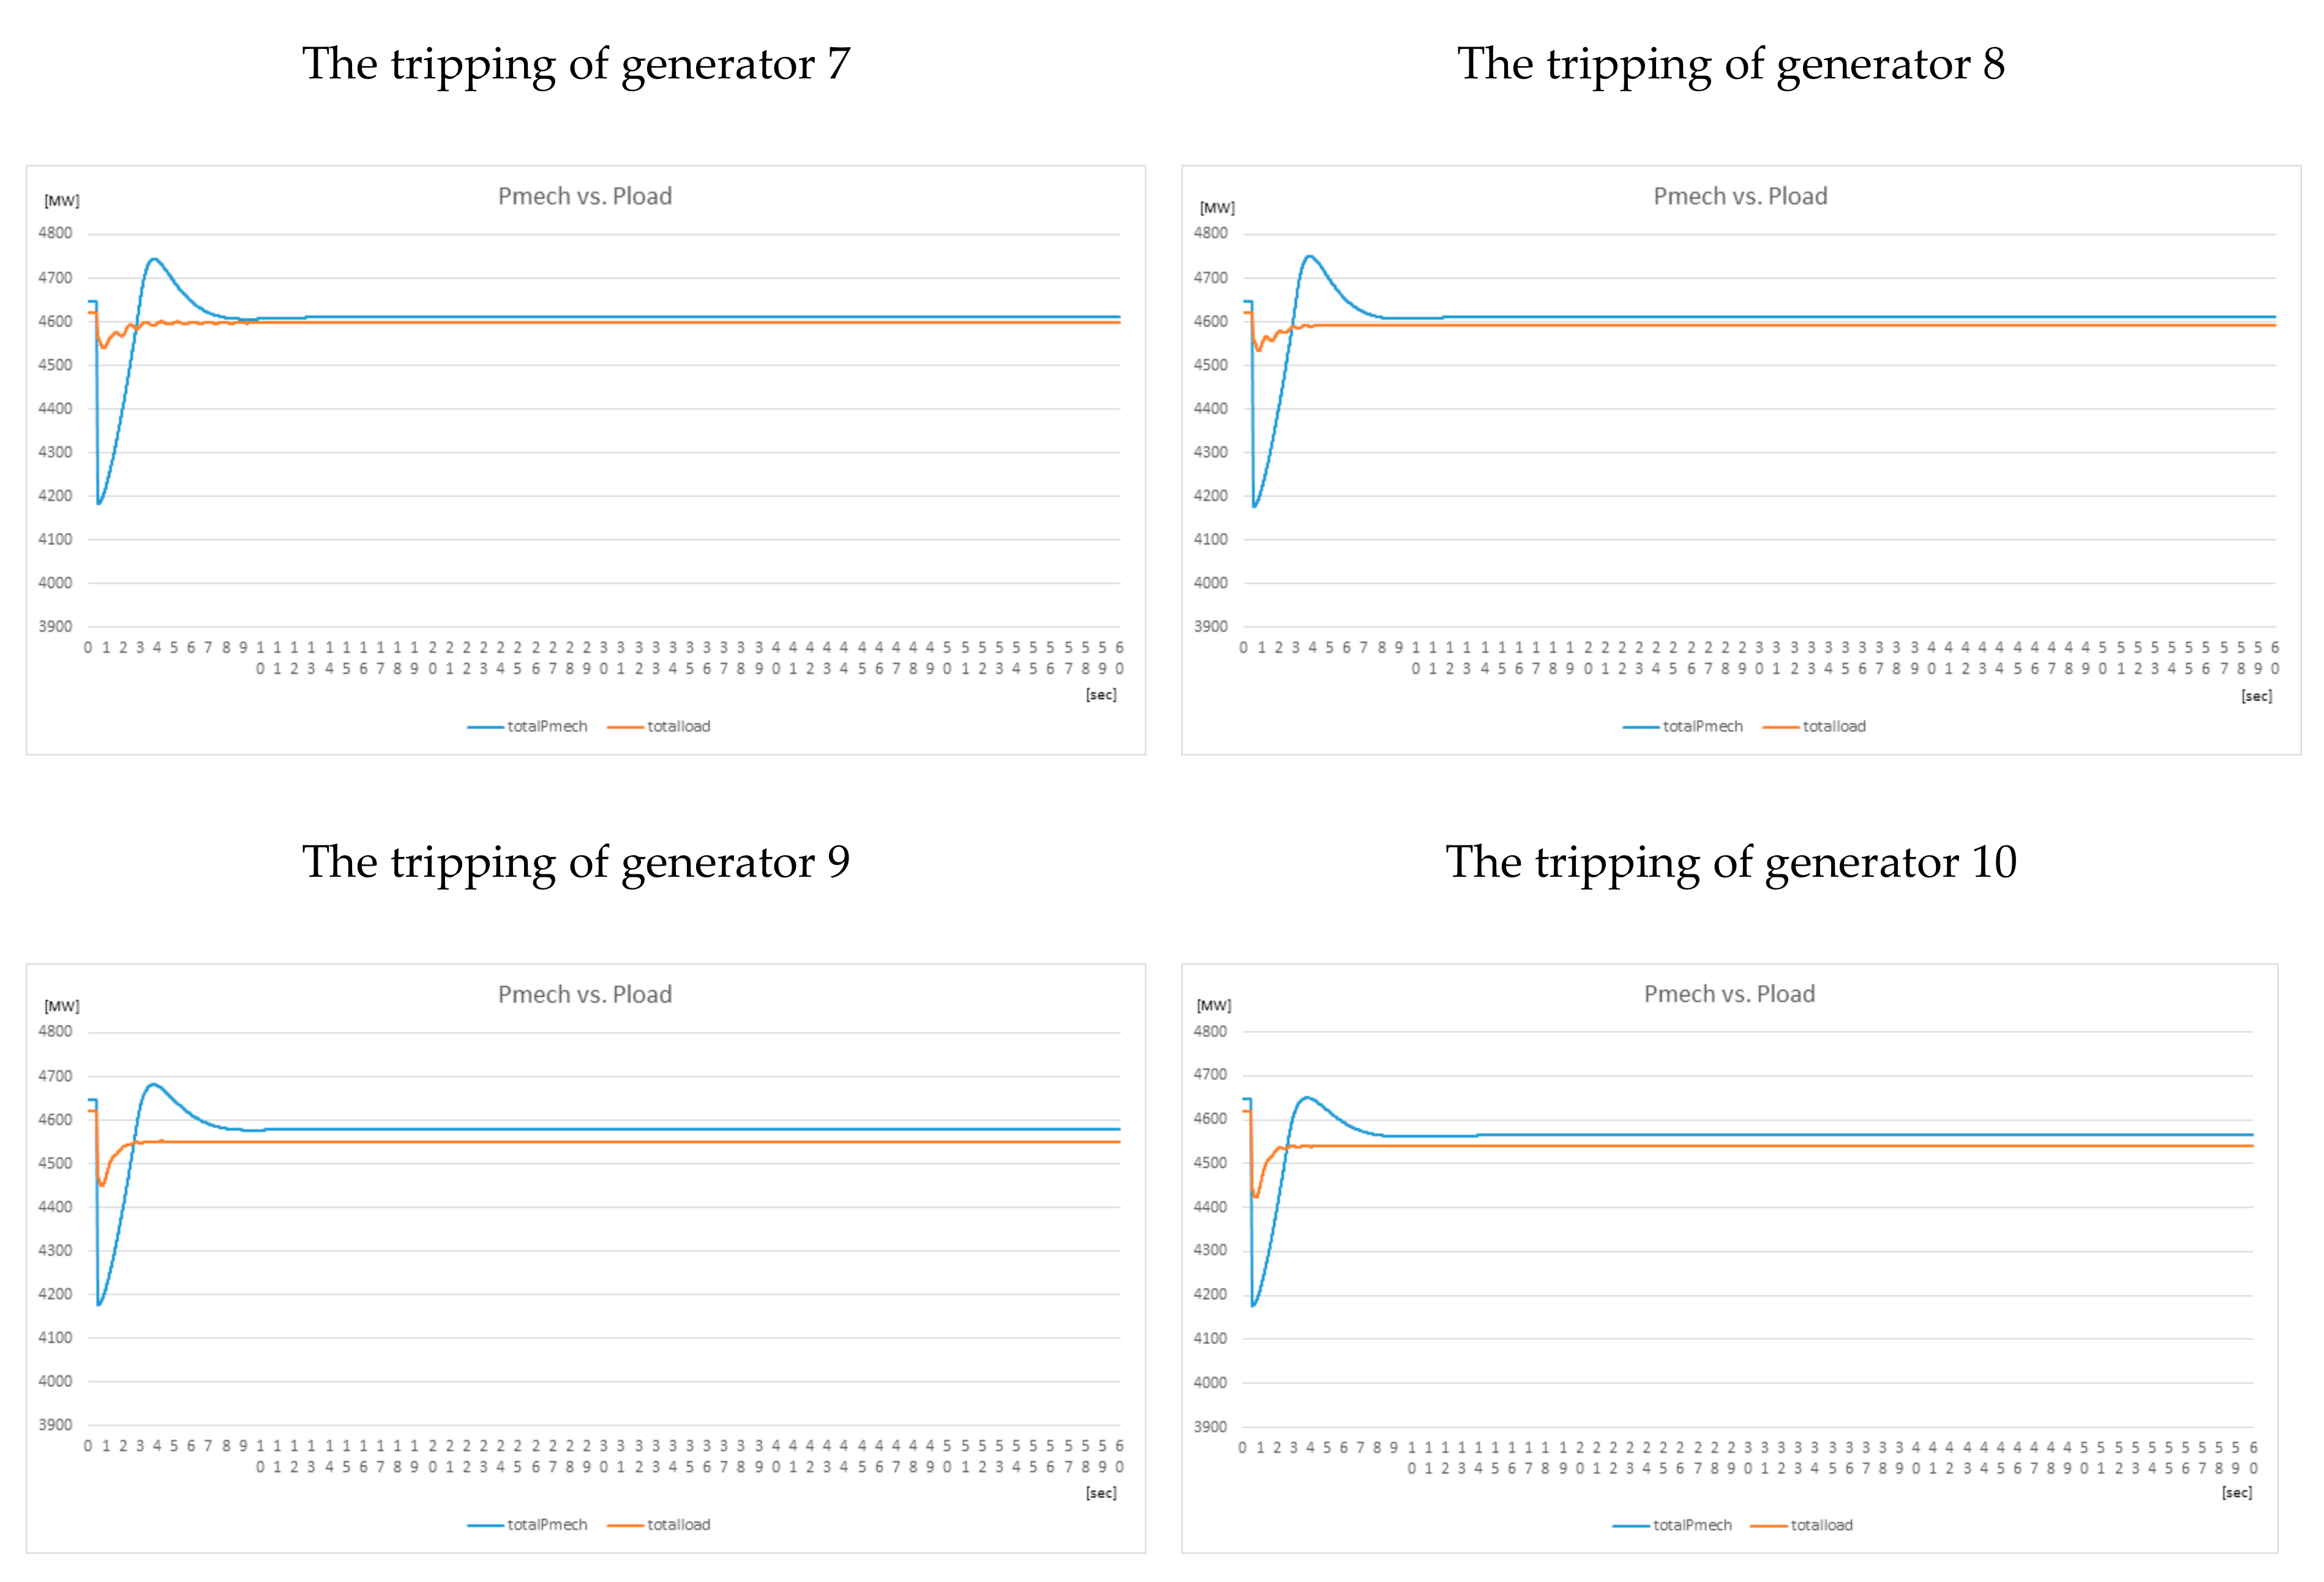
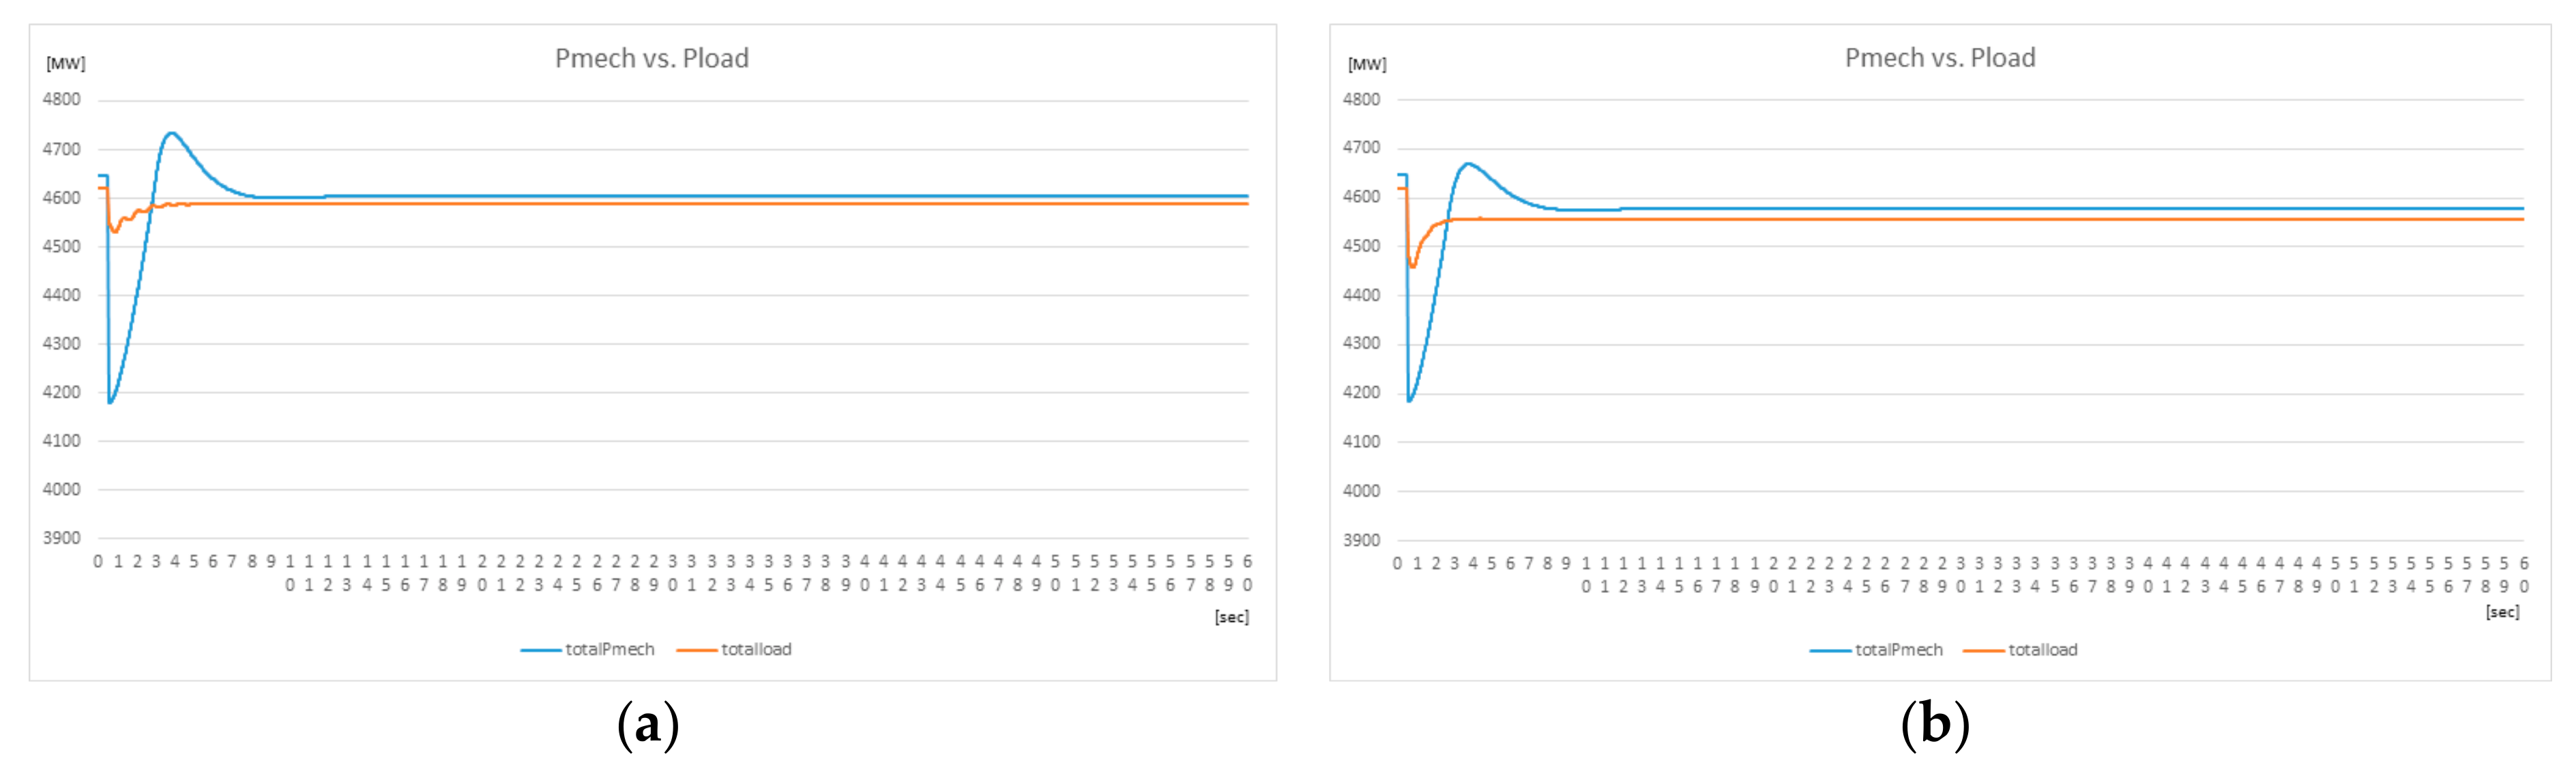
The evaluation results of robustness for the simulation system are shown in Table 7. In the tables, all DCSs except those of the EMS were calculated to be an identical grade of M for the information security risk assessment of the cyber hierarchy. This is because of the capacity-oriented potential impact assessment of the power facility. However, when the results of the frequency stability, as given in Table 6 are applied, the evaluation shows that generators G2, G3, G9, and G10 correspond to grade M, and the other generators (G1, G4, G5, G6, G7, and G8) correspond to grade H. In addition, when a generator of grade H is tripped, the imbalance in the supply and demand is larger than that in the case of grade M generators, as shown in Figure 5. The supply and demand balance graphs of the power system for the remaining generator trips are included in the Appendix A. Through this case study, we confirmed that the impact on the power system differs depending on the geographical location of the generator and transmission line configuration, even for the contingency of the generator with the same specification.
Table 7.
Result on evaluating risk impact.
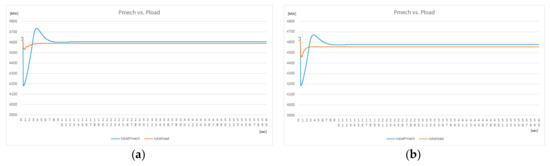
Figure 5.
(a) The tripping of generator 1. (b) The tripping of generator 2.
5. Conclusions
The power industry is discussing ways to strengthen cybersecurity as a global agenda. Accordingly, the SG infrastructure was analyzed in this study, and a method to evaluate the robustness of large-scale SGs was proposed, in terms of physical topology by cyber disturbances.
The evaluation technique for the risk impact of cybersecurity threats proposed in this paper focused on analyzing the correlation between the cyber hierarchy (information system) and the physical hierarchy (power system) and deriving the vulnerability from the perspective of physical topology through the quantification of each hierarchy. Regarding the quantification methodology for each hierarchy, a potential impact assessment based on three elements of information security, optimal state estimation based on optimal power flow, and frequency stability analysis were used. Additionally, the objectivity and effectiveness of the study results are improved by applying technical standards (NERC CIP, FIPS) to the evaluation criteria and conducting case studies based on the Modified IEEE RTS 39-bus. This study aims to present a basis for optimal decision-making when establishing security countermeasures from the point of view of the national SG operator. A follow-up study requires specific correlation analysis of various security threats and SG infrastructure as well as case studies based on a testbed. This is expected to produce more significant results.
Author Contributions
Conceptualization, P.-S.W. and B.H.K.; methodology, software, and writing—original draft, P.-S.W.; supervision, B.H.K. All authors have read and agreed to the published version of the manuscript.
Funding
This work was supported by the National Research Foundation (NRF) grant funded by the Korea government (MSIT; Ministry of Science and ICT), grant number 2019R1F1A1059824.
Conflicts of Interest
The authors declare no conflict of interest.
Nomenclature
| Set of generators in bus i | |
| Set of buses | |
| Bus No. | |
| Transmission line No. | |
| Generator No. | |
| Active power of bus i | |
| Reactive power of bus i | |
| Conductance of line l | |
| Susceptance of line l | |
| Shunt capacitance of line l | |
| Capacity of active power in transmission line l | |
| Capacity of reactive power in transmission line l | |
| Active power of generator m in bus i | |
| Reactive power of generator m in bus i | |
| Phase angle of bus i | |
| Voltage level of bus i | |
| Cost function of generator m in bus i | |
| Center of inertia frequency (reference frequency of the power system) | |
| Inertia constant of generator i (H = 3.141) | |
| Frequency of generator i Hz |
Appendix A
Table A1.
Load data of modified IEEE RTS 39-bus.
Table A1.
Load data of modified IEEE RTS 39-bus.
| Bus No. | Load | Bus No. | Load | ||
|---|---|---|---|---|---|
| Active Power MW | Reactive Power Mvar | Active Power MW | Reactive Power Mvar | ||
| Bus 3 | 300 | 2.4 | Bus 23 | 200 | 84.6 |
| Bus 4 | 400 | 184 | Bus 24 | 300 | −92.2 |
| Bus 7 | 100 | 84 | Bus 25 | 200 | 47.2 |
| Bus 8 | 400 | 153 | Bus 26 | 100 | 17 |
| Bus 12 | 10 | 88 | Bus 27 | 300 | 75.5 |
| Bus 15 | 300 | 153 | Bus 28 | 200 | 27.6 |
| Bus 16 | 300 | 32.3 | Bus 29 | 300 | 26.9 |
| Bus 18 | 100 | 30 | Bus 31 | 10 | 4.6 |
| Bus 20 | 400 | 103 | Bus 39 | 500 | 250 |
| Bus 21 | 200 | 115 | |||
Table A2.
Optimal power flow result.
Table A2.
Optimal power flow result.
| Bus i | Bus j | Capacity MW | Power Flow MW | Bus i | Bus j | Capacity MW | Power Flow MW | Bus i | Bus j | Capacity MW | Power Flow MW |
|---|---|---|---|---|---|---|---|---|---|---|---|
| 1 | 2 | 600 | −65.66 | 9 | 39 | 900 | −35.89 | 19 | 33 | 900 | −455.63 |
| 1 | 39 | 1000 | 65.66 | 10 | 11 | 600 | 204.39 | 20 | 34 | 900 | −453.78 |
| 2 | 3 | 500 | 406.53 | 10 | 13 | 600 | 262.48 | 21 | 22 | 900 | −445.55 |
| 2 | 25 | 500 | −4.71 | 10 | 32 | 900 | −466.87 | 22 | 23 | 600 | 16.15 |
| 2 | 30 | 900 | −467.69 | 11 | 12 | 500 | −7.86 | 22 | 35 | 900 | −463.25 |
| 3 | 4 | 500 | 40.15 | 12 | 13 | 500 | −2.14 | 23 | 24 | 600 | 275.85 |
| 3 | 18 | 500 | 64.32 | 13 | 14 | 600 | 260.03 | 23 | 36 | 900 | −459.71 |
| 4 | 5 | 600 | −189.86 | 14 | 15 | 600 | 89.07 | 25 | 26 | 600 | 257.58 |
| 4 | 14 | 500 | −170.12 | 15 | 16 | 600 | −211.07 | 25 | 37 | 900 | −462.37 |
| 5 | 6 | 1200 | −388.48 | 16 | 17 | 600 | 213.25 | 26 | 27 | 600 | 123.92 |
| 5 | 8 | 900 | 198.34 | 16 | 19 | 600 | −505.52 | 26 | 28 | 600 | 40.12 |
| 6 | 7 | 900 | 266.81 | 16 | 21 | 600 | −245.09 | 26 | 29 | 600 | −8.45 |
| 6 | 11 | 480 | −196.04 | 16 | 24 | 600 | 25.73 | 28 | 29 | 600 | −159.95 |
| 6 | 31 | 1800 | −459.57 | 17 | 18 | 600 | 35.74 | 29 | 38 | 1200 | −468.75 |
| 7 | 8 | 900 | 166.31 | 17 | 27 | 600 | 176.73 | ||||
| 8 | 9 | 900 | −35.86 | 19 | 20 | 900 | −53.75 | ||||
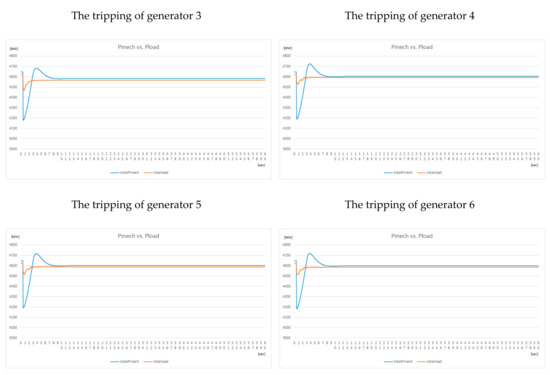
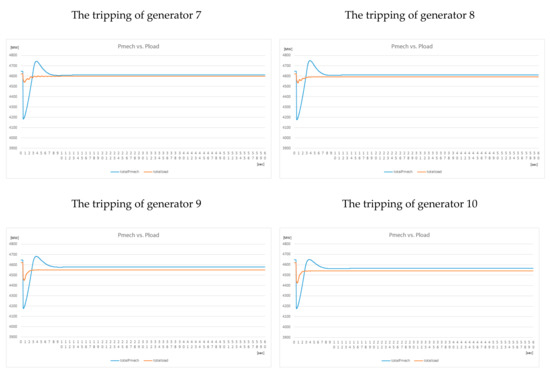
Figure A1.
Balance of supply and demand based on the tripping of generators.
Figure A1.
Balance of supply and demand based on the tripping of generators.
References
- U.S.-Canada Power System Outage Task Force. Blackout in the United States and Canada: Causes and Recommendations; Final Report; The U.S. Department of Energy: Washington, DC, USA; Naural Rescources Canada: Ottawa, ON, Canada, April 2004. [Google Scholar]
- National Intelligence Service; Ministry of Science and ICT; Ministry of the Interior and Safety; Korea Communications Commission; Financial Services Commission. National Information Protection White Paper; Korea, June 2019; Volume 2019, pp. 141–143. [Google Scholar]
- FireEye, Inc. Cyber Defense Live 2019. Available online: http://www.fireeyeday.com/ (accessed on 3 June 2020).
- Woo, P.-S.; Kim, B.H. An Evaluation Methodology of Security Concerning Cyber Risk for Smart Grid Based on OPF. In Proceedings of the 50th KIEE Summer Conference, Goseong, Korea, 10–13 July 2019; Volume 2019. [Google Scholar]
- Black Hat. Black Hat USA 201. Available online: https://www.blackhat.com/ (accessed on 8 June 2020).
- Aminifar, F.; Fotuhi-Firuzabad, M.; Shahidehpour, M.; Safdarian, A. Impact of WAMS Malfunction on Power System Reliability Assessment. IEEE Trans. Smart Grid 2012, 3, 1302–1309. [Google Scholar] [CrossRef]
- Hahn, A.; Ashok, A.; Sridhar, S.; Govindarasu, M. Cyber-Physical Security Testbeds: Architecture, Application, and Evalutiaon for Smar Grid. IEEE Trans. Smart Grid 2013, 4, 847–855. [Google Scholar] [CrossRef]
- Davis, K.R.; Davis, C.M.; Zonouz, S.A.; Bobba, R.B.; Berthier, R.; Garcia, L.; Sauer, P.W. A Cyber-Phsysical Modeling and Assessment Framework for Power Grid Infrastructures. IEEE Trans. Smart Grid 2015, 6, 2464–2475. [Google Scholar] [CrossRef]
- Xie, L.; Mo, Y.; Sinopoli, B. Integrity Data Attacks in Power Market Operations. IEEE Trans. Smart Grid. 2011, 2, 659–666. [Google Scholar] [CrossRef]
- Adhikari, U.; Morris, T.; Pan, S. WAMS Cyber-Physical Test Bed for Power System, Cybersecurity Study, and Data Mining. IEEE Trans. Smart Grid 2017, 8, 2744–2753. [Google Scholar] [CrossRef]
- Huang, G.; Chen, C.; Guo, C. Cyber-Constrained Optimal Power Flow Model for Smart Grid Resilience Enhancement. IEEE Trans. Smart Grid 2019, 10, 5547–5555. [Google Scholar] [CrossRef]
- Shayan, H.; Amraee, T. Network Constrained Unit Commitment Under Cyber Attacks Driven Overloads. IEEE Trans. Smart Grid 2019, 10, 6449–6460. [Google Scholar] [CrossRef]
- Woo, P.-S.; Kim, B.H. Establishment for Cyber Security Countermeasure about Structure of Power Control System. Trans. Korean Inst. Electr. Eng. 2018, 67, 1577–1586. [Google Scholar]
- Korea Power Exchange. Electricity Market Rule 2020; Korea Power Exchange: Naju, Korea, 2020. [Google Scholar]
- Korea Electrotechnology Research Institute. A Study on Estimation of Generator Start-up Cost and Improvement of Application Standard; Korea Power Exchange: Seoul, Korea, 2012. [Google Scholar]
- Zhu, K.; Nordstrom, C.L. ICT Architecture Impact on Wide Area Monitoring and Control Systems’ Reliability. IEEE Trans. Power Deliv. 2011, 26, 2801–2808. [Google Scholar] [CrossRef]
- National Institute of Standards and Technology. NISTIR 7628-Guidelines for Smart Grid Cyber Security; U.S. Deparment of Commerce: Washington, DC, USA, 2010. [Google Scholar]
- National Institute of Standards and Technology. NIST Framework and Road Map for Smart Grid.Interoperability Standards; Release 1.0.; U.S. Deparment of Commerce: Washington, DC, USA, 2010. [Google Scholar]
- The North American Electric Reliability Council. NERC CIP(Critical Infrastructure Protection); Atlanta, GA, USA, 2020. [Google Scholar]
- The Energy Sector Control System Working Group. Roadmap to Achieve Energy Delivery Systems.Cybersecurity; U.S. Department of Energy: Washington, DC, USA, 2011. [Google Scholar]
- Wood, A.J.; Woollenberg, B.F.; Sheblé, G.B. Power, Generation, Operation, and Control, 3rd ed.; Wiley: Hoboken, NJ, USA, 2013. [Google Scholar]
- Kim, Y.-C.; Jae-Kook, Y. Blackout and Power System Operation; Book Korea: Gyeonggi-do, Korea, 2015. [Google Scholar]
- National Institute of Standards and Technology. Standards for Security Categorization of Federal Information and Information Systems (FIPS 199); U.S. Deparment of Commerce: Washington, DC, USA, 2004. [Google Scholar]
- Korea Smart Grid Association. Requirements for Ensuring of Smart Grid Standards (SGSF-121-1); Korea Smart Grid Association: Seoul, Korea, 2014. [Google Scholar]
- Kim, B.H. A Study on Optimal Power Flow Using Interior Point Method. Trans. Korean Inst. Electr. Eng. 2005, 54, 457–460. [Google Scholar]
- Cain, M.B.; O’Neill, R.P.; Castillo, A. History of Optimal Power Flow and Formulations; Federal Energy Regulatory Commission: Washington, DC, USA, 2012. [Google Scholar]
- Park, M.-S.; Kim, W.-J.; Chun, Y.-H. Calculation of Primary Reserve Requirements Based on Measurements. of Frequency Trajectories of Korean Power System. Trans. Korean Inst. Electr. Eng. 2019, 68, 399–404. [Google Scholar] [CrossRef]
- Athay, T.; Podmore, R.; Virmani, S. A Practical Method for the Direct Analysis of Transient Stability. IEEE Trans. Power Appar. Syst. 1979, PAS-98, 573–987. [Google Scholar] [CrossRef]
- Siemens Industry, Inc. PSS/E Model. Library; Siemens Power Technology International: New York, NY, USA, 2009. [Google Scholar]
- Ørum, E.; Kuivaniemi, M.; Laasonen, M.; Bruseth, A.I.; Jansson, E.A.; Danell, A.; Elkington, K.; Modig, N. Future System Inertia. ENTSO-E; European Commission: Brussels, Belgium, 2015. [Google Scholar]
Publisher’s Note: MDPI stays neutral with regard to jurisdictional claims in published maps and institutional affiliations. |
© 2020 by the authors. Licensee MDPI, Basel, Switzerland. This article is an open access article distributed under the terms and conditions of the Creative Commons Attribution (CC BY) license (http://creativecommons.org/licenses/by/4.0/).