


Abstract
According to the United Nations report, climate disasters have intensified in the past 20 years, and China has the largest number of disasters in the world. So the study of meteorological disaster governance capacities is critically important for China. We designed a meteorological disaster governance capacity evaluation system to calculate the evaluation values by using the generalized λ-Shapley Choquet integral, a method that considers the interaction between indicators. We used various official statistical yearbooks and internal data of China Meteorological Administration (CMA) and weight intervals set by meteorologists for each level of indicators to calculate the evaluation values of meteorological disaster governance capacity in mainland provinces, from 2014 to 2018. We compared them with other methods (entropy weight method, Technique for Order Preference by Similarity to an Ideal Solution (TOPSIS), and Analytic Hierarchy Process (AHP)), and the results showed that the results calculated by the designed interaction method provided in this paper are more stable and differentiated. The results show that provincial meteorological disaster governance capacities in Mainland China are characterized by uneven development and a pro-slight polarization phenomenon. This leads to policy recommendations: Provinces should strengthen the construction of meteorological disaster information; provinces with outstanding capacity must strengthen the experience sharing with provinces with lower capacity.
1. Introduction
In recent years, drastic climate change and various meteorological disasters have occurred frequently, seriously threatening the survival and development of human beings all over the world. China is located in the middle of two major natural disaster belts globally, namely the Northern Hemisphere Mid-Latitude Disaster Belt and the Pacific Rim Disaster Belt. It is one of the most severely impacted countries in the world by natural disasters. Meteorological disasters account for more than 70% of all-natural disasters occurring in China [1]. The economic losses brought by meteorological disasters account for about 2/3 of the financial losses from natural disasters [2]. China’s annual average direct economic loss caused by meteorological disasters has increased from less than 100 billion yuan in the 1950s to more than 300 billion yuan in the 21st century [3], such as direct economic losses of 503.29 billion yuan in 2016 [4], and financial losses caused by meteorological disasters of up to 318 billion yuan in 2019 [5]. Meanwhile, China’s natural disaster prevention and control capacity are generally weak. It is urgent and essential to improve the governance capacity of natural disasters, primarily meteorological disasters, which is a significant issue related to people’s safety, lives, properties, and national security.
Many scholars have now made many studies on meteorological hazards in China. Most of these papers have accumulated in the areas of individual meteorological hazards, such as floods and droughts [6,7,8], typhoons [9], and other more homogeneous meteorological hazards, or in terms of individual geographical divisions, such as the Yangtze River Delta [10,11], the Maritime Silk Road [9], and Southern China [12]. There are certainly some excellent review articles that finely sort out the meteorological hazard situation in China [13] and explore research methods [14]. However, these studies are often based on one or a few meteorological hazards or limited to a particular geographical area. In contrast, very few studies have been conducted on meteorological disaster governance capacity from Mainland China or have explored the concept of governance. Nowadays, China is paying more and more attention to improving and strengthening meteorological disaster governance capacity, and higher requirements have been put forward in disaster emergency response [15]. Exploring the meteorological disaster governance capacity in Mainland China from a national perspective is the theoretical starting point of this paper and the starting point of this paper in collaboration with the China Meteorological Administration. Meteorological disaster governance capacity is a comprehensive capacity and we often use multi-attribute decision-making (MADM) in studying it with these attributes. Therefore, in this paper, we establish the evaluation model of meteorological disaster governance capability, considering the interaction of attributes to study the meteorological disaster governance capability.
This paper establishes a meteorological disaster governance capacity assessment index system, in which the data are obtained from significant yearbooks (“China Statistical Yearbook”, “Yearbook of Meteorological Disasters in China”, “China Civil Affair Statistical Yearbook—Statistics of China Social Services”, and “China Agriculture Yearbook”) and the data of meteorological modernization indicators given by the Bureau of Meteorology. The setting of exact weights is not easy, and therefore, in this paper, the interval assignment of weights is adopted, and we set weight intervals for each indicator based on experts’ experience in each meteorological field. The fuzzy multi-attribute decision evaluation method was then used to derive each provincial area’s evaluation results [16,17]. However, the simple weighted average cannot capture the indicators’ redundancy and synergy [18,19]. When evaluating meteorological disaster governance capacity using fuzzy multi-attribute decision-making methods, it cannot merely be assumed that the attributes are independent of each other. Many scholars have agreed that the assumption of independence between attributes is inappropriate in decision-making problems [20,21,22]. Therefore, this paper proposes a multi-attribute evaluation method that considers the interaction between attributes to evaluate each province’s meteorological disaster governance capacity. Moreover, this paper considers the case that the attribute weights are not entirely known, uses Shapley integral and λ-fuzzy measure to reduce the difficulty of solving the fuzzy measure problem, and finally uses the Choquet integral to derive the final evaluation value [23,24]. Fuzzy measures give up additivity compared to traditional probability measures, so they have a more comprehensive range of monotonicity and are more consistent with human inference when solving problems [25,26,27]. The Choquet integral proposed by the French scientist Choquet can deal well with the issue of correlations existing between attributes in comprehensive evaluation problems [28] and is widely used in the field of multi-attribute decision-making [29,30].
In Section 2, we construct a meteorological disaster governance capacity indicator system. In Section 3, we build a meteorological disaster governance model, considering the interaction of attributes. In Section 4, the indicator data and the weight intervals given by the experts’ experience are brought into the model to calculate the results, and the results are compared with entropy weight method, Technique for Order Preference by Similarity to an Ideal Solution (TOPSIS), and Analytic Hierarchy Process (AHP) methods. In Section 5, we analyze the results and propose corresponding policy recommendations.
2. Meteorological Disaster Governance Capacity and Index System Construction
2.1. Analysis of Meteorological Disaster Governance Capacity
Meteorological disasters have the characteristics of general natural disasters, i.e., the damage caused varies according to the amount and speed of material and energy movement; the topography of the region and other factors can cause the amount and intensity of material and energy movement to change in different locations in the area; various disaster-bearing bodies have additional resilience to different materials and energy, and the length of the disaster process is related to the level of post-disaster recovery. According to the essential elements of catastrophe, we can summarize the key to reduce disaster losses. That is, disaster prevention infrastructure, construction planning or construction input based on careful consideration of disaster prediction, regional topography, and characteristics of disaster-bearing bodies for several years in the future; rapid and accurate disaster risk zoning based on sudden meteorological disaster prediction, topography, and other factors; precise disaster risk-reduction suggestions; and establishment of the development-oriented disaster recovery system.
In recent years, China has actively pushed governments at all levels to improve their disaster governance capabilities. In his report to the 19th Party Congress, General Secretary Xi Jinping proposed to “enhance disaster prevention, mitigation and relief capabilities”, and has repeatedly given essential instructions on “scientific and accurate forecasting”, “implementing responsibilities, improving systems, integrating resources, and coordinating efforts to comprehensively improve national comprehensive disaster prevention, mitigation and relief capabilities”. In 2017, the China Meteorological Administration (CMA) issued the “Opinions of CMA on Strengthening Meteorological Disaster Prevention, Mitigation and Relief”, which proposed “two persistent and three transformations” as the goal of disaster governance [31].
2.2. Rating Index System Construction
In this paper, based on the characteristics and specificity of meteorological disasters, we consider the whole process of disaster governance [32,33] in conjunction with the key of disaster loss and divide meteorological disaster governance capabilities into three major categories of capabilities from the time and resource dimensions of emergency management (including the three processes of efficient prevention, timely response, and orderly recovery), as well as from the new requirements put forward by the state for disaster governance. These three categories of capabilities are then divided into ten governance capabilities, refined into 25 specific indicators, as shown in Table 1.
Table 1.
Meteorological disaster governance capacity evaluation index system.
Next, we give a detailed explanation of Table 1. We divide the description into three parts by the primary indicator:
(1) Legal construction capacity (c1) mainly focuses on constructing laws and regulations related to meteorological disasters in each local area, including the annual promulgation of standards about meteorological disaster defense, the coverage rate of meteorological disaster defense planning and the completeness rate of meteorological disaster emergency plans. The construction capacity of defense mechanisms mainly covers constructing mechanisms related to meteorological disasters, including the total number of comprehensive disaster reduction demonstration zones and the number of new ones added annually and the utilization of large-scale climate resource development projects. Currently, the capacity of defense engineering construction only has a three-level indicator of disaster relief reserve units’ total storage capacity. All three capabilities are construction and planning to cope with possible future meteorological disasters, summarized as law and building defense capability.
(2) The disaster detection capability (c2) focuses on the completeness and density of monitoring facilities, mainly examining the number of weather radar observation stations, the number of automatic weather stations, the number of lightning location detection stations and the number of satellite-data-receiving stations in each region, which are the four tertiary indicators. The disaster prediction capability targets the prediction aspect, mainly examining the accuracy of these monitoring facilities on various types of weather conditions, including the accuracy of 24-h precise rain forecasts, the advance of strong convective weather warnings, and the accuracy of heavy rainfall warnings, which are three tertiary indicators. The ability to transmit early warning information is mainly examined in the three tertiary hands of weather warning information in social units, information broadcasting media and social institutions. The disaster-related information acquisition capability focuses on the three three-level indicators: the two-way sharing rate of the meteorological information department and the deployment rate of village (community) township (street) meteorological informants and coordinators. These four capabilities are also essential elements of the meteorological modernization index system, which can be used to obtain and process information in meteorological disaster governance, the basis for accurate prediction of meteorological disasters before the disasters, and the basis for precise decision-making before tragedies occur.
(3) The remaining three secondary indicators mainly reflect timely response in disasters and post-disaster relief. The social resource mobilization capacity includes two tertiary indicators of insurance premium income and welfare lottery fund expenditure. The capacity of proactive disaster risk reduction mainly examines the reserve of meteorological disaster mitigation equipment, including two three-level indicators of available anti-aircraft guns and available rockets. Disaster relief capacity examines the medical and health services, medical and health expenditures, and the provision of shelters that the government and society can provide after a disaster. The secondary indicators of disaster relief security capacity include three tertiary indicators: the number of institutional beds per 10,000 people, local financial expenditure on health care and local per capita (10,000 yuan) expenditure on general public services. These three capacities can be summarized as disaster relief capacity (c3).
These ten indicators cover the pre-disaster, disaster and post-disaster phases of meteorological disasters and focus on the government’s pre-disaster meteorological disaster prevention capability and information technology construction, which are the requirements of the current national goal of “two insistences and three changes” in disaster governance. Meanwhile, the meteorological disaster governance capability is divided into three essential items: creating the evaluation index system. Then the three important primary indicators are refined into ten secondary indicators. The ten secondary indicators are then refined into 25 tertiary indicators, following the requirements of scientific, feasibility, hierarchy, flexibility, and dynamism of the index system.
3. Models and Computational Methods
3.1. Fuzzy Measure and Choquet Integral
Definition 1.
A fuzzy measure on a finite setis a real-valued set function defined on the powerset of N, i.e.,, satisfying the following:
- (1)
- ;
- (2)
- If and .
Definition 2.
Letbe a non-negative real-valued function defined onandbe a fuzzy measure on. The Choquet integral of the functionis defined as follows:
where.
Since the fuzzy measure is defined on the power set of a set, the number of variables in the fuzzy measure increases exponentially with the cardinality of the set. To reduce the complexity of solving and computing fuzzy measures while reflecting the interaction between evaluation indicators, Sugeno [34] proposed the λ-fuzzy measure.
Definition 3.
For any. If the fuzzy measuresatisfies the following conditions:
where, and thenis said to be a-fuzzy measure.
From Definition 3, if > 0, is said to be a superadditive measure, indicating some complementary interaction between coalitions A and B. If −1 < < 0, then is said to be a subadditive measure, indicating redundant interactions between coalition A and coalition B.
From , the value of can be determined by Equation (5), so when the value of is given, the value of can be calculated. From Equation (4), for a set with n elements, only n values need to be determined to obtain the fuzzy measure of any subset of the set . If , then = 0.
3.1.1. Determination of Attribute Weights
Since we cannot give each indicator a substantial weight, we get only partial weights more often than not. In this paper, we consider the interaction between the attributes by utilizing the Shapley value to build a mathematical model and then find the optimal fuzzy measure on the set of attributes. The Shapley function is one of the most critical allocation indicators in cooperative games, denoted as follows:
3.1.2. Generalized λ-Shapley Choquet Integral
The Shapley value can be applied to multi-attribute decision-making to express the importance coefficient of each indicator [35], which is defined by the equation:
where is a fuzzy measure on .
We consider the importance and relevance of the combination of elements globally according to the generalized λ-Shapley Choquet integral defined by Meng [21]. The λ-fuzzy measure on the set is first given, denoted as:
From Equation (4), if , then we have the following:
Combining with Definition 2, we define the arithmetic generalized λ-Shapley Choquet integral formula [23] as follows:
where .
3.2. Meteorological Disaster Governance Capability Evaluation Method Based on λ-Shapley Choquet Integral
The multi-attribute evaluation method used in this paper considers the interaction between attributes. When the weights of the attributes are unknown or partially known, the weights of the attributes are determined first, and then the capability evaluation values are calculated.
The optimal fuzzy measurement model on the attribute set C is established as follows:
where is the Shapley value of , is a fuzzy measure on , and is the range of values of .
The in the model is replaced by the original TOPSIS value in this paper. The calculation steps of the original TOPSIS value are rough, as follows:
(1) Normalize the original data. All the data in this paper are benefit-based indicators, so they do not need to be normalized. For cost-based indicators, they need to be normalized.
(2) Use the maximum value of each indicator as to the positive ideal solution and the minimum value as the negative ideal solution , and then find the distance and for each evaluation value and positive ideal solution and negative ideal solution.
(3) Calculate the integrated value of the ith evaluation object:.
Because the original TOPSIS does not need to add weights when calculating positive and negative ideal solutions, this paper uses the Shapley value as weights in the Model (10).
The steps for evaluating the meteorological disaster governance capacity of provinces in Mainland China with incomplete weight information and interactions between 2014–2018 are given below:
Step 1: Using the optimal fuzzy measure linear programming Model (10) to find the fuzzy measure of the sub-criteria level, the fuzzy measure is expressed by and brought into Equation (4) to solve for λ. Then, the λ-fuzzy measure is calculated according to Equation (3), and the generalized Shapley value of the tertiary index is found using Equations (7) and (8).
Step 2: The generalized λ-Shapley Choquet integral formula is used to calculate the third-level indicators’ data to obtain the second-level indicators’ evaluation value.
Step 3: As in Step 1, the generalized Shapley values of the second-level indicators are calculated by bringing the second-level indicators into the Model (10), and then, as in Step 2, the first-level indicator values are calculated.
Step 4: Similar to Step 3, the comprehensive evaluation value is calculated.
Step 5: Finally, repeat Steps 1–4 to calculate each province’s comprehensive evaluation value from 2014 to 2018.
4. Evaluation Value Calculation and Method Comparison
4.1. Evaluation of Provincial Meteorological Disaster Governance Capacity in Mainland China
In this paper’s indicator system, the data of the three-level indicators are obtained from significant yearbooks (“China Statistical Yearbook”, “Yearbook of Meteorological Disasters in China”, “China Civil Affair Statistical Yearbook—Statistics of China Social Services”, and “China Agriculture Yearbook”) and the data of meteorological modernization indicators given by the Bureau of Meteorology. Based on the interval weights drawn up by experts for each level of indicators, the provinces’ meteorological disaster governance capacity in Mainland China from 2014 to 2018 was then evaluated by the model presented in Section 3. The meteorological experts’ weight intervals for the indicators given for each level are shown in Table 2.
Table 2.
Weight intervals of indicators at each level.
Using the data of 2014 as an example, perform the calculation as follows:
Step 1: Following Model (10), the optimal fuzzy measure linear programming model on the attribute set is obtained, as shown below:
By solving the model, we get the following:
The fuzzy measure is expressed by and brought into Equation (4) to solve for = −0.369. Calculating the λ-fuzzy measure according to Equation (3) yields.
From Equations (7) and (8), we have the following:
Similarly, the generalized Shapley values of the remaining tertiary indicators can be obtained, as shown in Table 3.
Table 3.
Generalized Shapley values for the three levels of indicators.
Step 2: Rearrange the evaluation values from smallest to largest to get , and use the generalized λ-Shapley Choquet integral Equation (9) to get the composite value of Beijing’s attribute as . Similarly, we can get the comprehensive evaluation values of Beijing’s attributes and as . The same applies to other secondary indicators, which are brought into Model (10), to obtain the secondary indicator evaluation values, as shown in Table 4.
Table 4.
Evaluation values of secondary indicators in 2014.
Step 3: The data in Table 4 are brought into Model (10) to obtain the secondary indicators’ generalized Shapley values, as shown in Table 5.
Table 5.
Generalized Shapley values of secondary indicators.
Step 4: Similarly, the integrated evaluation value for 2014 was found, and the results are shown in Table 6.
Table 6.
Primary indicator evaluation values and comprehensive evaluation value (CEV) for 2014.
Step 5: Repeat Steps 1–4 to calculate the comprehensive evaluation value (CEV) for each province, from 2014–2018, as shown in Table 7.
Table 7.
CEV by province, 2014–2018.
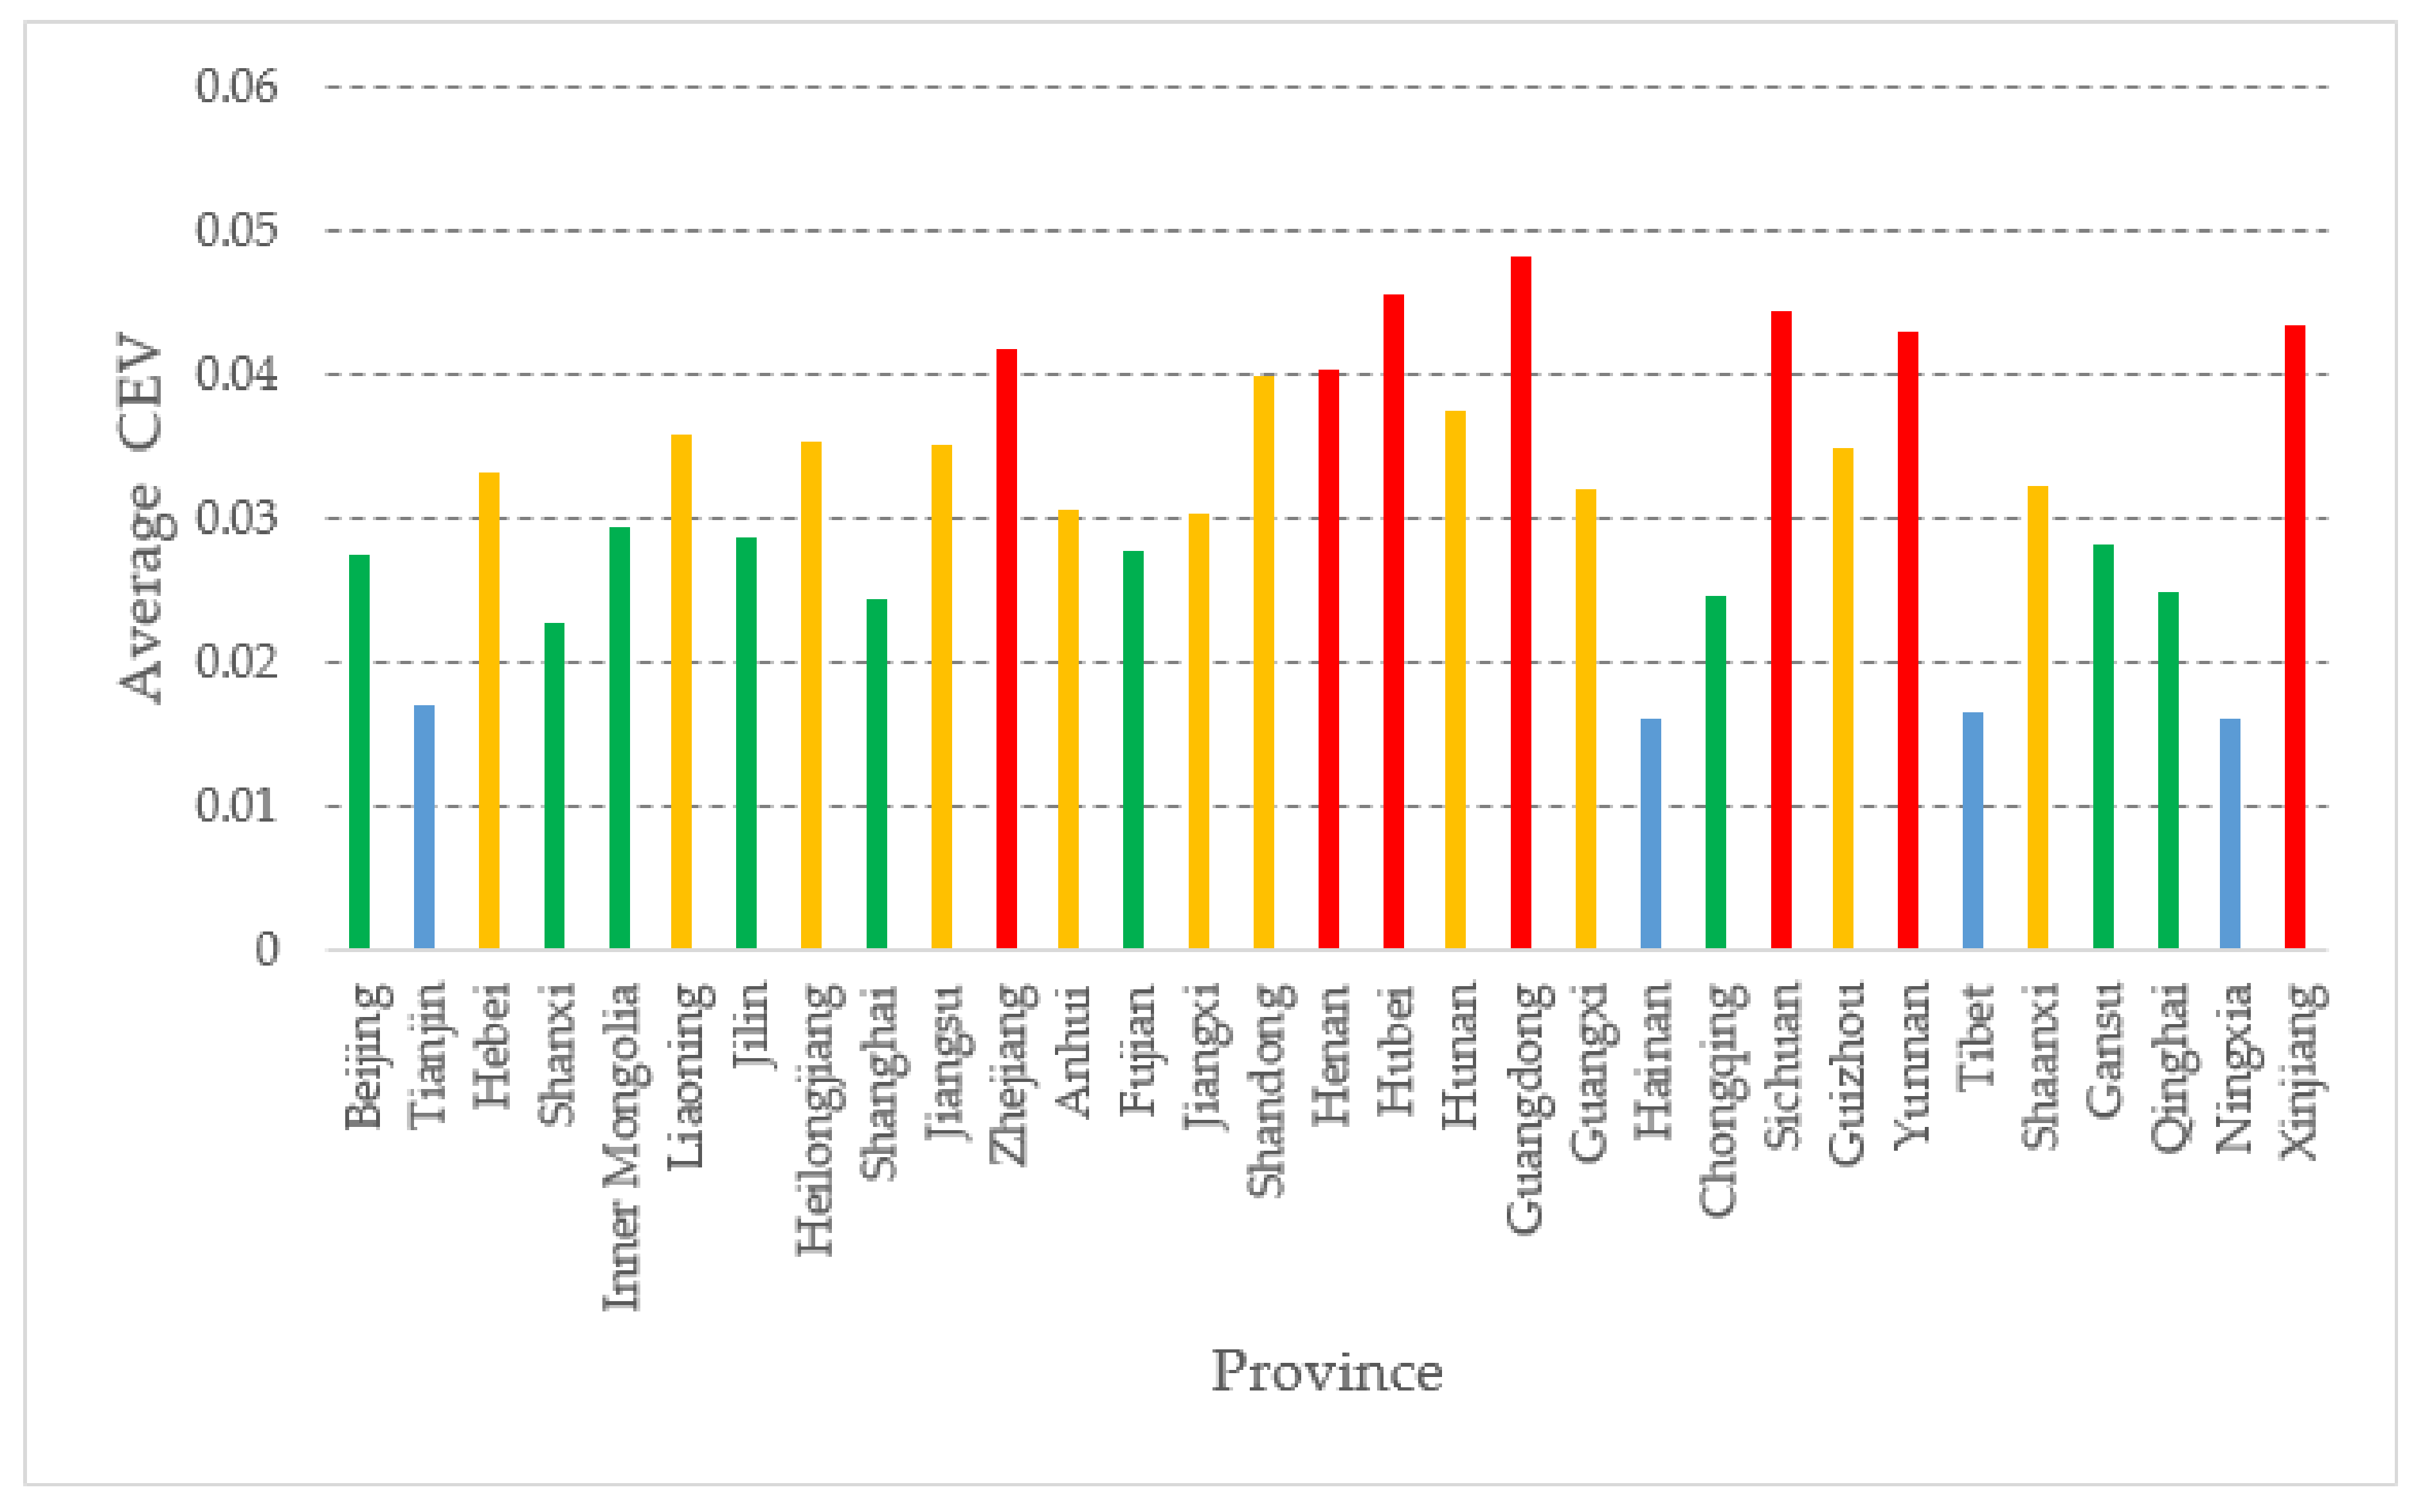
From Table 7, we can see that the comprehensive evaluation value (CEV) of each province does not change much from 2014 to 2018. So, in order to make the graph look more concise and easy to understand, we take the average of the comprehensive evaluation value from 2014 to 2018 and continue to make the graph, as shown in Figure 1.
Figure 1.
Average CEV by province.
From Figure 1, we can see that the average comprehensive evaluation value of 31 provinces in Mainland China from 2014 to 2018 can be divided into four levels, which are greater than or equal to 0.04 (first level, red histogram), between 0.03 and 0.04 (second level, yellow histogram), between 0.02 and 0.03 (third level, green histogram), between 0.01 and 0.02 (fourth rank, blue histogram). There are 7 provinces in the first rank (Zhejiang, Henan, Hubei, Guangdong, Sichuan, Yunnan, and Xinjiang); 11 provinces in the second rank (Hebei, Liaoning, Heilongjiang, Jiangsu, Anhui, Jiangxi, Shandong, Hunan, Guangxi, Guizhou, and Shaanxi); 9 provinces in the third rank (Beijing, Shanxi, Inner Mongolia, Jilin, Shanghai, Fujian, Chongqing, Gansu, and Qinghai); and 4 provinces in the fourth rank (Tianjin, Hainan, Tibet and Ningxia). This result is basically in line with the reality that the top-ranked provinces are experienced in disaster management capacity.
4.2. Comparison of Methods
The model used in this paper has some similarity with the entropy weight TOPSIS model, so the same data are used and brought into the entropy-weighted TOPSIS model. Moreover, the superiority of the model developed in this paper considering the interaction is discussed in terms of both the maximum ordinal difference and the weights.
4.2.1. Comparison with Entropy Method TOPSIS Model
Using the same data, we calculated the weights of the 25 indicators from 2014 to 2018 using the entropy weight method as shown in Table 8.
Table 8.
Weights of entropy weight method.
From Table 8 we can obviously see that the weights of some indicators, such as c233, c321, and c322, are so small as to be almost negligible. The entropy weight method obtains the weights entirely from the dispersion degree of objective data, i.e., the size of entropy. While entropy is used to measure uncertainty, the greater the dispersion of the indicator (the greater the uncertainty) the greater the entropy value, indicating that the more information the indicator value provides, the greater the weight of the indicator should be. Moreover, some indicators do not vary much nationally, so the weights are not high, but the importance of these indicators may be high. For example, some indicators under information-processing capacity (c2) have a very low weight close to 0, but in real life, they are not less important.
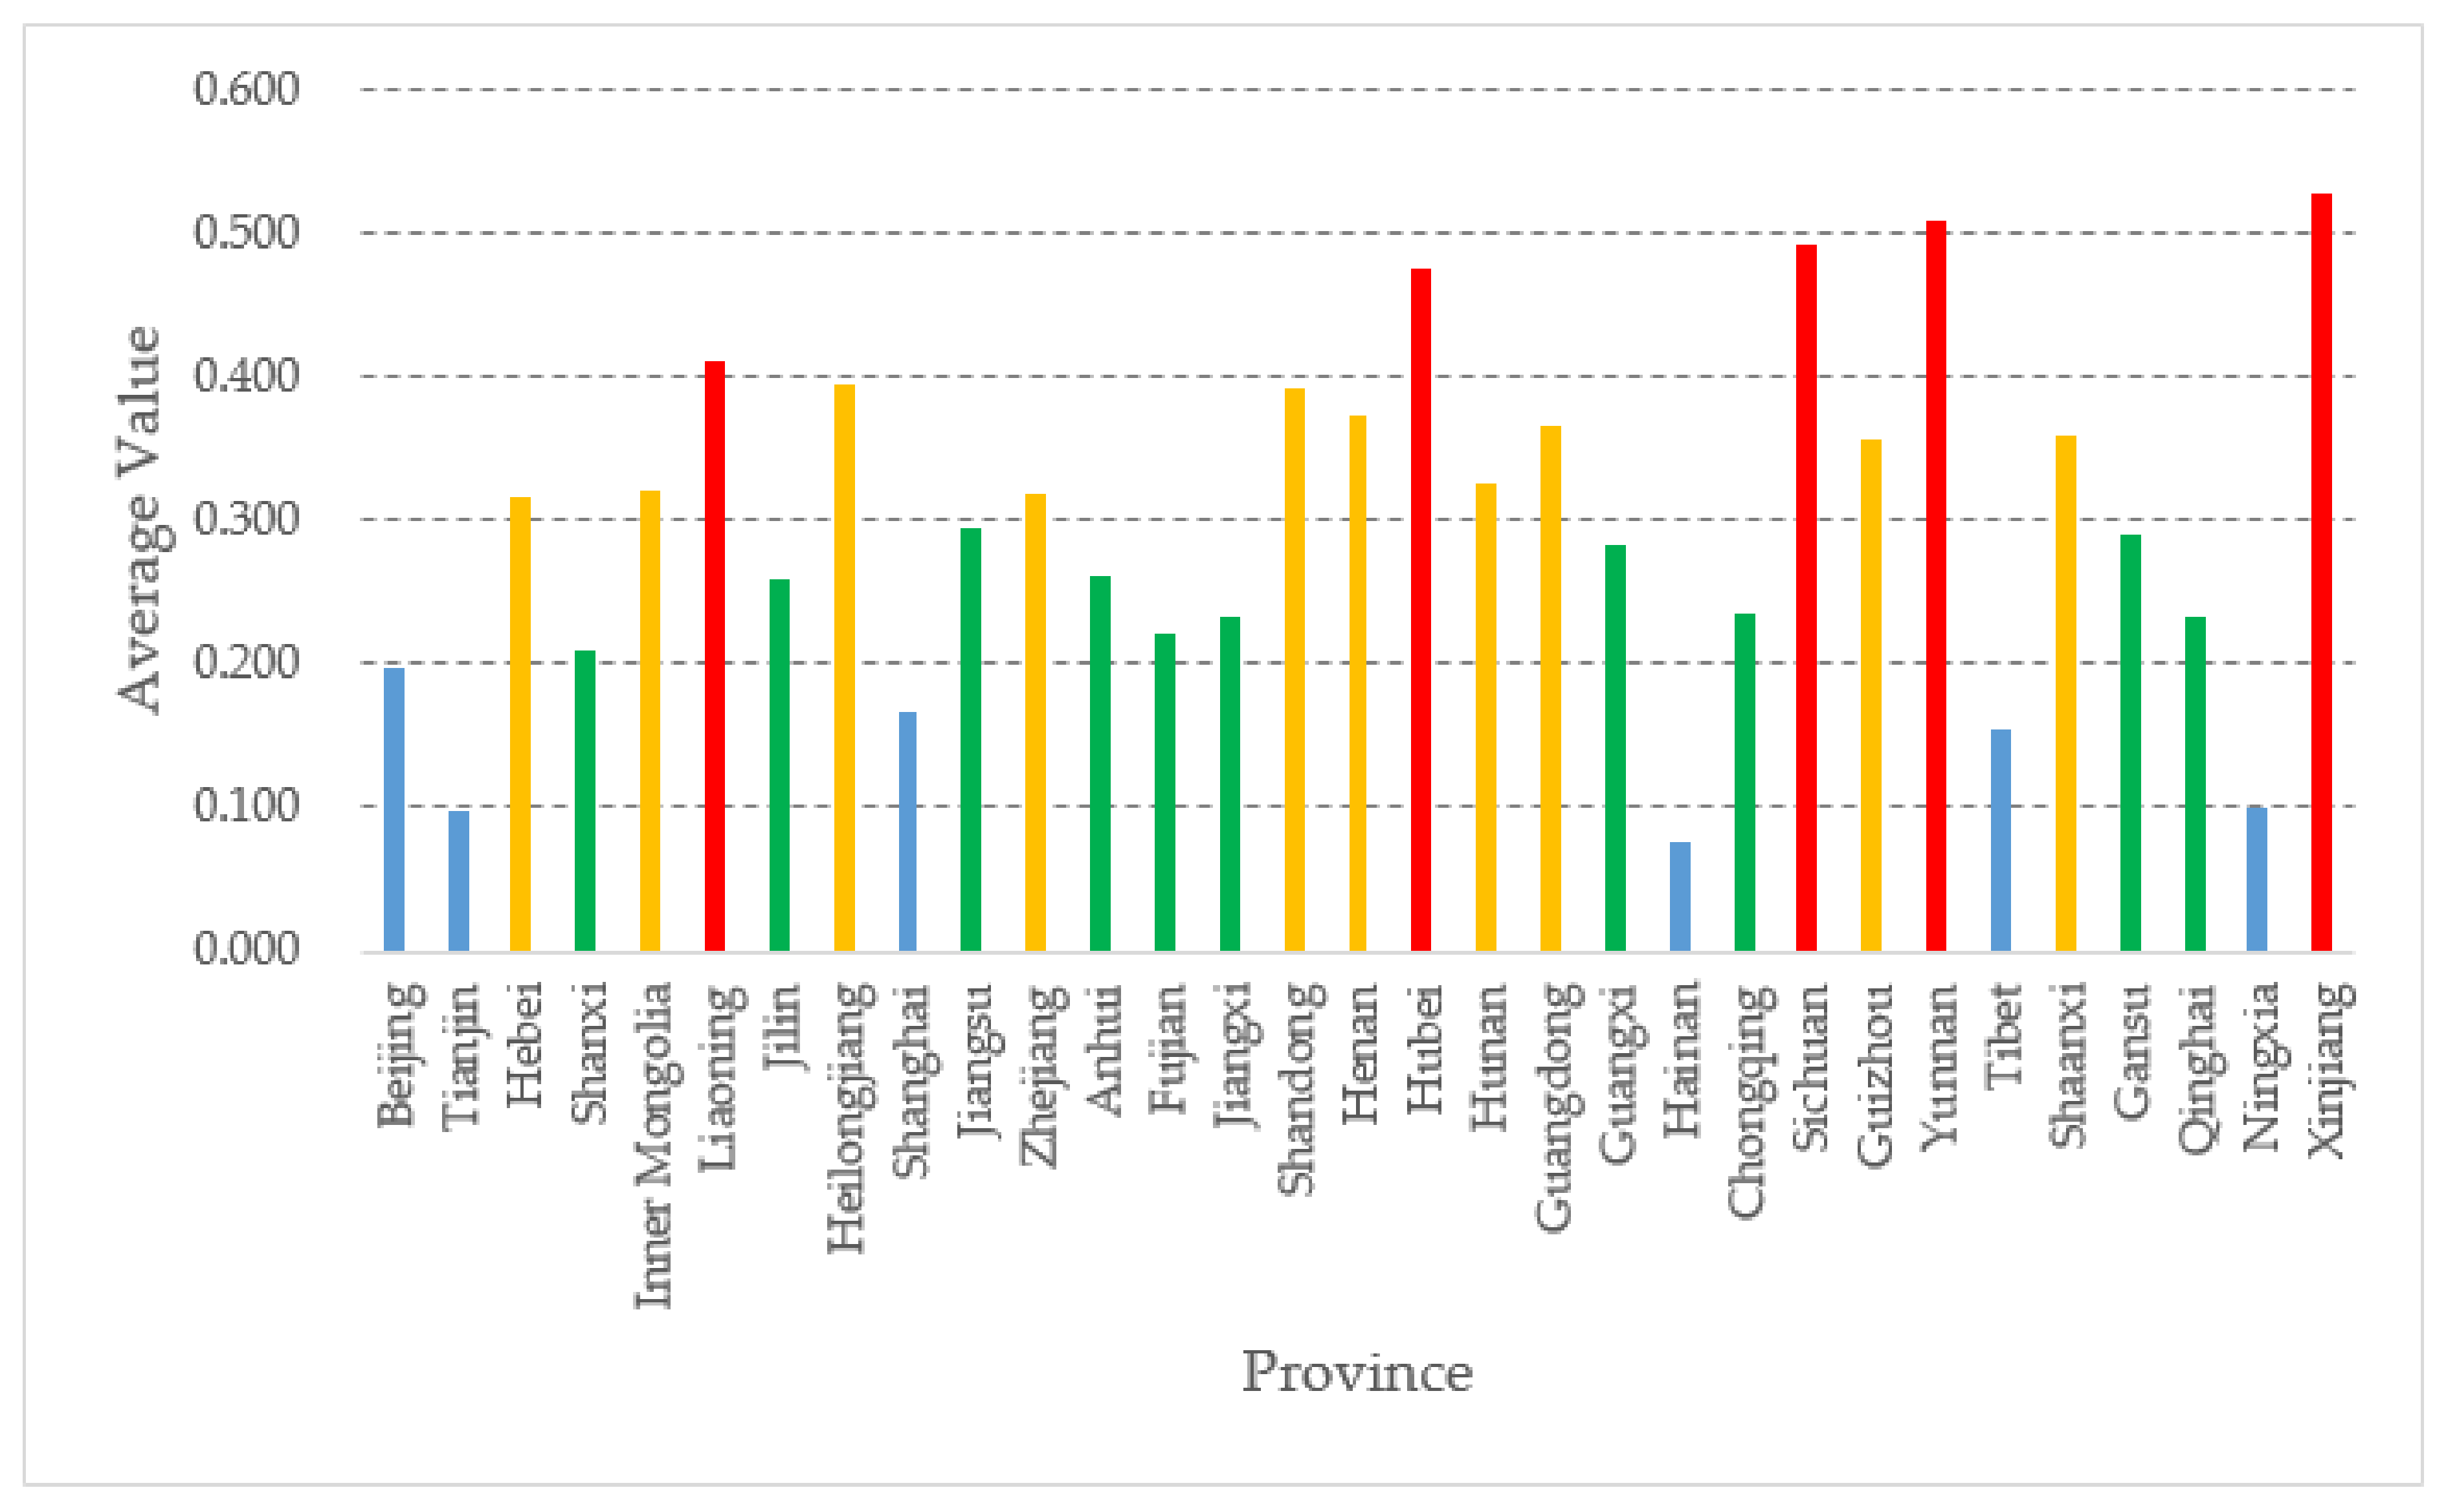
We then calculated the meteorological disaster governance capacity of 31 provinces, from 2014 to 2018, by using the entropy-weight method to calculate the weights by ourselves, combined with the TOPSIS model. We then took the average and made the graph shown in Figure 2:
Figure 2.
Average CEV by province, entropy weight TOPSIS model.
As can be seen from Figure 2, there are some differences from the results in Figure 1 because of the influence of the weight defined by the entropy weight method. The main difference lies in the low scores of the four municipalities, which are all classified in the lowest rank, which obviously lacks rationality. The reason for this phenomenon is that the entropy weight method calculates the weights according to the variability of the information contained in each indicator in order to determine the indicator weights, relying only on the discrete degree of the data itself. Entropy is used to measure uncertainty, and the greater the dispersion of the indicator (the greater the uncertainty), the greater the entropy value, indicating that the more information the indicator value provides, the greater the weight of the indicator should be. Moreover, some indicators do not vary much nationally, so the weight is not high, but the importance of these indicators may be high, such as some indicators under information-processing capacity. Moreover, four municipalities directly under the central government, such as Beijing, have higher population density, so they will have lower values for some indicators involving per capita, so they yield poorer results. Therefore, in both models, the composite scores of the four municipalities are not high, and the model considering interaction performs better than the entropy weight TOPSIS method. However, how to estimate the meteorological disaster governance capacity of the four municipalities directly under the central government more accurately is a work that needs to be accomplished in the future.
Analytic Hierarchy Process (AHP) is a combined qualitative and quantitative decision analysis method, by judging the relative importance of each measurement index, and then obtaining the weight of each index in the decision scheme; entropy weighting method is a data-based weighting method, while hierarchical analysis method is an empirical weight method. The method in this paper requires less qualitative judgment than the hierarchical analysis method (only the experts need to give the weight intervals of each indicator in the hierarchy) and combines objective data, which has higher operability and is a combined qualitative and predetermined quantitative method, and uses the generalized λ-Shapley function to remove the interaction between indicators, and the weights obtained under this method are also purer.
4.2.2. Comparison of Maximum Sequence Differences
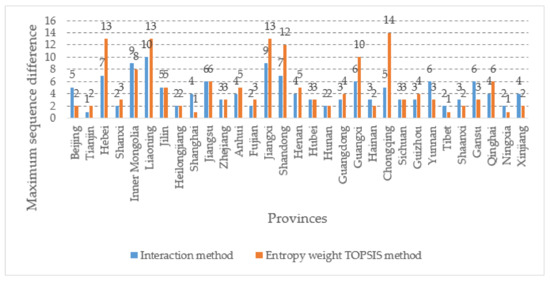
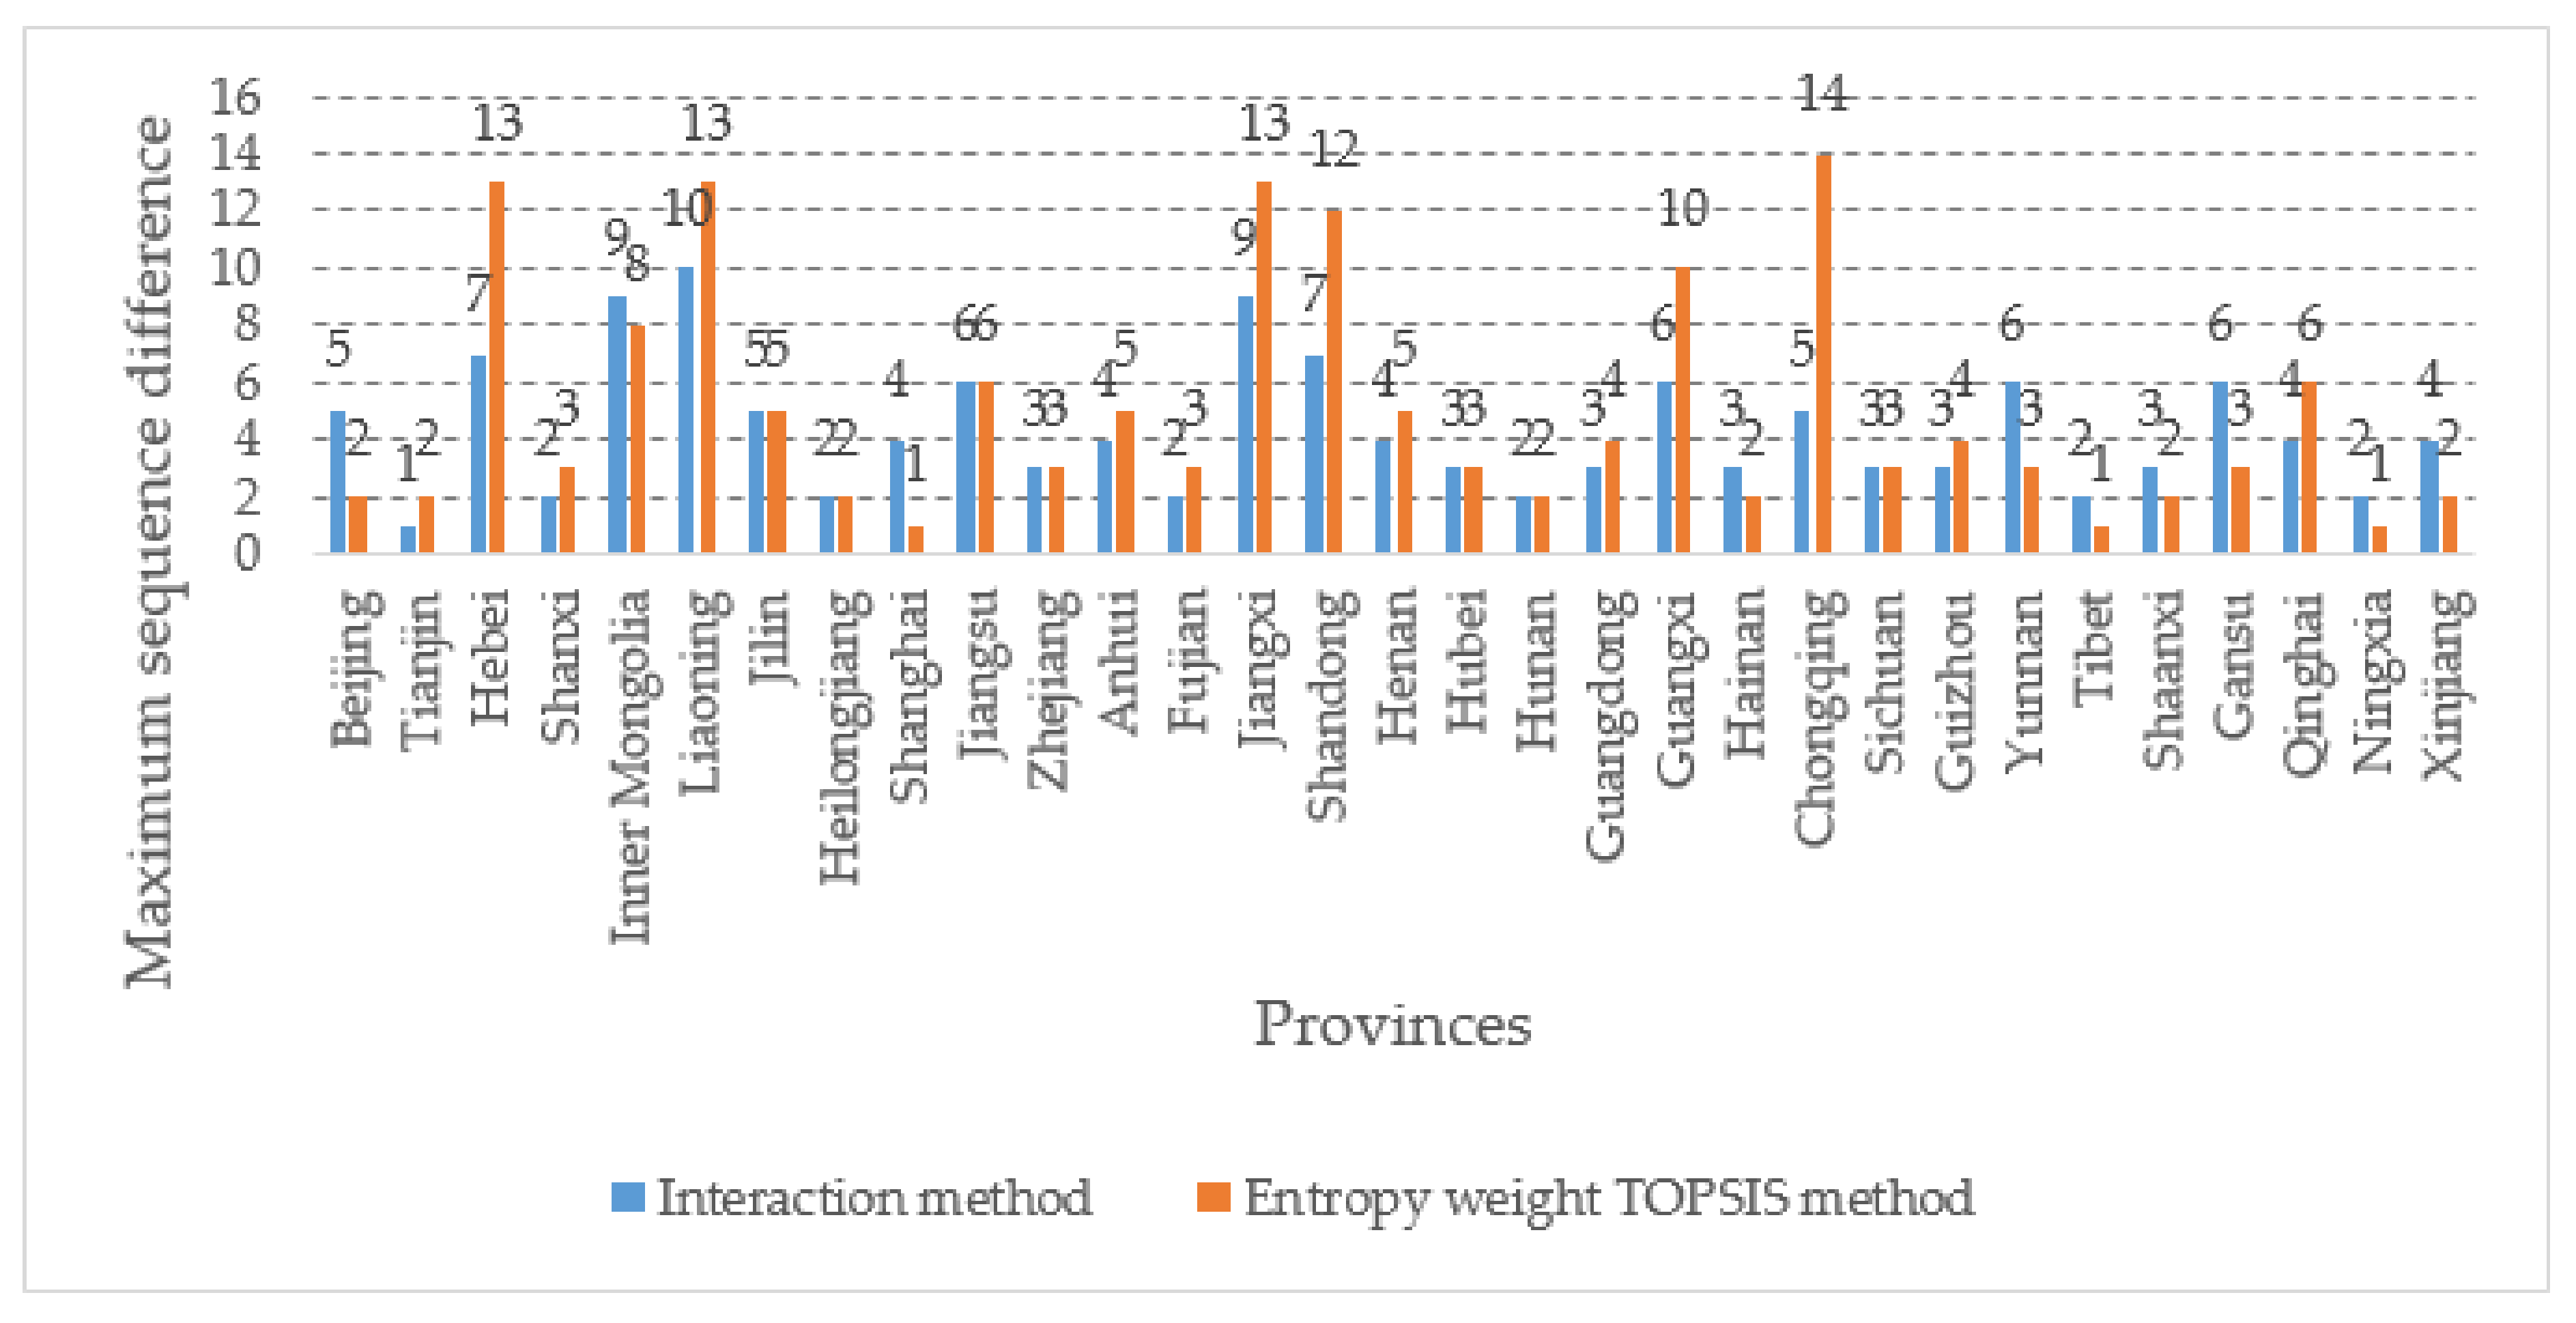
After we calculated the composite evaluation value of 31 provinces from 2014 to 2018, using two methods, the provinces were ranked by the composite value, and then the difference between the highest and lowest rank of each province was taken as the maximum ordinal difference, and a histogram was made as shown in Figure 3:
Figure 3.
The maximum sequence difference under the two methods.
From Figure 3, we can see that the results calculated by the entropy weight TOPSIS method and the results calculated by the evaluation method used in this paper considering interaction differ in the maximum ordinal difference, especially in the five provinces of Hebei, Liaoning, Jiangxi, Shandong, Guangxi, and Chongqing, where the difference is enormous. We know that the larger the ordinal difference is, the less stable it is, and the improvement of disaster management capacity is a long-term process, and it is more difficult to have results with such a significant jump as those five that provinces, in contrast, the calculation results of this paper’s model are more reasonable.
4.2.3. Comparison of Weights
We consider the specificity of the method in this paper: Only the weights of the first level indicators are extracted, and a comparison is made between the weights of the first level indicators and the weights derived from the entropy-weight method, as shown in Table 9.
Table 9.
Comparison of the weights of primary indicators.
From Table 9, we can see that the distribution of the weights of the entropy TOPSIS method is that c3 accounts for more than 40%, and c1 and c2 are similar. Meanwhile, in the results of the model designed in this paper, the three indicators are almost equally divided in 2014 and 2015, c2 occupies more than 50% of the weight from 2016 to 2018, and the remaining part is equally divided by c1 and c3. Moreover, just in 2016, the China Meteorological Administration proposed in the modernization of meteorology, the goal of informatization and big data in the future development of meteorology [36], and the indicator of c2 information-processing capacity has increased in proportion from 2016 is very reflective of the fact. However, the weight obtained by the entropy weight method in the c2 indicator is not high, and even in some years, it is at the lowest of the three, which reflects the superiority of the method in this paper.
5. Conclusion and Policy Recommendations
5.1. Conclusions
In this paper, we devote ourselves to studying meteorological disaster governance capacity and evaluating the meteorological disaster governance capacity of provinces in Mainland China, using multi-attribute decision-making. When we assess each local area’s meteorological disaster governance capacity, we use the generalized λ-Shapley Choquet integral to eliminate the interaction between attributes. We build an evaluation model considering the interaction of attributes and then substitute the data and expert weight intervals to calculate the comprehensive evaluation value of meteorological disaster governance capacity of Mainland China’s provincial areas from 2014 to 2018. Finally, the calculation results of this paper and the model are compared with other MADM models (entropy weight method, Technique for Order Preference by Similarity to an Ideal Solution(TOPSIS), and Analytic Hierarchy Process (AHP)). The results of this paper are more stable and reasonable.
According to Figure 1, the development of meteorological disaster governance capacity is unbalanced among provinces in Mainland China, with few provinces having a strong capacity and most of them in the middle rank. The top-ranked provinces, especially Guangdong, Sichuan, and Hubei, pay special attention to meteorological disaster governance and information technology construction, which can be seen from these local governments’ official websites. These provinces have mastered the technology of meteorological disaster management and have entered a virtuous cycle. Except for the four municipalities directly under the central government, the provinces with weaker capacity, which are the blue provinces in the chart, are Tibet, Ningxia, Hainan, and Tianjin. Except for Tianjin, the rest of these places are areas in China with harsh natural environmental conditions and relatively backward economic levels. Understandably, the meteorological disaster governance capacity is weak. By comparing with some articles of the same type [9,10], this paper’s conclusions have some similarities. For example, the two provinces of Zhejiang and Guangzhou are more vital in meteorological disaster management, while Fujian and Hainan have lower evaluation values. In terms of methodological use, this paper uses the MADM method to measure the meteorological hazard management capacity of provinces in Mainland China, which has been used many times in the study of meteorological hazards [14], and this paper also takes into account the interactivity, and the results obtained are more stable and reasonable than the standard MADM method.
5.2. Policy Recommendations
Based on the findings indicated in the above conclusion, we can make the following policy recommendations:
(1) Strengthen the informatization of meteorological disaster governance: In 2016, the China Meteorological Administration proposed informatization and big data in future meteorological development in meteorology modernization. The informatization of meteorological disaster governance is also the consensus of governments worldwide [37]. Modernized meteorological disaster governance requires the support of big data, cloud computing, and other data-processing technologies. More precise data analysis and processing can strengthen meteorological disaster prediction accuracy and monitoring, the software part of the meteorological disaster management information construction. The hardware part is that each place should reasonably invest in central weather disaster monitoring and prediction equipment and the recruitment of relevant high-tech talents.
(2) Experience sharing: As shown in Figure 1, the provinces with high capacity are getting better and better, and there is a trend of polarization, but this is uneven and unhealthy. The valuable experience of meteorological disaster governance needs to be shared, especially by the provinces that perform relatively poorly. China’s meteorological disaster governance has received considerable attention in recent years, and experience sharing is needed to improve nationwide. It can be seen from the zoning map that the provinces with lower and higher scores are relatively unchanged, especially those in the last echelon. So it is possible to set up key help targets and focus on the provinces with lower scores. Furthermore, provinces with higher scores in meteorological disaster governance capacity can be tested and shared with neighboring provinces, which is done by considering the similarity of natural environment in neighboring provinces.
Author Contributions
The research is designed and performed by Z.G. and Y.W. The data were collected and analyzed by Y.W., F.X., and L.Z.; Y.W. drafted the manuscript and all authors read and revised the final manuscript. All authors have read and agreed to the published version of the manuscript.
Funding
This research was funded by the National Natural Science Foundation of China (71971121 and 71571104), NUIST-UoR International Joint Research Institute, Jiangsu Province Philosophy and Social Science Research Major Project Program (2018SJZDA038); Jiangsu Province Policy Guidance Program (Soft Science Research) in 2019 (BR2019064); and China Meteorological Administration Soft Science Research Key Project (2020ZDIA NXM15).
Acknowledgments
This research is partially supported by the National Natural Science Foundation of China (71971121 and 71571104), NUIST-UoR International Joint Research Institute, Jiangsu Province Philosophy and Social Science Research Major Project Program (2018SJZDA038); Jiangsu Province Policy Guidance Program (Soft Science Research) in 2019 (BR2019064); and China Meteorological Administration Soft Science Research Key Project (2020ZDIA NXM15).
Conflicts of Interest
The authors declare no conflict of interest.
References
- Liu, T.; Yan, T. Main meteorological disasters in China and their economic losses. J. Nat. Disasters 2011, 20, 90–95. (In Chinese) [Google Scholar] [CrossRef]
- Jie, X. Major meteorological disasters in China and their economic losses. Technol. Enterp. 2014, 24, 100. (In Chinese) [Google Scholar] [CrossRef]
- Wu, J.; Fu, Y.; Zhang, J.; Li, N. Meteorological Disaster Trend Analysis in China: 1949–2013. J. Nat. Resour. 2014, 29, 1520–1530. (In Chinese) [Google Scholar]
- Ministry of Civil Affairs of the People’s Republic of China. Social Work B-2-17 Natural Disaster Situation; China Statistics Press: Beijing, China, 2017; p. 164. ISBN 978-7-5037-8227-5. (In Chinese)
- China Meteorological Administration (CMA). China Meteorological Administration Releases. Available online: http://www.cma.gov.cn/2011xwzx/2011xqxxw/2011xqxyw/201901/t20190123513193.html (accessed on 28 March 2021).
- Wu, H.-L.; Cheng, W.-C.; Shen, S.-L.; Lin, M.-Y.; Arulrajah, A. Variation of hydro-environment during past four decades with underground sponge city planning to control flash floods in Wuhan, China: An overview. Undergr. Space 2020, 5, 184–198. [Google Scholar] [CrossRef] [Scilit]
- Liu, Y.; You, M.; Zhu, J.; Wang, F.; Ran, R. Integrated risk assessment for agricultural drought and flood disasters based on entropy information diffusion theory in the middle and lower reaches of the Yangtze River, China. Int. J. Disaster Risk Reduct. 2019, 38, 101194. [Google Scholar] [CrossRef] [Scilit]
- Cai, T.; Li, X.; Ding, X.; Wang, J.; Zhan, J. Flood risk assessment based on hydrodynamic model and fuzzy comprehensive evaluation with GIS technique. Int. J. Disaster Risk Reduct. 2019, 35, 101077. [Google Scholar] [CrossRef] [Scilit]
- Yu, X.; Chen, H.; Li, C. Evaluate typhoon disasters in 21st century maritime silk road by super-efficiency DEA. Int. J. Environ. Res. Public Health 2019, 16, 1614. [Google Scholar] [CrossRef] [Scilit]
- Sun, R.; Gong, Z.; Gao, G.; Shah, A.A. Comparative analysis of Multi-Criteria Decision-Making methods for flood disaster risk in the Yangtze River Delta. Int. J. Disaster Risk Reduct. 2020, 51, 101768. [Google Scholar] [CrossRef] [Scilit]
- Lu, C.; Zhou, J.; He, Z.; Yuan, S. Evaluating typical flood risks in Yangtze River Economic Belt: Application of a flood risk mapping framework. Nat. Hazards 2018, 94, 1187–1210. [Google Scholar] [CrossRef] [Scilit]
- Lyu, H.-M.; Xu, Y.-S.; Cheng, W.-C.; Arulrajah, A. Flooding hazards across southern China and prospective sustainability measures. Sustainability 2018, 10, 1682. [Google Scholar] [CrossRef] [Scilit]
- Ali, R.; Kuriqi, A.; Kisi, O. Human-Environment Natural Disasters Interconnection in China: A Review. Climate 2020, 8, 48. [Google Scholar] [CrossRef] [Scilit]
- De Brito, M.M.; Evers, M. Multi-criteria decision-making for flood risk management: A survey of the current state of the art. Nat. Hazards Earth Syst. Sci. 2016, 16, 1019–1033. [Google Scholar] [CrossRef] [Scilit]
- Kang, S. Research on Real-time Assessment Method for Emergency Defense Capability of Major Meteorological Disasters. J. Catastrophol. 2018, 33, 180–183. (In Chinese) [Google Scholar]
- Ma, H.; Wei, L. Weighted Hesitant Triangular Fuzzy Distance Measurement and Its Application in Group Decision Making. Comput. Eng. Sci. 2020, 42, 1430–1439. (In Chinese) [Google Scholar]
- Zeng, W.; Li, D.; Yin, Q. Group Decision Making Approach of Weighted Hesitant Fuzzy Sets. Control Decis. 2019, 34, 527–534. (In Chinese) [Google Scholar]
- Angilella, S.; Catalfo, P.; Corrente, S.; Giarlotta, A.; Greco, S.; Rizzo, M. Robust sustainable development assessment with composite indices aggregating interacting dimensions: The hierarchical-SMAA-Choquet integral approach. Knowl.-Based Syst. 2018, 158, 136–153. [Google Scholar] [CrossRef] [Scilit]
- Gao, X.; Cao, M.; Zhang, Y.; Liu, Y.; Tong, H.; Yao, Q. Towards sustainability: An assessment of an urbanisation bubble in China using a hierarchical—Stochastic multicriteria acceptability analysis—Choquet integral method. J. Clean. Prod. 2021, 279, 123650. [Google Scholar] [CrossRef] [Scilit]
- Grabisch, M. Fuzzy integral in multicriteria decision making. Fuzzy Sets Syst. 1995, 69, 279–298. [Google Scholar] [CrossRef] [Scilit]
- Meng, F.; Zhang, Q. Induced continuous Choquet integral operators and their application to group decision making. Comput. Ind. Eng. 2014, 68, 42–53. [Google Scholar] [CrossRef] [Scilit]
- Meng, F.; Zhang, Q. The fuzzy core and Shapley function for dynamic fuzzy games on matroids. Fuzzy Optim. Decis. Mak. 2011, 10, 369. [Google Scholar] [CrossRef] [Scilit]
- Meng, F.; Zhang, Q.; Cheng, H. Approaches to multiple-criteria group decision making based on interval-valued intuitionistic fuzzy Choquet integral with respect to the generalized λ-Shapley index. Knowl.-Based Syst. 2013, 37, 237–249. [Google Scholar] [CrossRef] [Scilit]
- Meng, F.; Wang, C.; Zhang, Y. Approach to Project Investment Projects Based on the Generalized-Shapley Choquet Integral. Oper. Res. Manag. Sci. 2016, 25, 186–194. (In Chinese) [Google Scholar]
- Grabisch, M. The application of fuzzy integrals in multicriteria decision making. Eur. J. Oper. Res. 1996, 89, 445–456. [Google Scholar] [CrossRef] [Scilit]
- Wu, J.; Chen, F.; Nie, C.; Zhang, Q. Intuitionistic fuzzy-valued Choquet integral and its application in multicriteria decision making. Inf. Sci. 2013, 222, 509–527. [Google Scholar] [CrossRef] [Scilit]
- Li, X. Choquet Integral Based on the Self-Dual Measure. Master’s Thesis, Hebei University, Baoding, China, 2008. (In Chinese) [Google Scholar]
- Liu, N. Multi-Attribute Group Decision Making Method of Intuitionistic Linguistic TODIM Based on Choquet Integral. Math. Pract. Theory 2020, 50, 10–19. (In Chinese) [Google Scholar]
- Labreuche, C.; Grabisch, M. Using multiple reference levels in Multi-Criteria Decision aid: The Generalized-Additive Independence model and the Choquet integral approaches. Eur. J. Oper. Res. 2018, 267, 598–611. [Google Scholar] [CrossRef] [Scilit]
- Chang, Z.; Cheng, L.; Liu, J. Multi-attribute decision-making method based on Mahalanobis-Taguchi System and 2-additive Choquet integral. J. Ind. Eng./Eng. Manag. 2016, 30, 133–139. (In Chinese) [Google Scholar]
- China Meteorological Administration (CMA). China Meteorological Administration issued [Opinions on Strengthening Meteorological Disaster Prevention, Mitigation and Relief Work]. China Emerg. Manag. 2018, 01, 24–28. (In Chinese) [Google Scholar]
- Lu, T.; Li, J. Construction on the course structure of geosciences undergraduate major considering on the concept of all phases of natural disaster management. Chin. Geol. Educ. 2020, 29, 62–66. (In Chinese) [Google Scholar]
- Tan, L.; Ye, W.; Wu, X.; Liu, L. Public demand for meteorological disaster risk reduction information based on the whole process of disaster—An empirical analysis of 78 287 questionnaires. J. Catastrophol. 2019, 34, 195–202. (In Chinese) [Google Scholar]
- Sugeno, M. Theory of Fuzzy Integrals and Its Applications. Ph.D. Thesis, Tokyo Institute of Technology, Tokyo, Japan, 1974. [Google Scholar]
- Marichal, J.-L. The influence of variables on pseudo-Boolean functions with applications to game theory and multicriteria decision making. Discret. Appl. Math. 2000, 107, 139–164. [Google Scholar] [CrossRef] [Scilit]
- China Meteorological Administration (CMA). 2016 Comprehensive Promotion of Meteorological Modernization Inventory. Available online: http://www.cma.gov.cn/2011xzt/2017zt/20170112/ (accessed on 28 March 2021).
- Qin, L.; Zhang, Q.; Guo, J. The practice and experience of meteorological disaster prevention and mitigation in other countries. China Popul. Resour. Environ. 2014, 24, 349–354. (In Chinese) [Google Scholar]

Publisher’s Note: MDPI stays neutral with regard to jurisdictional claims in published maps and institutional affiliations. |
© 2021 by the authors. Licensee MDPI, Basel, Switzerland. This article is an open access article distributed under the terms and conditions of the Creative Commons Attribution (CC BY) license (https://creativecommons.org/licenses/by/4.0/).