Adhering to the 2017 Dutch Physical Activity Guidelines: A Trend over Time 2001–2018

Abstract
1. Introduction
2. Materials and Methods
2.1. Study Design and Participants
2.2. Demographic Characteristics
2.3. Physical Activity
2.4. Data Analysis
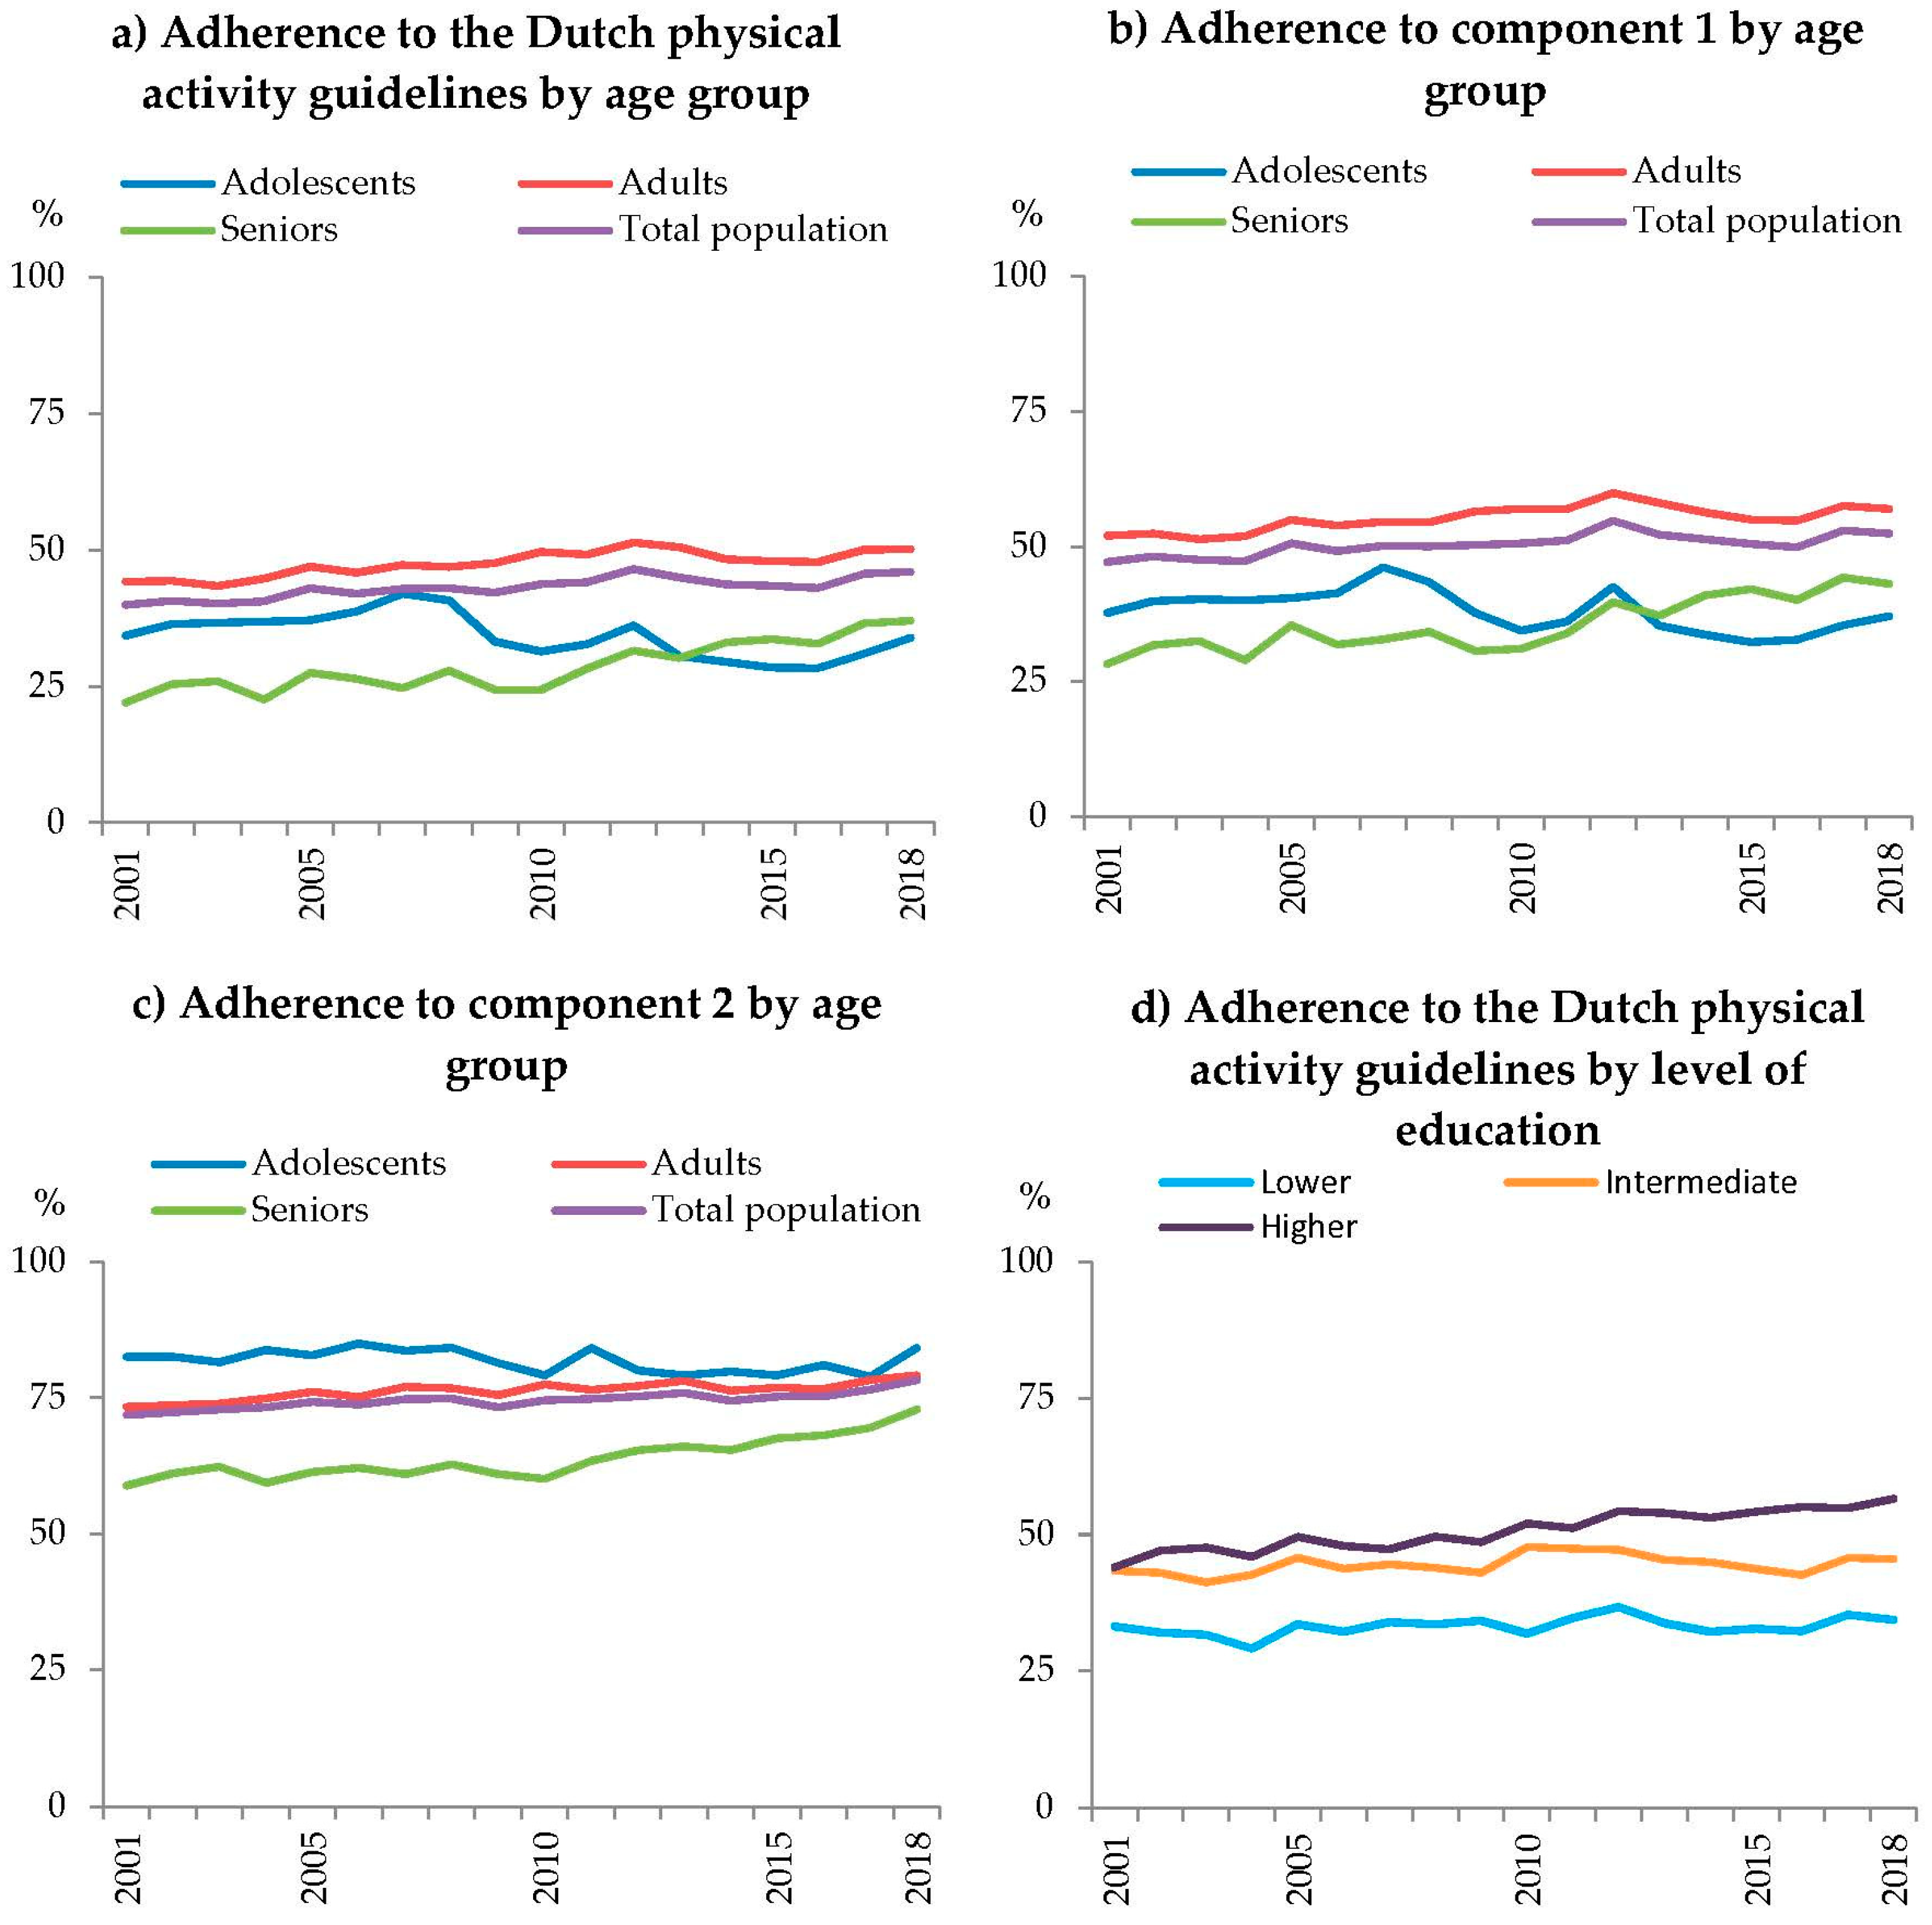
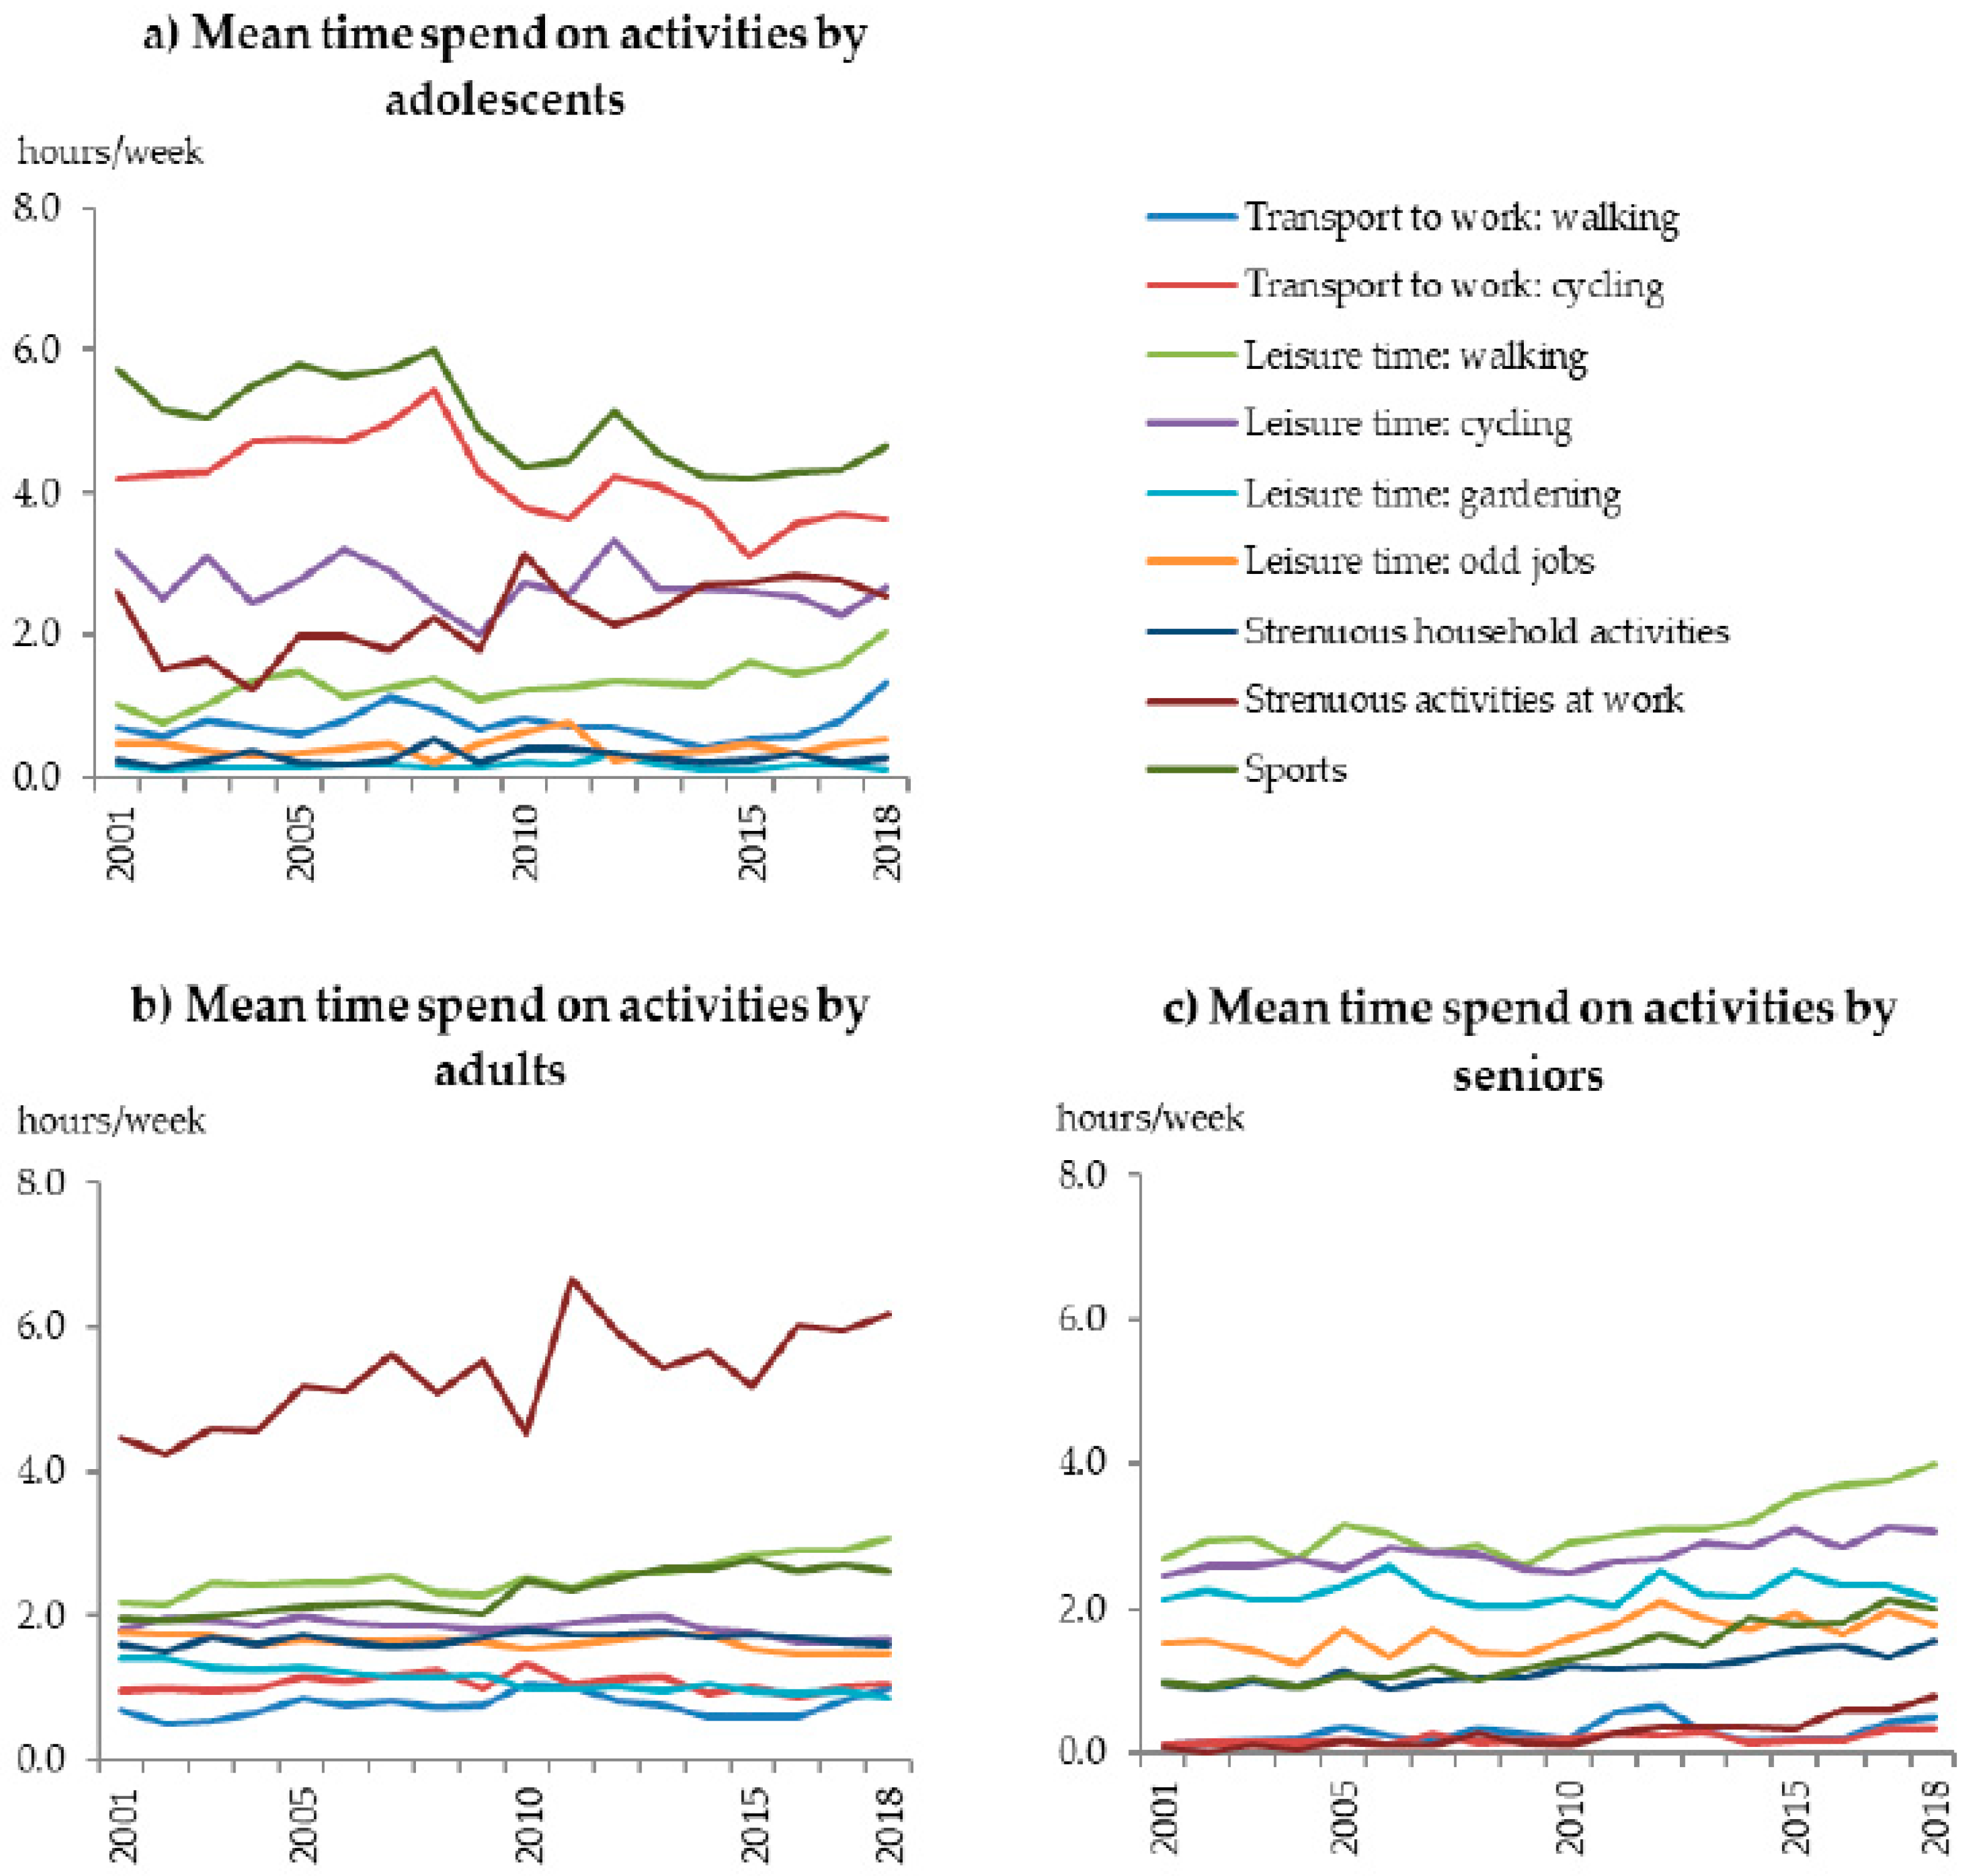
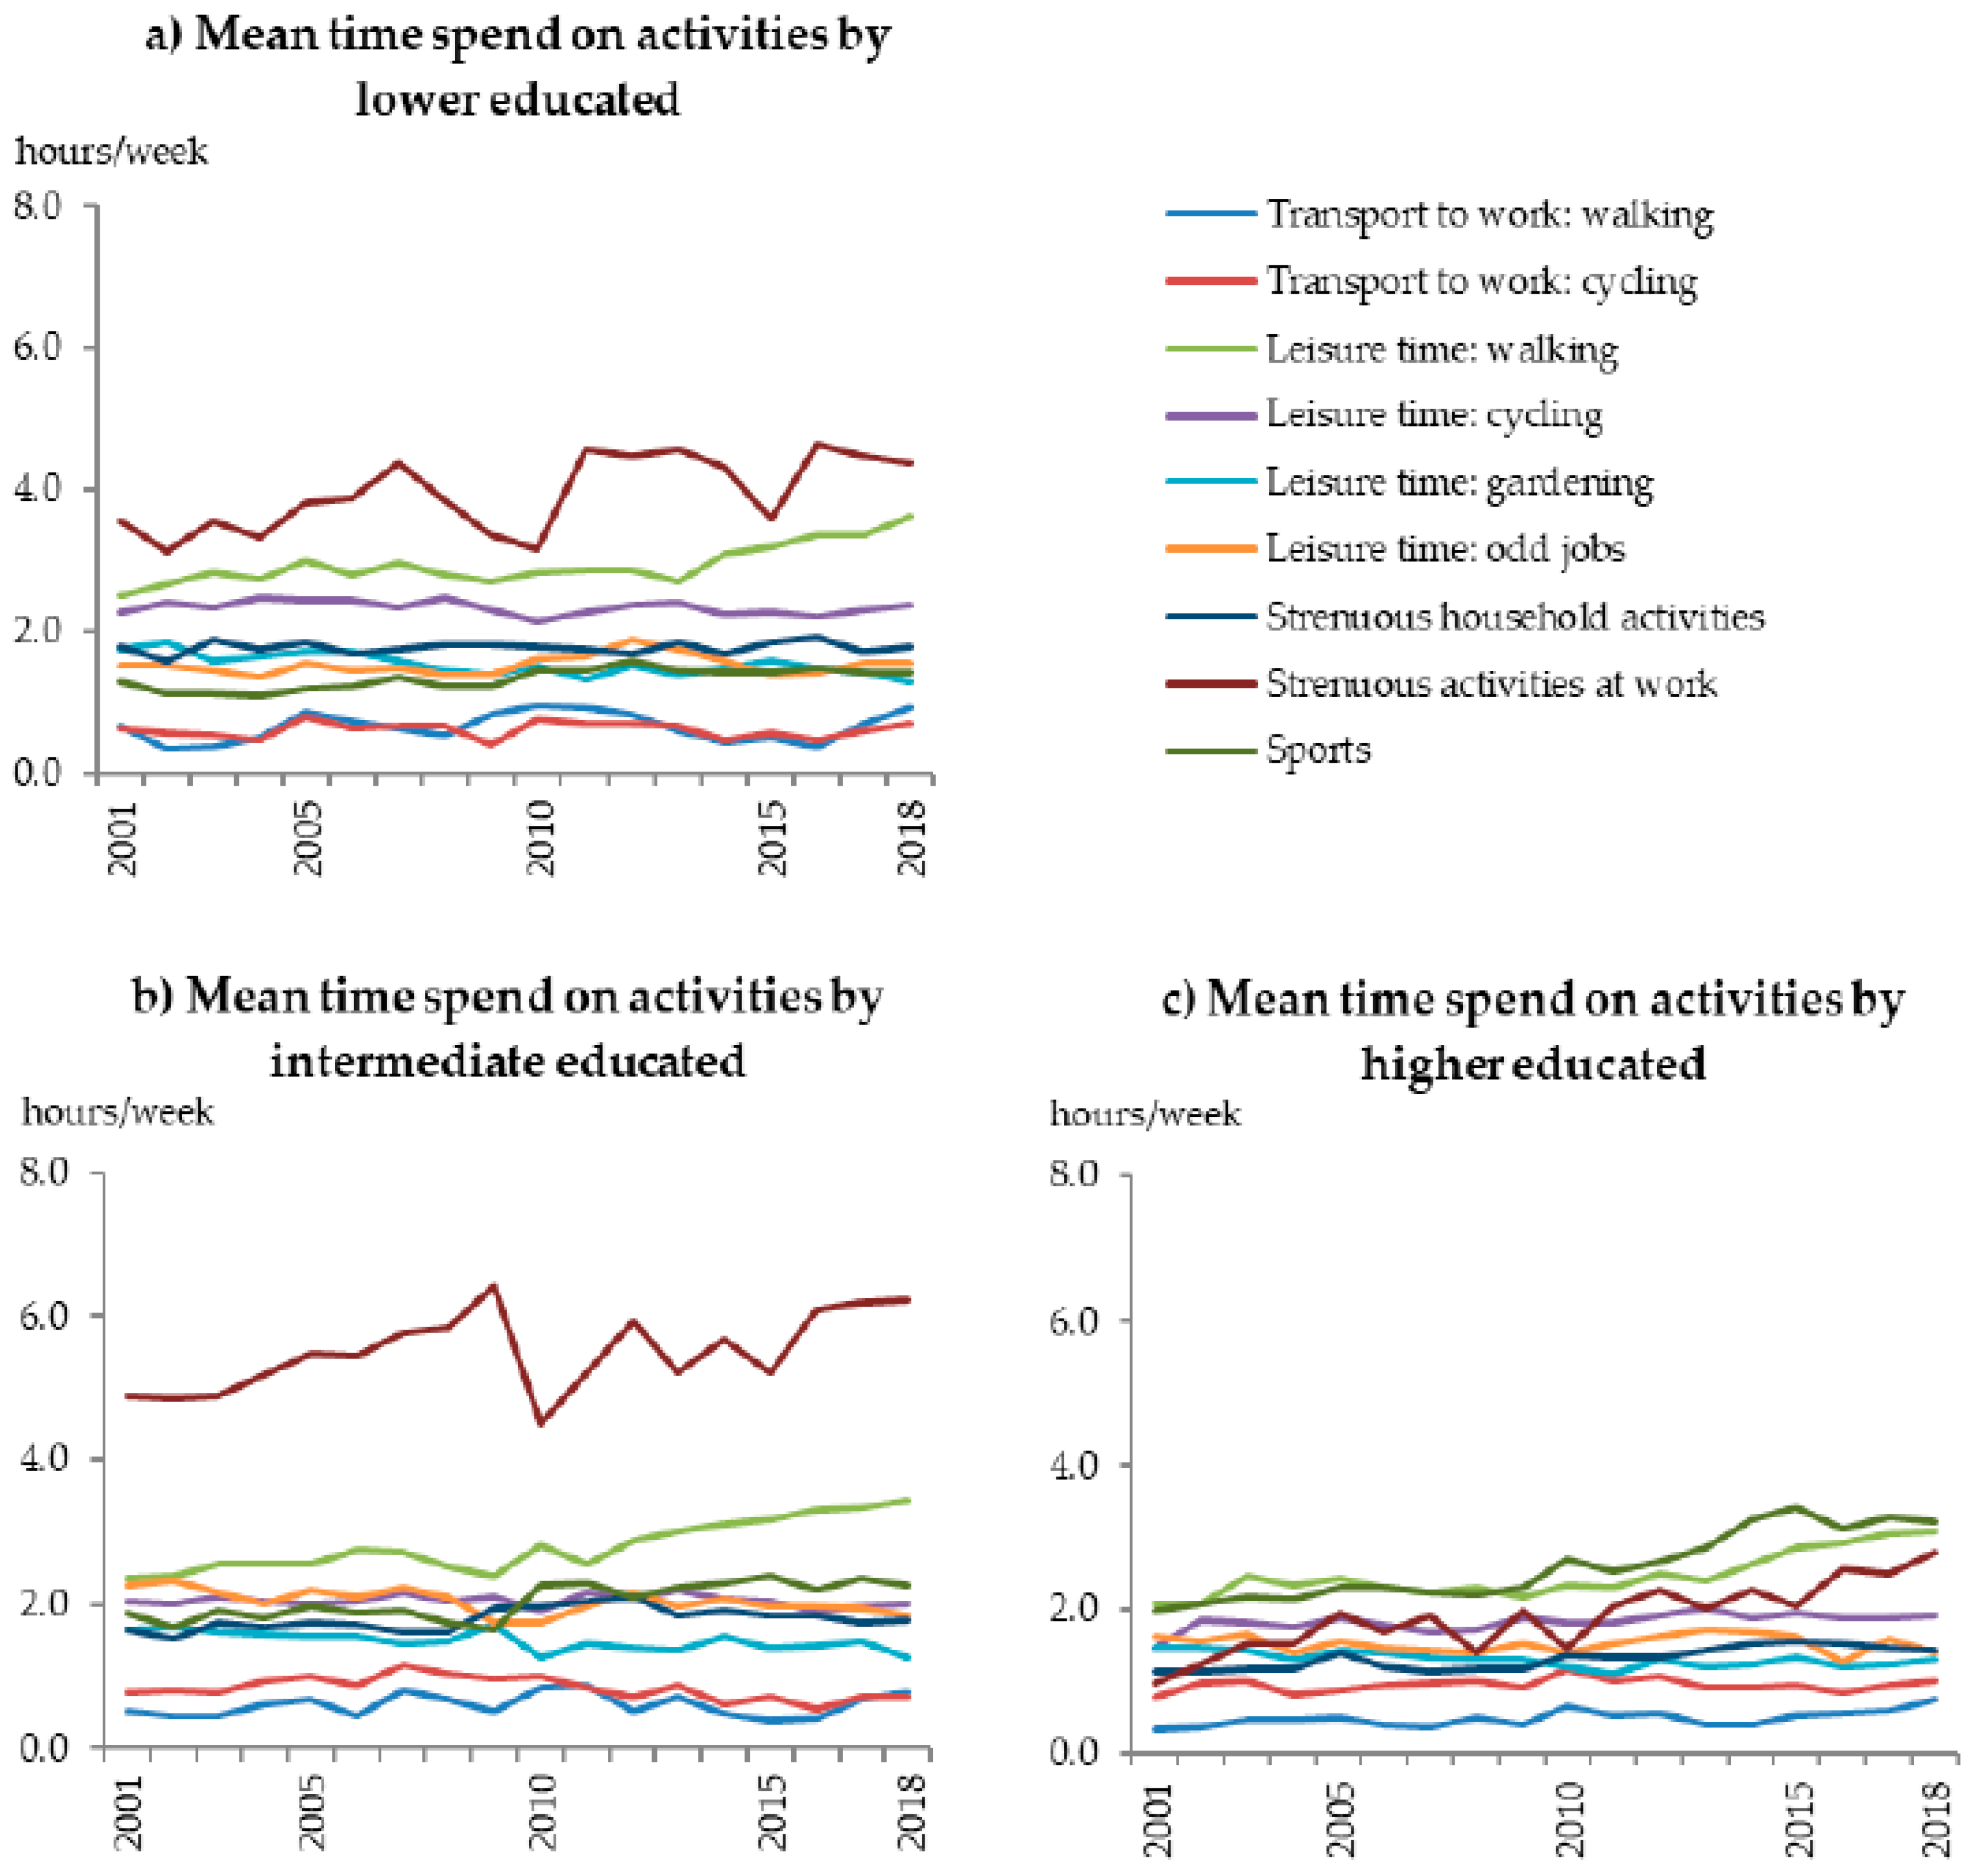
3. Results
4. Discussion
5. Conclusions
Author Contributions
Funding
Acknowledgments
Conflicts of Interest
Appendix A

| Domain | Activity | MET-Score | Muscle Strengthening * | Bone Strengthening * |
| Transport to work or school | Walking to work or school | 3.3 | YES | YES |
| Cycling to work or school | 5.8 | YES | NO | |
| Leisure time | Walking during leisure time | 2.7 | YES | YES |
| Cycling during leisure time | 5.8 | YES | NO | |
| Gardening | 3.8 | NO | NO | |
| Odd jobs | 3.0 | NO | NO | |
| At work | Working activities, light/moderate | 1.5 | NO | NO |
| Working activities, vigorous | 4.5 | NO | NO | |
| Household | Household activities, light | 2.5 | NO | NO |
| Household activities, vigorous | 4.3 | NO | NO | |
| Sports | Sports | Depends on kind of sport | Depends on kind of sport | Depends on kind of sport |
Appendix B
| Total (%) | Age Group (%) * | Sex (%) * | Level of Education (%) †,ᵟ | |||||||
|---|---|---|---|---|---|---|---|---|---|---|
| Year | ≥12 Years | ≥25 Years | Adolescents (12–17) | Adults (18–64) | Seniors (65+) | Male | Female | Lower | Intermediate | Higher |
| 2001 | 39.9 | 39.3 | 34.3 | 44.2 | 22.0 | 39.9 | 39.9 | 33.1 | 43.3 | 44.0 |
| 2002 | 40.6 | 39.6 | 36.4 | 44.3 | 25.3 | 40.1 | 41.2 | 32.0 | 43.0 | 47.1 |
| 2003 | 40.1 | 39.0 | 36.6 | 43.3 | 25.9 | 41.4 | 38.9 | 31.6 | 41.2 | 47.6 |
| 2004 | 40.6 | 39.6 | 36.8 | 44.7 | 22.6 | 40.5 | 40.6 | 29.1 | 42.6 | 45.9 |
| 2005 | 43.0 | 41.7 | 37.1 | 46.9 | 27.5 | 41.9 | 43.9 | 33.6 | 45.8 | 49.6 |
| 2006 | 41.9 | 40.2 | 38.7 | 45.8 | 26.4 | 42.3 | 41.6 | 32.2 | 43.7 | 47.9 |
| 2007 | 42.9 | 41.1 | 42.0 | 47.2 | 24.7 | 41.6 | 44.0 | 33.9 | 44.5 | 47.3 |
| 2008 | 43.0 | 41.6 | 40.7 | 46.8 | 27.9 | 42.2 | 43.7 | 33.5 | 43.9 | 49.6 |
| 2009 | 42.1 | 41.6 | 33.2 | 47.5 | 24.3 | 42.8 | 41.5 | 34.2 | 43.0 | 48.6 |
| 2010 | 43.7 | 42.6 | 31.4 | 49.6 | 24.4 | 44.1 | 43.4 | 31.8 | 47.7 | 52.0 |
| 2011 | 44.1 | 43.4 | 32.7 | 49.1 | 28.3 | 44.0 | 44.1 | 34.7 | 47.4 | 51.1 |
| 2012 | 46.4 | 45.8 | 36.1 | 51.3 | 31.5 | 47.8 | 45.1 | 36.7 | 47.2 | 54.3 |
| 2013 | 44.9 | 44.7 | 30.5 | 50.5 | 30.2 | 45.9 | 44.0 | 33.7 | 45.4 | 53.9 |
| 2014 | 43.6 | 43.6 | 29.4 | 48.2 | 33.0 | 43.8 | 43.5 | 32.2 | 44.9 | 53.1 |
| 2015 | 43.4 | 43.5 | 28.4 | 47.9 | 33.6 | 43.9 | 42.9 | 32.7 | 43.7 | 54.2 |
| 2016 | 43.0 | 43.3 | 28.3 | 47.8 | 32.8 | 43.4 | 42.6 | 32.3 | 42.6 | 55.0 |
| 2017 | 45.6 | 45.8 | 31.0 | 50.0 | 36.6 | 47.1 | 44.2 | 35.3 | 45.7 | 54.8 |
| 2018 | 46.0 | 46.2 | 33.9 | 50.1 | 37.0 | 48.1 | 43.9 | 34.3 | 45.5 | 56.5 |
| Total (%) | Age Group (%) * | Sex (%) * | Level of Education (%) †,ᵟ | |||||||
|---|---|---|---|---|---|---|---|---|---|---|
| Year | ≥12 Years | ≥25 Years | Adolescents (12–17) | Adults (18–64) | Seniors (65+) | Male | Female | Lower | Intermediate | Higher |
| 2001 | 47.1 | 46.9 | 37.7 | 52.0 | 28.2 | 48.0 | 46.3 | 41.7 | 52.2 | 48.3 |
| 2002 | 48.1 | 47.5 | 39.9 | 52.4 | 31.7 | 48.8 | 47.4 | 41.2 | 51.9 | 51.6 |
| 2003 | 47.5 | 46.9 | 40.3 | 51.3 | 32.5 | 49.4 | 45.7 | 40.6 | 50.1 | 52.6 |
| 2004 | 47.3 | 46.8 | 40.0 | 51.9 | 29.0 | 48.4 | 46.3 | 37.2 | 50.7 | 51.2 |
| 2005 | 50.6 | 49.7 | 40.4 | 54.9 | 35.4 | 51.0 | 50.1 | 41.7 | 55.7 | 54.7 |
| 2006 | 49.1 | 48.0 | 41.4 | 53.9 | 31.9 | 50.5 | 47.8 | 40.2 | 52.9 | 53.4 |
| 2007 | 50.1 | 48.6 | 46.1 | 54.6 | 32.8 | 50.0 | 50.2 | 42.0 | 52.5 | 53.4 |
| 2008 | 50.0 | 48.9 | 43.4 | 54.5 | 34.2 | 50.7 | 49.3 | 41.4 | 52.5 | 54.6 |
| 2009 | 50.2 | 49.9 | 37.7 | 56.5 | 30.7 | 52.7 | 48.0 | 40.9 | 54.5 | 55.3 |
| 2010 | 50.6 | 49.5 | 34.4 | 56.9 | 31.1 | 52.1 | 49.0 | 39.8 | 55.4 | 56.8 |
| 2011 | 51.1 | 50.8 | 36.1 | 56.9 | 33.9 | 52.7 | 49.6 | 43.0 | 55.3 | 56.8 |
| 2012 | 54.8 | 54.2 | 42.5 | 59.9 | 39.7 | 57.3 | 52.2 | 46.3 | 56.2 | 60.6 |
| 2013 | 52.2 | 51.9 | 35.3 | 58.0 | 37.1 | 54.7 | 49.7 | 42.8 | 52.7 | 59.1 |
| 2014 | 51.3 | 51.6 | 33.7 | 56.3 | 40.9 | 52.9 | 49.8 | 41.1 | 54.0 | 58.8 |
| 2015 | 50.5 | 50.7 | 32.3 | 55.0 | 42.1 | 51.8 | 49.2 | 41.0 | 52.1 | 58.7 |
| 2016 | 49.9 | 50.3 | 32.8 | 54.8 | 40.1 | 51.4 | 48.3 | 41.0 | 50.0 | 59.6 |
| 2017 | 52.9 | 53.3 | 35.5 | 57.5 | 44.3 | 56.1 | 49.8 | 44.0 | 54.7 | 59.5 |
| 2018 | 52.4 | 52.8 | 37.1 | 56.9 | 43.1 | 55.7 | 49.1 | 42.5 | 52.8 | 61.3 |
| Total (%) | Age Group (%)* | Sex (%) * | Level of Education (%) †,ᵟ | |||||||
|---|---|---|---|---|---|---|---|---|---|---|
| Year | ≥12 Years | ≥25 Years | Adolescents (12–17) | Adults (18–64) | Seniors (65+) | Male | Female | Lower | Intermediate | Higher |
| 2001 | 71.8 | 70.2 | 82.5 | 73.3 | 58.8 | 70.3 | 73.3 | 62.2 | 71.9 | 81.5 |
| 2002 | 72.3 | 70.7 | 82.6 | 73.6 | 61.1 | 70.3 | 74.2 | 62.8 | 72.0 | 81.5 |
| 2003 | 72.8 | 71.3 | 81.5 | 73.9 | 62.3 | 72.5 | 73.2 | 63.3 | 72.8 | 81.9 |
| 2004 | 73.2 | 71.7 | 83.8 | 74.9 | 59.4 | 71.8 | 74.6 | 60.7 | 73.0 | 80.5 |
| 2005 | 74.2 | 72.8 | 82.8 | 76.1 | 61.4 | 72.3 | 76.1 | 65.2 | 74.5 | 83.0 |
| 2006 | 73.8 | 71.8 | 85.0 | 75.1 | 62.1 | 72.9 | 74.6 | 62.5 | 74.1 | 83.2 |
| 2007 | 74.7 | 73.2 | 83.7 | 77.0 | 61.0 | 73.2 | 76.2 | 65.2 | 76.3 | 81.2 |
| 2008 | 74.8 | 73.5 | 84.2 | 76.8 | 62.8 | 73.2 | 76.3 | 64.5 | 74.8 | 83.8 |
| 2009 | 73.2 | 71.1 | 81.4 | 75.5 | 61.0 | 71.5 | 74.8 | 63.4 | 69.9 | 81.3 |
| 2010 | 74.6 | 73.6 | 79.1 | 77.4 | 60.1 | 72.4 | 76.7 | 63.5 | 76.3 | 84.5 |
| 2011 | 74.8 | 73.1 | 84.2 | 76.5 | 63.4 | 71.9 | 77.6 | 64.3 | 75.0 | 83.2 |
| 2012 | 75.2 | 74.1 | 80.0 | 77.2 | 65.3 | 74.0 | 76.5 | 64.2 | 75.3 | 83.6 |
| 2013 | 75.9 | 75.0 | 79.1 | 78.1 | 66.0 | 74.0 | 77.8 | 63.3 | 76.4 | 84.0 |
| 2014 | 74.5 | 73.7 | 79.8 | 76.3 | 65.4 | 72.3 | 76.6 | 62.8 | 74.4 | 83.4 |
| 2015 | 75.2 | 74.4 | 79.1 | 76.9 | 67.6 | 73.5 | 76.8 | 63.6 | 74.9 | 84.5 |
| 2016 | 75.2 | 74.7 | 81.0 | 76.6 | 68.1 | 73.6 | 76.9 | 64.6 | 73.7 | 85.8 |
| 2017 | 76.5 | 76.2 | 78.9 | 78.3 | 69.5 | 74.5 | 78.5 | 67.9 | 74.7 | 85.0 |
| 2018 | 78.2 | 77.6 | 84.2 | 79.1 | 72.9 | 78.2 | 78.3 | 67.4 | 77.3 | 86.3 |
References
- Forouzanfar, M.H.; Afshin, A.; Alexander, L.T.; Anderson, H.R.; Bhutta, Z.A.; Biryukov, S.; Brauer, M.; Burnett, R.; Cercy, K.; Charlson, F.J.; et al. Global, regional, and national comparative risk assessment of 79 behavioural, environmental and occupational, and metabolic risks or clusters of risks, 1990–2015: A systematic analysis for the Global Burden of Disease Study 2015. Lancet 2016, 388, 1659–1724. [Google Scholar] [CrossRef]
- Guthold, R.; Stevens, G.A.; Riley, L.M.; Bull, F.C. Worldwide trends in insufficient physical activity from 2001 to 2016: A pooled analysis of 358 population-based surveys with 1·9 million participants. Lancet Glob. Health 2018, 6, e1077–e1086. [Google Scholar] [CrossRef]
- Lee, I.-M.; Shiroma, E.J.; Lobelo, F.; Puska, P.; Blair, S.N.; Katzmarzyk, P.T. Lancet Physical Activity Series Working Group. Effect of physical inactivity on major non-communicable diseases worldwide: An analysis of burden of disease and life expectancy. Lancet 2012, 380, 219–229. [Google Scholar] [CrossRef]
- Ding, D.; Lawson, K.D.; Kolbe-Alexander, T.L.; Finkelstein, E.A.; Katzmarzyk, P.T.; Van Mechelen, W.; Pratt, M. Lancet Physical Activity Series 2 Executive Committee The economic burden of physical inactivity: A global analysis of major non-communicable diseases. Lancet 2016, 388, 1311–1324. [Google Scholar] [CrossRef]
- World Health Organization. Global Action Plan for the Prevention and Control of Noncommunicable Diseases 2013–2020; World Health Organization: Geneva, Switzerland, 2013. [Google Scholar]
- World Health Organization. Global Action Plan on Physical Activity 2018–2030: More Active People for a Healthier World; World Health Organization: Geneva, Switzerland, 2018. [Google Scholar]
- Ministry of Health Welfare and Sport. Nationaal Sportakkoord Sport Verenigt Nederland; Ministry of Health Welfare and Sport: The Hague, The Netherlands, 2018.
- Ministry of Infrastructure and Water Management. Agenda Fiets 2017–2020; Ministry of Infrastructure and Water Management: The Hague, The Netherlands, 2017.
- Ministry of Health Welfare and Sport. Nationaal Preventieakkoord; Ministry of Health Welfare and Sport: The Hague, The Netherlands, 2018.
- Weggemans, R.M.; Backx, F.J.G.; Borghouts, L.; Chinapaw, M.; Hopman, M.T.E.; Koster, A.; Kremers, S.; Van Loon, L.J.C.; May, A.; Mosterd, A.; et al. The 2017 Dutch Physical Activity Guidelines. Int. J. Behav. Nutr. Phys. Act. 2018, 15, 58. [Google Scholar] [CrossRef] [PubMed]
- The Health Council of the Netherlands. Advies Beweegrichtlijnen 2017. Available online: https://www.gezondheidsraad.nl/documenten/adviezen/2017/08/22/beweegrichtlijnen-2017 (accessed on 7 January 2019).
- Kemper, H.; Ooijendijk, W.; Stiggelbout, M. Consensus Over de Nederlandse Norm Voor Gezond Bewegen; TNO: Den Haag, The Netherlands, 2000. [Google Scholar]
- Ding, D.; Varela, A.R.; Bauman, A.E.; Ekelund, U.; Lee, I.-M.; Heath, G.; Katzmarzyk, P.T.; Reis, R.; Pratt, M. Towards better evidence-informed global action: Lessons learnt from the Lancet series and recent developments in physical activity and public health. Br. J. Sports Med. 2019. [Google Scholar] [CrossRef] [PubMed]
- Kohl, H.W., 3rd; Craig, C.L.; Lambert, E.V.; Inoue, S.; Alkandari, J.R.; Leetongin, G.; Kahlmeier, S.; Lancet Physical Activity Series Working Group. The pandemic of physical inactivity: Global action for public health. Lancet 2012, 380, 294–305. [Google Scholar] [CrossRef]
- Breda, J.; Jakovljevic, J.; Rathmes, G.; Mendes, R.; Fontaine, O.; Hollmann, S.; Rütten, A.; Gelius, P.; Kahlmeier, S.; Galea, G. Promoting health-enhancing physical activity in Europe: Current state of surveillance, policy development and implementation. Health Policy 2018, 122, 519–527. [Google Scholar] [CrossRef] [PubMed]
- Bennie, J.A.; Pedisic, Z.; Van Uffelen, J.G.Z.; Gale, J.; Banting, L.K.; Vergeer, I.; Stamatakis, E.; Bauman, A.E.; Biddle, S.J.H. The descriptive epidemiology of total physical activity, muscle-strengthening exercises and sedentary behaviour among Australian adults--results from the National Nutrition and Physical Activity Survey. BMC Public Health 2016, 16, 73. [Google Scholar] [CrossRef] [PubMed]
- Vuori, I.; Lankenau, B.; Pratt, M. Physical activity policy and program development: The experience in Finland. Public Health Rep. 2004, 119, 331–345. [Google Scholar] [CrossRef] [PubMed]
- Stamatakis, E.; Ekelund, U.; Wareham, N.J. Temporal trends in physical activity in England: The Health Survey for England 1991 to 2004. Prev. Med. 2007, 45, 416–423. [Google Scholar] [CrossRef] [PubMed]
- Du, Y.; Liu, B.; Sun, Y.; Snetselaar, L.G.; Wallace, R.B.; Bao, W. Trends in adherence to the physical activity guidelines for Americans for aerobic activity and time spent on sedentary behavior among US adults, 2007 to 2016. JAMA Netw. 2019, 2, e197597. [Google Scholar] [CrossRef] [PubMed]
- Carlson, S.A.; Fulton, J.E.; Schoenborn, C.A.; Loustalot, F. Trend and Prevalence Estimates Based on the 2008 Physical Activity Guidelines for Americans. Am. J. Prev. Med. 2010, 39, 305–313. [Google Scholar] [CrossRef] [PubMed]
- Bennie, J.A.; De Cocker, K.; Teychenne, M.J.; Brown, W.J.; Biddle, S.J.H. The epidemiology of aerobic physical activity and muscle-strengthening activity guideline adherence among 383,928 U.S. adults. Int. J. Behav. Nutr. Phys. Act. 2019, 16, 34. [Google Scholar] [CrossRef] [PubMed]
- Sjöström, M.; Oja, P.; Hagströmer, M.; Smith, B.J.; Bauman, A. Health-enhancing physical activity across European Union countries: The Eurobarometer study. J. Public Health 2006, 14, 291–300. [Google Scholar] [CrossRef]
- Hallal, P.C.; Andersen, L.B.; Bull, F.C.; Guthold, R.; Haskell, W.; Ekelund, U. Global physical activity levels: Surveillance progress, pitfalls, and prospects. Lancet 2012, 380, 247–257. [Google Scholar] [CrossRef]
- Bauman, A.; Ford, I.; Armstrong, T. Trends in Population Levels of Reported Physical Activity in Australia, 1997, 1999 and 2000; Australian Sports Commission: Canberra, Australia, 2001. [Google Scholar]
- Strain, T.; Fitzsimons, C.; Kelly, P.; Mutrie, N. The forgotten guidelines: Cross-sectional analysis of participation in muscle strengthening and balance & co-ordination activities by adults and older adults in Scotland. BMC Public Health 2016, 16, 1108. [Google Scholar]
- Milton, K.; Varela, A.R.; Strain, T.; Cavill, N.; Foster, C.; Mutrie, N. A review of global surveillance on the muscle strengthening and balance elements of physical activity recommendations. J. Frailty Sarcopenia Falls 2018, 3, 114–124. [Google Scholar] [CrossRef]
- Statistics Netherlands. Gezondheidsenquête 1981–1996 en POLS-Gezondheid 1997–2009. Available online: https://www.cbs.nl/nl-nl/onze-diensten/methoden/onderzoeksomschrijvingen/korte-onderzoeksbeschrijvingen/gezondheidsenquete-1981-1996-en-pols-gezondheid-1997-2009 (accessed on 6 December 2019).
- Statistics Netherlands. Vragenlijsten Gezondheidsenquête 2010 t/m 2013; Statistics Netherlands: Den Haag, The Netherlands, 2013. [Google Scholar]
- Statistics Netherlands. Gezondheidsenquête Vanaf 2014. Available online: https://www.cbs.nl/nl-nl/onze-diensten/methoden/onderzoeksomschrijvingen/korte-onderzoeksbeschrijvingen/gezondheidsenquete-vanaf-2014 (accessed on 6 December 2019).
- Statistics Netherlands, National Institute for Public Health and the Environment. Health Survey/Lifestyle Monitor; Statistics Netherlands (CBS) in collaboration with National Institute for Public Health and the Environment (RIVM): The Hague/Bilthoven, The Netherlands, 2001–2018. [Google Scholar]
- Statistics Netherlands. Permanent Onderzoek Leefsituatie: Basis. Available online: https://www.scp.nl/Onderzoek/Bronnen/Beknopte_onderzoeksbeschrijvingen/Permanent_onderzoek_naar_de_leefsituatie_POLS (accessed on 6 December 2019).
- Boonstra, H.J. Weging Gezondheidsenquete 2014; Statistics Netherlands: Den Haag, The Netherlands, 2015. [Google Scholar]
- Wendel-Vos, G. Reproducibility and relative validity of the short questionnaire to assess health-enhancing physical activity. J. Clin. Epidemiol. 2003, 56, 1163–1169. [Google Scholar] [CrossRef]
- Campbell, N.; Gaston, A.; Gray, C.; Rush, E.; Maddison, R.; Prapavessis, H. The Short Questionnaire to Assess Health-Enhancing (SQUASH) Physical Activity in Adolescents: A Validation Using Doubly Labeled Water. J. Phys. Act. Health 2016, 13, 154–158. [Google Scholar] [CrossRef]
- Makabe, S.; Makimoto, K.; Kikkawa, T.; Uozumi, H.; Ohnuma, M.; Kawamata, T. Reliability and validity of the Japanese version of the short questionnaire to assess health-enhancing physical activity (SQUASH squash) scale in older adults. J. Phys. Ther. Sci. 2015, 27, 517–522. [Google Scholar] [CrossRef] [PubMed]
- Wagenmakers, R.; Akker-Scheek, I.V.D.; Groothoff, J.W.; Zijlstra, W.; Bulstra, S.K.; Kootstra, J.W.; Wendel-Vos, G.W.; Van Raaij, J.J.; Stevens, M. Reliability and validity of the short questionnaire to assess health-enhancing physical activity (SQUASH) in patients after total hip arthroplasty. BMC Musculoskelet. Disord. 2008, 9, 141. [Google Scholar] [CrossRef] [PubMed]
- Ainsworth, B.E.; Haskell, W.L.; Whitt, M.C.; Irwin, M.L.; Swartz, A.M.; Strath, S.J.; O’brien, W.L.; Bassett, D.R.; Schmitz, K.H.; Emplaincourt, P.O.; et al. Compendium of physical activities: An update of activity codes and MET intensities. Med. Sci. Sports Exerc. 2000, 32, S498–S516. [Google Scholar] [CrossRef]
- Kumar, A.; Saxena, M.; Hammond, N.; Taylor, C.; Thompson, K.; Grattan, S. Near Two-fold Rise in ICD-coded Sepsis-related Hospital Admissions in Australia: An Australian Institute of Health and Welfare Database Analysis (2011–2016). Aust. Crit. Care 2019, 32, S7. [Google Scholar] [CrossRef]
- Scholes, S. Health Survey for England 2016 Physical Activity in Adults 978-1-78734-099-2; HSCIC: Leeds, UK, 2017. [Google Scholar]
- Loyen, A.; Van Hecke, L.; Verloigne, M.; Hendriksen, I.; Lakerveld, J.; Steene-Johannessen, J.; Vuillemin, A.; Koster, A.; Donnelly, A.; Ekelund, U.; et al. Variation in population levels of physical activity in European adults according to cross-European studies: A systematic literature review within DEDIPAC. Int. J. Behav. Nutr. Phys. Act. 2016, 13, 72. [Google Scholar] [CrossRef] [PubMed]
- Morren, M.; Willems, R. Gezondheidsenquête 2014: Een Analyse Van de Methodebreuk; Statistics Netherlands: Heerlen, The Netherlands, 2015. [Google Scholar]
- Troiano, R.P. A timely meeting: Objective measurement of physical activity. Med. Sci. Sports Exerc. 2005, 37, S487–S489. [Google Scholar] [CrossRef]
- Loyen, A.; Clarke-Cornwell, A.M.; Anderssen, S.A.; Hagströmer, M.; Sardinha, L.B.; Sundquist, K.; Ekelund, U.; Steene-Johannessen, J.; Baptista, F.; Hansen, B.H.; et al. Sedentary Time and Physical Activity Surveillance Through Accelerometer Pooling in Four European Countries. Sports Med. 2017, 47, 1421–1435. [Google Scholar] [CrossRef]
- Holtermann, A.; Hansen, J.; Burr, H.; Søgaard, K.; Sjøgaard, G. The health paradox of occupational and leisure-time physical activity. Br. J. Sports Med. 2012, 46, 291–295. [Google Scholar] [CrossRef]
- Althoff, T.; Sosič, R.; Hicks, J.L.; King, A.C.; Delp, S.L.; Leskovec, J. Large-scale physical activity data reveal worldwide activity inequality. Nature 2017, 547, 336–339. [Google Scholar] [CrossRef]
- King, A.C.; King, D.K. Physical Activity for an Aging Population. Public Health Rev. 2010, 32, 401–426. [Google Scholar] [CrossRef]
- Telama, R. Tracking of physical activity from childhood to adulthood: A review. Obes. Facts 2009, 2, 187–195. [Google Scholar] [CrossRef] [PubMed]
- Rovio, S.P.; Yang, X.; Kankaanpää, A.; Aalto, V.; Hirvensalo, M.; Telama, R.; Pahkala, K.; Hutri-Kähönen, N.; Viikari, J.S.; Raitakari, O.T. Longitudinal physical activity trajectories from childhood to adulthood and their determinants: The Young Finns Study. Scand. J. Med. Sci. Sports 2018, 28, 1073–1083. [Google Scholar] [CrossRef]
- Drieskens, S.; Van Oyen, H.; Demarest, S.; Van der Heyden, J.; Gisle, L.; Tafforeau, J. Multiple risk behaviour: Increasing socio-economic gap over time? Eur. J. Public Health 2010, 20, 634–639. [Google Scholar] [CrossRef]
- Smith, P.; Frank, J.; Mustard, C. Trends in educational inequalities in smoking and physical activity in Canada: 1974–2005. J. Epidemiol. Community Health 2009, 63, 317–323. [Google Scholar] [CrossRef] [PubMed]
- Ding, D.; Do, A.; Schmidt, H.-M.; Bauman, A.E. A widening gap? Changes in multiple lifestyle risk behaviours by socioeconomic status in New South Wales, Australia, 2002–2012. PLoS ONE 2015, 10, e0135338. [Google Scholar] [CrossRef]
- Elgar, F.J.; Pförtner, T.-K.; Moor, I.; De Clercq, B.; Stevens, G.W.J.M.; Currie, C. Socioeconomic inequalities in adolescent health 2002–2010: A time-series analysis of 34 countries participating in the Health Behaviour in School-aged Children study. Lancet 2015, 385, 2088–2095. [Google Scholar] [CrossRef]


| Adults and Older People ≥18 Years of Age | Children and Adolescents 4–18 Years of Age |
|---|---|
|
|
| Domain | Activities † | Domain | Activities † |
|---|---|---|---|
| Transport to work/school | Walking to work/school † Cycling to work/school † | At work/school | Working activities, light/moderate * Working activities, strenuous * |
| Leisure time | Walking in leisure time † Cycling in leisure time † Gardening † Odd jobs † | Household | Household activities, light/moderate † Household activities, strenuous † |
| Sports | Sports (max. 4) † |
| Total (n) | Age Group (%) * | Sex (%) * | Level of Education (%) †,ᵟ | |||||||
|---|---|---|---|---|---|---|---|---|---|---|
| Year | ≥12 Years | ≥25 Years | Adolescents (12–17) | Adults (18–64) | Seniors (65+) | Male | Female | Lower | Intermediate | Higher |
| 2001 | 5971 | 4915 | 9 | 75 | 16 | 48 | 52 | 43 | 34 | 23 |
| 2002 | 5834 | 4775 | 9 | 74 | 17 | 47 | 53 | 42 | 34 | 24 |
| 2003 | 6566 | 5409 | 10 | 74 | 16 | 48 | 52 | 41 | 34 | 25 |
| 2004 | 7584 | 6157 | 10 | 74 | 16 | 48 | 52 | 31 | 39 | 30 |
| 2005 | 7128 | 5930 | 9 | 73 | 18 | 48 | 52 | 42 | 34 | 24 |
| 2006 | 6733 | 5601 | 9 | 73 | 18 | 48 | 52 | 41 | 34 | 25 |
| 2007 | 5951 | 4953 | 9 | 72 | 19 | 47 | 53 | 41 | 33 | 26 |
| 2008 | 6212 | 5170 | 9 | 72 | 20 | 48 | 52 | 39 | 34 | 27 |
| 2009 | 5962 | 3248 | 8 | 71 | 21 | 48 | 52 | 37 | 34 | 29 |
| 2010 | 7218 | 6085 | 7 | 72 | 21 | 47 | 53 | 38 | 30 | 32 |
| 2011 | 6262 | 5238 | 7 | 71 | 22 | 48 | 52 | 39 | 29 | 32 |
| 2012 | 6349 | 6085 | 7 | 71 | 22 | 47 | 53 | 34 | 33 | 34 |
| 2013 | 6444 | 5241 | 7 | 70 | 23 | 46 | 54 | 26 | 41 | 33 |
| 2014 | 7859 | 6331 | 9 | 69 | 23 | 51 | 49 | 30 | 40 | 30 |
| 2015 | 7783 | 6272 | 9 | 69 | 22 | 52 | 48 | 30 | 40 | 30 |
| 2016 | 7646 | 6137 | 9 | 68 | 23 | 48 | 52 | 30 | 38 | 31 |
| 2017 | 8819 | 6598 | 9 | 66 | 25 | 49 | 51 | 28 | 40 | 32 |
| 2018 | 8502 | 7115 | 8 | 70 | 22 | 49 | 51 | 26 | 39 | 35 |
| Prevalence rates for adherence to the physical activity guidelines in 2018 (#,#%) | ||||||||||
| Overall | 46.0 | 46.2 | 33.9 | 50.1 | 37.0 | 48.1 | 43.9 | 34.3 | 45.5 | 56.5 |
| Component 1 | 52.4 | 52.8 | 37.1 | 56.9 | 43.1 | 55.7 | 49.1 | 42.5 | 52.8 | 61.3 |
| Component 2 | 78.2 | 77.6 | 84.2 | 79.1 | 72.9 | 78.2 | 78.3 | 67.4 | 77.3 | 86.3 |
© 2020 by the authors. Licensee MDPI, Basel, Switzerland. This article is an open access article distributed under the terms and conditions of the Creative Commons Attribution (CC BY) license (http://creativecommons.org/licenses/by/4.0/).
Share and Cite
Duijvestijn, M.; van den Berg, S.W.; Wendel-Vos, G.C.W. Adhering to the 2017 Dutch Physical Activity Guidelines: A Trend over Time 2001–2018. Int. J. Environ. Res. Public Health 2020, 17, 681. https://doi.org/10.3390/ijerph17030681
Duijvestijn M, van den Berg SW, Wendel-Vos GCW. Adhering to the 2017 Dutch Physical Activity Guidelines: A Trend over Time 2001–2018. International Journal of Environmental Research and Public Health. 2020; 17(3):681. https://doi.org/10.3390/ijerph17030681
Chicago/Turabian StyleDuijvestijn, Marjolein, Saskia W. van den Berg, and G. C. Wanda Wendel-Vos. 2020. "Adhering to the 2017 Dutch Physical Activity Guidelines: A Trend over Time 2001–2018" International Journal of Environmental Research and Public Health 17, no. 3: 681. https://doi.org/10.3390/ijerph17030681
APA StyleDuijvestijn, M., van den Berg, S. W., & Wendel-Vos, G. C. W. (2020). Adhering to the 2017 Dutch Physical Activity Guidelines: A Trend over Time 2001–2018. International Journal of Environmental Research and Public Health, 17(3), 681. https://doi.org/10.3390/ijerph17030681