ALM Resuscitation Without Transfusion Improves Platelet Function and Survival After Liver Injury and Uncontrolled Hemorrhage


Abstract
1. Introduction
2. Materials and Methods
2.1. Animals and Ethics
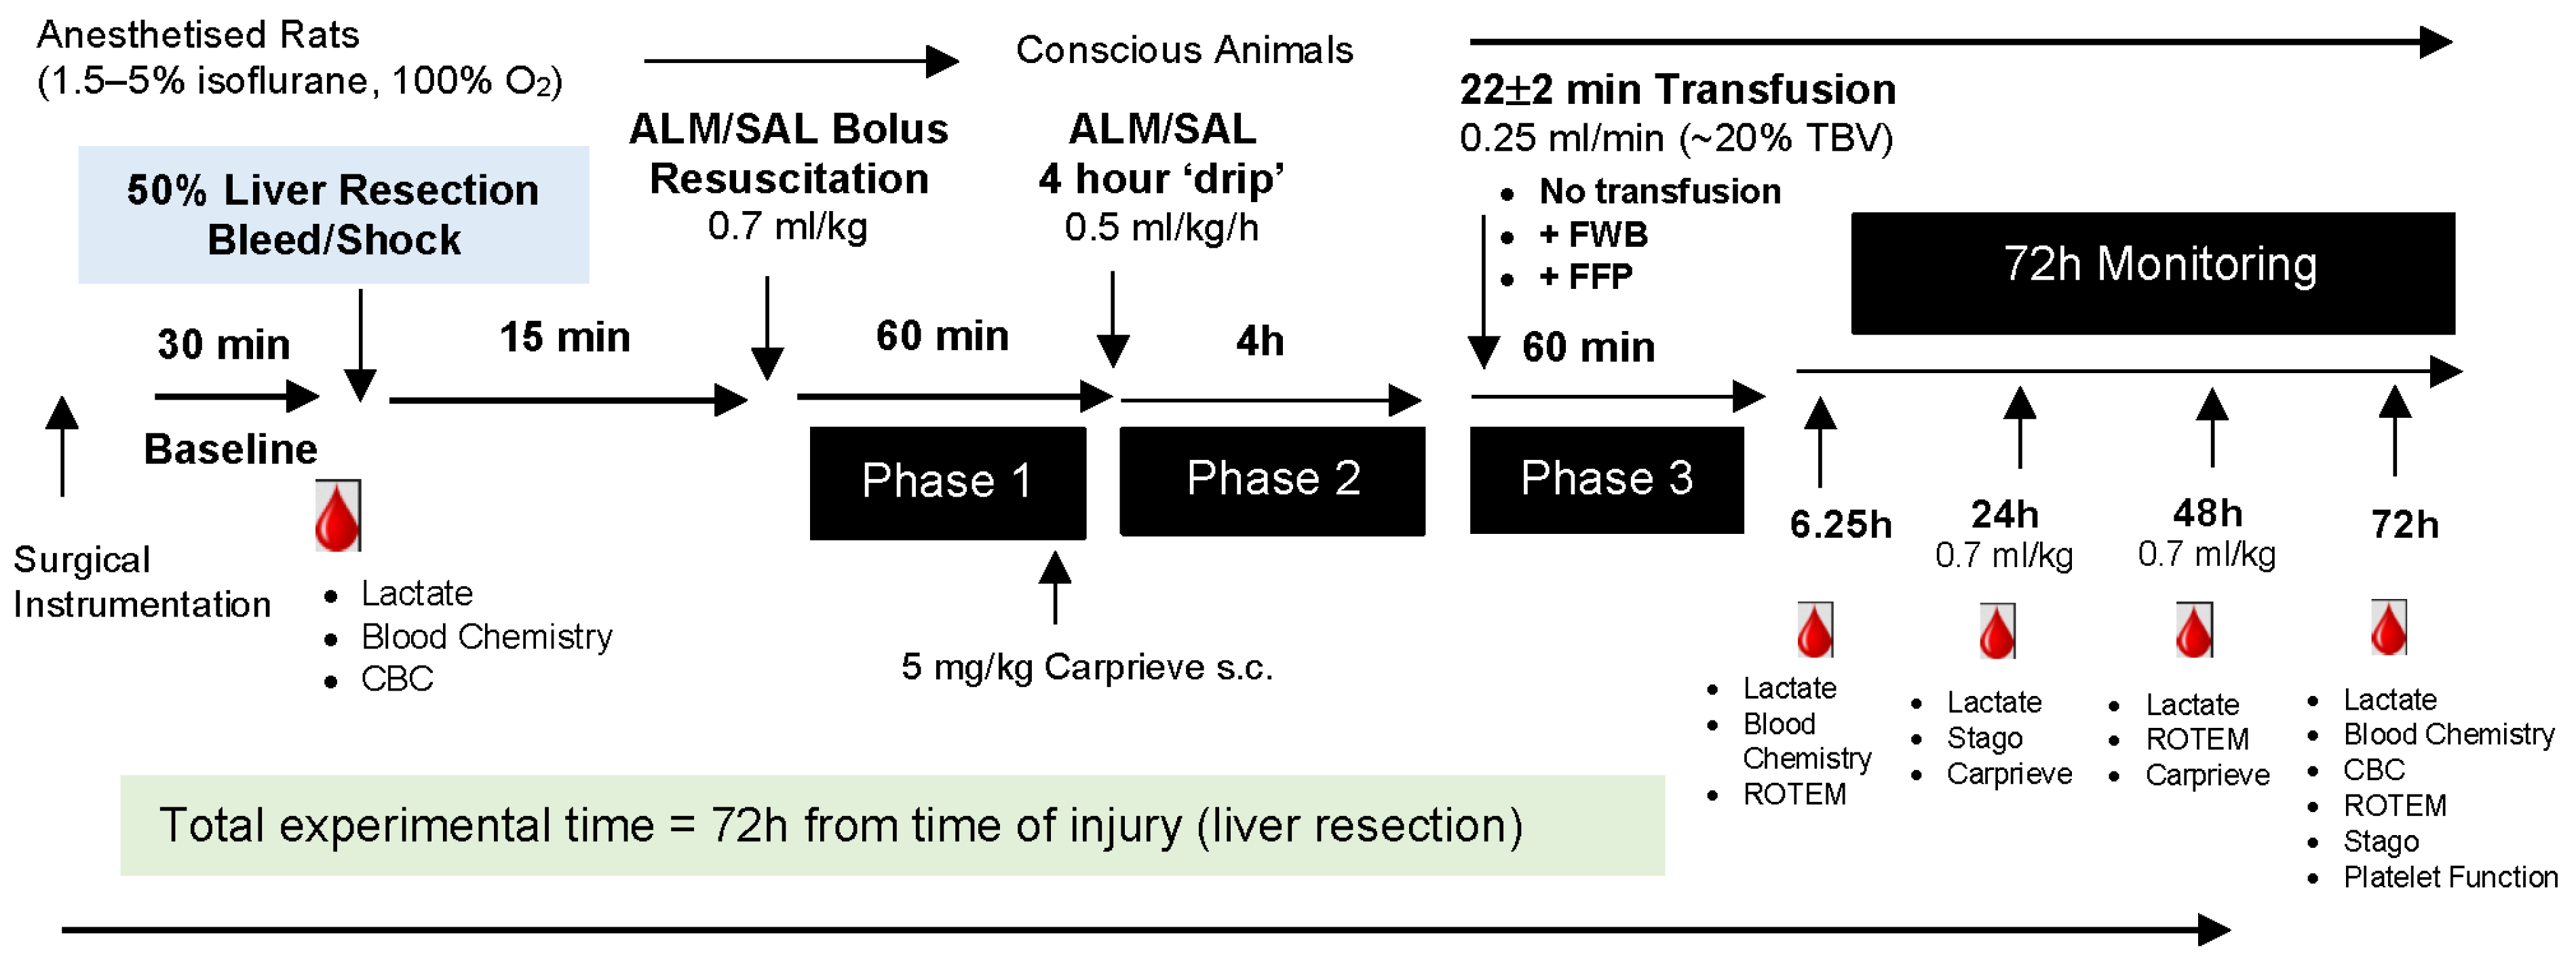
2.2. Surgical Protocol
2.3. Liver Injury and Uncontrolled Bleeding
2.4. Resuscitation and Transfusion
2.5. Preparation of FFP and FWB
2.6. Blood Sampling, Moribund Score and Mortality
2.7. Blood Chemistry, Hematology, Coagulation and Platelet Function
2.8. Lung Histopathology
2.9. Statistical Analysis
3. Results
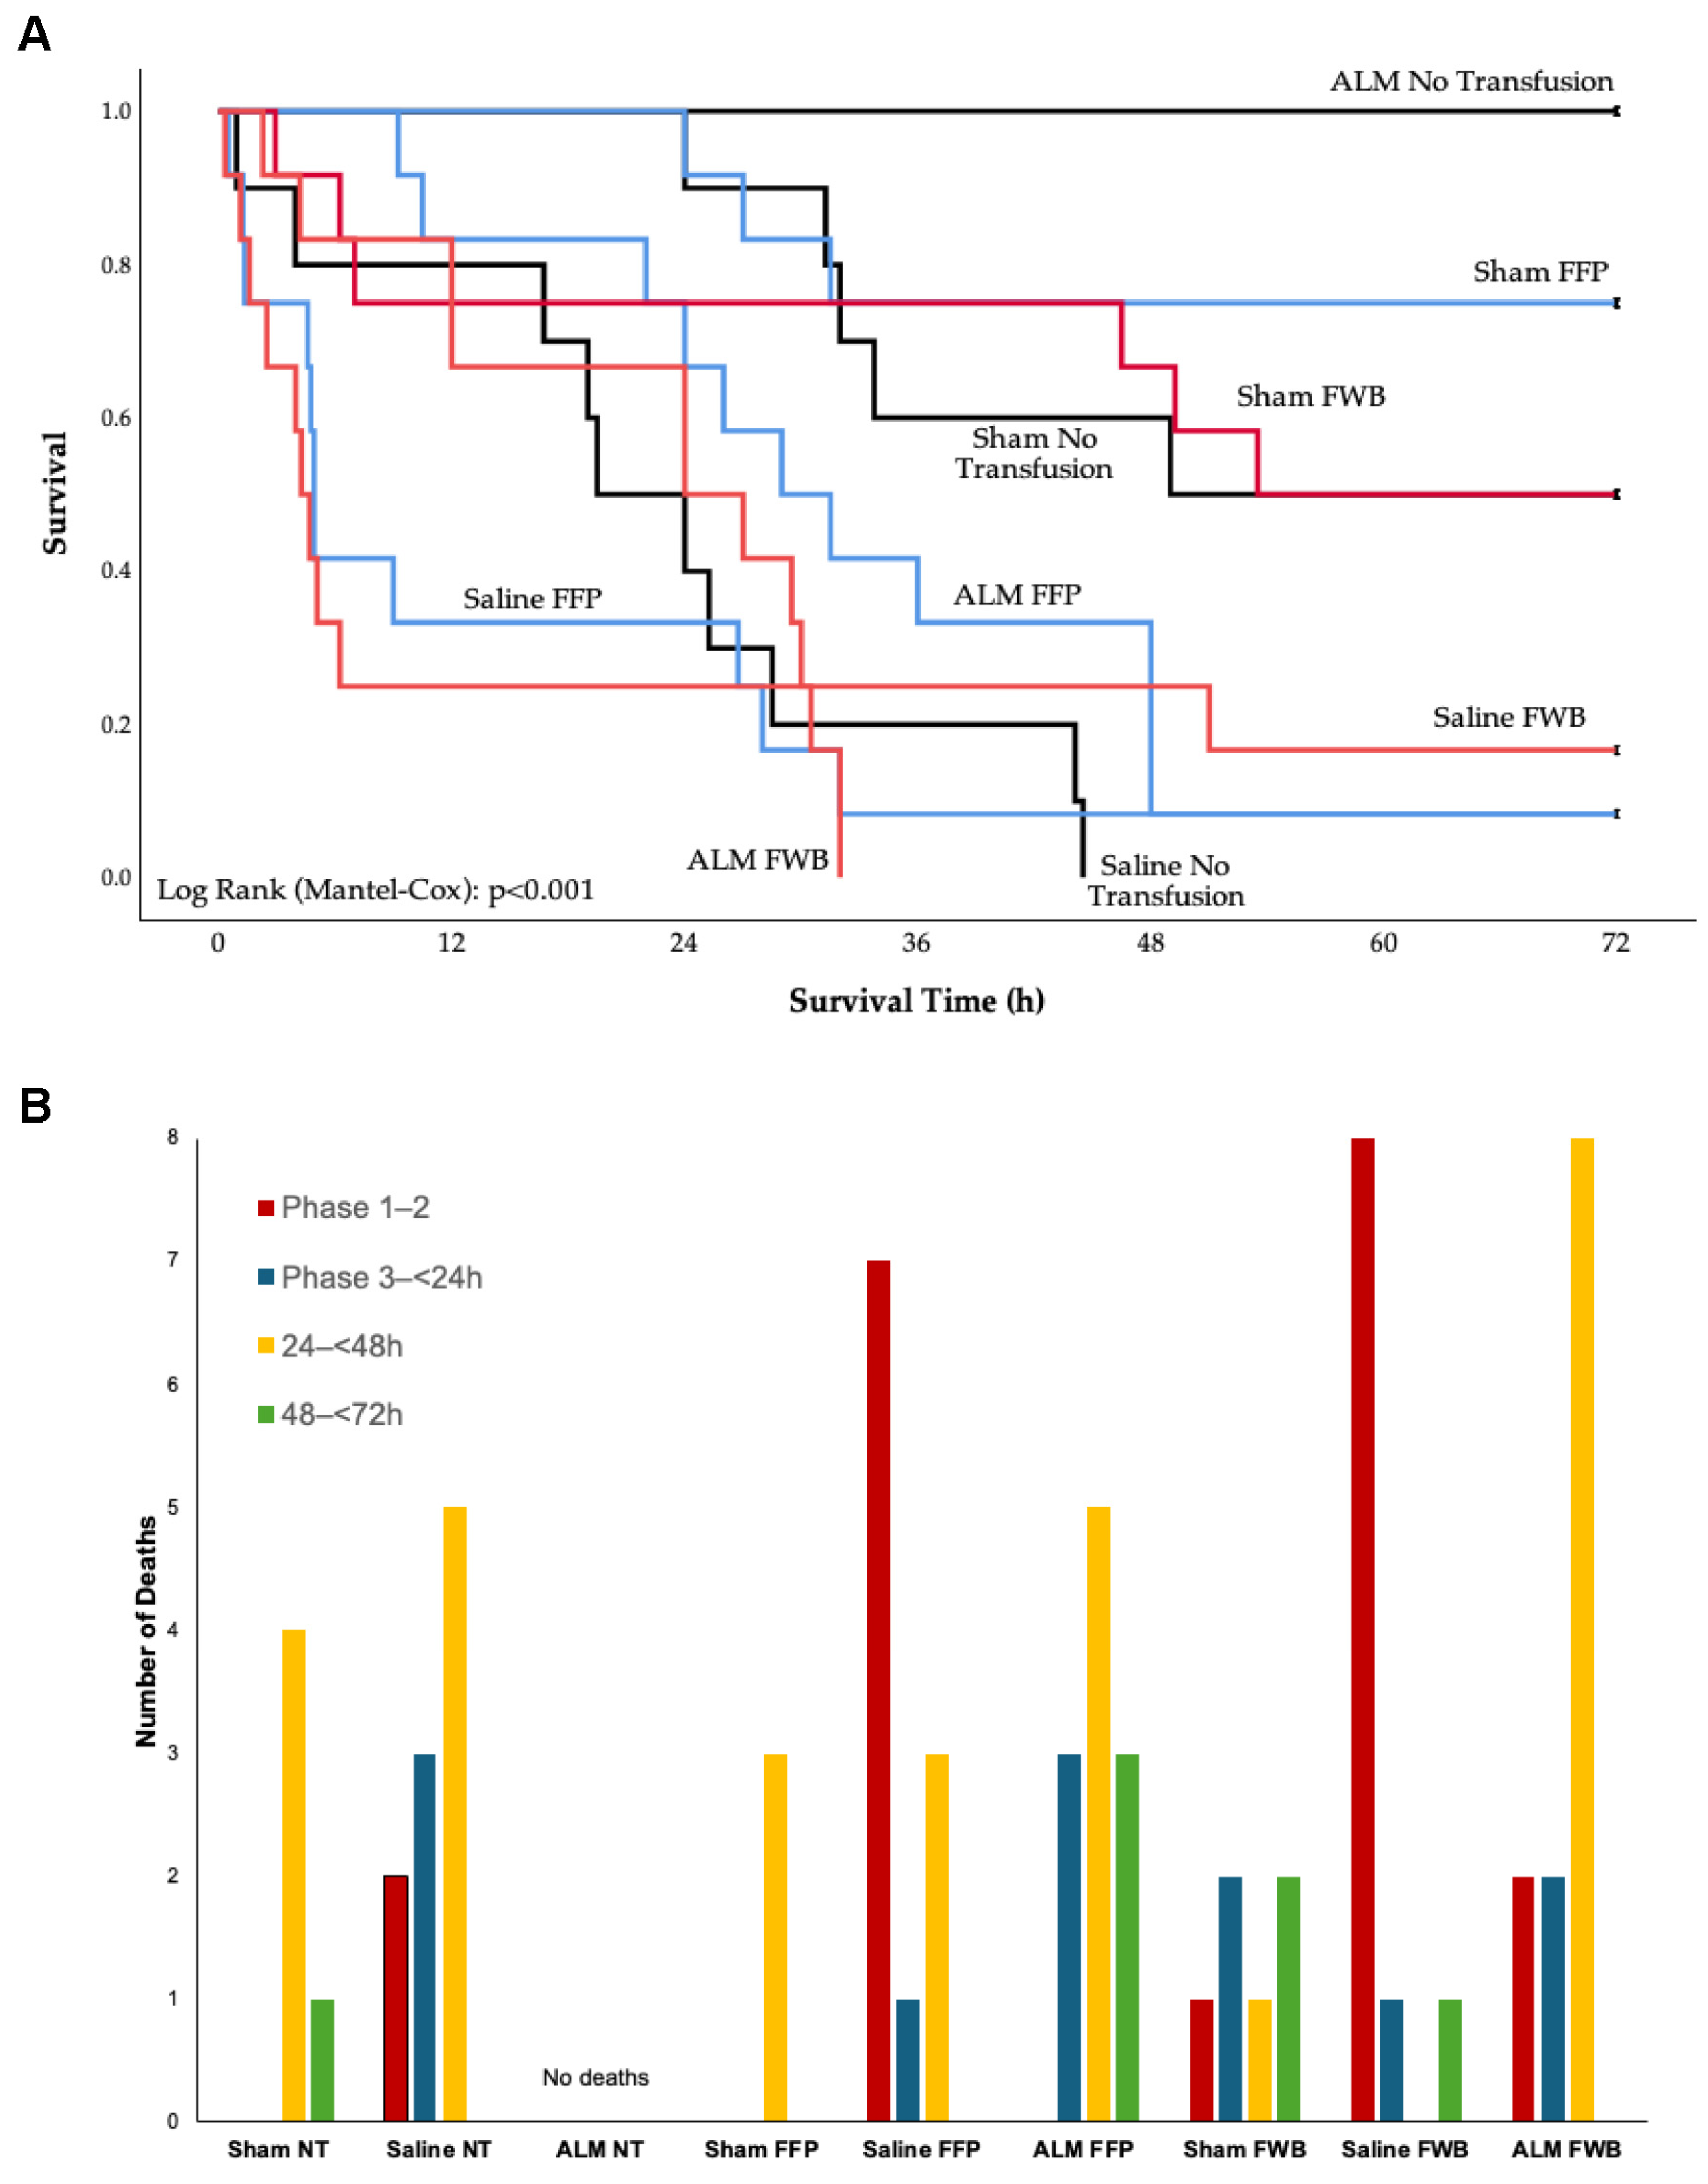
3.1. Survival
3.2. Hemodynamics
3.3. Blood Lactate and Chemistry
3.4. Red Cell and Platelet Profile
3.5. White Blood Cell (WBC) Profile
3.6. Coagulation
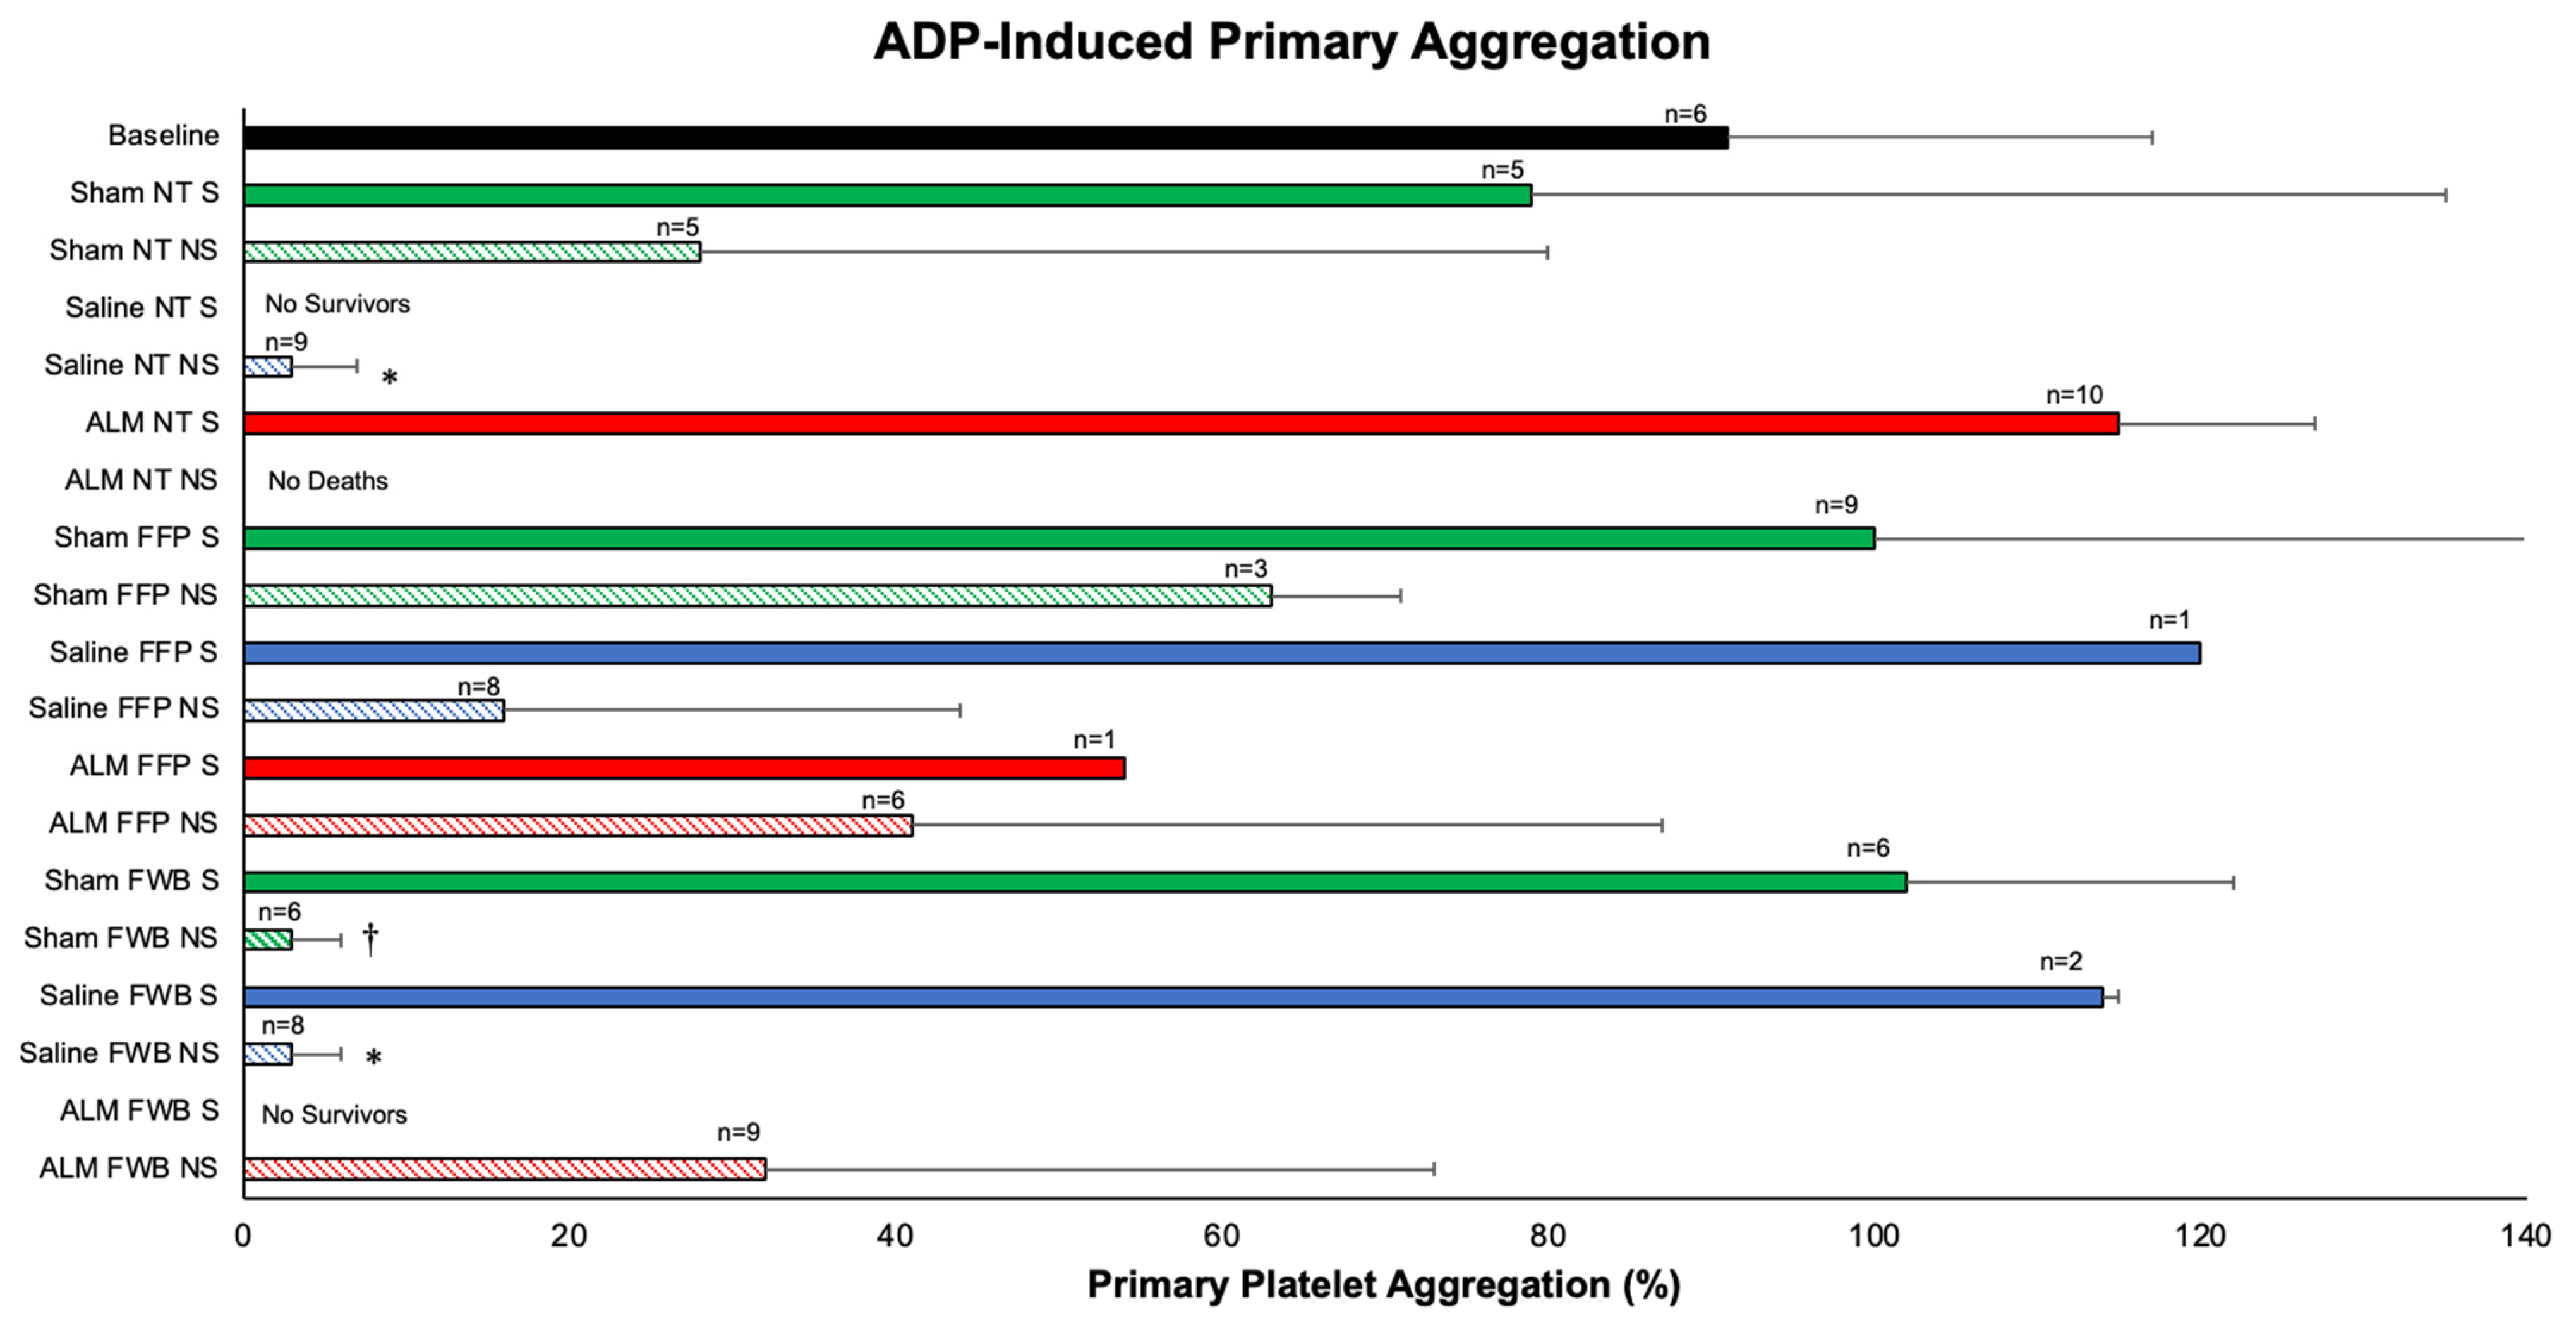
3.7. Platelet Function
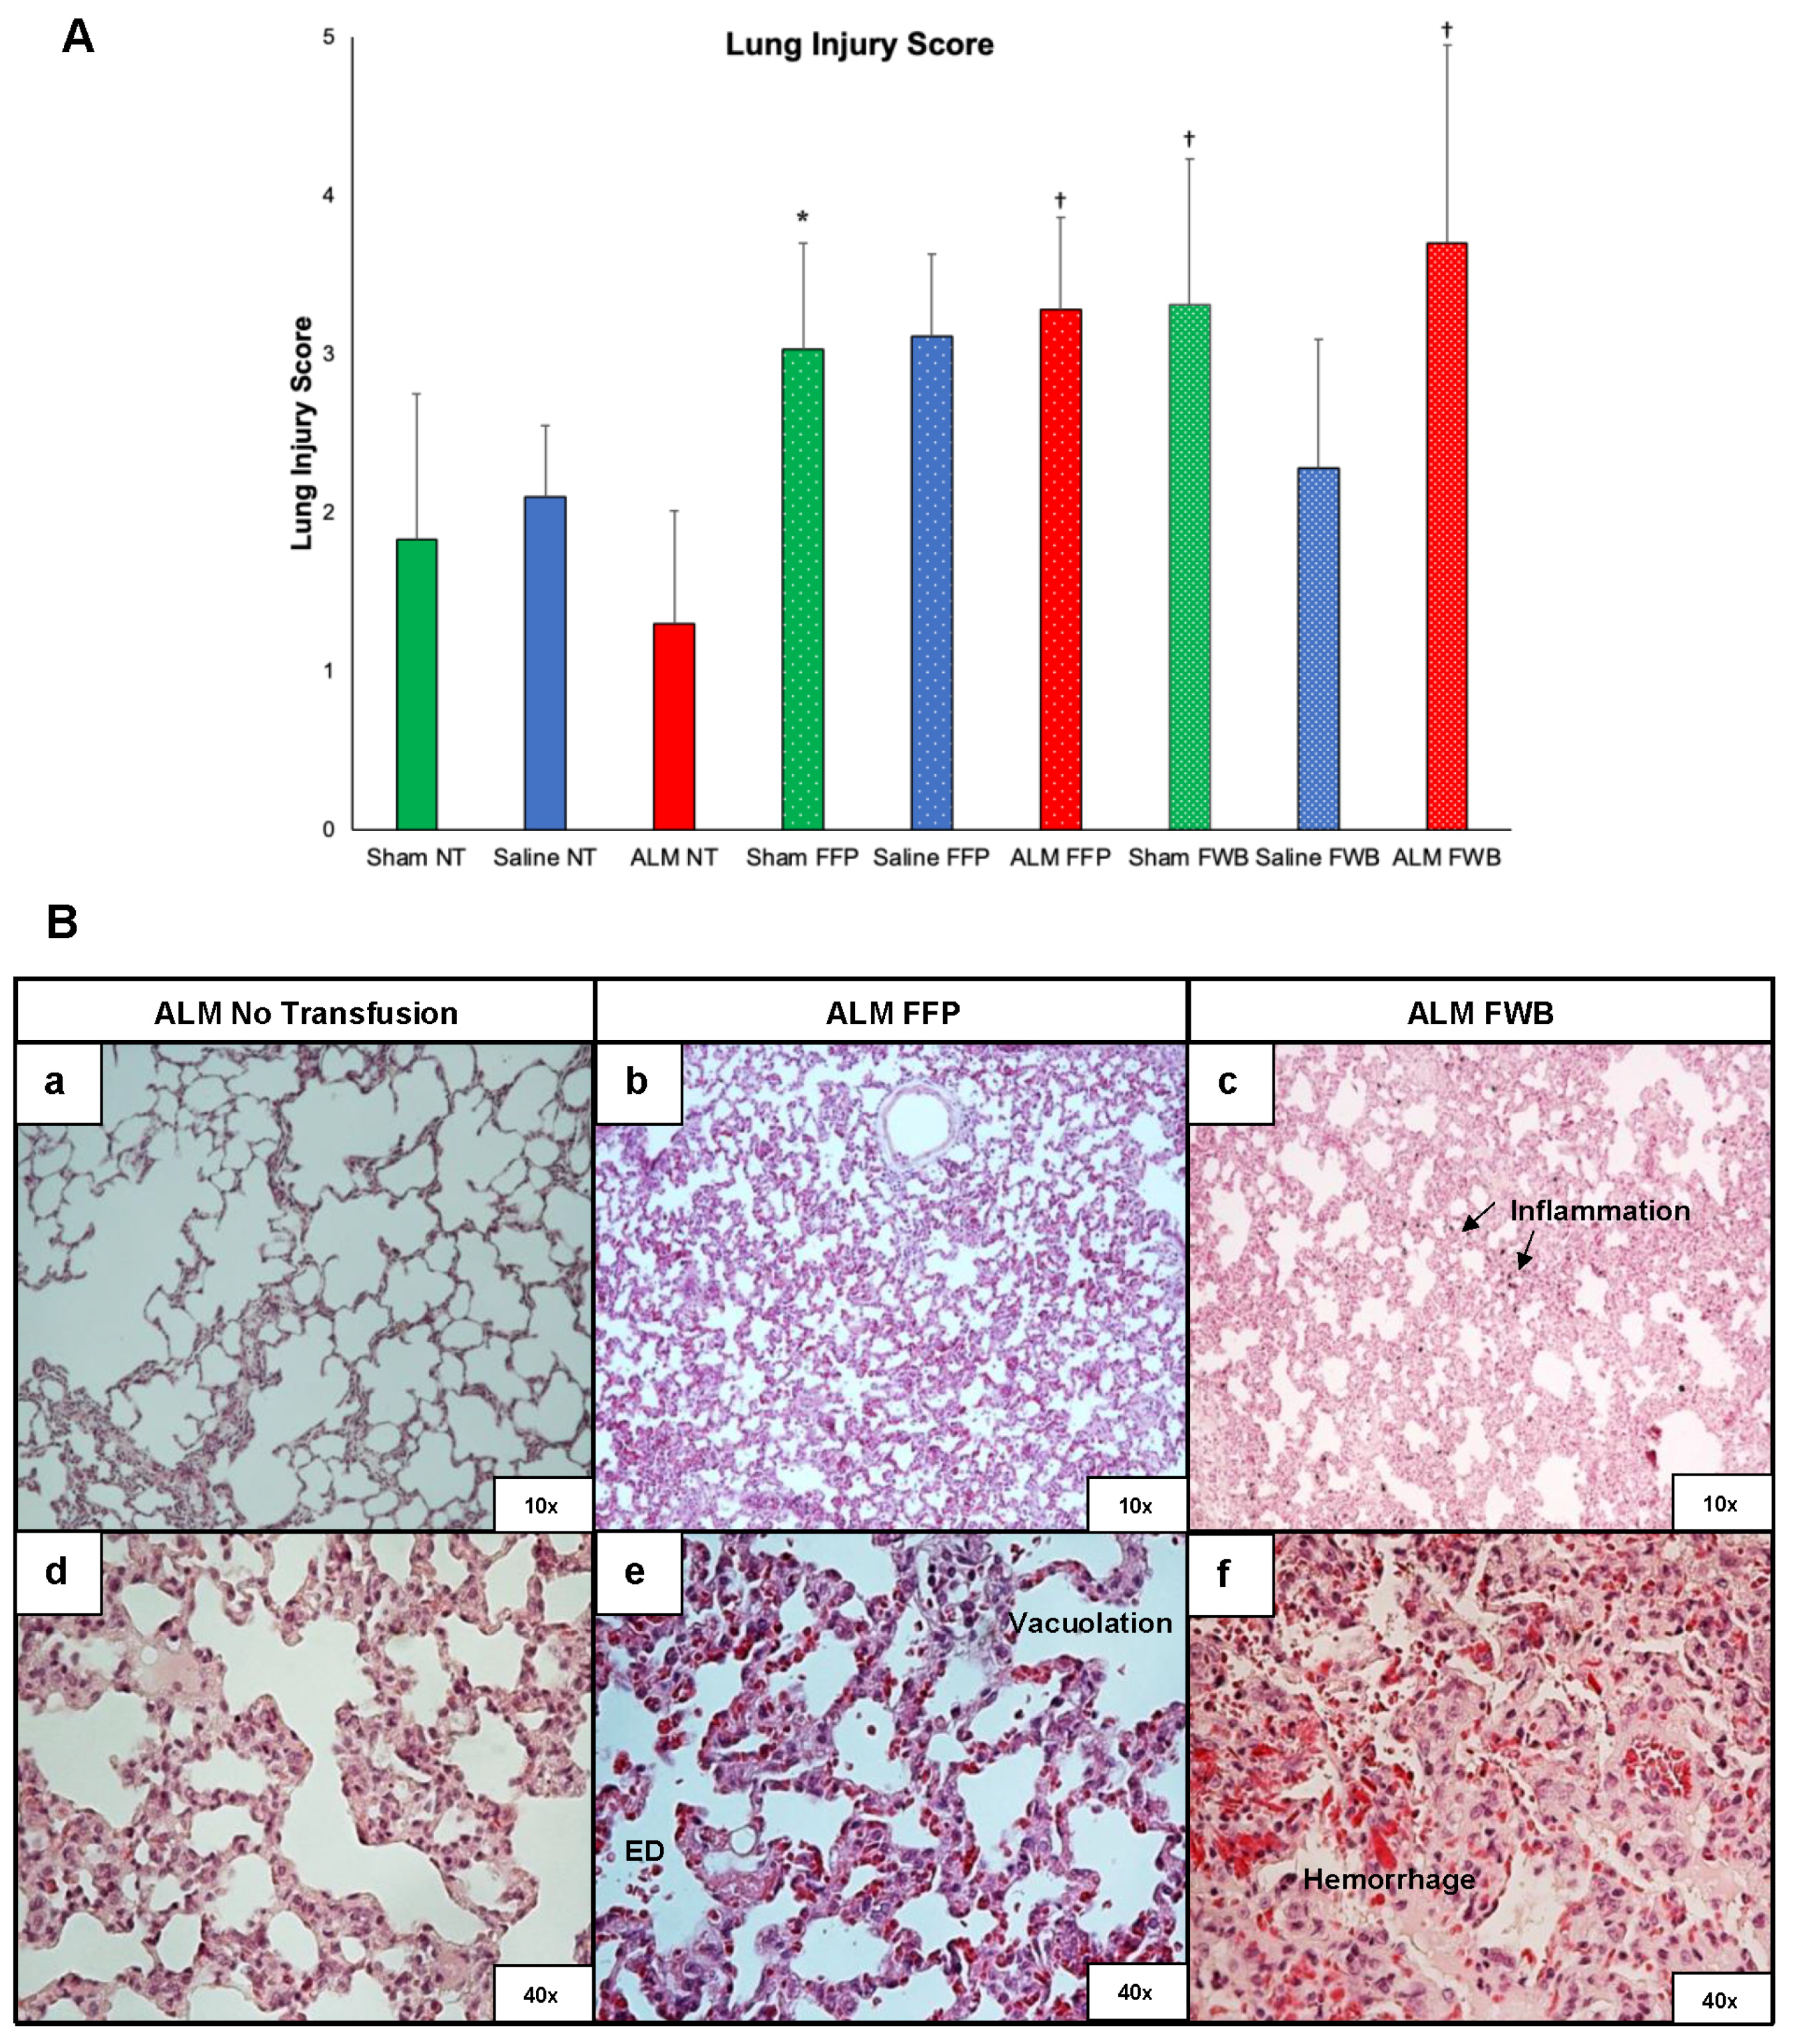
3.8. Lung Pathology
4. Discussion
4.1. Sham Mortality Was Due to the Trauma of Surgery, Not Hemorrhage
4.2. ALM Therapy Led to 100% Survival Without Blood Products
4.3. FWB and FFP Led to Poor Outcomes in All Groups
4.4. Mortality, Platelet Exhaustion and Coagulopathy
4.5. Survivors Preserved Platelet Aggregation and Reduced Coagulopathy and Immune Activation
4.6. Clinical Significance and Limitations
5. Conclusions
Supplementary Materials
Author Contributions
Funding
Institutional Review Board Statement
Data Availability Statement
Acknowledgments
Conflicts of Interest
Abbreviations
| ALM | Adenosine, lidocaine, magnesium |
| FFP | Fresh frozen plasma |
| FWB | Fresh whole blood |
| NT | No transfusion |
| MAP | Mean arterial pressure |
| Ampk | 5′ adenosine monophosphate-activated protein kinase |
| Sirt1 | Sirtuin 1 |
| Pgc1a | Peroxisome proliferator-activated receptor gamma coactivator 1-alpha |
| MtCo3 | Mitochondrially encoded cytochrome C oxidase III |
| Tfam | Transcription factor A, mitochondrial |
| ACURO | Animal Care and Use Review Office |
| ARRIVE | Animal Research: Reporting In Vivo Experiments |
| s.c. | Subcutaneous |
| IV | Intravenous |
| NaCl | Sodium chloride |
| MgSO4 | Magnesium sulfate |
| PT | Prothrombin time |
| aPTT | Activated partial thromboplastin time |
| TAFI | Tissue activatable fibrinolysis inhibitor |
| PRP | Platelet-rich plasma |
| ADP | Adenosine diphosphate |
| H&E | Hematoxylin and eosin |
| SD | Standard deviation |
| ANOVA | Analysis of variance |
| HR | Heart rate |
| K+ | Potassium |
| RBC | Red blood cell |
| Hct | Hematocrit |
| Hb | Hemoglobin |
| WBC | White blood cell |
| CT | Clot time |
| MCF | Maximum clot firmness |
| TRALI | Transfusion-related lung injury |
| ARDS | Acute respiratory distress syndrome |
| TIC | Trauma-induced coagulopathy |
| GPIIb/IIIa | Glycoprotein IIb/IIIa |
| TRIM | Transfusion-associated immunomodulation |
References
- Eastridge, B.J.; Mabry, R.L.; Seguin, P.; Cantrell, J.; Tops, T.; Uribe, P.; Mallett, O.; Zubko, T.; Oetjen-Gerdes, L.; Rasmussen, T.E.; et al. Death on the battlefield (2001–2011): Implications for the future of combat casualty care. J. Trauma. Acute Care Surg. 2012, 73, S431–S437. [Google Scholar] [CrossRef] [Scilit]
- Spinella, P.C.; Cap, A.P. Prehospital hemostatic resuscitation to achieve zero preventable deaths after traumatic injury. Curr. Opin. Hematol. 2017, 24, 529–535. [Google Scholar] [CrossRef] [Scilit] [PubMed]
- Brunskill, S.J.; Disegna, A.; Wong, H.; Fabes, J.; Desborough, M.J.R.; Dorée, C.; Davenport, R.; Curry, N.; Stanworth, S.J. Blood transfusion strategies for major bleeding in trauma. Cochrane Database Syst. Rev. 2025, 4, CD012635. [Google Scholar] [CrossRef] [Scilit] [PubMed]
- Anand, T.; Shin, H.; Ratnasekera, A.; Tran, M.L.; Huckeby, R.; Butts, L.; Stejskal, I.; Magnotti, L.J.; Joseph, B. Rethinking balanced resuscitation in trauma. J. Clin. Med. 2025, 14, 2111. [Google Scholar] [CrossRef] [Scilit] [PubMed]
- Bloch, E.M.; Jacobs, J.W.; Sachais, B.S.; Ziman, A.; Cushing, M.; Cap, A.P.; Gurney, J.M.; Beckett, A.; Yazer, M.H.; Spinella, P.C.; et al. Revisiting whole blood transfusion for the massively bleeding patient: The origins of resistance to change. Transfusion, 2025; Online Ahead of Print. [CrossRef] [Scilit]
- Cap, A.P.; Pidcoke, H.F.; DePasquale, M.; Rappold, J.F.; Glassberg, E.; Eliassen, H.S.; Bjerkvig, C.K.; Fosse, T.K.; Kane, S.; Thompson, P.; et al. Blood far forward: Time to get moving! J. Trauma. Acute Care Surg. 2015, 78, S2–S6. [Google Scholar] [CrossRef] [Scilit]
- Dobson, G.P.; Morris, J.L.; Davenport, L.M.; Letson, H.L. Traumatic-induced coagulopathy as a systems failure: A new window into hemostasis. Sem. Thromb. Hemost. 2020, 46, 199–214. [Google Scholar] [CrossRef] [Scilit]
- Holcomb, J.B.; Tilley, B.C.; Baraniuk, S.; Fox, E.E.; Wade, C.E.; Podbielski, J.M.; del Junco, D.J.; Brasel, K.J.; Bulger, E.M.; Callcut, R.A.; et al. Transfusion of plasma, platelets, and red blood cells in a 1:1:1 vs a 1:1:2 ratio and mortality in patients with severe trauma. JAMA 2015, 313, 471–482. [Google Scholar] [CrossRef] [Scilit]
- Makris, M.; Iorio, A. Prehospital fresh frozen plasma: Universal life saver or treatment in search of a target population? Res. Pract. Thromb. Haemost. 2018, 3, 12–14. [Google Scholar] [CrossRef] [Scilit]
- Walsh, M.; Moore, E.E.; Moore, H.B.; Thomas, S.; Kwaan, H.C.; Speybroeck, J.; Marsee, M.; Bunch, C.M.; Stillson, J.; Thomas, A.V.; et al. Whole blood, fixed ratio, or goal-directed blood component therapy for the initial resuscitation of severely hemorrhaging trauma patients: A narrative review. J. Clin. Med. 2021, 10, 320. [Google Scholar] [CrossRef] [Scilit]
- Jackson, B.; Murphy, C.; Fontaine, M.J. Current state of whole blood transfusion for civilian trauma resuscitation. Transfusion 2020, 60, S45–S52. [Google Scholar] [CrossRef] [Scilit] [PubMed]
- Spinella, P.C.; Perkins, J.G.; Grathwohl, K.W.; Beekley, A.C.; Holcomb, J.B. Warm fresh whole blood Is independently associated with improved survival for patients with combat-related traumatic injuries. J. Trauma: Inj. Infect. Crit. Care 2009, 66, S69–S76. [Google Scholar] [CrossRef] [Scilit] [PubMed]
- Perkins, J.G.; Cap, A.P.; Spinella, P.C.; Shorr, A.F.; Beekley, A.C.; Grathwohl, K.W.; Rentas, F.J.; Wade, C.E.; Holcomb, J.B.; the 31st Combat Support Hospital Research Group. Comparison of platelet transfusion as fresh whole blood versus apheresis platelets for massively transfused combat trauma patients. Transfusion 2011, 51, 242–252. [Google Scholar] [CrossRef] [Scilit]
- Acharya, P.; Hurson, T.; Annesi, C.; Carico, C.; Lammers, D.; Mann, N.C.; Levy, M.; Jarman, M.P.; Kerby, J.D.; Jansen, J.O.; et al. Unequal access to timely care: Geographic variation in prehospital time among injured patients at risk of hemorrhagic shock. Transfusion, 2026; Online ahead of print. [CrossRef] [Scilit]
- Burns, B.; Nolan, B.; Ferguson, I.; Peddle, M.; Partyka, C.; Healy, G.; Shackelford, S.; Cotton, B. Prehospital transfusion strategies in haemorrhagic shock. Scand. J. Trauma. Resusc. Emerg. Med. 2026, 34, 37. [Google Scholar] [CrossRef] [Scilit] [PubMed]
- Dobson, G.P.; Letson, H.L. Adenosine, lidocaine, and Mg2+ (ALM): From cardiac surgery to combat casualty care-Teaching old drugs new tricks. J. Trauma. Acute Care Surg. 2016, 80, 135–145. [Google Scholar] [CrossRef] [Scilit]
- Dobson, G.P.; Morris, J.; Letson, H.L. Adenosine, lidocaine and Mg2+ update: Teaching old drugs new tricks. Front. Med. 2023, 10, 1231759. [Google Scholar] [CrossRef] [Scilit]
- Letson, H.; Morris, J.L.; Biros, E.; Dobson, G.P. Adenosine, lidocaine, and Mg2+ fluid therapy leads to 72-hour survival after hemorrhagic shock: A model for studying differential gene expression and extending biological time. J. Trauma. Acute Care Surg. 2019, 87, 606–613. [Google Scholar] [CrossRef] [Scilit]
- Letson, H.L.; Dobson, G.P. 3% NaCl adenosine, lidocaine, Mg2+ (ALM) bolus and 4 hours “drip” infusion reduces noncompressible hemorrhage by 60% in a rat model. J. Trauma. Acute Care Surg. 2017, 82, 1063–1072. [Google Scholar] [CrossRef] [Scilit]
- Letson, H.L.; Dobson, G.P. Adenosine, lidocaine and Mg2+ (ALM) fluid therapy attenuates systemic inflammation, platelet dysfunction and coagulopathy after non-compressible truncal hemorrhage. PLoS ONE 2017, 12, e0188144. [Google Scholar] [CrossRef] [Scilit]
- Letson, H.L.; Biros, E.; Morris, J.L.; Dobson, G.P. ALM fluid therapy shifts sympathetic hyperactivity to parasympathetic dominance in the rat model of non-compressible hemorrhagic shock. Shock 2022, 57, 264–273. [Google Scholar] [CrossRef] [Scilit]
- Percie du Sert, N.; Ahluwalia, A.; Alam, S.; Avey, M.T.; Baker, M.; Browne, W.J.; Clark, A.; Cuthill, I.C.; Dirnagl, U.; Emerson, M.; et al. Reporting animal research: Explanation and elaboration for the ARRIVE guidelines 2.0. PLoS Biol. 2020, 18, e3000411. [Google Scholar] [CrossRef] [Scilit]
- Morgan, C.E.; Prakash, V.S.; Vercammen, J.M.; Pritts, T.; Kibbe, M.R. Development and validation of 4 different rat models of uncontrolled hemorrhage. JAMA Surg. 2015, 150, 316–324. [Google Scholar] [CrossRef] [Scilit]
- Fulop, A.; Turoczi, Z.; Garbaisz, D.; Harsanyi, L.; Szijarto, A. Experimental models of hemorrhagic shock: A review. Eur. Surg. Res. 2013, 50, 57–70. [Google Scholar] [CrossRef] [Scilit]
- Stach, P.; Skowron, K.; Sobocinska, W.; Gil, K. Experimental rat models of hemorrhagic shock: Insights into controlled, uncontrolled, and trauma-associated protocols. J. Physiol. Pharmacol. 2026, 76, 621–634. [Google Scholar] [CrossRef]
- Gurney, J.M.; Kotwal, R.S.; Holcomb, J.B.; Staudt, A.M.; Eastridge, B.; Sirkin, M.; Jensen, S.M.; Shackelford, S.M.; Sonka, B.J.M.; Wilson, J.N.; et al. A trauma expert consensus: Capabilities are required early to improve survivability from traumatic injury. J. Trauma. Acute Care Surg. 2024, 97, S82–S90. [Google Scholar] [CrossRef] [Scilit] [PubMed]
- Shah, K.G.; Jacob, A.; Rajan, D.; Wu, R.; Molmenti, E.P.; Nicastro, J.; Coppa, G.F.; Wang, P. Resuscitation of uncontrolled traumatic hemorrhage induced by severe liver injury: The use of human adrenomedullin and adrenomedullin binding protein-1. J. Trauma 2010, 69, 1415–1421. [Google Scholar] [CrossRef] [Scilit] [PubMed]
- Heathcote, K.; Devlin, A.; McKie, E.; Cameron, P.; Earnest, A.; Morgan, G.; Gardiner, B.; Campbell, D.; Wullschleger, M.; Warren, J. Rural and urban patterns of severe injuries and hospital mortality in Australia: An analysis of the Australia New Zealand Trauma Registry: 2015–2019. Injury 2022, 53, 1893–1903. [Google Scholar] [CrossRef] [Scilit]
- de Souza, J.C.; Letson, H.L.; Gibbs, C.R.; Dobson, G.P. The burden of head trauma in rural and remote North Queensland, Australia. Injury 2024, 55, 111181. [Google Scholar] [CrossRef] [Scilit]
- Jones, A.R.; Miller, J.; Brown, M. Epidemiology of trauma-related hemorrhage and time to definitive care across North America: Making the case for bleeding control education. Prehosp. Disaster Med. 2023, 38, 780–783. [Google Scholar] [CrossRef] [Scilit]
- Lundberg, O.H.M.; Lapidus, O.; Backstrom, D. Prehospital time intervals for trauma patients according to population density levels in Sweden; a national retrospective cohort study. Scand. J. Trauma. Resusc. Emerg. Med. 2025, 3, 193. [Google Scholar] [CrossRef] [Scilit]
- Lee, H.B.; Blaufox, M.D. Blood volume in the rat. J. Nucl. Med. 1985, 26, 72–76. [Google Scholar] [PubMed]
- Cardenas, J.C.; Cap, A.P.; Swartz, M.D.; Huby, M.D.P.; Baer, L.A.; Matijevic, N.; Cotton, B.A.; Holcomb, J.B.; Wade, C.E. Plasma resuscitation promotes coagulation homeostasis following shock-induced hypercoagulability. Shock 2016, 45, 166–173. [Google Scholar] [CrossRef] [Scilit] [PubMed]
- Morton, D.B. A systematic approach for establishing humane endpoints. ILAR J. 2000, 41, 80–86. [Google Scholar] [CrossRef] [Scilit] [PubMed]
- Toth, L.A. Defining the moribund condition as an experimental endpoint for animal research. ILAR J. 2000, 41, 72–79. [Google Scholar] [CrossRef] [Scilit]
- Nemzek, J.A.; Xiao, H.Y.; Minard, A.E.; Bolgos, G.L.; Remick, D.G. Humane endpoints in shock research. Shock 2004, 21, 17–25. [Google Scholar] [CrossRef] [Scilit]
- Letson, H.L.; Dobson, G.P. Correction of acute traumatic coagulopathy with small-volume 7.5% NaCl adenosine, lidocaine, and Mg2+ occurs within 5 minutes: A ROTEM analysis. J. Trauma. Acute Care Surg. 2015, 78, 773–783. [Google Scholar] [CrossRef] [Scilit]
- Messora, M.R.; Nagata, M.J.H.; Furlaneto, F.A.C.; Dornelles, R.C.M.; Bomfim, S.R.M.; Deliberador, T.M.; Garcia, V.D.; Bosco, A.F. A standardized research protocol for platelet-rich plasma (PRP) preparation in rats. RSBO 2011, 8, 299–304. [Google Scholar]
- Letson, H.L.; Granfeldt, A.; Jensen, T.H.; Mattson, T.H.; Dobson, G.P. Adenosine, lidocaine, and magnesium support a high flow, hypotensive, vasodilatory state with improved oxygen delivery and cerebral protection in a pig model of noncompressible hemorrhage. J. Surg. Res. 2020, 253, 127–138. [Google Scholar] [CrossRef] [Scilit]
- Pati, S.; Matijevic, N.; Doursout, M.F.; Ko, T.; Cao, Y.; Deng, X.; Kozar, R.A.; Hartwell, E.; Conyers, J.; Holcomb, J.B. Protective effects of fresh frozen plasma on vascular endothelial permeability, coagulation, and resuscitation after hemorrhagic shock are time dependent and diminish between days 0 and 5 after thaw. J. Trauma: Inj. Infect. Crit. Care 2010, 69, S55–S63. [Google Scholar] [CrossRef] [Scilit]
- Deng, X.; Cao, Y.; Huby, M.P.; Duan, C.; Baer, L.; Peng, Z.; Kozar, R.A.; Doursout, M.-F.; Holcomb, J.B.; Wade, C.E.; et al. Adiponectin in fresh frozen plasma contributes to restoration of vascular barrier function after hemorrhagic shock. Shock 2016, 45, 50–54. [Google Scholar] [CrossRef] [Scilit]
- Wirtz, M.R.; Jurgens, J.; Zuurbier, C.J.; Roelofs, J.; Spinella, P.C.; Muszynski, J.A.; Goslings, J.C.; Juffermans, N.P. Washing or filtering of blood products does not improve outcome in a rat model of trauma and multiple transfusion. Transfusion 2019, 59, 134–145. [Google Scholar] [CrossRef] [Scilit]
- Delano, M.J.; Rizoli, S.B.; Rhind, S.G.; Cuschieri, J.; Junger, W.; Baker, A.J.; Dubick, M.A.; Hoyt, D.B.; Bulger, E.M. Prehospital resuscitation of traumatic hemorrhagic shock with hypertonic solutions worsens hypocoagulation and hyperfibrinolysis. Shock 2015, 44, 25–31. [Google Scholar] [CrossRef] [Scilit]
- Letson, H.L.; Dobson, G.P. Unexpected 100% survival following 60% blood loss using small-volume 7.5% NaCl with adenocaine and Mg2+ in the rat model of extreme hemorrhagic shock. Shock 2011, 36, 586–594. [Google Scholar] [CrossRef] [Scilit]
- McVey, M.J.; Kapur, R.; Cserti-Gazdewich, C.; Semple, J.W.; Karkouti, K.; Kuebler, W.M. Transfusion-related acute lung injury in the perioperative patient. Anesthesiology 2019, 131, 693–715. [Google Scholar] [CrossRef] [Scilit]
- Moreno, A.R.; Fisher, A.D.; Long, B.J.; Douin, D.J.; Wright, F.L.; Rizzo, J.A.; April, M.D.M.; Cohen, M.J.; Getz, T.M.; Schauer, S.G.D. An analysis of the association of whole blood transfusion with the development of acute respiratory distress syndrome. Crit. Care Med. 2024, 53, e109–e116. [Google Scholar] [CrossRef] [Scilit] [PubMed]
- Kutcher, M.E.; Redick, B.J.; McCreery, R.C.; Crane, I.M.; Greenberg, M.D.; Cachola, L.M.; Nelson, M.F.R.; Cohen, M.J. Characterization of platelet dysfunction after trauma. J. Trauma. Acute Care Surg. 2012, 73, 13–19. [Google Scholar] [CrossRef] [Scilit]
- Solomon, C.; Traintinger, S.; Ziegler, B.; Hanke, A.; Rahe-Meyer, N.; Voelckel, W.; Schöchl, H. Platelet function following trauma. A multiple electrode aggregometry study. Thromb. Haemost. 2011, 106, 322–330. [Google Scholar] [CrossRef] [Scilit] [PubMed]
- White, N.J.; Newton, J.C.; Martin, E.J.; Mohammed, B.M.; Contaifer, D., Jr.; Bostic, J.L.; Brophy, G.M.; Spiess, B.D.; Pusateri, A.E.; Ward, K.R.; et al. Clot formation is associated with fibrinogen and platelet forces in a cohort of severely injured emergency department trauma patients. Shock 2015, 44, 39–44. [Google Scholar] [CrossRef] [Scilit] [PubMed]
- Dobson, G.P.; Morris, J.L.; Biros, E.; Davenport, L.M.; Letson, H.L. Major surgery leads to a proinflammatory phenotype: Differential gene expression following a laparotomy. Ann. Med. Surg. 2021, 71, 102970. [Google Scholar] [CrossRef] [Scilit]
- Esmon, C.T.; Xu, J.; Lupu, F. Innate immunity and coagulation. J. Thromb. Haemost. 2011, 9, 182–188. [Google Scholar] [CrossRef] [Scilit]
- Luyendyk, J.P.; Schoenecker, J.G.; Flick, M.J. The multifaceted role of fibrinogen in tissue injury and inflammation. Blood 2019, 133, 511–520. [Google Scholar] [CrossRef] [Scilit] [PubMed]
- Dobson, G.P.; Morris, J.L.; Letson, H.L. Immune dysfunction following severe trauma: A systems failure from the central nervous system to mitochondria. Front. Med. 2022, 9, 968453. [Google Scholar] [CrossRef] [Scilit] [PubMed]
- Pérez-Calatayud, A.A.; Görlinger, K. Molecular mechanisms of transfusion-associated immunomodulation and its impact in the critically ill. Int. J. Mol. Sci. 2026, 27, 30. [Google Scholar] [CrossRef] [Scilit]
- Lammers, D.; Betzold, R.; McClellan, J.; Eckert, M.; Bingham, J.; Hu, P.; Hurst, S.; Baird, E.; Hashmi, Z.; Kerby, J.; et al. Quantifying the benefit of whole blood on mortality in trauma patients requiring emergent laparotomy. J. Trauma. Acute Care Surg. 2024, 97, 747–752. [Google Scholar] [CrossRef] [Scilit] [PubMed]
- Malkin, M.; Nevo, A.; Brundage, S.I.; Schreiber, M. Effectiveness and safety of whole blood compared to balanced blood components in resuscitation of hemorrhaging trauma patients—A systematic review. Injury 2021, 52, 182–188. [Google Scholar] [CrossRef] [Scilit]
- Meyer, D.E.; Vincent, L.E.; Fox, E.E.; O’Keeffe, T.; Inaba, K.; Bulger, E.; Holcomb, J.B.; Cotton, B.A. Every minute counts: Time to delivery of initial massive transfusion cooler and its impact on mortality. J. Trauma. Acute Care Surg. 2017, 83, 19–24. [Google Scholar] [CrossRef] [Scilit]
- Ketchum, L.; Hess, J.R.; Hiippala, S. Indications for early fresh frozen plasma, cryoprecipitate, and platelet transfusion in trauma. J. Trauma: Inj. Infect. Crit. Care 2006, 60, S51–S58. [Google Scholar] [CrossRef] [Scilit]
- Torres, C.M.; Kenzik, K.M.; Saillant, N.N.; Scantling, D.R.; Sanchez, S.E.; Brahmbhatt, T.S.; Dechert, T.A.; Sakran, J.V. Timing to first whole blood transfusion and survival following severe hemorrhage in trauma patients. JAMA Surg. 2024, 159, 374–381. [Google Scholar] [CrossRef] [Scilit]
- Pumiglia, L.; Williams, J.M.; Beiling, M.; Francis, A.D.; Prey, B.J.; Lammers, D.T.; McClellan, J.M.; Bingham, J.R.; Gurney, J.; Schreiber, M. Mortality in hypotensive combat casualties who require emergent laparotomy in the forward deployed environment. Am. J. Surg. 2024, 231, 100–105. [Google Scholar] [CrossRef] [Scilit]
- Alshalani, A.; van Manen, L.; Boshuizen, M.; van Bruggen, R.; Acker, J.P.; Juffermans, N.P. The Effect of sex-mismatched red blood cell transfusion on endothelial cell activation in critically ill patients. Transfus. Med. Hemother 2022, 49, 98–105. [Google Scholar] [CrossRef] [Scilit]



| Time | Sham NT | Saline NT | ALM NT | Sham FFP | Saline FFP | ALM FFP | Sham FWB | Saline FWB | ALM FWB |
|---|---|---|---|---|---|---|---|---|---|
| 72 h Survival (%) | 5/10 (50%) | 0/10 (0%) | 10/10 (100%) | 9/12 (75%) | 1/12 (8%) | 1/12 (8%) | 6/12 (50%) | 2/12 (17%) | 0/12 (0%) |
| Survival Time (h) | 53 ± 21 | 23 ± 14 * | 72 ± 0 | 61 ± 20 | 16 ± 21 † | 34 ± 18 ‡ | 50 ± 28 | 19 ± 28 † | 22 ± 11 * |
| Phase 1–2 | No deaths | 2 | No deaths | No deaths | 7 | No deaths | 1 | 8 | 2 |
| Phase 3–<24 h | No deaths | 3 | No deaths | No deaths | 1 | 3 | 2 | 1 | 2 |
| 24–<48 h | 4 | 5 | No deaths | 3 | 3 | 5 | 1 | No deaths | 8 |
| 48–<72 h | 1 | No survivors | No deaths | No deaths | No deaths | 3 | 2 | 1 | No survivors |
| Parameter (Reference Range) | Time | Sham NT | Saline NT | ALM NT | Sham FFP | Saline FFP | ALM FFP | Sham FWB | Saline FWB | ALM FWB |
|---|---|---|---|---|---|---|---|---|---|---|
| pH [7.366–7.462] | P1–P2 | No deaths | NA | No deaths | No deaths | 7.14 ± 0.24 7 | No deaths | 6.72 1 | 6.94 ± 0.22 8 | 7.00 ± 0.05 2 |
| P3 | 7.44 ± 0.04 | 7.45 ± 0.07 8 | 7.47 ± 0.04 | 7.48 ± 0.03 | 7.39 ± 0.12 5 | 7.40 ± 0.17 | 7.43 ± 0.07 11 | 7.39 ± 1.0 4 | 7.44 ± 0.04 10 | |
| P3–<24 h | No deaths | 7.10 1 | No deaths | NA | 7.30 1 | 7.16 ± 0.27 3 | 7.09 ± 0.42 2 | 7.26 1 | 7.44 ± 0.15 2 | |
| 24–<48 h | 7.49 1 | 7.38 ± 0.18 4 | No deaths | 7.21 ± 0.20 3 | 7.32 ± 0.40 3 | 7.44 ± 0.10 5 | 7.46 1 | No deaths | 7.43 ± 0.08 8 | |
| 48–<72 h | No sample | No survivors | No deaths | NA | No deaths | 7.35 ± 0.25 3 | 7.42 ± 0.06 2 | 7.44 1 | No survivors | |
| 72 h | 7.54 ± 0.03 5** | No survivors | 7.52 ± 0.07 | 7.54 ± 0.04 9† | 7.53 1 | 7.45 1 | 7.56 ± 0.04 6 | 7.56 ± 0.0.4 2 | No survivors | |
| Lactate (mM) | Baseline | 1.11 ± 0.35 | 1.30 ± 0.43 | 1.37 ± 0.24 | 1.72 ± 0.41 †† | 1.58 ± 0.30 | 1.62 ± 0.21 | 1.30 ± 0.32 | 1.28 ± 0.38 | 1.20 ± 0.27 |
| P1–P2 | No deaths | 8.95 ± 1.48 2* | No deaths | No deaths | 7.43 ± 2.73 7 | No deaths | 20.0 1 | 10.25 ± 5.36 8* | 10.70 ± 4.10 2 | |
| P3 | 2.21 ± 1.40 ††† | 1.15 ± 0.14 8 | 1.66 ± 0.65 ‡‡ | 3.15 ± 3.48 ¶¶ | 2.84 ± 2.80 5‡‡ | 1.82 ± 0.91 | 2.57 ± 2.70 11 | 3.13 ± 3.20 4‡‡ | 1.41 ± 0.45 10 | |
| P3–<24 h | No deaths | 7.90 ± 2.18 3|| | No deaths | No deaths | 5.30 1 | 6.57 ± 2.83 3 | 12.85 ± 8.70 2 | 7.90 1 | 1.65 ± 0.50 2 | |
| 24 h | 2.79 ± 1.45 * | 2.60 ± 0.19 5† | 2.29 ± 0.70 ‡ | 2.93 ± 0.56 || | 2.88 ± 0.83 4** | 2.32 ± 0.86 9† | 2.61 ± 0.43 9‡ | 1.83 ± 0.21 3* | 1.50 ± 0.52 8 | |
| 24–<48 h | 7.13 ± 4.08 4 | 5.48 ± 2.56 5† | No deaths | 5.30 ± 2.60 3 | 5.53 ± 4.00 3 | 3.80 ± 1.47 5§ | 2.1 1 | No deaths | 2.44 ± 0.98 8§ | |
| 48 h | 2.93 ± 0.76 6*** | No survivors | 1.94 ± 0.58 ¶ | 2.19 ± 0.70 9 | 2.6 1 | 4.23 ± 1.73 4 | 2.70 ± 1.42 8¶ | 2.60 ± 0.76 3¶ | No survivors | |
| 48–<72 h | No sample | No survivors | No deaths | No deaths | No deaths | 4.57 ± 1.95 3 | 4.55 ± 2.76 2 | 2.9 1 | No survivors | |
| 72 h | 1.78 ± 0.49 5* | No survivors | 1.29 ± 0.65 | 3.76 ± 4.29 9 | 1.7 1 | 2.7 1 | 1.30 ± 0.21 6 | 1.55 ± 0.50 2 | No survivors |
| Parameter [Reference Range] | Time | Sham NT | Saline NT | ALM NT | Sham FFP | Saline FFP | ALM FFP | Sham FWB | Saline FWB | ALM FWB |
|---|---|---|---|---|---|---|---|---|---|---|
| RBC (×1012/L) [5.30–10.00] | Baseline | 7.90 ± 0.35 † | 7.52 ± 0.65 ‡ | 8.42 ± 0.46 | 8.72 ± 0.18 | 8.50 ± 1.10 | 879 ± 0.59 | 8.99 ± 0.29 | 8.45 ± 0.53 | 8.67 ± 0.52 |
| P1–P2 | No deaths | 5.38 ± 0.89 2 | No deaths | No deaths | 6.52 ± 1.60 7 | No deaths | 8.12 1 | 6.08 ± 1.42 8* | 7.61 ± 0.32 2* | |
| P3–<24 h | No deaths | 7.35 ± 0.51 3 | No deaths | No deaths | 5.06 1 | 6.32 ± 0.77 3 | 5.67 ± 0.91 2 | 4.94 1 | 8.01 ± 0.24 2 | |
| 24–<48 h | 5.57 ± 0.75 4* | 6.14 ± 1.53 5 | No deaths | 6.73 ± 3.49 3 | 8.57 ± 2.16 3 | 6.10 ± 1.32 5* | 7.30 1 | No deaths | 7.92 ± 1.33 8 | |
| 48–<72 h | 5.48 1 | No survivors | No deaths | No deaths | No deaths | 7.46 ± 1.84 3* | 5.69 ± 0.93 2 | 6.58 1 | No survivors | |
| 72 h | 5.00 ± 0.95 5* | No survivors | 5.63 ± 1.01 * | 6.02 ± 0.83 9* | 5.20 1 | 2.39 1 | 5.77 ± 1.54 6* | 6.05 ± 0.79 2 | No survivors | |
| HgB (g/dL) [14.0–18.0] | Baseline | 15.0 ± 0.5 | 14.9 ± 0.6 | 15.4 ± 0.8 | 15.5 ± 1.5 | 14.6 ± 2.0 | 15.4 ± 0.6 | 15.6 ± 0.5 | 14.7 ± 1.2 | 15.6 ± 1.1 |
| P1–P2 | No deaths | 10.0 ± 0.3 2* | No deaths | No deaths | 11.3 ± 2.9 7 | No deaths | 14.2 1 | 10.4 ± 2.4 8* | 13.3 ± 0.3 2 | |
| P3–<24 h | No deaths | 13.1 ± 2.6 3 | No deaths | No deaths | 8.4 1 | 11.2 ± 0.7 3 | 9.5 ± 1.4 2 | 9.3 1 | 14.8 ± 1.2 2 | |
| 24–<48 h | 9.4 ± 1.1 4* | 11.4 ± 2.7 4* | No deaths | 11.4 ± 5.9 3 | 14.5 ± 4.4 3 | 11.0 ± 2.4 5* | 12.2 1 | No deaths | 14.4 ± 2.7 8 | |
| 48–<72 h | 9.7 1 | No survivors | No deaths | No deaths | No deaths | 12.5 ± 3.2 3 | 9.5 ± 1.7 2 | 11.7 1 | No survivors | |
| 72 h | 9.2 ± 1.7 5* | No survivors | 10.2 ± 1.7 * | 10.7 ± 1.8 9* | 8.5 1 | 4.1 1 | 10.8 ± 3.5 6* | 10.5 ± 1.2 2 | No survivors | |
| HCT (%) [35.00–52.00] | Baseline | 44.87 ± 3.71 § | 42.64 ± 2.91 || | 48.21 ± 2.80 | 48.20 ± 2.44 | 47.20 ± 5.78 | 47.78 ± 2.98 | 49.78 ± 1.96 | 46.88 ± 3.90 | 45.98 ± 2.93 |
| P1–P2 | No deaths | 29.27 ± 5.06 2 | No deaths | No deaths | 34.28 ± 7.89 7 | No deaths | 45.63 1 | 32.71 ± 7.25 8* | 38.35 ± 0.07 2* | |
| P3–<24 h | No deaths | 40.90 ± 2.96 3 | No deaths | No deaths | 25.32 1 | 33.51 ± 4.83 3* | 30.34 ± 6.57 2 | 26.26 1 | 40.72 ± 1.24 2* | |
| 24–<48 h | 29.31 ± 5.26 4 | 34.75 ± 8.85 4 | No deaths | 36.40 ± 19.88 3 | 46.83 ± 11.45 3 | 32.45 ± 6.88 5* | 39.46 1 | No deaths | 41.93 ± 8.00 8 | |
| 48–<72 h | 29.43 1 | No survivors | No deaths | No deaths | No deaths | 40.23 ± 11.41 3 | 31.01 ± 6.18 2 | 37.15 1 | No survivors | |
| 72 h | 28.23 ± 5.24 5* | No survivors | 32.03 ± 5.29 * | 33.05 ± 4.03 9* | 28.91 1 | 13.44 1 | 32.42 ± 9.31 6* | 32.75 ± 5.28 2 | No survivors | |
| MCHC (g/dL) [31.0–40.0] | Baseline | 33.5 ± 2.2 | 35.1 ± 2.9¶ | 31.9 ± 1.0 | 32.2 ± 3.9 | 30.9 ± 1.5 | 32.2 ± 1.4 | 31.4 ± 0.9 | 31.4 ± 0.9 | 34.0 ± 2.0 § |
| P1–P2 | No deaths | 34.6 ± 5.2 2 | No deaths | No deaths | 32.8 ± 1.6 7* | No deaths | 31.2 1 | 31.5 ± 1.8 8 | 34.8 ± 0.6 2 | |
| P3–<24 h | No deaths | 32.0 ± 5.3 3 | No deaths | No deaths | 33.2 1 | 33.6 ± 3.3 3 | 31.7 ± 2.1 2 | 35.4 1 | 36.1 ± 1.8 2 | |
| 24–<48 h | 32.5 ± 2.5 4 | 32.9 ± 1.9 4 | No deaths | 31.9 ± 2.0 3 | 30.7 ± 1.7 3 | 33.7 ± 0.9 5 | 30.8 1 | No deaths | 34.3 ± 2.1 8 | |
| 48–<72 h | 33.1 1 | No survivors | No deaths | No deaths | No deaths | 31.2 ± 1.2 3 | 30.7 ± 0.8 2 | 31.4 1 | No survivors | |
| 72 h | 32.7 ± 2.9 5 | No survivors | 32.1 ± 1.2 * | 32.2 ± 2.5 | 29.3 1 | 30.6 1 | 33.4 ± 5.7 6 | 32.0 ± 1.5 2 | No survivors | |
| PLT (×109/L) [100–500] | Baseline | 279 ± 115 | 300 ± 111 | 135 ± 71 | 123 ± 113 ** | 163 ± 149 | 202 ± 138 | 242 ± 122 | 154 ± 133 | 175 ± 129 |
| P1–P2 | No deaths | 257 ± 11 2 | No deaths | No deaths | 256 ± 121 7* | No deaths | 7 1 | 248 ± 179 8 | 227 ± 168 2 | |
| P3–<24 h | No deaths | 52 ± 25 3 | No deaths | No deaths | 162 1 | 207 ± 122 3 | 149 ± 119 2 | 241 1 | 203 ± 90 2 | |
| 24–<48 h | 54 ± 35 4 | 18 ± 19 4* | No deaths | 54 ± 75 3 | 36 ± 51 3 | 169 ± 138 5 | 0 1 | No deaths | 114 ± 98 8 | |
| 48–<72 h | 20 1 | No survivors | No deaths | No deaths | No deaths | 15 ± 4 3 | 11 ± 16 2 | 17 1 | No survivors | |
| 72 h | 131 ± 61 5* | No survivors | 125 ± 100 | 79 ± 71 9 | 120 1 | 94 1 | 114 ± 66 6 | 145 ± 32 2 | No survivors | |
| PCT (%) | Baseline | 0.21 ± 0.08 | 0.21 ± 0.08 | 0.10 ± 0.05 | 0.09 ± 0.08 ** | 0.11 ± 0.10 | 0.14 ± 0.10 | 0.18 ± 0.06 | 0.11 ± 0.09 | 0.12 ± 0.07 |
| P1–P2 | No deaths | 0.17 ± 0.02 2 | No deaths | No deaths | 0.15 ± 0.07 7 | No deaths | 0.00 1 | 0.14 ± 0.10 8 | 0.14 ± 0.10 2 | |
| P3–<24 h | No deaths | 0.04 ± 0.02 3 | No deaths | No deaths | 0.09 1 | 0.13 ± 0.08 3* | 0.09 ± 0.07 2 | 0.14 1 | 0.13 ± 0.06 2 | |
| 24–<48 h | 0.04 ± 0.03 4 | 0.01 ± 0.02 4* | No deaths | 0.03 ± 0.04 3 | 0.06± 0.06 3 | 0.11 ± 0.10 5 | Not calculable | No deaths | 0.07 ± 0.07 8 | |
| 48–<72 h | 0.01 1 | No survivors | No deaths | No deaths | No deaths | 0.01 ± 0.00 3 | 0.01 1 | 0.01 1 | No survivors | |
| 72 h | 0.10 ± 0.05 5 | No survivors | 0.10 ± 0.07 | 0.06 ± 0.06 9 | 0.07 1 | 0.06 1 | 0.08 ± 0.05 6 | 0.10 ± 0.01 2 | No survivors |
| Parameter [Reference Range] | Time | Sham NT | Saline NT | ALM NT | Sham FFP | Saline FFP | ALM FFP | Sham FWB | Saline FWB | ALM FWB |
|---|---|---|---|---|---|---|---|---|---|---|
| WBC (×109/L) [2.10–19.50] | Baseline | 8.02 ± 3.10 | 8.92 ± 2.05 | 12.19 ± 2.80 | 10.24 ± 3.07 | 9.85 ± 3.62 | 11.35 ± 4.02 | 11.79 ± 3.92 | 11.31 ± 3.91 | 10.56 ± 3.91 |
| P1–P2 | No deaths | 4.04 ± 3.48 2 | No deaths | No deaths | 7.12 ± 5.33 7 | No deaths | 8.42 1 | 3.87 ± 3.14 8* | 5.76 ± 4.60 2 | |
| P3–<24 h | No deaths | 2.31 ± 1.31 3 | No deaths | No deaths | 8.07 1 | 7.09 ± 3.27 3 | 9.46 ± 2.92 2 | 1.79 1 | 8.69 ± 1.67 2 | |
| 24–<48 h | 4.48 ± 6.76 4 | 0.76 ± 0.39 5* | No deaths | 1.83 ± 1.13 3* | 2.46 ± 2.33 3* | 2.85 ± 1.64 5* | 1.34 1 | No deaths | 1.89 ± 1.80 8* | |
| 48–<72 h | 0.56 1 | No survivors | No deaths | No deaths | No deaths | 1.38 ± 1.55 3* | 0.73 ± 0.12 2 | 2.63 1 | No survivors | |
| 72 h | 6.03 ± 3.79 5 | No survivors | 10.68 ± 4.08 | 11.38 ± 5.35 9 | 4.84 1 | 1.29 1 | 6.10 ± 4.13 6* | 7.28 ± 5.12 2 | No survivors | |
| LYM (×109/L) [2.00–14.10] | Baseline | 5.76 ± 1.98 | 6.65 ± 1.17 | 8.62 ± 2.12 | 7.59 ± 2.42 | 7.07 ± 2.23 | 7.62 ± 2.46 | 8.81 ± 3.37 | 7.80 ± 2.83 | 6.39 ± 2.40 |
| P1–P2 | No deaths | 1.65 ± 1.00 2 | No deaths | No deaths | 2.82 ± 1.80 7* | No deaths | 8.42 1 | 1.94 ± 1.75 8* | 1.42 ± 0.66 2* | |
| P3–<24 h | No deaths | 0.75 ± 0.36 3* | No deaths | No deaths | 4.11 1 | 2.65 ± 2.31 3 | 4.95 ± 2.58 2 | 0.71 1 | 2.75 ± 1.29 2 | |
| 24–<48 h | 0.92 ± 0.72 4* | 0.52 ± 0.31 4* | No deaths | 1.02 ± 0.45 3* | 0.29 ± 0.21 3* | 1.15 ± 0.53 5* | 0.67 1 | No deaths | 0.89 ± 0.48 8* | |
| 48–<72 h | 0.42 1 | No survivors | No deaths | No deaths | No deaths | 0.53 ± 0.58 3* | 0.51 ± 0.25 | 1.05 1 | No survivors | |
| 72 h | 1.92 ± 0.79 5* | No survivors | 4.66 ± 2.78 * | 5.12 ± 2.66 9* | 1.75 1 | 0.97 1 | 1.71 ± 1.78 6* | 3.45 ± 2.89 2* | No survivors | |
| MON (×109/L) [0.00–0.98] | Baseline | 0.55 ± 0.44 | 0.39 ± 0.31 | 0.59 ± 0.64 | 0.57 ± 0.61 | 0.69 ± 0.50 | 0.84 ± 0.59 | 0.67 ± 0.68 | 0.81 ± 0.53 1 | 0.41 ± 0.62 |
| P1–P2 | No deaths | 0.32 ± 0.33 2 | No deaths | No deaths | 0.35 ± 0.32 7 | No deaths | 0.89 1 | 0.26 ± 0.25 8 | 0.40 ± 0.31 2 | |
| P3–<24 h | No deaths | 0.15 ± 0.09 3 | No deaths | No deaths | 0.90 1 | 0.53 ± 0.31 3* | 0.54 ± 0.04 2 | 0.21 1 | 0.67 ± 0.02 2 | |
| 24–<48 h | 0.38 ± 0.69 4 | 0.04 ± 0.03 4 | No deaths | 0.12 ± 0.11 3 | 0.24 ± 0.29 3 | 0.21 ± 0.27 5 | 0.13 1 | No deaths | 0.10 ± 0.11 8* | |
| 48–<72 h | 0.03 1 | No survivors | No deaths | No deaths | No deaths | 0.07 ± 0.07 3 | 0.03 ± 0.04 2 | 0.24 1 | No survivors | |
| 72 h | 0.34 ± 0.27 5 | No survivors | 0.95 ± 0.73 | 0.77 ± 0.49 9 | 0.15 1 | 0.01 1 | 0.37 ± 0.27 6 | 0.19 ± 0.07 2 | No survivors | |
| NEU (×109/L) [0.10–5.40] | Baseline | 1.72 ± 0.99 | 1.89 ± 1.09 | 2.98 ± 1.22 | 2.08 ± 1.03 | 2.10 ± 1.22 | 2.89 ± 1.39 | 2.31 ± 0.85 | 2.68 ± 1.01 | 2.53 ± 1.38 |
| P1–P2 | No deaths | 2.07 ± 2.14 2 | No deaths | No deaths | 3.95 ± 3.71 7 | No deaths | 2.72 1 | 2.04 ± 1.70 8 | 3.94 ± 3.63 2 | |
| P3–<24 h | No deaths | 1.42 ± 1.50 3 | No deaths | No deaths | 3.06 1 | 3.91 ± 1.60 3 | 3.98 ± 0.37 2 | 0.87 1 | 5.27 ± 0.40 2 | |
| 24–<48 h | 3.18 ± 5.65 4 | 0.33 ± 0.18 4* | No deaths | 0.69 ± 0.57 3 | 1.93 ± 1.84 3 | 1.50 ± 1.30 5 | 0.54 1 | No deaths | 0.91 ± 1.58 8* | |
| 48–<72 h | 0.11 1 | No survivors | No deaths | No deaths | No deaths | 0.77 ± 0.93 3 | 0.20 ± 0.11 2 | 1.34 1 | No survivors | |
| 72 h | 3.76 ± 2.96 5 | No survivors | 5.07 ± 0.96 * | 5.50 ± 2.62 9* | 2.94 1 | 0.31 1 | 4.03 ± 2.13 6 | 3.65 ± 2.16 2 | No survivors | |
| LYM (%) | Baseline | 72.5 ± 7.7 | 75.5 ± 6.8 | 71.1 ± 8.1 | 75.0 ± 9.3 | 73.6 ± 8.6 | 68.6 ± 7.2 | 74.0 ± 8.7 | 69.1 ± 7.5 | 70.1 ± 7.1 |
| P1–P2 | No deaths | 47.9 ± 16.2 2 | No deaths | No deaths | 47.7 ± 20.9 7* | No deaths | 57.1 1 | 45.5 ± 19.3 8* | 29.5 ± 12.0 2 | |
| P3–<24 h | No deaths | 43.7 ± 30.5 3 | No deaths | No deaths | 50.9 1 | 34.0 ± 17.0 3 | 50.5 ± 11.7 2 | 39.5 1 | 30.9 ± 8.8 2 | |
| 24–<48 h | 46.3 ± 30.4 4 | 58.2 ± 23.7 4 | No deaths | 60.8 ± 15.0 3 | 14.2 ± 5.9 3* | 49.8 ± 27.0 5 | 49.6 1 | No deaths | 65.1 ± 24.7 8 | |
| 48–<72 h | 74.5 1 | No survivors | No deaths | No deaths | No deaths | 46.6 ± 29.1 3 | 68.1 ± 23.3 2 | 39.8 1 | No survivors | |
| 72 h | 34.9 ± 10.4 5* | No survivors | 40.0 ± 13.8 * | 44.2 ± 5.9 9* | 36.2 1 | 75.3 1 | 23.7 ± 11.3 6† | 44.4 ± 8.6 2 | No survivors | |
| MON (%) | Baseline | 3.9 ± 4.0 | 4.3 ± 3.5 | 5.0 ± 4.8 | 5.2 ± 5.1 | 6.5 ± 3.7 | 7.0 ± 4.0 | 5.9 ± 5.0 | 6.7 ± 3.7 | 6.7 ± 3.1 |
| P1–P2 | No deaths | 7.0 ± 2.1 2 | No deaths | No deaths | 4.9 ± 2.5 7 | No deaths | 10.5 1 | 6.4 ± 3.9 8 | 7.1 ± 0.3 2 | |
| P3–<24 h | No deaths | 6.3 ± 0.4 3 | No deaths | No deaths | 11.2 1 | 7.0 ± 1.4 3 | 6.0 ± 2.3 2 | 11.7 1 | 7.8 ± 1.7 2 | |
| 24–<48 h | 5.5 ± 3.9 4 | 3.9 ± 2.6 4 | No deaths | 6.0 ± 2.0 3 | 8.8 ± 3.8 3 | 5.9 ± 4.6 5 | 9.8 1 | No deaths | 4.5 ± 2.0 8 | |
| 48–<72 h | 6.1 1 | No survivors | No deaths | No deaths | No deaths | 6.0 ± 6.6 3 | 3.9 ± 4.6 2 | 9.2 1 | No survivors | |
| 72 h | 5.5 ± 3.4 5 | No survivors | 8.4 ± 3.9 * | 6.6 ± 1.9 9 | 3.1 1 | 0.6 1 | 5.9 ± 1.4 6 | 3.1 ± 1.2 2 | No survivors | |
| NEU (%) | Baseline | 20.5 ± 5.0 | 20.2 ± 6.7 | 23.9 ± 7.6 | 19.9 ± 7.2 | 19.9 ± 6.8 | 24.4 ± 5.2 | 20.1 ± 5.5 | 24.2 ± 6.5 | 23.3 ± 6.0 |
| P1–P2 | No deaths | 45.2 ± 14.1 2 | No deaths | No deaths | 47.4 ± 20.3 7* | No deaths | 32.3 1 | 48.1 ± 17.0 8* | 63.5 ± 12.3 2 | |
| P3–<24 h | No deaths | 50.1 ± 30.1 3 | No deaths | No deaths | 37.9 1 | 58.9 ± 18.0 3 | 43.5 ± 9.5 2 | 48.8 1 | 61.4 ± 7.1 2* | |
| 24–<48 h | 48.2 ± 29.4 4 | 37.9 ± 21.4 4 | No deaths | 33.2 ± 13.4 3 | 76.9 ± 8.3 3* | 44.3 ± 24.1 5 | 40.5 1 | No deaths | 30.3 ± 24.2 8 | |
| 48–<72 h | 19.4 1 | No survivors | No deaths | No deaths | No deaths | 47.4 ± 23.5 3 | 28.2 ± 18.7 2 | 51.0 1 | No survivors | |
| 72 h | 59.7 ± 11.8 5* | No survivors | 51.6 ± 14.3 * | 49.2 ± 7.2 9* | 60.7 1 | 24.2 1 | 70.5 ± 11.3 6† | 52.6 ± 7.4 2 | No survivors | |
| NEU:LYM | Baseline | 0.29 ± 0.10 | 0.28 ± 0.13 | 0.35 ± 0.14 | 0.28 ± 0.13 | 0.28 ± 0.13 | 0.37 ± 0.11 | 0.28 ± 0.11 | 0.36 ± 0.13 | 0.71 ± 1.31 |
| P1–P2 | No deaths | 0.05 ± 0.06 2* | No deaths | No deaths | 0.12 ± 0.13 7 | No deaths | 0.05 1 | 0.53 ± 0.04 8* | 0.17 ± 0.19 2 | |
| P3–<24 h | No deaths | 3.20 ± 4.54 3 | No deaths | No deaths | 0.74 1 | 2.16 ± 1.28 3 | 0.91 ± 0.40 2 | 1.23 1 | 2.11 ± 0.84 2 | |
| 24–<48 h | 2.59 ± 3.47 4 | 1.00 ± 1.13 4 | No deaths | 0.69 ± 0.33 3 | 6.04 ± 2.49 3‡ | 1.43 ± 1.32 5 | 0.81 1 | No deaths | 1.02 ± 1.82 8 | |
| 48–<72 h | 0.26 1 | No survivors | No deaths | No deaths | No deaths | 1.53 ± 1.26 3 | 0.50 ± 0.46 2 | 1.28 1 | No survivors | |
| 72 h | 1.90 ± 0.84 5* | No survivors | 1.84 ± 1.95 * | 1.15 ± 0.30 9* | 1.68 1 | 0.32 1 | 4.54 ± 4.36 6 | 1.23 ± 0.40 2 | No survivors | |
| MON:NEU | Baseline | 0.33 ± 0.18 | 0.23 ± 0.20 | 0.24 ± 0.22 | 0.27 ± 0.27 | 0.36 ± 0.20 | 0.29 ± 0.15 | 0.29 ± 0.26 | 0.29 ± 0.14 | 0.31 ± 0.14 |
| P1–P2 | No deaths | 0.16 ± 0.01 2 | No deaths | No deaths | 0.13 ± 0.13 7* | No deaths | 0.33 1 | 0.14 ± 0.08 8 | 0.11 ± 0.03 2 | |
| P3–<24 h | No deaths | 0.16 ± 0.08 3 | No deaths | No deaths | 0.29 1 | 0.13 ± 0.07 3* | 0.14 ± 0.02 2 | 0.24 1 | 0.13 ± 0.01 2 | |
| 24–<48 h | 0.15 ± 0.10 4 | 0.10 ± 0.07 4 | No deaths | 0.19 ± 0.06 3 | 0.12 ± 0.06 3 | 0.15 ± 0.10 5 | 0.24 1 | No deaths | 0.23 ± 0.18 8 | |
| 48–<72 h | 0.27 1 | No survivors | No deaths | No deaths | No deaths | 0.10 ± 0.11 3 | 0.09 ± 0.13 2 | 0.18 1 | No survivors | |
| 72 h | 0.10 ± 0.07 5* | No survivors | 0.18 ± 0.11 | 0.14 ± 0.06 9 | 0.05 1 | 0.03 1 | 1.16 ± 2.63 6 | 0.06 ± 0.07 2 | No survivors |
| Parameter | Time | Sham NT | Saline NT | ALM NT | Sham FFP | Saline FFP | ALM FFP | Sham FWB | Saline FWB | ALM FWB |
|---|---|---|---|---|---|---|---|---|---|---|
| PT (s) | Baseline | 16.5 ± 2.0 11 | 16.5 ± 2.0 11 | 16.5 ± 2.0 11 | 16.5 ± 2.0 11 | 16.5 ± 2.0 11 | 16.5 ± 2.0 11 | 16.5 ± 2.0 11 | 16.5 ± 2.0 11 | 16.5 ± 2.0 11 |
| P1–P2 | No deaths | 25.3 1 | No deaths | No deaths | 46.0 ± 45.1 7 | No deaths | 180.1 1 | 62.4 ± 65.0 8* | 108.3 ± 53.6 2 | |
| P3–<24 h | No deaths | 21.0 1 | No deaths | No deaths | 24.0 1 | 27.5 ± 4.0 3 | 102.6 ± 109.6 2 | 30.5 1 | 19.5 ± 2.5 2 | |
| 24 h | 22.1 ± 8.5 9† | 20.0 ± 1.7 4 | 19.2 ± 2.2 5† | 18.9 ± 3.3 11† | 20.5 ± 1.8 4 | 17.6 ± 2.3 8 | 17.8 ± 4.2 9 | 21.0 ± 3.0 3 | 19.0 ± 1.4 6 | |
| 24–<48 h | 19.5 ± 4.5 4 | 24.5 ± 12.0 5 | No deaths | 25.5 ± 9.9 3 | 21.4 ± 4.6 3 | 18.5 ± 2.7 5 | 15.3 1 | No deaths | 18.1 ± 1.8 8 | |
| 48–<72 h | 14.9 1 | No survivors | No deaths | No deaths | No deaths | 27.1 ± 8.3 3 | 15.4 ± 0.6 2 | 16.3 1 | No survivors | |
| 72 h | 14.9 ± 1.1 4 | No survivors | 18.7 ± 4.6 7 | 15.1 ± 0.9 9 | 15.4 1 | 15.8 1 | 15.7 ± 0.8 6 | 15.6 ± 1.3 2 | No survivors | |
| aPTT (s) | Baseline | 76.4 ± 32.1 8 | 76.4 ± 32.1 8 | 76.4 ± 32.1 8 | 76.4 ± 32.1 8 | 76.4 ± 32.1 8 | 76.4 ± 32.1 8 | 76.4 ± 32.1 8 | 76.4 ± 32.1 8 | 76.4 ± 32.1 8 |
| P1–P2 | No deaths | 200.1 1 | No deaths | No deaths | 200.1 ± 0 4* | No deaths | NA | 182.7 ± 39.0 5* | 200.1 ± 0 2* | |
| P3–<24 h | No deaths | 94.1 1 | No deaths | No deaths | 200.1 1 | 63.3 1 | 200.1 1 | 200.1 1 | 45.6 ± 3.6 2 | |
| 24 h | 200.1 ± 0 7‡ | 200.1 ± 0 4* | 200.1 ± 0 4‡ | 195.8 ± 11.4 7* | 200.1 ± 0 2 | 186.0 ± 28.2 4 | 175.7 ± 54.5 6 | 200.1 ± 0 3* | 103.5 ± 51.7 6 | |
| 24–<48 h | 141.3 ± 77.8 4 | 199.7 ± 0.8 3 | No deaths | 184.8 1 | 200.1 1 | 178.6 ± 30.5 2 | NA | No deaths | 90.7 ± 76.0 7 | |
| 48–<72 h | NA | No survivors | No deaths | No deaths | No deaths | NA | 148.8 ± 72.5 2* | 117.0 1 | No survivors | |
| 72 h | 88.0 ± 67.4 4 | No survivors | 57.4 ± 23.5 4 | 126.9 ± 60.9 6 | 200.1 1 | 176.5 1 | 98.3 ± 59.0 5 | NA | No survivors | |
| Fibrinogen (g/dL) | Baseline | 2.43 ± 0.31 11 | 2.43 ± 0.31 11 | 2.43 ± 0.31 11 | 2.43 ± 0.31 11 | 2.43 ± 0.31 11 | 2.43 ± 0.31 11 | 2.43 ± 0.31 11 | 2.43 ± 0.31 11 | 2.43 ± 0.31 11 |
| P1–P2 | No deaths | 1.60 ± 0.03 2* | No deaths | No deaths | 1.17 ± 0.47 6* | No deaths | NA | 1.30 ± 0.37 6* | 1.05 ± 1.09 2 | |
| P3–<24 h | No deaths | 3.17 ± 1.99 2 | No deaths | No deaths | 1.01 1 | 2.11 ± 1.62 3 | 0.70 ± 0.54 2 | 1.06 1 | 2.65 ± 1.65 2 | |
| 24 h | 5.14 ± 0.78 8* | 4.63 ± 0.89 4* | 4.83 ± 1.39 9* | 5.47 ± 0.81 11* | 4.64 ± 0.54 4* | 4.99 ± 0.65 8* | 5.11 ± 0.65 9‡ | 5.19 ± 0.39 3* | 5.32 ± 0.44 6* | |
| 24–<48 h | 4.07 ± 1.81 4* | 4.25 ± 2.41 5* | No deaths | 4.56 ± 1.51 3* | 4.44 ± 1.51 3* | 4.67 ± 1.53 5* | 6.65 1 | No deaths | 5.23 ± 1.35 8* | |
| 48–<72 h | 6.68 1 | No survivors | No deaths | No deaths | No deaths | 4.20 ± 1.61 2 | 5.64 ± 0.60 2* | 4.40 1 | No survivors | |
| 72 h | 6.77 ± 0.61 5* | No survivors | 6.03 ± 1.03 8* | 5.94 ± 1.05 9* | 6.24 1 | 2.91 1 | 6.54 ± 0.77 6* | 6.55 ± 0.30 2* | No survivors | |
| TAFI (%) | Baseline | 62 ± 35 11 | 62 ± 35 11 | 62 ± 35 11 | 62 ± 35 11 | 62 ± 35 11 | 62 ± 35 11 | 62 ± 35 11 | 62 ± 35 11 | 62 ± 35 11 |
| P1–P2 | No deaths | 68 1 | No deaths | No deaths | 59 ± 7 7 | No deaths | 66 1 | 69 ± 9 8 | 36 ± 33 2 | |
| P3–<24 h | No deaths | 39 1 | No deaths | No deaths | NA | 49 ± 18 3 | 59 ± 6 2 | 62 1 | 25 ± 17 2 | |
| 24 h | 37 ± 27 5 | 54 ± 25 4 | 112 ± 17 8§ | 60 ± 28 11 | 43 ± 14 4 | 58 ± 14 7 | 82 ± 20 9† | 90 ± 7 3 | 19 ± 9 6¶ | |
| 24–<48 h | 26 ± 9 3 | 7 1 | No deaths | 45 ± 22 3 | 39 ± 13 2 | 36 ± 15 4 | 63 1 | No deaths | 21 ± 27 6 | |
| 48–<72 h | NA | No survivors | No deaths | No deaths | No deaths | 33 ± 21 3 | 79 ± 22 2 | 116 1 | No survivors | |
| 72 h | 79 ± 12 3 | No survivors | 119 1 | 93 ± 37 9 | 133 1 | 86 1 | 125 ± 9 5** | 135 1 | No survivors | |
| Protein C (%) | Baseline | 3 ± 0 10 | 3 ± 0 10 | 3 ± 0 10 | 3 ± 0 10 | 3 ± 0 10 | 3 ± 0 10 | 3 ± 0 10 | 3 ± 0 10 | 3 ± 0 10 |
| P1–P2 | No deaths | 3 1 | No deaths | No deaths | 12.9 ± 11.8 7* | No deaths | 38 1 | 10.2 ± 10.5 6 | 9 1 | |
| P3–<24 h | No deaths | 2 ± 2.8 2 | No deaths | No deaths | 3 1 | 10.3 ± 11.8 3 | 9 ± 12.7 2 | 2 1 | 0.5 ± 0.7 2 | |
| 24 h | 3.1 ± 0.4 8 | 3 ± 0 4 | 2.6 ± 2.1 10 | 3.1 ± 1.9 11 | 1.8 ± 0.5 4 | 1.4 ± 1.3 8 | 0.2 ± 0.4 9** | 0 ± 0 3** | 0 ± 0 6‡ | |
| 24–<48 h | 3 ± 0 4 | 3 ± 0 5 | No deaths | 4.5 ± 2.1 2 | 5 ± 0 2 | 2.6 ± 1.5 5 | 3 1 | No deaths | 0.3 ± 0.5 6¶ | |
| 48–<72 h | 3 1 | No survivors | No deaths | No deaths | No deaths | 2 ± 1.7 3 | 0.5 ± 0.7 2* | 1 1 | No survivors | |
| 72 h | 5.5 ± 3.1 4‡‡ | No survivors | 2.1 ± 2.4 9 | 3 ± 0 9 | 3 1 | 7 1 | 1.5 ± 1.4 6§§ | 3.5 ± 0.7 2 | No survivors | |
| Antiplasmin (%) | Baseline | 156 ± 51 11 | 156 ± 51 11 | 156 ± 51 11 | 156 ± 51 11 | 156 ± 51 11 | 156 ± 51 11 | 156 ± 51 11 | 156 ± 51 11 | 156 ± 51 11 |
| P1–P2 | No deaths | 115 1 | No deaths | No deaths | 107 ± 17 7* | No deaths | 110 1 | 95 ± 22 7* | 131 1 | |
| P3–<24 h | No deaths | 112 1 | No deaths | No deaths | 115 1 | 83 ± 5 3|| | 95 ± 16 2* | 101 1 | 159 ± 50 2 | |
| 24 h | 101 ± 10 6††† | 119 ± 2 4 | 152 ± 46 3 | 179 ± 35 11¶¶ | 129 ± 49 3 | 101 ± 4 8*** | 146 ± 42 9 | 125 ± 5 3 | 126 ± 3 6 | |
| 24–<48 h | 103 ± 7 4‡‡‡ | 127 ± 4 3 | No deaths | 151 ± 110 3 | 85 ± 27 2‡‡‡ | 101 ± 9 5‡‡‡ | 122 1 | No deaths | 127 ± 3 6 | |
| 48–<72 h | NA | No survivors | No deaths | No deaths | No deaths | 116 ± 39 3 | 139 ± 93 2 | 121 1 | No survivors | |
| 72 h | 113 ± 3 4 | No survivors | 230 ± 8 3§§§ | 216 ± 16 9§§§ | 227 1 | 52 1 | 202 ± 21 6 | 177 ± 16 2 | No survivors |
| Test | Parameter | Time | Sham NT | Saline NT | ALM NT | Sham FFP | Saline FFP | ALM FFP | Sham FWB | Saline FWB | ALM FWB |
|---|---|---|---|---|---|---|---|---|---|---|---|
| EXTEM | CT (s) | Baseline | 42 ± 3 | 42 ± 3 | 42 ± 3 | 42 ± 3 | 42 ± 3 | 42 ± 3 | 42 ± 3 | 42 ± 3 | 42 ± 3 |
| P1–P2 | No deaths | 48 ± 7 2 | No deaths | No deaths | 94 ± 108 7* | No deaths | DNC | 202 ± 367 8* | 253 ± 255 2* | ||
| P3 | 53 ± 27 | 50 ± 6 8 | 51 ± 9 | 45 ± 6 | 44 ± 4 5 | 54 ± 6 * | 45 ± 5 9 | 39 ± 3 3 | 65 ± 9 10‡ | ||
| P3–<24 h | No deaths | 135 ± 77 3 | No deaths | No deaths | 43 1 | 50 ± 10 3 | 59 ± 4 2 | 41 1 | 77 ± 25 2 | ||
| 24–<48 h | 49 ± 9 4 | 55 ± 7 5 n = 1 DNC | No deaths | 89 ± 34 3 | 55 ± 1 3 | 56 ± 8 5 | 42 1 | No deaths | 65 ± 7 8 | ||
| 48 h | 41 ± 3 5 | No survivors | 47 ± 5 | 43 ± 3 9 | 48 1 | 46 1 | 51 ± 12 8 | 51 ± 11 3 | No survivors | ||
| 48–<72 h | 36 1 | No survivors | No deaths | No deaths | No deaths | 187 ± 199 3 | 48 ± 9 2 | 62 1 | No survivors | ||
| 72 h | 47 ± 8 5 | No survivors | 43 ± 4 | 42 ± 3 9 | 48 1 | 45 1 | 46 ± 4 6 | 47 ± 11 2 | No survivors | ||
| MCF (mm) | Baseline | 77 ± 1 | 77 ± 1 | 77 ± 1 | 77 ± 1 | 77 ± 1 | 77 ± 1 | 77 ± 1 | 77 ± 1 | 77 ± 1 | |
| P1–P2 | No deaths | 69 ± 1 2* | No deaths | No deaths | 59 ± 22 7* | No deaths | DNC | 55 ± 26 8* | 36 ± 40 2* | ||
| P3 | 66 ± 18 | 70 ± 4 8 | 72 ± 3 | 73 ± 3 12 | 69 ± 2 5 | 72 ± 3 12 | 73 ± 1 9 | 73 ± 3 3 | 71 ± 3 10 | ||
| P3–<24 h | No deaths | 30 ± 33 3 | No deaths | No deaths | 65 1 | 68 ± 4 3* | 67 ± 6 2 | 67 1 | 71 ± 11 2 | ||
| 24–<48 h | 51 ± 29 4 | 57 ± 13 4 n = 1 DNC | No deaths | 52 ± 29 3 | 58 ± 14 3 | 74 ± 13 5 | 54 1 | No deaths | 72 ± 8 8 | ||
| 48 h | 76 ± 9 5 | No survivors | 78 ± 6 | 76 ± 9 9 | 55 1 | 80 1 | 77 ± 7 8 | 80 ± 3 3 | No survivors | ||
| 48–<72 h | 59 1 | No survivors | No deaths | No deaths | No deaths | 29 ± 33 3 | 65 ± 6 2 | 76 1 | No survivors | ||
| 72 h | 82 ± 2 5 | No survivors | 81 ± 4 | 82 ± 2 9 | 81 1 | 78 1 | 83 ± 5 6 | 83 ± 4 2 | No survivors | ||
| ML (%) | Baseline | 6.5 ± 1.9 | 6.5 ± 1.9 | 6.5 ± 1.9 | 6.5 ± 1.9 | 6.5 ± 1.9 | 6.5 ± 1.9 | 6.5 ± 1.9 | 6.5 ± 1.9 | 6.5 ± 1.9 | |
| P1–P2 | No deaths | 6.5 ± 3.5 2 | No deaths | No deaths | 4.3 ± 6.7 7 | No deaths | DNC | 5.5 ± 0.9 8* | 5.0 ± 2.8 2* | ||
| P3 | 3.3 ± 7.1 | 1.5 ± 2.6 8* | 1.2 ± 1.2 * | 1.9 ± 0.9 | 2.6 ± 2.6 5 | 2.3 ± 3.8 | 1.2 ± 0.8 9 | 3.7 ± 4.7 3 | 1.2 ± 1.0 10* | ||
| P3–<24 h | No deaths | 9.3 ± 16.2 3 | No deaths | No deaths | 1 1 | 19.7 ± 17.1 3 | 0.5 ± 0.7 2 | 0 1 | 1.0 ± 1.4 2 | ||
| 24–<48 h | 1.0 ± 14 4 | 0.5 ± 1.0 4 n = 1 DNC | No deaths | 2.3 ± 4.0 3 | 0 ± 0 3 | 2.8 ± 4.7 5 | 0 1 | No deaths | 0.1 ± 0.4 8* | ||
| 48 h | 1.6 ± 1.1 5* | No survivors | 1.2 ± 1.3 * | 1.2 ± 1.5 9* | 0 1 | 1 1 | 1.1 ± 1.1 8* | 0.7 ± 1.2 3* | No survivors | ||
| 48–<72 h | 0 1 | No survivors | No deaths | No deaths | No deaths | 0 ± 0 3 | 0 ± 0 2 | 0 1 | No survivors | ||
| 72 h | 0.3 ± 0.5 5¶¶ | No survivors | 1.6 ± 1.5 * | 1.8 ± 1.4 9* | 0 1 | 0 1 | 0.8 ± 1.0 6* | 1.0 ± 0 2 | No survivors | ||
| INTEM | CT (s) | Baseline | 100 ± 28 | 100 ± 28 | 100 ± 28 | 100 ± 28 | 100 ± 28 | 100 ± 28 | 100 ± 28 | 100 ± 28 | 100 ± 28 |
| P1–P2 | No deaths | 381 1 n = 1 DNC | No deaths | No deaths | 148 ± 86 7 | No deaths | DNC | 189 ± 142 8 | 198 ± 5 2 | ||
| P3 | 1332 ± 1205 4 n = 6 DNC | 41 1 n = 7 DNC | 1391 ± 1228 2* n = 8 DNC | 137 ± 29 * | 130 ± 19 9 | 172 ± 38§ | 149 ± 28 9* | 140 ± 28 3 | 172 ± 34* | ||
| P3–<24 h | No deaths | 309 1 n = 2 DNC | No deaths | No deaths | 129 1 | 128 ± 28 3 | 174 ± 2 2* | 129 1 | 146 ± 41 3 | ||
| 24–<48 h | 154 ± 85 2 n = 2 DNC | 468 1 n = 4 DNC | No deaths | 275 ± 153 3 | 291 ± 20 3†† | 183 ± 53 5* | 254 1 | No deaths | 184 ± 24 8* | ||
| 48 h | 2210 ± 837 3* n = 2 DNC | No survivors | 765 ± 498 3 n = 4 DNC | 165 ± 72 9* | 211 1 | 152 1 | 170 ± 39 8* | 159 ± 14 3* | No survivors | ||
| 48–<72 h | 2977 1 | No survivors | No deaths | No deaths | No deaths | 431 1 n = 1 DNC | 218 ± 7 2 | 224 1 | No survivors | ||
| 72 h | 351 ± 103 4* n = 1 DNC | No survivors | 255 ± 181 | 124 ± 11 9* | 187 1 | 226 1 | 161 ± 13 6*** | 144 ± 14 2 | No survivors | ||
| MCF (mm) | Baseline | 77 ± 1 | 77 ± 1 | 77 ± 1 | 77 ± 1 | 77 ± 1 | 77 ± 1 | 77 ± 1 | 77 ± 1 | 77 ± 1 | |
| P1–P2 | No deaths | 68 n = 1 DNC | No deaths | No deaths | 56 ± 22 7 | No deaths | DNC | 52 ± 25 8 | 57 ± 2 2 | ||
| P3 | 19 ± 17 4¶ n = 6 DNC | 20 1 n = 7 DNC | 9 ± 5 2* n = 8 DNC | 73 ± 3 * | 69 ± 3 9§ | 70 ± 3§ | 72 ± 2 9* | 65 ± 14 3 | 68 ± 4 10** | ||
| P3–<24 h | No deaths | 38 1 n = 2 DNC | No deaths | No deaths | 62 1 | 65 ± 8 3 | 63 ± 9 2 | 69 1 | 69 ± 13 3 | ||
| 24–<48 h | 49 ± 16 2 n = 2 DNC | 29 1 n = 4 DNC | No deaths | 52 ± 29 3 | 60 ± 11 3 | 71 ± 11 5 | 50 1 | No deaths | 70 ± 9 8 | ||
| 48 h | 5 ± 1 3¶ n = 2 DNC | No survivors | 40 ± 38 3 n = 4 DNC | 69 ± 20 9 | 53 1 | 77 1 | 75 ± 7 8 | 78 ± 3 3 | No survivors | ||
| 48–<72 h | 4 1 | No survivors | No deaths | No deaths | No deaths | 27 1 n = 1 DNC | 66 ± 6 2 | 75 1 | No survivors | ||
| 72 h | 55 ± 13 4 n = 1 DNC | No survivors | 75 ± 22 | 81 ± 2 9 | 79 1 | 77 1 | 81 ± 6 6 | 65 ± 24 2 | No survivors | ||
| ML (%) | Baseline | 6.5 ± 1.9 | 6.5 ± 1.9 | 6.5 ± 1.9 | 6.5 ± 1.9 | 6.5 ± 1.9 | 6.5 ± 1.9 | 6.5 ± 1.9 | 6.5 ± 1.9 | 6.5 ± 1.9 | |
| P1–P2 | No deaths | 0n = 1 DNC | No deaths | No deaths | 6.3 ± 8.5 7 | No deaths | DNC | 3.9 ± 5.2 8 | 36.5 ± 12.0 2 | ||
| P3 | 25 ± 50 4 n = 6 DNC | 0 1 n = 7 DNC | 0 ± 0 2 n = 8 DNC | 2.2 ± 1.0 | 1.3 ± 1.0 9 | 1.1 ± 0.8 | 1.4 ± 1.1 9 | 1.0 ± 1.7 3 | 1.2 ± 0.9 10 | ||
| P3–<24 h | No deaths | 7 1 n = 2 DNC | No deaths | No deaths | 0 1 | 14.3 ± 12.9 3 | 0.5 ± 0.7 2 | 0 1 | 1.5 ± 2.1 3 | ||
| 24–<48 h | 0.5 ± 0.7 2 n = 2 DNC | 0 1 n = 4 DNC | No deaths | 0 ± 0 3 | 0 ± 0 3 | 1.8 ± 4.0 5 | 0 1 | No deaths | 0 ± 0 8* | ||
| 48 h | 57 ± 49.9 3 n = 2 DNC | No survivors | 0.3 ± 0.6 3* n = 4 DNC | 1.2 ± 1.1 9* | 0 1 | 1 1 | 1.4 ± 1.5 8* | 1.0 ± 1.0 3* | No survivors | ||
| 48–<72 h | 78 1 | No survivors | No deaths | No deaths | No deaths | 0 1 n = 1 DNC | 0 ± 0 2 | 0 1 | No survivors | ||
| 72 h | 0 ± 0 4* n = 1 DNC | No survivors | 0.8 ± 1.1 * | 1.4 ± 1.4 9 | 0 1 | 0 1 | 1.2 ± 1.5 6 | 1.0 ± 1.4 2 | No survivors | ||
| FIBTEM | CT (s) | Baseline | 37 ± 3 | 37 ± 3 | 37 ± 3 | 37 ± 3 | 37 ± 3 | 37 ± 3 | 37 ± 3 | 37 ± 3 | 37 ± 3 |
| P1–P2 | No deaths | 47 ± 1 2 | No deaths | No deaths | 390 ± 820 7* | No deaths | 1862 1 | 157 ± 272 8* | 65 n = 1 DNC | ||
| P3 | 75 ± 108 | 48 ± 13 7 n = 1 DNC | 45 ± 6 2 n = 1 DNC | 41 ± 6 | 42 ± 5 5 | 48 ± 6 | 41 ± 4 9 | 37 ± 2 3 | 54 ± 5 10 | ||
| P3–<24 h | No deaths | 324 ± 368 3 | No deaths | No deaths | 43 1 | 47 ± 16 3 | 58 ± 3 2 | 40 1 | 59 ± 7 2 | ||
| 24–<48 h | 45 ± 11 4 | 37 ± 24 2 n = 2 DNC | No deaths | 77 ± 26 3‡‡ | 48 ± 0 3* | 49 ± 5 5* | 41 1 | No deaths | 59 ± 13 8* | ||
| 48 h | 39 ± 6 5 | No survivors | 42 ± 5 | 39 ± 3 9 | 44 1 | 42 1 | 46 ± 10 8 | 45 ± 7 3 | No survivors | ||
| 48–<72 h | 32 1 | No survivors | No deaths | No deaths | No deaths | 48 1 n = 1 DNC | 41 ± 4 2 | 58 1 | No survivors | ||
| 72 h | 30 ± 20 5 | No survivors | 39 ± 3 | 38 ± 4 9 | 43 1 | 40 1 | 42 ± 2 6 | 41 ± 9 2 | No survivors | ||
| MCF (mm) | Baseline | 18 ± 2 | 18 ± 2 | 18 ± 2 | 18 ± 2 | 18 ± 2 | 18 ± 2 | 18 ± 2 | 18 ± 2 | 18 ± 2 | |
| P1–P2 | No deaths | 12 ± 0 2* | No deaths | No deaths | 10 ± 6 7* | No deaths | 4 1 | 10 ± 4 8* | 11 n = 1 DNC | ||
| P3 | 21 ± 13 | 15 ± 3 7 n = 1 DNC | 16 ± 3 2 n = 1 DNC | 20 ± 3 | 16 ± 2 5 | 21 ± 16 | 15 ± 2 9 | 16 ± 2 3 | 12 ± 3 10 | ||
| P3–<24 h | No deaths | 14 ± 15 3 | No deaths | No deaths | 10 1 | 18 ± 10 3 | 10 ± 1 2 | 11 1 | 16 ± 13 2 | ||
| 24–<48 h | 33 ± 13 4 | 37 ± 10 2 n = 2 DNC | No deaths | 36 ± 14 3 | 44 ± 6 3 | 35 ± 9 5 | 50 1 | No deaths | 35 ± 15 8 | ||
| 48 h | 50 ± 23 5* | No survivors | 45 ± 7 * | 48 ± 7 9* | 44 1 | 52 1 | 45 ± 7 8* | 46 ± 3 3* | No survivors | ||
| 48–<72 h | 54 1 | No survivors | No deaths | No deaths | No deaths | 26 1 n = 1 DNC | 48 ± 8 2 | 45 1 | No survivors | ||
| 72 h | 50 ± 5 5* | No survivors | 44 ± 8 * | 45 ± 8 9* | 48 1 | 45 1 | 50 ± 8 6* | 49 ± 1 2* | No survivors | ||
| ML (%) | Baseline | 2.0 ± 3.2 | 2.0 ± 3.2 | 2.0 ± 3.2 | 2.0 ± 3.2 | 2.0 ± 3.2 | 2.0 ± 3.2 | 2.0 ± 3.2 | 2.0 ± 3.2 | 2.0 ± 3.2 | |
| P1–P2 | No deaths | 0 ± 0 2 | No deaths | No deaths | 16 ± 37 7 | No deaths | 72 1 | 8 ± 18 8 | 0n = 1 DNC | ||
| P3 | 0.7 ± 2.2 | 0.4 ± 1.1 7 n = 1 DNC | 0 ± 0 2 n = 1 DNC | 0 ± 0 | 0.2 ± 0.4 5 | 0.1 ± 0.3 | 0 ± 0 9 | 0 ± 0 3 | 0.7 ± 2.2 10 | ||
| P3–<24 h | No deaths | 14.3 ± 24.8 3 | No deaths | No deaths | 1 1 | 0 ± 0 3 | 0 ± 0 2 | 0 1 | 0 ± 0 2 | ||
| 24–<48 h | 0 ± 0 4 | 0 ± 0 2 n = 2 DNC | No deaths | 0 ± 0 3 | 0 ± 0 3 | 0 ± 0 5 | 0 1 | No deaths | 0.1 ± 0.4 8 | ||
| 48 h | 0 ± 0 5 | No survivors | 0.5 ± 1.6 | 0 ± 0 9 | 0 1 | 0 1 | 0 ± 0 8 | 0 ± 0 3 | No survivors | ||
| 48–<72 h | 0 1 | No survivors | No deaths | No deaths | No deaths | 0 1 n = 1 DNC | 0 ± 0 2 | 0 1 | No survivors | ||
| 72 h | 0 ± 0 5* | No survivors | 1.4 ± 4.4 | 0.3± 1.0 9* | 0 1 | 0 1 | 0 ± 0 6 | 0 ± 0 2 | No survivors | ||
| FIBTEM MCF: EXTEM MCF | Baseline | 0.23 ± 0.02 | 0.23 ± 0.02 | 0.23 ± 0.02 | 0.23 ± 0.02 | 0.23 ± 0.02 | 0.23 ± 0.02 | 0.23 ± 0.02 | 0.23 ± 0.02 | 0.23 ± 0.02 | |
| P1–P2 | No deaths | 0.17 ± 0.00 2 | No deaths | No deaths | 0.16 ± 0.07 7 | No deaths | 0.17 1 | 0.17 ± 0.03 7 | 0.17 1 | ||
| P3 | 0.29 ± 0.18 9 | 0.22 ± 0.04 7 | 0.22 ± 0.04 9 | 0.27 ± 0.05 | 0.23 ± 0.02 5 | 0.29 ± 0.23 | 0.21 ± 0.02 9 | 0.22 ± 0.02 3 | 0.17 ± 0.04 10 | ||
| P3–<24 h | No deaths | 0.60 ± 0.48 3 | No deaths | No deaths | 0.15 1 | 0.26 ± 0.07 3 | 0.14 ± 0.02 2 | 0.16 1 | 0.21 ± 0.16 2 | ||
| 24–<48 h | 0.72 ± 0.23 4* | 0.67 ± 0.19 4* | No deaths | 0.79 ± 0.31 3* | 0.77 ± 0.09 3††† | 0.45 ± 0.06 5* | 0.93 1 | No deaths | 0.48 ± 0.18 8* | ||
| 48 h | 0.68 ± 0.14 5* | No survivors | 0.57 ± 0.07 * | 0.64 ± 0.11 9* | 0.65 1 | 0.61 1 | 0.60 ± 0.12 8* | 0.58 ± 0.05 3* | No survivors | ||
| 48–<72 h | 0.92 1 | No survivors | No deaths | No deaths | No deaths | 0.67 ± 0.38 2 | 0.74 ± 0.18 2 | 0.59 1 | No survivors | ||
| 72 h | 0.61 ± 0.04 4* | No survivors | 0.54 ± 0.08 * | 0.54 ± 0.09 9* | 0.59 1 | 0.58 1 | 0.60 ± 0.07 6* | 0.59 ± 0.03 2* | No survivors | ||
Disclaimer/Publisher’s Note: The statements, opinions and data contained in all publications are solely those of the individual author(s) and contributor(s) and not of MDPI and/or the editor(s). MDPI and/or the editor(s) disclaim responsibility for any injury to people or property resulting from any ideas, methods, instructions or products referred to in the content. |
© 2026 by the authors. Published by MDPI on behalf of the Lithuanian University of Health Sciences. Licensee MDPI, Basel, Switzerland. This article is an open access article distributed under the terms and conditions of the Creative Commons Attribution (CC BY) license.
Share and Cite
Letson, H.; Dobson, G. ALM Resuscitation Without Transfusion Improves Platelet Function and Survival After Liver Injury and Uncontrolled Hemorrhage. Medicina 2026, 62, 453. https://doi.org/10.3390/medicina62030453
Letson H, Dobson G. ALM Resuscitation Without Transfusion Improves Platelet Function and Survival After Liver Injury and Uncontrolled Hemorrhage. Medicina. 2026; 62(3):453. https://doi.org/10.3390/medicina62030453
Chicago/Turabian StyleLetson, Hayley, and Geoffrey Dobson. 2026. "ALM Resuscitation Without Transfusion Improves Platelet Function and Survival After Liver Injury and Uncontrolled Hemorrhage" Medicina 62, no. 3: 453. https://doi.org/10.3390/medicina62030453
APA StyleLetson, H., & Dobson, G. (2026). ALM Resuscitation Without Transfusion Improves Platelet Function and Survival After Liver Injury and Uncontrolled Hemorrhage. Medicina, 62(3), 453. https://doi.org/10.3390/medicina62030453