


Abstract
Glucosylsphingosine (lyso-Gb1) serves as a biomarker for evaluating disease activity in Gaucher disease (GD). While treatment-related changes are documented, the dynamics of lyso-Gb1 during untreated states remain poorly understood. This retrospective, longitudinal cohort study utilized a large GD database comprising 701 patients and over 6200 visits with lyso-Gb1 measurements. Patients with at least two untreated visits were included in the analysis (n = 272). A significant change was defined as ≥50 ng/mL for lyso-Gb1, ≥1 g/dL for hemoglobin, and ≥50 × 109/L for platelet count. Multivariable logistic regression analyses identified clinical factors associated with lyso-Gb1 decline or an increase. During untreated states, 35 patients (12.9%; 95% CI 9.4–17.5%) exhibited a decline in lyso-Gb1, with a median decrease of 96.3 ng/mL. This decline was more common in females (OR 3.50, p = 0.032) and associated with higher initial lyso-Gb1 levels (p < 0.001) and baseline hemoglobin (p = 0.032). An increase in lyso-Gb1 was observed in 98 patients (36.0%; 95% CI 30.5–41.9%), with a median rise of 135.1 ng/mL. This increase correlated with lower baseline platelet counts (p = 0.003), lower baseline hemoglobin (p = 0.002), and longer follow-up duration (p = 0.001). In many cases, lyso-Gb1 increases were observed without a preceding change in hemoglobin or platelet count. In summary, declines in lyso-Gb1 in untreated states are rare but possible. The association with female sex may reflect inflammatory effects. Although increases in lyso-Gb1 were expected without treatment, they occurred mainly in patients with higher disease severity markers. Nevertheless, most patients in the untreated states remained stable within ±50 ng/mL. These findings demonstrate a heterogeneous trajectory of lyso-Gb1 across untreated states and highlight the importance of interpreting lyso-Gb1 changes within the clinical context when making treatment decisions.
1. Introduction
Gaucher disease (GD) is the most common lysosomal storage disorder and results from biallelic pathogenic variants in the GBA1 gene, leading to the deficient activity of the lysosomal enzyme β-glucocerebrosidase [1]. The enzymatic defect causes a progressive accumulation of glucosylceramide and related sphingolipids within macrophages, leading to the characteristic “Gaucher cells” that infiltrate the spleen, liver, bone marrow, and other tissues. Although enzyme replacement and substrate reduction therapies have substantially altered disease outcomes, some patients with GD remain untreated [2,3,4].
Glucosylsphingosine (lyso-Gb1), the deacylated derivative of glucosylceramide, has emerged as a highly sensitive and specific biomarker for GD [5,6,7,8], reflecting the underlying accumulation of glucosylceramide and the metabolic activity of Gaucher macrophages. Plasma lyso-Gb1 concentrations are markedly elevated in untreated patients and typically decline following therapy initiation, correlating with disease burden and treatment response [9,10,11,12,13]. Compared with traditional biomarkers such as chitotriosidase, lyso-Gb1 more directly reflects the underlying metabolic defect and has increasingly become central to diagnostic and monitoring strategies.
The clinical course of untreated GD is characterized by substantial inter-individual variability, ranging from stable mild phenotypes to progressive hematologic and skeletal complications. In clinical practice, decisions regarding treatment initiation frequently incorporate longitudinal trends in biomarkers, including lyso-Gb1 [14,15]. However, the interpretation of lyso-Gb1 changes in untreated patients remains challenging, particularly in individuals identified through screening or with mild disease, for whom treatment decisions are less straightforward.
Most existing data describing lyso-Gb1 dynamics derive from treated cohorts or short-term observations, and the natural behavior during untreated follow-up remains incompletely defined. Specifically, the frequency and magnitude of spontaneous fluctuations, as well as the clinical factors associated with these changes, are not well established. Therefore, the aim of this retrospective, longitudinal study was to characterize lyso-Gb1 trajectories during untreated states and to identify clinical factors associated with lyso-Gb1 increases or decreases. Focusing on untreated states, rather than never-treated status, allowed us to assess lyso-Gb1 behavior during periods without therapy across real-world longitudinal follow-ups.
2. Results
2.1. Study Cohort
Among 701 patients with longitudinal data, 272 met the inclusion criteria for analysis in untreated states (Table 1). Compared with treated individuals, patients with untreated states were younger at study entry and at the last visit, were more frequently classified as having a mild genotype, and had a slightly shorter follow-up time. Hematologic parameters were broadly similar between groups. Lyso-Gb1 levels were similar at study entry but significantly lower in the treated cohort at the last visit.
Table 1.
Characteristics of patients with Gaucher disease during treated and untreated states.
2.2. Lyso-Gb1 Trends During Untreated States
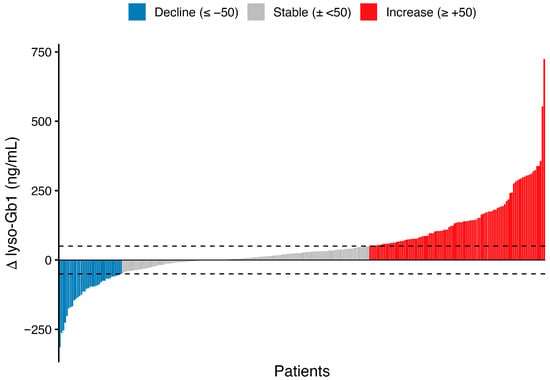
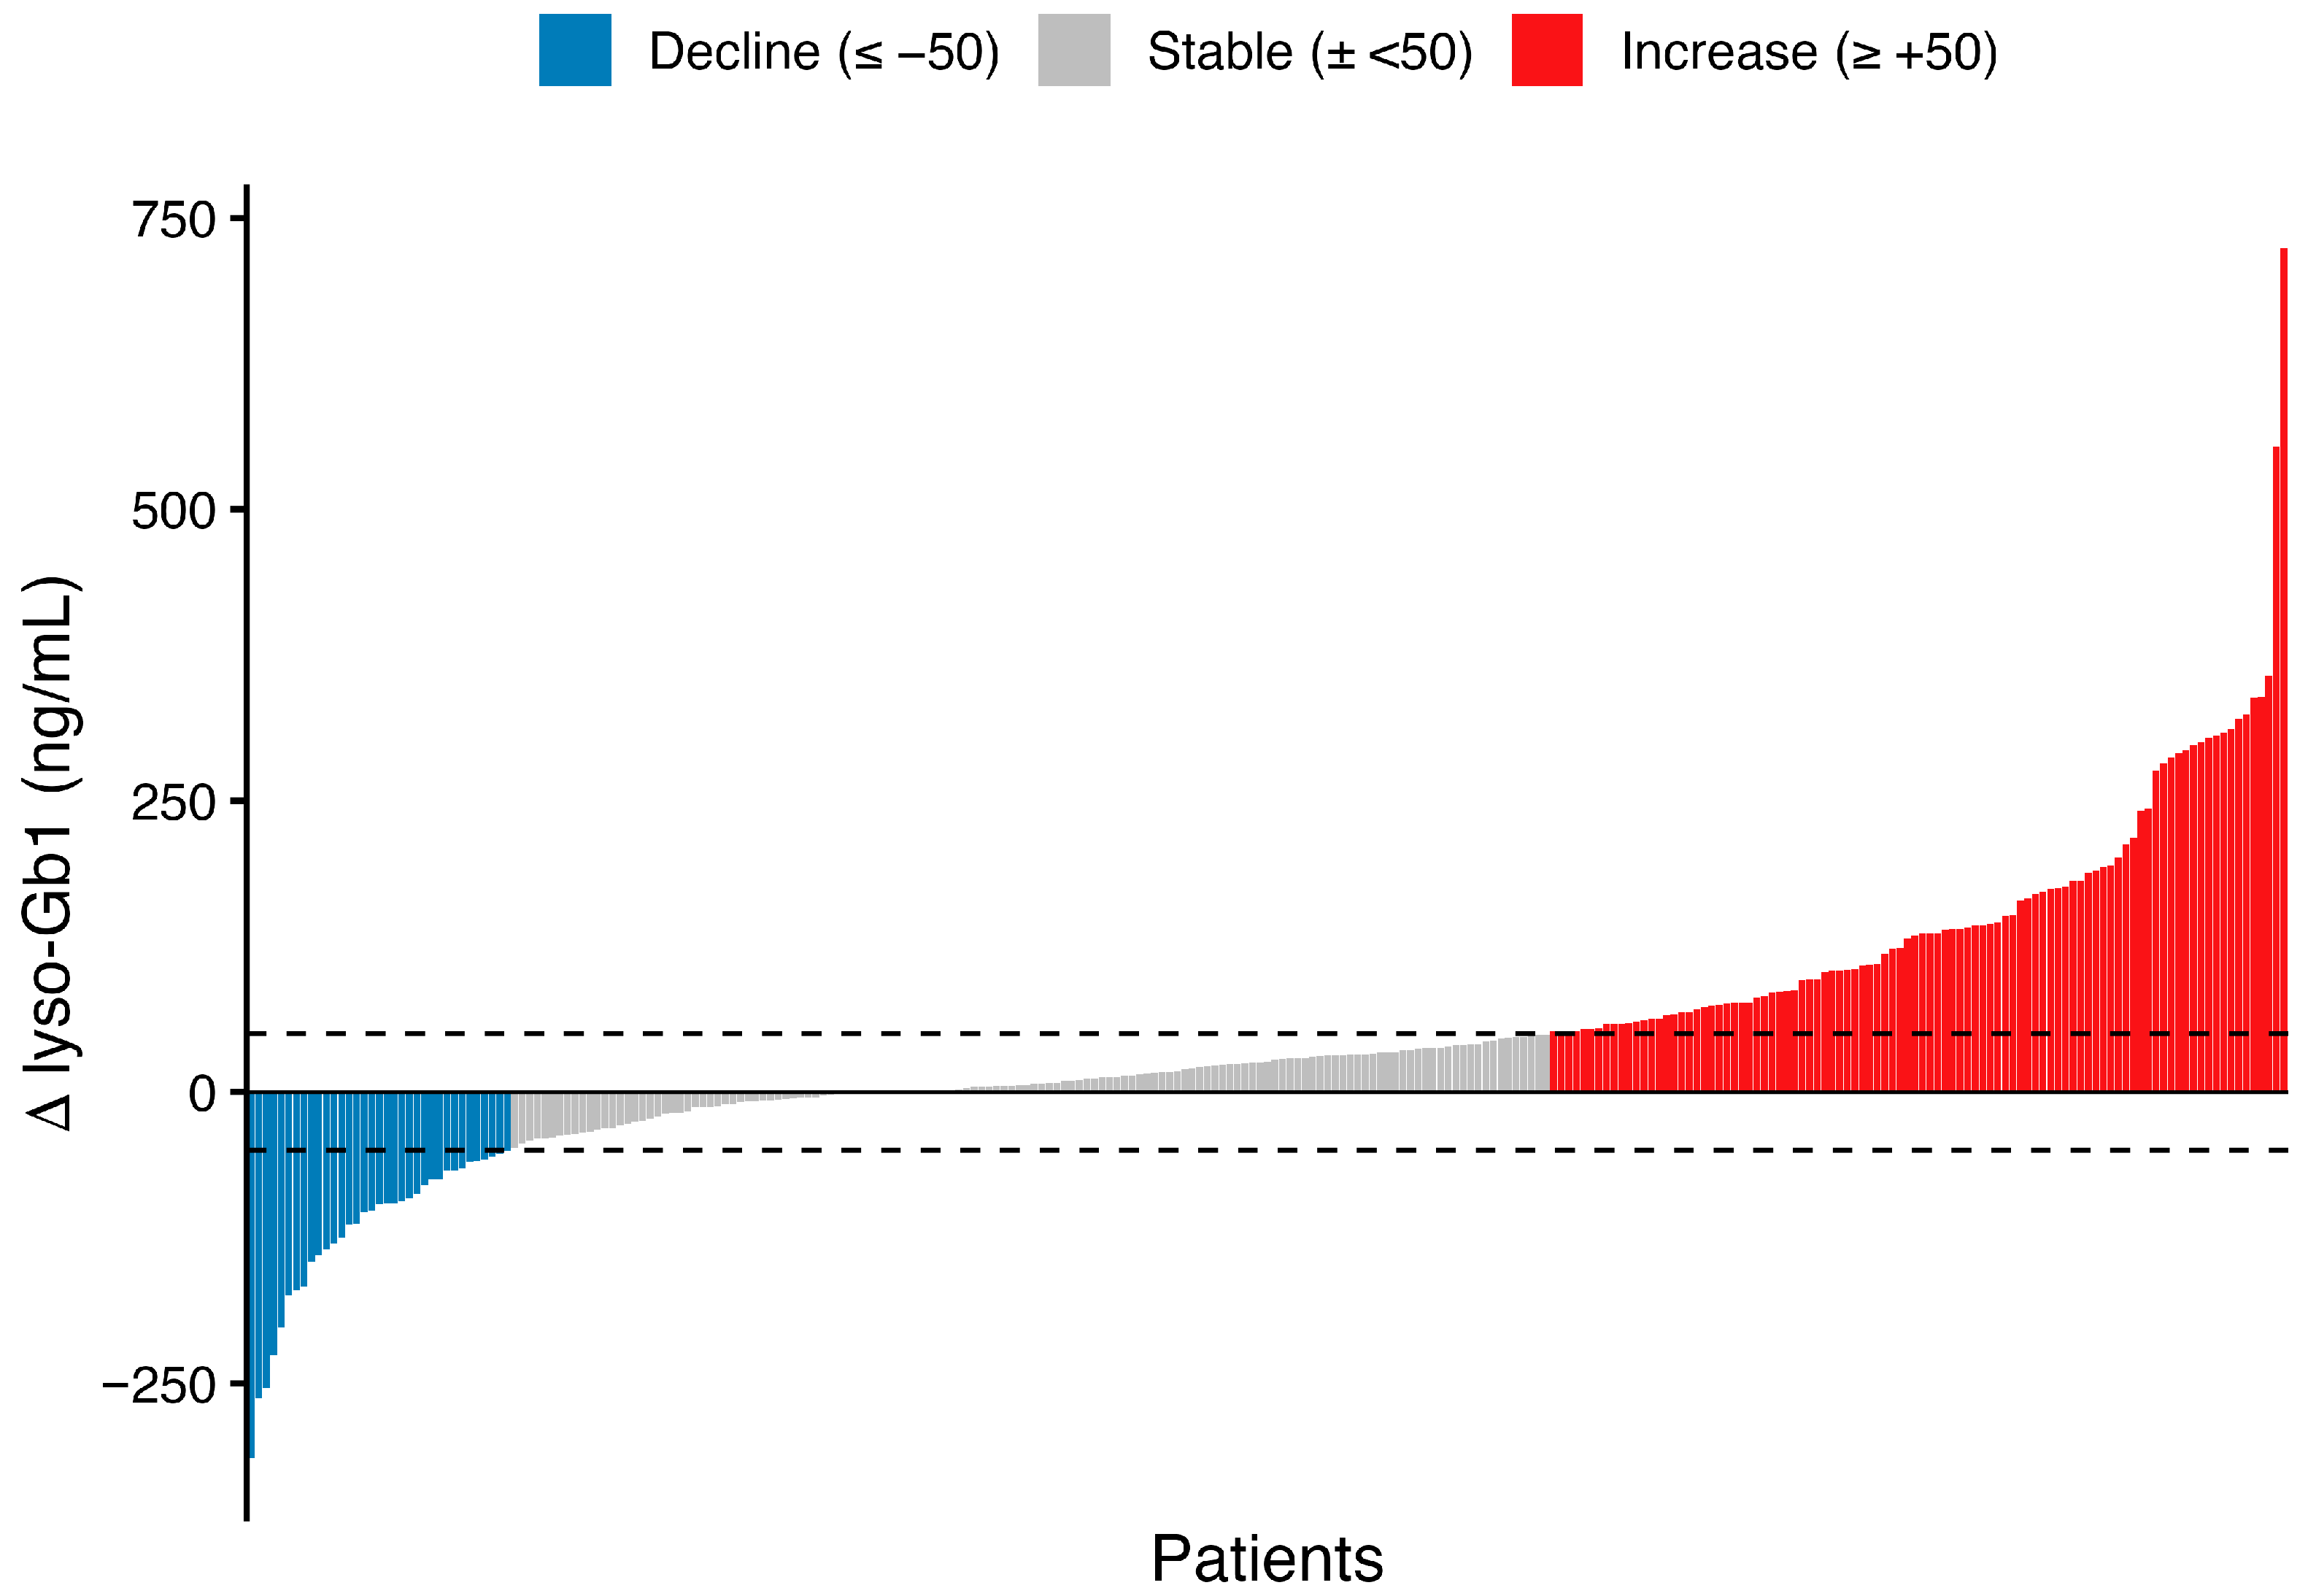
During untreated states, 35 patients (12.9%; 95% CI, 9.4–17.5%) experienced a decline in lyso-Gb1 concentrations (≥50 ng/mL), with a median decrease of 96.3 ng/mL; 17 had declines exceeding 100 ng/mL. Increases in lyso-Gb1 were more common, occurring in 98 patients (36.0%; 95% CI 30.5–41.9%), with a median rise of 135.1 ng/mL; 62 demonstrated an increase greater than 100 ng/mL. Overall, approximately half of the patients in the untreated states remained within the predefined ±50 ng/mL stability threshold over time. The distribution of longitudinal changes is shown in Figure 1. Representative longitudinal trajectories for selected patients in the decline, stable, and increase groups are shown in Supplementary Figure S1A–C.
Figure 1.
The individual change in lyso-Gb1 during untreated states. Each bar represents one patient and shows the change in plasma lyso-Gb1 between the first and last untreated measurements (Δ lyso-Gb1 = last−first), with patients ordered from the largest decrease to the largest increase. Dashed horizontal lines indicate the predefined thresholds of −50 ng/mL and +50 ng/mL. Bars are colored by category: decline (≤−50 ng/mL), stable (within ±50 ng/mL), and increase (≥+50 ng/mL).
Monitoring intensity during the untreated states was comparable across the decline, increase, and stable groups, with no significant differences in the number of measurements per patient (Table 2). Follow-up intervals differed modestly across groups, with a shorter interval observed in the decline group compared with the increase group (p = 0.036), whereas other pairwise comparisons were not significant. Among patients with exactly two measurements, neither the proportion of such patients nor the interval between measurements differed between groups.
Table 2.
Lyso-Gb1 testing across trend groups.
2.3. Factors Associated with Lyso-Gb1 Decline
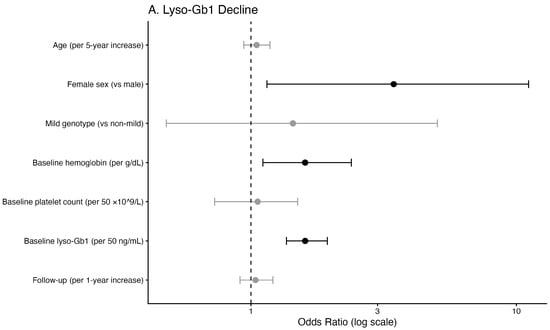
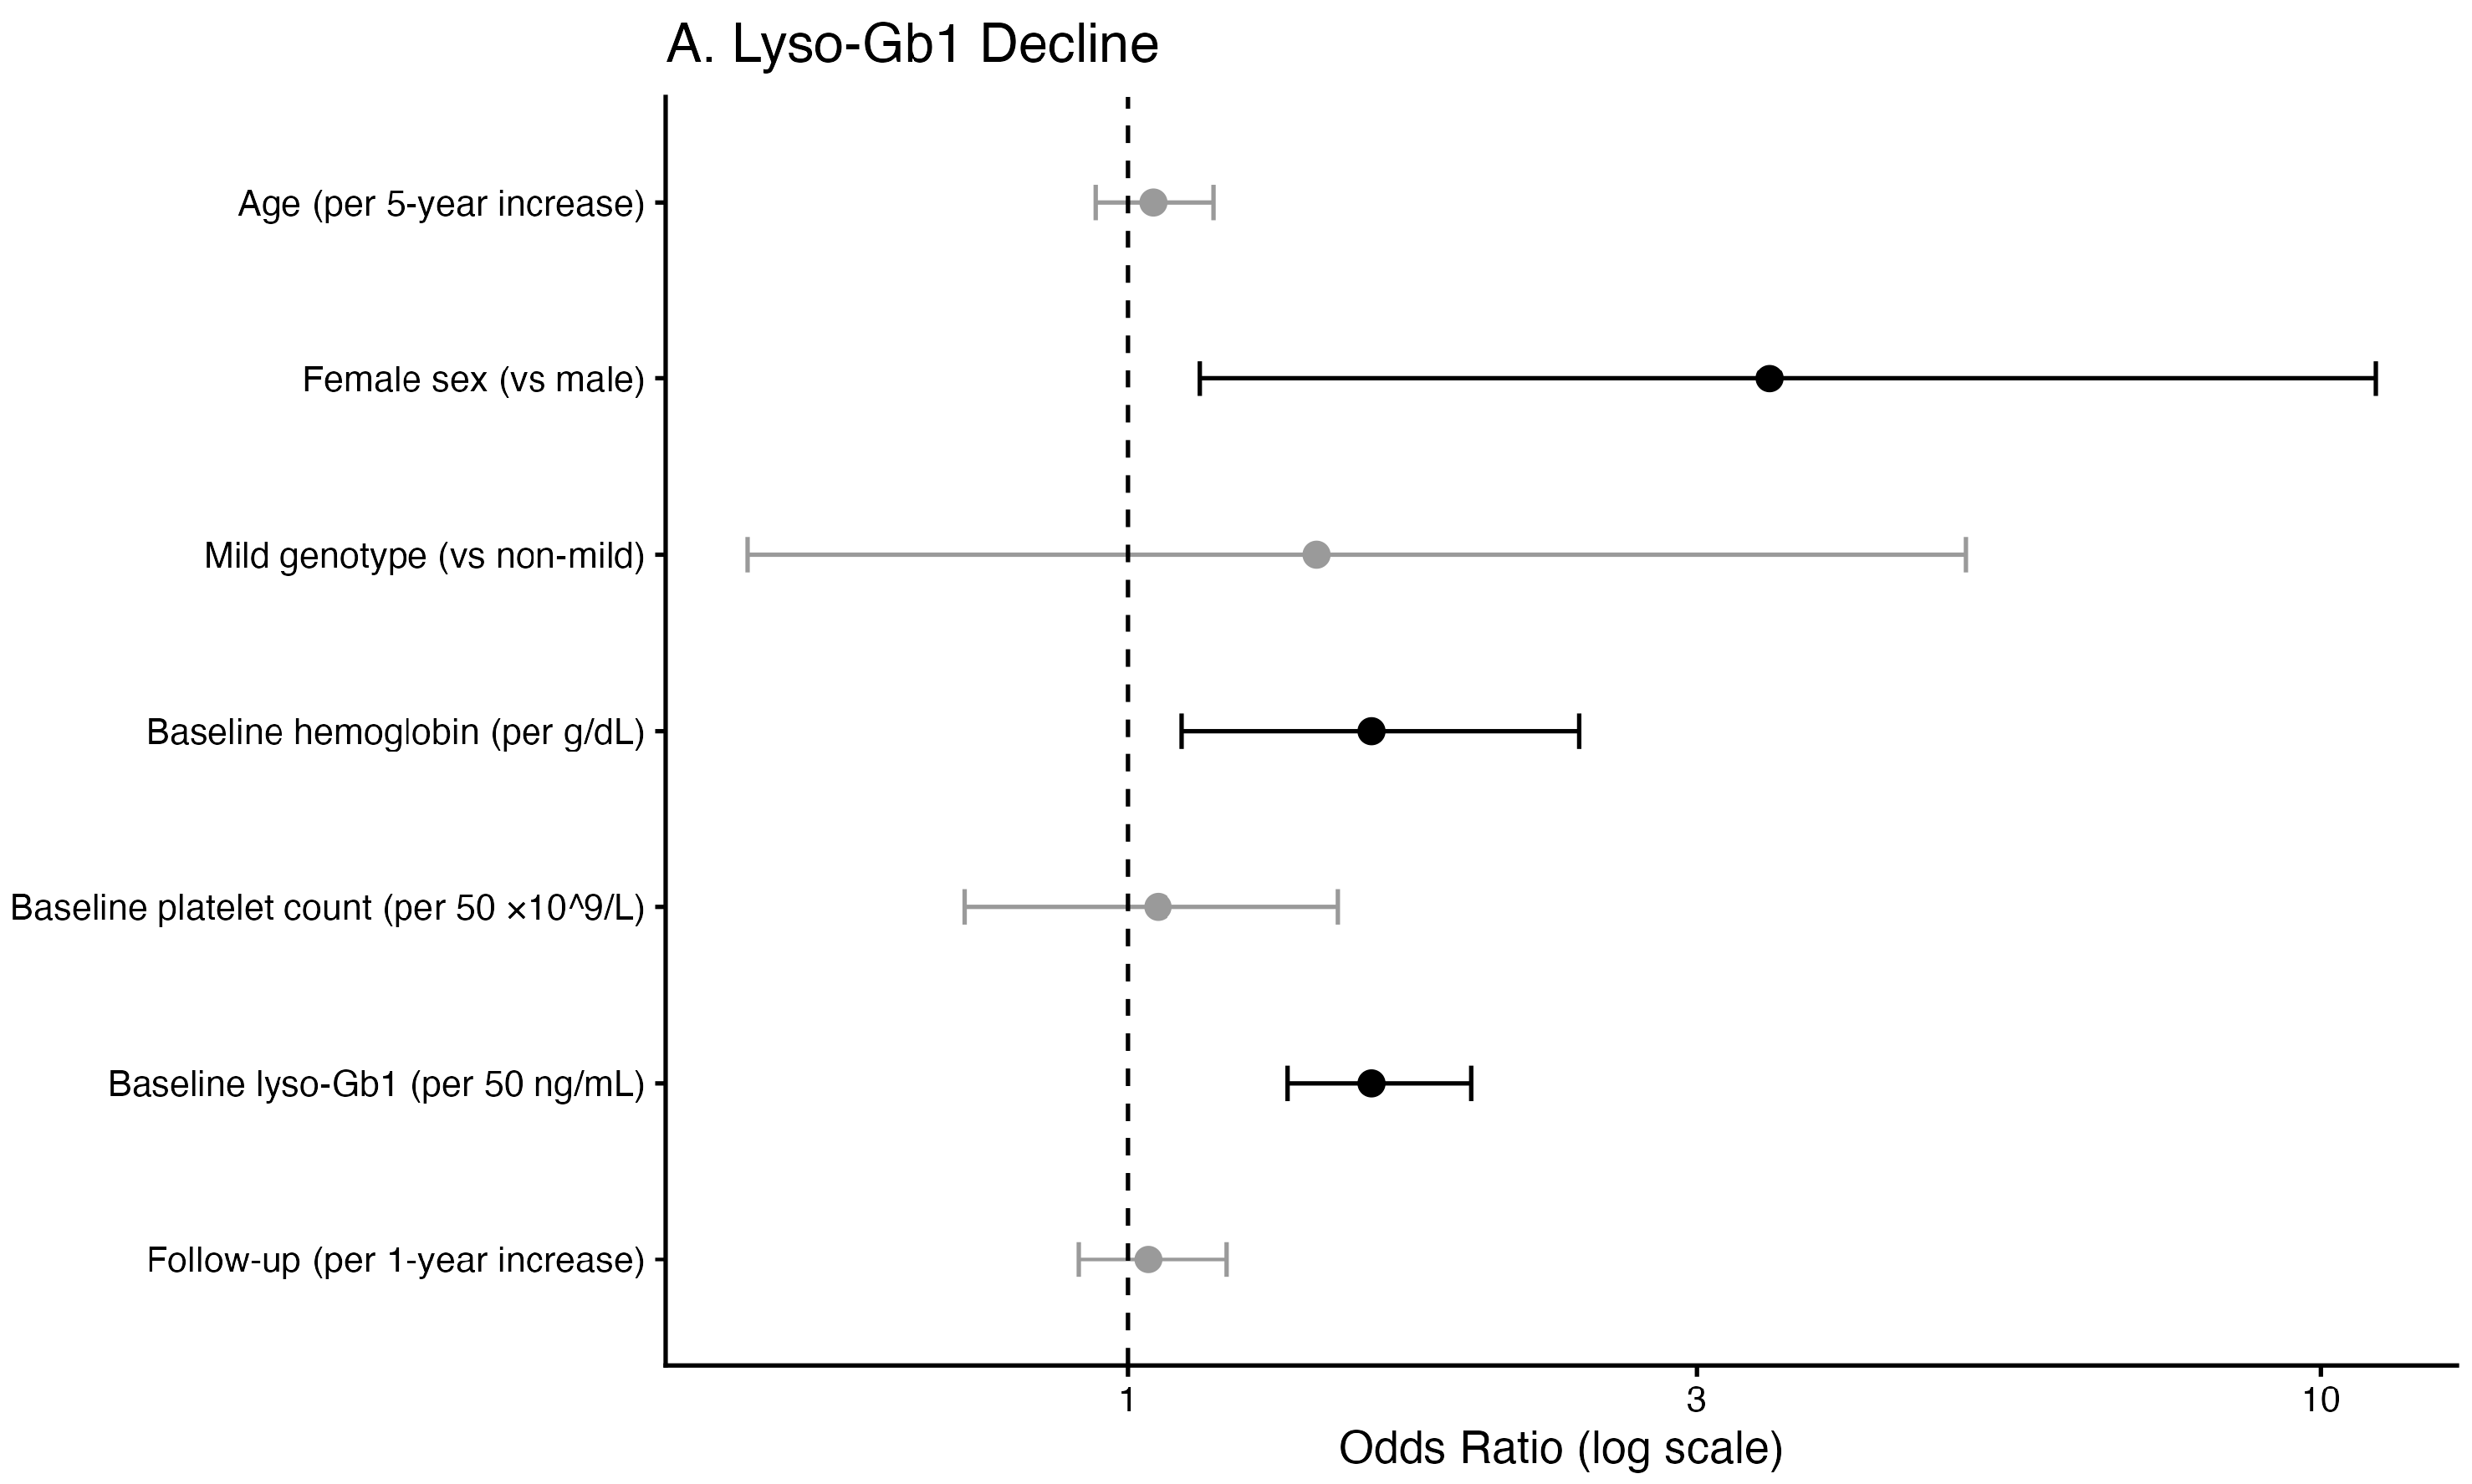
Multivariable logistic regression analysis identified female sex as independently associated with increased odds of significant lyso-Gb1 decline during untreated follow-up (Table 3; Figure 2A). Higher baseline hemoglobin and higher baseline lyso-Gb1 levels were also independently associated with decline. Age, genotype severity, baseline platelet count, and duration of untreated follow-up were not significantly associated with decreasing lyso-Gb1 levels.
Table 3.
Multivariable logistic regression analysis of factors associated with lyso-Gb1 decline or increase during untreated states.
Figure 2.
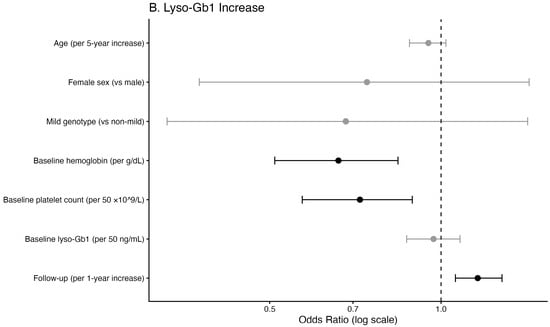
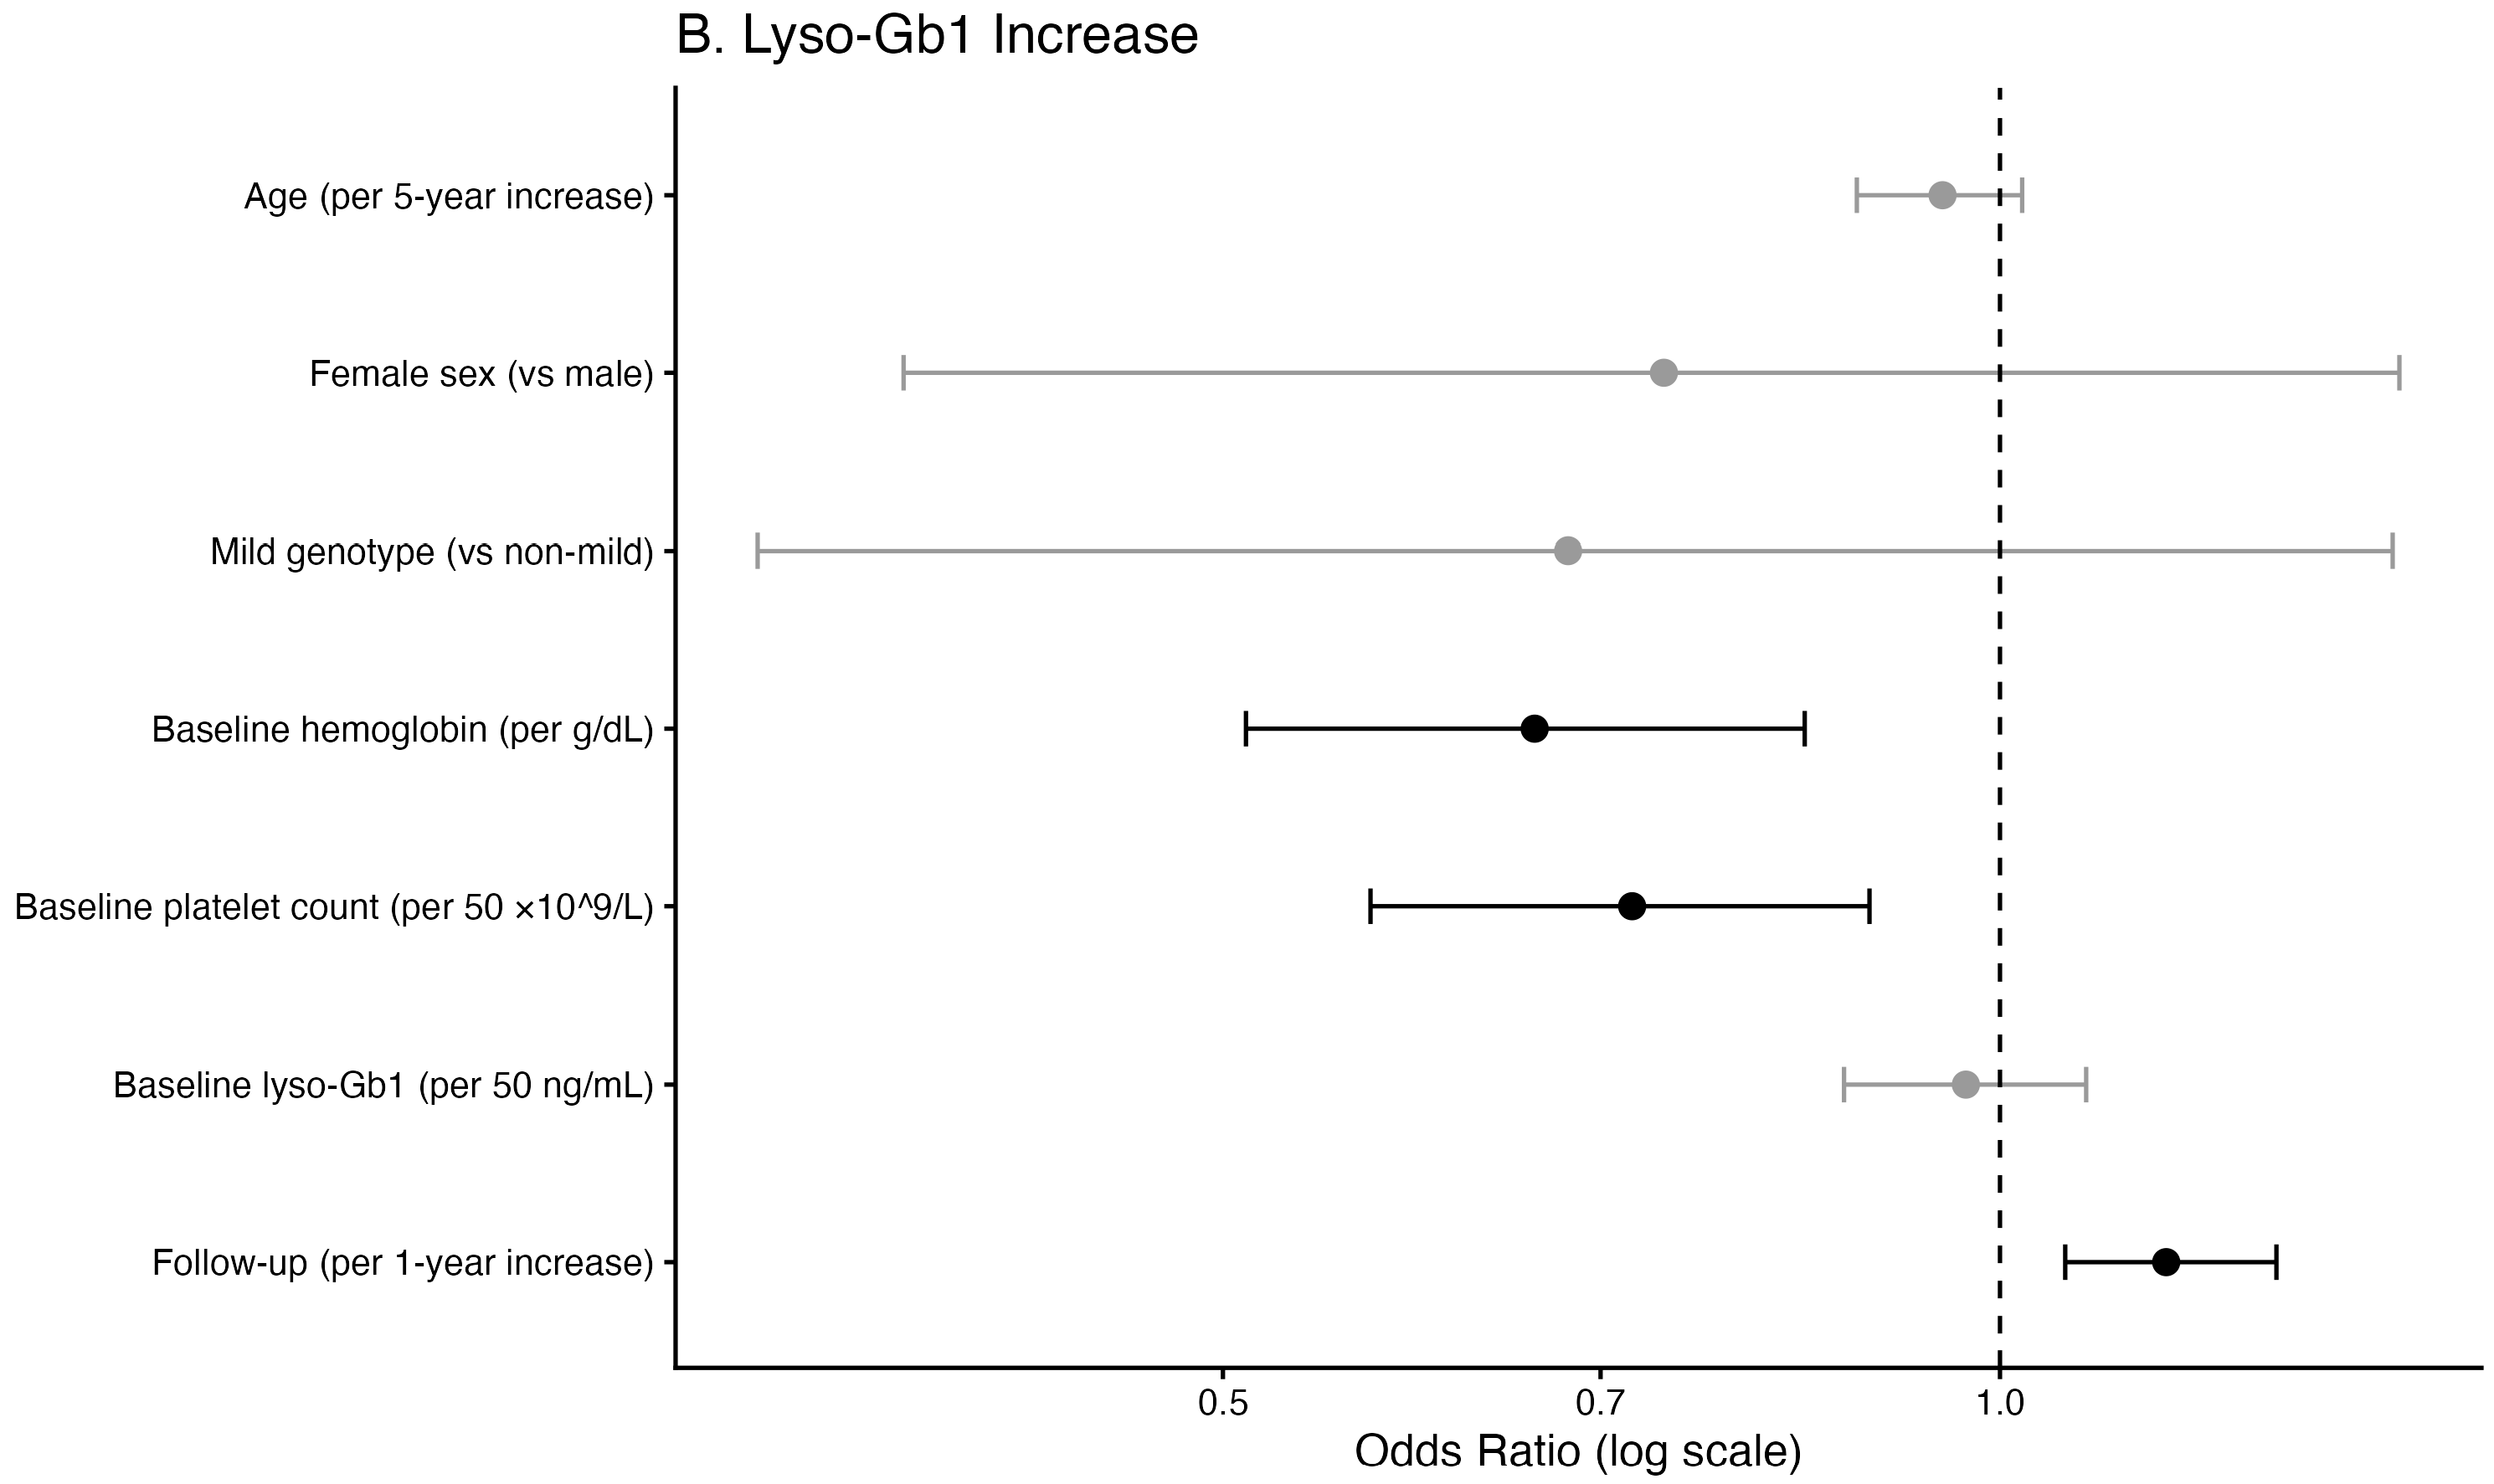
Multivariable logistic regression models for significant lyso-Gb1 decline (A) and increase (B) during untreated states. Points represent odds ratios, and horizontal lines represent 95% confidence intervals. The dashed vertical line indicates OR = 1.0. Black markers denote statistically significant associations (p-value < 0.05).
2.4. Factors Associated with Lyso-Gb1 Increase
Significant increases in lyso-Gb1 were primarily associated with lower baseline platelet count, lower baseline hemoglobin levels, and a longer duration of untreated follow-up (Table 3; Figure 2B). No significant association was observed between lyso-Gb1 trends and concurrent changes in hemoglobin or platelet count.
Among patients with increasing lyso-Gb1, hemoglobin decline was documented before lyso-Gb1 increase in only eight cases (8%), while platelet decline was documented before lyso-Gb1 increase in four cases (4%). In most patients, hematologic deterioration occurred after the lyso-Gb1 rise or at the same visit or was not observed during follow-up.
2.5. Analysis of Never-Treated Patients
We performed an additional analysis restricted to 543 patients who were never treated and compared them with those who were always treated throughout follow-up (Table 4). In this stricter comparison, never-treated patients were younger, had a substantially higher proportion of a mild genotype, had shorter follow-up, and had higher last lyso-Gb1 values than always-treated patients.
Table 4.
Characteristics of patients who were always and never treated.
Among patients who were never treated, 20 (8.1%; 95% CI 5.3–12.2%) experienced a decline in lyso-Gb1 concentrations (≥50 ng/mL), with a median decrease of 96.2 ng/mL; 9 had declines exceeding 100 ng/mL. Increases in lyso-Gb1 were more frequent, occurring in 63 patients (25.6%; 95% CI 20.6–31.4%), with a median rise of 132.0 ng/mL; 39 showed an increase greater than 100 ng/mL. Overall, most patients who were never treated (66.3%) remained within the predefined ±50 ng/mL stability threshold over time. The distribution of longitudinal changes in patients who were never treated is shown in Supplementary Figure S2.
In the multivariable logistic regression analysis restricted to patients who were never treated, older age, higher baseline lyso-Gb1 levels, and longer follow-up duration were independently associated with increased odds of a significant lyso-Gb1 decline, whereas significant increases in lyso-Gb1 were independently associated with younger age, lower baseline platelet count, and longer follow-up duration (Table 5).
Table 5.
Multivariable logistic regression analysis of factors associated with lyso-Gb1 decline or increase in lyso-Gb1 in never-treated individuals.
3. Discussion
This large, retrospective, longitudinal study demonstrates that lyso-Gb1 trajectories during untreated states in GD are heterogeneous rather than uniformly progressive. Although increases in lyso-Gb1 were observed in approximately one-third of patients, nearly half of the cohort remained stable within a predefined range during prolonged untreated follow-up, and a minority of patients exhibited spontaneous declines. These findings highlight that biochemical variability can occur even in the absence of treatment and emphasize that changes in lyso-Gb1 should be interpreted cautiously within the broader clinical context; the reliable prediction of increases or declines at the individual patient level is not always possible.
Our findings extend observations from natural history studies demonstrating that untreated GD can follow a heterogeneous clinical course, with some patients remaining stable for extended periods, while others experience progressive disease [4,16,17]. In this context, the stability observed in most patients who were never treated suggests that biochemical progression is not inevitable during untreated follow-up, particularly in individuals with milder disease phenotypes.
In contrast, 36% of patients showed an increase in lyso-Gb1 levels during the untreated states. These increases were independently linked to lower baseline platelet counts and hemoglobin levels, both indicators of more severe disease. This finding aligns with previous studies showing correlations between lyso-Gb1 levels and clinical disease burden [18,19]. A longer follow-up duration was also associated with a higher chance of lyso-Gb1 increase, supporting the concept that GD may progress over time and that routine follow-up visits are warranted [20,21,22]. In many patients, elevations in lyso-Gb1 were observed without a preceding measurable decline in hematologic parameters, suggesting that lyso-Gb1 may reflect early metabolic changes before overt hematologic progression becomes apparent [23]. However, increases in lyso-Gb1 do not necessarily indicate immediate clinical worsening. In practice, rising lyso-Gb1 levels should lead to closer monitoring and re-evaluation, often including repeat testing at an earlier time, rather than immediate treatment unless other clinical signs are present [17]. In stable patients not receiving GD-specific therapy, lyso-Gb1 may be assessed as part of routine follow-up, often every 6–12 months. When a considerable rise is observed or when there is concern for clinical instability, reassessment may be considered even within 3 months, depending on the overall clinical context.
A notable finding of this study is that a minority of patients experienced substantial declines in lyso-Gb1 during follow-up without treatment. Although uncommon, these reductions were sometimes large, exceeding 100 ng/mL in several patients. In the broader analysis across untreated states, female sex was independently associated with a higher likelihood of decline in lyso-Gb1. However, this observation should be interpreted cautiously, as it was based on a relatively small number of events and was not observed in the restricted never-treated analysis. While sex-related differences in immune responses and inflammatory signaling have been described in other lysosomal and metabolic disorders [24,25,26], this mechanism was not directly tested in the present study. Accordingly, this finding should be regarded as hypothesis-generating and in need of further evaluation. Higher baseline lyso-Gb1 levels were also associated with subsequent decreases, which may partly reflect regression toward the mean, whereby individuals with particularly elevated baseline values demonstrate reductions on repeat testing [27]. Because lyso-Gb1 reflects macrophage activation and sphingolipid turnover, transient metabolic or inflammatory fluctuations may also contribute to temporary elevations followed by spontaneous declines. Although baseline hemoglobin was associated with lyso-Gb1 decline in multivariable analysis, descriptive comparisons showed largely overlapping hemoglobin distributions between groups, suggesting that the association reflects a modest continuous effect captured by the regression model rather than a clinically meaningful difference in baseline hemoglobin levels.
Interestingly, in the restricted analysis of patients who were never treated, older age was associated with lyso-Gb1 decline, whereas younger age was associated with lyso-Gb1 increase. One possible explanation is that patients who were never treated at an older age represent a selected group with long-term stable or milder disease, in whom downward fluctuations or gradual reductions in lyso-Gb1 may be more likely [3]. In contrast, younger patients who were never treated may still be earlier in their disease course and therefore more likely to show an increase in lyso-Gb1 over time [16].
Importantly, the threshold used to define a change in lyso-Gb1 in this study was intentionally conservative. We predefined a change as an absolute increase or decrease of at least ±50 ng/mL. This threshold was selected to account for biological variability in lyso-Gb1 measurements while capturing changes that would realistically influence clinical management. Analytical variability in the DBS-based lyso-Gb1 assay is low, with reported intra-assay coefficients of variation below 6% across clinically relevant concentrations, indicating high measurement precision [23]. Nevertheless, smaller fluctuations may occur due to physiological variation, intercurrent illness, or other transient factors and may not necessarily reflect true changes in disease activity. Even when lyso-Gb1 changes exceed this threshold, lyso-Gb1 trends should be interpreted in conjunction with clinical findings, including hematologic parameters, organ involvement, skeletal disease, and overall disease trajectory, rather than being used in isolation for treatment decisions [17].
Several limitations should be considered when interpreting these findings. First, the retrospective design limits the ability to control for potential confounders such as intercurrent infections, inflammatory conditions, hormonal changes, or other metabolic factors that may influence sphingolipid metabolism and lyso-Gb1 levels. Second, patients in untreated states in this cohort were more likely to have milder genotypes and disease manifestations, which may limit the generalizability of these findings to patients with more severe disease. Third, visit intervals were not standardized and varied among patients, which may influence the magnitude of observed lyso-Gb1 changes. Some patients had only two measurements, which may increase the risk of misclassification of longitudinal trends and introduce potential bias. However, the interval between these two measurements did not differ between groups, suggesting that any potential misclassification is likely non-differential and unlikely to substantially bias the observed associations. Finally, although hematologic parameters were evaluated, other clinically important manifestations of GD, including skeletal disease and organ volumes, were not incorporated into the longitudinal models.
4. Materials and Methods
4.1. Study Design and Data Source
This retrospective, longitudinal cohort study used data from the Gaucher Unit database at Shaare Zedek Medical Center, Jerusalem, Israel. The institutional database integrates demographic, clinical, treatment, laboratory, and lyso-Gb1 data from patients with GD. Lyso-Gb1 quantification was performed from dried blood spot (DBS) samples at Centogene GmbH (Rostock, Germany), as previously described [7]. Demographic information was merged with longitudinal treatment records, plasma lyso-Gb1 measurements, and hematologic laboratory values. Laboratory values were matched to lyso-Gb1 measurements within a ±30-day window, and when duplicate laboratory entries were present, standardized values were prioritized. The definitions of mild versus severe genotypes were determined for type 1 GD by N370S (c.1226A > G) homozygous, and N370S/R496H (c.1604G) compound heterozygous genotypes were categorized as “mild”, whereas all other genotypes were categorized as “severe”.
4.2. Definition of Untreated States and Longitudinal Assessment
The study population comprised patients with untreated states, including individuals with a mild phenotype not requiring GD-specific therapy, those who were eventually treated but contributed data prior to treatment initiation, and those with at least 365 days of follow-up after treatment discontinuation without the reinitiation of therapy. Patients were eligible for inclusion in the untreated longitudinal analysis if they had at least two separate visits during untreated states with available lyso-Gb1 measurements. For each patient, baseline was defined as the first untreated lyso-Gb1 measurement, and longitudinal change was assessed between the first and last untreated visits. Given the retrospective nature of this study, the number of measurements and the intervals between visits were not standardized across patients.
The longitudinal change in lyso-Gb1 was calculated as the difference between the last and first untreated measurements. An absolute increase or decrease of at least 50 ng/mL was predefined as the threshold for classifying directional change. Patients were categorized as having a significant decrease, a significant increase, or stable levels within ±50 ng/mL. Changes in hemoglobin were considered clinically meaningful if ≥1 g/dL and changes in platelet count were if ≥50 × 109/L.
4.3. Statistical Analysis
Continuous variables are presented as medians with interquartile ranges (Q1–Q3) and categorical variables as counts and percentages. Comparisons between treated and untreated groups were performed using the Wilcoxon rank-sum test for continuous variables and Pearson’s chi-squared test for categorical variables. The proportions of patients demonstrating significant decreases, increases, or stability in lyso-Gb1 during untreated follow-up were estimated, along with corresponding 95% confidence intervals. Supplementary spaghetti plots were generated for 20 patients in each group. Patients in the stable group were randomly selected, whereas patients in the decline and increase groups were selected from those with absolute net first-to-last lyso-Gb1 changes greater than 100 ng/mL.
For analyses of monitoring intensity during untreated follow-up, differences in the number of lyso-Gb1 measurements per patient and in the interval between the first and last measurements across the decline, stable, and increase groups were assessed using Kruskal–Wallis tests. Pairwise group comparisons for the follow-up interval were performed using Wilcoxon rank-sum tests with Holm adjustment for multiple testing. The same analyses were repeated in the subset of patients with two measurements.
To identify clinical factors associated with longitudinal lyso-Gb1 dynamics, two separate multivariable logistic regression models were constructed: one to model a significant decrease and the other to model a significant increase. Covariates included age (per 5-year increase), sex, genotype severity (mild vs. non-mild), baseline hemoglobin (per g/dL), baseline platelet count (per 50 × 109/L), baseline lyso-Gb1 (per 50 ng/mL), and duration of untreated follow-up (per 1-year increase). Adjusted odds ratios with 95% confidence intervals were reported. All tests were two-sided, and a p-value < 0.05 was considered statistically significant. Statistical analyses were performed using R software (version 4.5.2; R Foundation for Statistical Computing, Vienna, Austria).
5. Conclusions
In this large longitudinal cohort of patients with GD during untreated states, lyso-Gb1 trajectories were heterogeneous rather than consistently progressive. Although increases in lyso-Gb1 were common and linked with markers of higher disease burden, such as lower platelet and hemoglobin levels, in nearly half of the patients, lyso-Gb1 remained stable in the untreated state. A smaller group of patients showed spontaneous declines in lyso-Gb1, indicating that fluctuations can happen even without therapy. Importantly, increases in lyso-Gb1 were often observed without a preceding measurable hematologic decline, supporting its value as an early biomarker of disease activity. These results support using lyso-Gb1 as a sensitive biomarker for monitoring untreated states but highlight that isolated changes should not automatically prompt treatment. Instead, lyso-Gb1 trends should be evaluated alongside clinical assessments, hematologic parameters, and other disease signs. Overall, this study offers real-world insights into lyso-Gb1 variation during untreated states in GD and highlights the importance of longitudinal assessment and individualized clinical interpretation when using this biomarker to inform management decisions.
Supplementary Materials
The following supporting information can be downloaded at https://www.mdpi.com/article/10.3390/ijms27093726/s1.
Author Contributions
Conceptualization, T.D. and S.R.-V.; methodology and formal analysis, S.R.-V.; data curation, T.D., M.B.-C., M.I., D.F., E.S., P.B., S.S., G.K. and C.B.; writing—original draft preparation, T.D. and S.R.-V.; writing—review and editing and supervision, A.Z. All authors have read and agreed to the published version of the manuscript.
Funding
This research received no external funding.
Institutional Review Board Statement
This study was conducted in accordance with the Declaration of Helsinki and approved by the Institutional Review Board of Shaare Zedek Medical Center (protocol code SZMC-0291-18 and date of approval 18 October 2022).
Informed Consent Statement
Patient consent was waived by the institutional review board (IRB) of Shaare Zedek Medical Center, which approved this study and specifically permitted the use and presentation of retrospective, de-identified, aggregated clinical data. Lyso-Gb1 measurements are part of routine clinical assessments for all patients with Gaucher disease followed in the clinic, and no identifiable patient information was used.
Data Availability Statement
Data cannot be shared due to ethical and privacy issues. Access to deidentified data may be considered upon reasonable request, subject to institutional approval and in compliance with ethical and privacy regulations.
Conflicts of Interest
The SZMC Gaucher Unit receives support from Sanofi/Genzyme for participation in the ICGG Registry and from Takeda for the GOS Registry. P.B., S.S., G.K. and C.B. are employees of Centogene GmbH. A.Z. has received honoraria from BioEvents, Pfizer, and Takeda and consulting fees from Takeda. In addition, he founded Agyany Pharma, where he received founder stocks and serves as CMO. S.R.-V. receives grant/research support, honoraria, and advisory fees from Takeda, Pfizer, Sanofi/Genzyme, and Spur. Centogene GmbH had no role in the study design, data analysis, the interpretation of the results, or manuscript preparation, and no commercial promotion is associated with this study. Agyany Pharma was not involved in this study and has no commercial collaboration related to it. T.D., M.B.-C., M.I., D.F. and E.S. have no conflicts of interest to declare.
References
- Stirnemann, J.; Belmatoug, N.; Camou, F.; Serratrice, C.; Froissart, R.; Caillaud, C.; Levade, T.; Astudillo, L.; Serratrice, J.; Brassier, A.; et al. A Review of Gaucher Disease Pathophysiology, Clinical Presentation and Treatments. Int. J. Mol. Sci. 2017, 18, 441. [Google Scholar] [CrossRef] [Scilit]
- Nasce, A.; Nguyen, Y.; Belmatoug, N.; Yousfi, K.; Camou, F.; Pettazzoni, M.; Dalbies, F.; Cador, B.; Brassier, A.; Pichard, S.; et al. Never-Treated, Non Splenectomised Patients with Gaucher Disease (The French GANT Study): The Prospective Follow-up. J. Inherit. Metab. Dis. 2025, 48, e70026. [Google Scholar] [CrossRef] [Scilit]
- Dinur, T.; Zimran, A.; Becker-Cohen, M.; Arkadir, D.; Cozma, C.; Hovakimyan, M.; Oppermann, S.; Demuth, L.; Rolfs, A.; Revel-Vilk, S. Long Term Follow-up of 103 Untreated Adult Patients with Type 1 Gaucher Disease. J. Clin. Med. 2019, 8, 1662. [Google Scholar] [CrossRef] [Scilit]
- Piran, S.; Roberts, A.; Patterson, M.A.; Amato, D. The clinical course of untreated Gaucher disease in 22 patients over 10 years: Hematological and skeletal manifestations. Blood Cells Mol. Dis. 2009, 43, 289–293. [Google Scholar] [CrossRef] [Scilit] [PubMed]
- Carubbi, F.; Linari, S.; Spada, M. Glucosylsphingosine (Lyso-Gb1): An Update on Its Use as a Biomarker in Gaucher Disease. Int. J. Mol. Sci. 2026, 27, 1705. [Google Scholar] [CrossRef] [Scilit]
- Revel-Vilk, S.; Fuller, M.; Zimran, A. Value of Glucosylsphingosine (Lyso-Gb1) as a Biomarker in Gaucher Disease: A Systematic Literature Review. Int. J. Mol. Sci. 2020, 21, 7159. [Google Scholar] [CrossRef] [Scilit]
- Dinur, T.; Bauer, P.; Beetz, C.; Kramp, G.; Cozma, C.; Iurascu, M.I.; Becker-Cohen, M.; Istaiti, M.; Rolfs, A.; Zimran, A.; et al. Gaucher Disease Diagnosis Using Lyso-Gb1 on Dry Blood Spot Samples: Time to Change the Paradigm? Int. J. Mol. Sci. 2022, 23, 1627. [Google Scholar] [CrossRef] [Scilit]
- Rivas, D.V.; Silvestroff, L.; Baffa Trasci, S.; Frabasil, J. Addition of Lyso-Gb1 to enzyme activity to first-tier test for Gaucher in DBS improves diagnostic accuracy and reduces patient recall rate. Clin. Chim. Acta 2026, 578, 120573. [Google Scholar] [CrossRef] [Scilit]
- Zimran, A.; Revel-Vilk, S.; Dinur, T.; Istaiti, M.; Botha, J.; Lukina, E.; Giraldo, P.; Deegan, P.; Dahl, S.V. Evaluation of Lyso-Gb1 as a biomarker for Gaucher disease treatment outcomes using data from the Gaucher Outcome Survey. Orphanet J. Rare Dis. 2025, 20, 43. [Google Scholar] [CrossRef] [Scilit] [PubMed]
- Vernet Machado Bressan Wilke, M.; Iop, G.D.; Faqueti, L.; Lemos da Silva, L.A.; Kubaski, F.; Poswar, F.O.; Michelin-Tirelli, K.; Randon, D.; Borelli, W.V.; Giugliani, R.; et al. A Brazilian Rare-Disease Center’s Experience with Glucosylsphingosine (lyso-Gb1) in Patients with Gaucher Disease: Exploring a Novel Correlation with IgG Levels in Plasma and a Biomarker Measurement in CSF. Int. J. Mol. Sci. 2024, 25, 2870. [Google Scholar] [CrossRef] [Scilit] [PubMed]
- Dubiela, P.; Szymanska-Rozek, P.; Hasinski, P.; Lipinski, P.; Kleinotiene, G.; Giersz, D.; Tylki-Szymanska, A. Long- and Short-Term Glucosphingosine (lyso-Gb1) Dynamics in Gaucher Patients Undergoing Enzyme Replacement Therapy. Biomolecules 2024, 14, 842. [Google Scholar] [CrossRef] [Scilit]
- Peterschmitt, M.J.; Foster, M.C.; Ji, A.J.; Zajdel, M.B.; Cox, G.F. Plasma glucosylsphingosine correlations with baseline disease burden and response to eliglustat in two clinical trials of previously untreated adults with Gaucher disease type 1. Mol. Genet. Metab. 2023, 138, 107527. [Google Scholar] [CrossRef] [Scilit]
- Charkhand, B.; Scantlebury, M.H.; Narita, A.; Zimran, A.; Al-Hertani, W. Effect of Ambroxol chaperone therapy on Glucosylsphingosine (Lyso-Gb1) levels in two Canadian patients with type 3 Gaucher disease. Mol. Genet. Metab. Rep. 2019, 20, 100476. [Google Scholar] [CrossRef] [Scilit] [PubMed]
- Cheung, C.; Fierro, L.; McDonough, C.; Stauffer, C.; Kaplan, R.; Bier, L.; Yu, C.; Evard, R.; Ganesh, J.; Balwani, M. Correlation of Plasma Lyso-GL1 Levels with Clinical Phenotype and Treatment Decisions in Patients with Gaucher Disease. Mol. Genet. Metab. 2025, 146, 109286. [Google Scholar] [CrossRef] [Scilit]
- Dinur, T.; Bauer, P.; Beetz, C.; Cozma, C.; Becker-Cohen, M.; Istaiti, M.; Rolfs, A.; Skrahina, V.; Zimran, A.; Revel-Vilk, S. Contribution of Glucosylsphingosine (Lyso-Gb1) to Treatment Decisions in Patients with Gaucher Disease. Int. J. Mol. Sci. 2023, 24, 3945. [Google Scholar] [CrossRef] [Scilit] [PubMed]
- Hurvitz, N.; Dinur, T.; Becker-Cohen, M.; Cozma, C.; Hovakimyan, M.; Oppermann, S.; Demuth, L.; Rolfs, A.; Abramov, A.; Zimran, A.; et al. Glucosylsphingosine (lyso-Gb1) as a Biomarker for Monitoring Treated and Untreated Children with Gaucher Disease. Int. J. Mol. Sci. 2019, 20, 3033. [Google Scholar] [CrossRef] [Scilit] [PubMed]
- Rossi, C.; Trotta, D.; Ferrante, R.; Pieragostino, D.; Valentinuzzi, S.; Federici, L.; Stuppia, L.; De Laurenzi, V.; Aricò, M. Prospective Monitoring of Lyso-Gb1 on DBS Sample in Three Children Recognized at Newborn Screening for Gaucher Disease and Untreated. Children 2025, 12, 350. [Google Scholar] [CrossRef] [Scilit]
- Giuffrida, G.; Markovic, U.; Condorelli, A.; Calafiore, V.; Nicolosi, D.; Calagna, M.; Grasso, S.; Ragusa, M.T.V.; Gentile, J.; Napolitano, M. Glucosylsphingosine (Lyso-Gb1) as a reliable biomarker in Gaucher disease: A narrative review. Orphanet J. Rare Dis. 2023, 18, 27. [Google Scholar] [CrossRef] [Scilit]
- D’Amore, S.; Patel, S.; Cooke, J.; Ramaswami, U. Gaucher Disease-Correlation of Lyso-Gb1 with Haematology and Biochemical Parameters. Metabolites 2025, 15, 731. [Google Scholar] [CrossRef] [Scilit]
- Camou, F.; Serratrice, C.; Pettazzoni, M.; Nadjar, Y.; Brassier, A.; Bekri, S.; Cador-Rousseau, B.; Dagneaux, L.; Dalbiès, F.; Froissart, R.; et al. French national diagnosis and care protocol (Protocole National De Diagnostic et de Soins; PNDS): Gaucher disease. Orphanet J. Rare Dis. 2025, 20, 542. [Google Scholar] [CrossRef] [Scilit]
- Puri, R.; Kapoor, S.; Kishnani, P.; Dalal, A.; Gupta, N.; Muranjan, M.; Phadke, S.; Sachdeva, A.; Verma, I.; Mistry, P.; et al. Diagnosis and Management of Gaucher Disease in India–Consensus Guidelines of the Gaucher Disease Task Force of the Society for Indian Academy of Medical Genetics and the Indian Academy of Pediatrics. Indian Pediatr. 2018, 55, 143–153. [Google Scholar] [CrossRef] [Scilit]
- Weinreb, N.J.; Goker-Alpan, O.; Kishnani, P.S.; Longo, N.; Burrow, T.A.; Bernat, J.A.; Gupta, P.; Henderson, N.; Pedro, H.; Prada, C.E.; et al. The diagnosis and management of Gaucher disease in pediatric patients: Where do we go from here? Mol. Genet. Metab. 2022, 136, 4–21. [Google Scholar] [CrossRef] [Scilit] [PubMed]
- Cozma, C.; Cullufi, P.; Kramp, G.; Hovakimyan, M.; Velmishi, V.; Gjikopulli, A.; Tomori, S.; Fischer, S.; Oppermann, S.; Grittner, U.; et al. Treatment Efficiency in Gaucher Patients Can Reliably Be Monitored by Quantification of Lyso-Gb1 Concentrations in Dried Blood Spots. Int. J. Mol. Sci. 2020, 21, 4577. [Google Scholar] [CrossRef] [Scilit] [PubMed]
- Muilwijk, M.; Callender, N.; Goorden, S.; Vaz, F.M.; van Valkengoed, I.G.M. Sex differences in the association of sphingolipids with age in Dutch and South-Asian Surinamese living in Amsterdam, the Netherlands. Biol. Sex Differ. 2021, 12, 13. [Google Scholar] [CrossRef] [Scilit]
- Ivanova, M.M.; Dao, J.; Friedman, A.; Kasaci, N.; Goker-Alpan, O. Sex Differences in Circulating Inflammatory, Immune, and Tissue Growth Markers Associated with Fabry Disease-Related Cardiomyopathy. Cells 2025, 14, 322. [Google Scholar] [CrossRef] [Scilit] [PubMed]
- Akyuz, A.; Emecen Sanli, M.; Aktasoglu, E.O.; Gokalp, S.; Biberoglu, G.; Inci, A.; Okur, I.; Ezgu, F.S.; Tumer, L. Markers of Inflammation and Autoinflammation in Patients with Gaucher Disease: A Single-Center Observational Study. Clin. Pediatr. 2026, 65, 208–215. [Google Scholar] [CrossRef] [Scilit]
- Barnett, A.G.; van der Pols, J.C.; Dobson, A.J. Regression to the mean: What it is and how to deal with it. Int. J. Epidemiol. 2004, 34, 215–220. [Google Scholar] [CrossRef] [Scilit]

Disclaimer/Publisher’s Note: The statements, opinions and data contained in all publications are solely those of the individual author(s) and contributor(s) and not of MDPI and/or the editor(s). MDPI and/or the editor(s) disclaim responsibility for any injury to people or property resulting from any ideas, methods, instructions or products referred to in the content. |
© 2026 by the authors. Licensee MDPI, Basel, Switzerland. This article is an open access article distributed under the terms and conditions of the Creative Commons Attribution (CC BY) license.