


Abstract
Branch number is an important agronomic trait that determines the number of siliques per plant and yield in rapeseed (Brassica napus). However, the complex genetic and molecular mechanisms regulating the formation of branch number in rapeseed remain unclear. In a previous study, we isolated an EMS-induced multi-branching mutant (mbm1). Here, agronomic trait analysis showed that the mbm1 mutant produced more effective primary branches, total silique number, and yield per plant compared with the wild type. Genetic analysis indicated that the multi-branching trait of the mbm1 mutant is controlled by incompletely dominant gene(s) and follows nuclear inheritance. As a result of combined BSA-seq-based mapping and RNA-seq profiling, two candidate genes, BnaC03G0462000ZS (BnaC03.GAE6) and BnaC03G0491900ZS (BnaC03.MEE14), were identified based on sequence variation and expression differences. KASP marker analysis confirmed that there are significant associations between these two gene loci and the multi-branching trait. Hybrid progeny derived from crosses between the mbm1 mutant and commercial cultivars L329 and ZS11 showed significantly improved yield due to increased effective branch number. Together, these results provide important genetic resources and a theoretical foundation for further elucidating the genetic regulatory network of branching in rapeseed and for developing high-yielding rapeseed varieties with ideal plant architecture.
1. Introduction
Rapeseed (Brassica napus) is a globally important oil crop with substantial value for both human consumption and animal feed [1]. Yield per unit area in rapeseed is largely determined by individual plant productivity, which is directly influenced by three key components: thousand-seed weight, seeds per silique, and siliques per plant [2]. Among these, siliques per plant is often considered the most significant contributor to yield in most genetic backgrounds, though this cannot be generalized to all backgrounds. However, as a complex trait, it is highly susceptible to environmental variation and remains challenging to target directly for genetic improvement. In contrast, branch number represents a more stable trait across different environments, and it can effectively regulate siliques per plant, thereby affecting yield [3]. Various studies have indicated that there is a significant positive correlation between rapeseed yield and the number of effective branches [4]. In particular, the number of primary effective branches has been shown to exert the strongest effect on yield. Optimizing the structure and number of primary effective branches under varying planting densities can enhance silique number per plant and ultimately improve yield [5].
Given the important role played by the primary effective branch number in rapeseed yield formation, researchers have conducted extensive studies on this trait [6]. For instance, Shah et al. (2018) demonstrated that a mutation in the termination codon of the K domain of Bna.AP1.A02 alters the expression of downstream target genes such as Bna.TFL1 and Bna.FUL in the shoot apical meristem (SAM) of rapeseed, thereby significantly affecting plant architecture-related traits, including flower morphology, plant height, and branch number [7]. Zheng et al. identified two homologs of MORE AXILLARY GROWTH 1 (MAX1), namely BnaA03g22900D and BnaC03g26960D, in the rapeseed genome using sequence alignment. Targeted mutagenesis of these genes via CRISPR/Cas9 led to a multi-branching phenotype in the resulting mutant plants [8]. The Bna.TFL1 gene is present in five copies located on chromosomes A02, A10, C02, C03, and C09, corresponding to the loci BnaA02G0014100ZS, BnaA10G0288700ZS, BnaC02G0013900ZS, BnaC03G0016500ZS, and BnaC09G0608000ZS. Individual knockout of these five genes revealed that the branch number of the BnaC09G0608000ZS single mutant was not significantly different from that of the wild-type. In contrast, the other four single mutants all exhibited reduced branch numbers compared with the wild-type [9]. Overexpression of FATTY ACID EXPORT 6 (BnFAX6) in transgenic plants promoted axillary bud development into lateral branches, raising the number of effective branches by about 109.8–114.8% [10]. There are five BRANCHED1 (BRC1) genes in rapeseed, including BnaA01.BRC1, BnaC01.BRC1, BnaA03.BRC1, BnaC03.BRC1, and BnaC05.BRC1. These genes are predominantly expressed in leaf axils. Simultaneous knockout of BnaA01.BRC1, BnaC01.BRC1, BnaA03.BRC1, and BnaC03.BRC1 leads to excessive branching [11]. Furthermore, knocking out all five Bna.BRC1 genes produces a highly branched plant architecture in rapeseed [12]. Recently, the gene SHOOT APICAL MERISTEM ENLARGER1 (SAME1) was cloned and shown to promote primary branch number and silique number on the main inflorescence. The elevated expression of SAME1 represses the expression of BnaC06.ARR15 and expands the expression domain of BnaA09.WUS, leading to an enlarged SAM and, consequently, increased branch and silique number on the main inflorescence [13]. Whether additional genes are involved in the regulation of rapeseed branch number beyond the known TFL1, BRC1, and SAME1 pathways remains to be further explored.
We previously isolated a multi-branching mutant, mbm1, in rapeseed through ethyl methanesulfonate (EMS) mutagenesis [14]. In this study, we performed an integrated analysis of the agronomic traits and genetics of the mbm1 mutant. Using bulked segregant analysis sequencing (BSA-seq), RNA sequencing (RNA-seq), and KASP marker assays, we identified BnaC03G0491900ZS (BnaC03M.EE14) and BnaC03G0462000ZS (BnaC03.GAE6) as the candidate genes underlying its phenotype. Analysis of the agronomic traits in F1 hybrid combinations of mbm1 with commercial rapeseed cultivars L329 and ZS11 demonstrated the potential application of mbm1 in rapeseed breeding. The results of this study constitute important genetic resources and theoretical foundations for breeding new high-yielding rapeseed hybrids with appropriate branching architecture.
2. Results
2.1. The mbm1 Mutant Exhibited Increased Branch Number, Total Silique Number, and Yield per Plant
The mbm1 mutant was isolated from the polima cytoplasmic male sterility (CMS) maintainer line 2B following EMS mutagenesis [14]. Axillary buds and vegetative branches became visible in mbm1 plants around the nine-leaf stage (Figure 1a). At both the full-flowering and maturity stages, mbm1 developed significantly more branches than the wild-type parent 2B (WT) (Figure 1b,c). At the maturity stage, the number of primary effective branches in mbm1 was 17.8 ± 1.62, more than double that of the WT (8.7 ± 1.42) (Figure 1d, Table S1). Analysis of other agronomic traits showed that the plant height of mbm1 was significantly reduced compared with the WT (Figure 1e, Table S1). The mutant flowered slightly earlier and had a somewhat shorter growth period (Figure S1a,b). Silique length was also slightly shorter relative to the WT (Figure S1c,d, Table S1). Total silique number was significantly higher in mbm1, approximately 1.5 times that of the WT (Figure 1f, Table S1). No significant difference was observed in seeds per silique (Figure 1g, Table S1), whereas thousand-seed weight was lower in the mutant than in the WT (Figure 1h, Table S1). Ultimately, yield per plant was significantly increased in mbm1, at about 1.2 times that of the WT (Figure 1i, Table S1). Together, these results demonstrate that the mbm1 mutant exhibits a marked increase in branch number and total silique number, resulting in higher yield per plant.
Figure 1.
Phenotypic characteristics of the mutant mbm1 and the wild-type (WT) plants. (a,b) Plant phenotypes at the seedling (a) and full-flowering (b) stages, the red arrow in (a) indicates the position of the basal axillary bud. (c) Phenotype of plants at the maturity stage. (d–i) Agronomic traits of mbm1 and WT at the maturity stage, including branch number (BN) (d), plant height (PH) (e), total number of siliques (TNS) (f), number of seeds per silique (NSPS) (g), thousand-seed weight (TSW) (h), and yield per plant (YPP) (i). All values are presented as mean ± standard deviation (n = 10). Significant differences were determined by Student’s t-test. The unbracketed letters a and b are significantly different (p < 0.05). Scale bar = 5 cm.
2.2. Genetic Characteristics of the Branch Number Trait in the mbm1 Mutant
To investigate the genetic basis of the increased branch number in the mbm1 mutant, reciprocal crosses were performed between mbm1 and wild-type (WT) plants, and branch number was assessed in the resulting F1 progeny. No significant difference in branching was observed between F1 plants from WT × mbm1 and those from mbm1 × WT crosses. However, the branch number in both F1 populations was significantly higher than that in the WT parent, yet it was lower than that in the mbm1 mutant, exhibiting an intermediate phenotype (Figure 2a,d and Figure S2a). These results indicate that the multi-branching trait in mbm1 is governed by incompletely dominant nuclear gene(s) and is not affected by cytoplasmic factors.
Figure 2.
Branch phenotypes of the F1 hybrids and the F2 generations. (a–c) Phenotypes of reciprocal F1 hybrids between mbm1 and WT (a), ZS11 (b), and L329 (c) at the maturity stage. (d–f) Branch number in reciprocal F1 hybrids between mbm1 and WT (d), ZS11 (e), and L329 (f). Data are presented as mean ± SD (n = 18). Any two of the unbracketed letters a, b and c are significantly different (p < 0.05, Tukey’s test). (g,h) Frequency distribution of branch number in the F2 populations derived from crosses between mbm1 and ZS11 ((g); 632 plants) and between mbm1 and L329 ((h); 774 plants). Scale bar = 10 cm. BN: branch number.
To further verify this genetic model, we performed reciprocal crosses between mbm1 and the commercial cultivars ZS11 and L329. The resulting F1 hybrids—ZS11×mbm1, mbm1×ZS11, L329×mbm1, and mbm1×L329—were evaluated for branch number. Statistical analysis showed that the F1 plants from ZS11×mbm1 and mbm1×ZS11 had approximately 10.00 and 9.83 branches, respectively, numbers that are significantly lower than those of mbm1 (~21.72). Although a statistically significant difference in branch number was observed between the F1 progeny and ZS11, the branch numbers in the F1 progeny were biased toward that of ZS11 (~7.44) (Figure 2b,e, Figure S2b, Table S2). Similarly, the F1 progeny from reciprocal crosses between L329 and mbm1 (L329×mbm1 and mbm1×L329) produced significantly fewer branches than the mbm1 parent, with averages of approximately 10.06 and 10.94 branches, respectively. Although a statistically significant difference in branch number was observed between the F1 progeny and L329, the F1 progeny exhibited a branch number phenotype similar to that of L329 (~8) (Figure 2c,f, Figure S2c, Table S2). Taken together, these results further support that the multi-branching trait in mbm1 exhibits incomplete dominance and follows nuclear inheritance.
To determine whether the multi-branching trait in mbm1 is quantitative or qualitative, we statistically analyzed the branching phenotypes in F2 segregating populations derived from F1 hybrids of ZS11×mbm1 and L329×mbm1. In the ZS11×mbm1 F2 population, the branch numbers from 632 individual plants showed a continuous distribution, with a small proportion exhibiting transgressive segregation phenotypes (Figure 2g). The Kolmogorov–Smirnov test for normality applied to the branching trait yielded a p-value of 0.000 (<0.05), indicating a significant deviation from normal distribution. Similarly, in the L329×mbm1 F2 population, branch numbers from 774 individual plants also displayed a continuous distribution along with transgressive segregation in a subset of plants (Figure 2h). The branching trait in this population similarly deviated significantly from a normal distribution (p = 0.000). This non-normal distribution suggests that the trait fits a major gene plus polygene genetic model. These results demonstrate that the multi-branching trait of the mbm1 mutant is a quantitative trait, and it follows a nuclear inheritance pattern.
2.3. Genetic Mapping of Multi-Branching Trait in mbm1 Using BSA-Seq
To map the genes associated with the multi-branching trait in mbm1, we performed BSA-seq analysis using an F2 population derived from F1 of L329×mbm1. From the F2 population, 50 high-branching plants (with 12 or more branches) and 50 low-branching plants (with 3–5 branches) were selected to form the high-branching number bulk (HB) and low-branching number bulk (LB), respectively. Sequencing was conducted on the HB and LB and the parental lines L329 and mbm1. After quality control filtering, a total of approximately 151.73 Gb of data was obtained, with HB, LB, L329, and mbm1 contributing 53.90 Gb, 46.98 Gb, 24.63 Gb, and 26.22 Gb, respectively, corresponding to coverage depths of 53.9×, 46.98×, 24.63×, and 26.22× (Table S3). The average Q30 and Q20 values reached 98.10% and 93.95%, and the average GC content was 36.59% (Table S3). Through ensuring alignment with the ZS11 reference genome and using the GVCFtyper algorithm for joint variant calling across multiple samples, a total of 5,186,556 single nucleotide polymorphisms (SNPs) were identified.
Using the Euclidean Distance (ED) method to perform an association analysis of the target trait, SNPs with genotypic differences were utilized to calculate the read depth of each nucleotide in the HB and LB, and the ED value for each SNP was computed. The ED4 was then used as the association value to reduce background noise. Finally, local linear regression (LOESS) was applied to fit the ED4 values. Intervals where the ED value exceeded the threshold line (0.0187) were considered to be candidate regions associated with the target trait. The results showed that intervals exceeding the threshold were located on chromosomes C01, C03, C07, and C08, with the highest ED value and the longest interval observed on chromosome C03 (Figure 3a), suggesting that these candidate regions may be associated with the target trait. Based on this, further analysis was conducted on the intervals significantly associated with the target trait. On chromosome C01, five significantly associated intervals (referred to as ED-C01) were detected, with a total length of approximately 0.38 Mb. On chromosome C03, 30 significantly associated intervals (referred to as ED-C03) were detected, with a total length of approximately 7.53 Mb. On chromosome C07, 18 significantly associated intervals (referred to as ED-C07) were detected, with a total length of approximately 1.94 Mb. On chromosome C08, three significantly associated intervals (referred to as ED-C08) were detected, with a total length of approximately 0.14 Mb (Table S4).
Figure 3.
Mapping of the mbm1 mutant using bulk segregant analysis coupled with resequencing. (a) Mapping interval identified by Euclidean distance (ED) analysis across chromosomes. The Y-axis represents the local weighted linear regression (LOESS)-fitted ED4 value, and the X-axis indicates the physical position along each chromosome. The red line corresponds to the threshold, calculated as 3 × (standard deviation of fitted values) + median of fitted values, where “fitted values” were derived from applying LOESS to the ED4 dataset. (b) Mapping interval based on Δ(SNP-index) distribution across chromosomes. The Y-axis shows Δ(SNP-index), and the X-axis denotes the physical position on chromosomes. The inner and outer red lines indicate the 95% and 99% confidence level thresholds, respectively.
Next, we conducted association analysis for the target trait using the Δ(SNP-index) method. Following filtering based on missing rate and sequencing depth, a total of 1,700,738 high-confidence SNP markers were obtained. Two significantly associated Δ(SNP-index) intervals were identified, located on chromosomes A10 and C03. The interval on chromosome C03 spanned approximately 0.60 Mb, while that on chromosome A10 covered about 0.20 Mb (Figure 3b). Comparison of the significant Δ(SNP-index) interval on chromosome C03 with the above-defined ED-C03 interval revealed that one ΔSNP-index interval fell entirely within the ED-C03 region. This interval, designated ES-C03, is located at 35,524,886–36,127,337 bp on chromosome C03 and has a length of 602,451 bp (Table S5). A total of 11 SNPs were screened (Table S6). In parallel, we screened SNPs from other ED significant association intervals outside ES-C03 that exhibited pronounced SNP-index differences (|ΔSNP-index| > 0.5, p < 0.05), as described previously [15,16]. We identified 5 SNPs from ED-C03 and 24 SNPs from ED-C07, while no SNPs were found in ED-C08 or ED-C01 (Table S7). In total, 40 candidate SNPs were selected from all target trait association intervals. These SNPs will be utilized for further identification of candidate genes underlying the multi-branching trait in mbm1.
2.4. Identification of Differentially Expressed Genes in Axillary Buds Between mbm1 and WT Using RNA-Seq
To further investigate the genetic and molecular mechanisms underlying the multi-branching phenotype of mbm1, we conducted RNA-seq analysis using axillary buds from mbm1 and WT plants. A total of 18,295 significantly differentially expressed genes (DEGs) (q ≤ 0.05, |log2FoldChange| ≥ 1) were identified, with 9469 genes upregulated and 8826 downregulated in the mbm1 mutant compared with the WT (Figure 4a, Tables S8 and S9). The KEGG pathway analysis revealed that the DEGs were predominantly associated with metabolic processes, particularly those related to carbohydrate and sugar metabolism, including carbon fixation in photosynthetic organisms (65 DEGs), starch and sucrose metabolism (31 DEGs), the pentose phosphate pathway (23 DEGs), glycolysis/gluconeogenesis (22 DEGs), and amino sugar and nucleotide sugar metabolism (19 DEGs) (Figure 4b, Table S10). The GO functional enrichment analysis further highlighted significant enrichment in terms such as response to light stimulus (262 DEGs), carbohydrate metabolic process (165 DEGs), the reductive pentose-phosphate cycle (69 DEGs), shoot system development (61 DEGs), secondary shoot formation (31 DEGs), post-embryonic plant morphogenesis (22 DEGs), chlorophyll binding (63 DEGs), beta-glucosidase activity (32 DEGs), and polygalacturonase activity (29 DEGs) (Figure 4c, Table S11). Taken together, the KEGG and GO enrichment analyses suggest that alterations in carbohydrate and sugar metabolism pathways may underpin the multi-branching trait in mbm1, providing a potential mechanistic basis for axillary bud outgrowth.
Figure 4.
Differentially expressed genes in axillary buds in mbm1 versus WT. (a) Volcano plot of all significantly differentially expressed genes (DEGs) in mbm1 versus WT. DEGs were screened using the following criteria: upregulated genes with q ≤ 0.05 and log2FoldChange ≥ 1, and downregulated genes with q ≤ 0.05 and log2FoldChange ≤ −1. (b) KEGG pathway enrichment analysis displaying the top 30 significantly enriched terms for DEGs in mbm1 versus WT. (c) GO functional enrichment analysis showing the top 30 significantly enriched terms for DEGs in mbm1 versus WT. (d) Clustering heatmap of a subset of significant DEGs. Labels on the left correspond to rapeseed gene IDs, while labels on the right indicate their homologous genes in Arabidopsis. (e–l) mRNA levels of the indicated genes in axillary buds of mbm1 and WT. The gene expression was normalized to BnaACTIN7 expression. Bars represent the standard deviations of three independent experiments. Error bars indicate SD, n = 3. Statistically significant differences are shown: *** p < 0.001, **** p < 0.0001 (Student’s t-test). ns: no significant differences.
Sugars act as an energy source, and it is well-known that they promote bud outgrowth in many species [17]. Therefore, we focused on identifying differentially expressed genes associated with sugar metabolism. Our analysis revealed that the expression of five SUCROSE-PROTON SYMPORTER 1 (SUC1) and four SUC2 genes, which encode a key sucrose transporter [18], as well as four SUGARS WILL EVENTUALLY BE EXPORTED TRANSPORTERS (SWEET12) genes, encoding sucrose efflux transporters [19], and one TREHALOSE-PHOSPHATE PHOSPHATASE A (TPPA) gene, involved in trehalose-6-phosphate (Tre6P) metabolism [20], was significantly upregulated in mbm1 (Figure 4d). Several studies have shown that inhibiting sucrose non-fermenting-related kinase (SnRK1) is essential to activating biosynthetic pathways in growing tissues in response to sucrose availability [21]. In line with this, we observed that the expression of KIN10 and KIN11, encoding catalytic α-subunits of SnRK1 [22], was markedly downregulated in the mbm1 mutant (Figure 4d). Furthermore, the transcript levels of five BRC1 genes, which act as key negative regulators of branching [23], were also significantly reduced in the mbm1 mutant (Figure 4d). To validate these findings, we selected eight genes to be the subjects of quantitative reverse-transcription PCR (qRT-PCR) analysis. Consistent with the RNA-seq data, the expression of BnaA07G0261900ZS (BnaA07.SUC1), BnaA07G0121100ZS (BnaA07.SUC2), BnaA06G0322900ZS (BnaA06.SWEET12), and BnaA10G0086300ZS (BnaA10.TPPA) was increased in the axillary buds of mbm1 compared with the wild type (Figure 4e–h). In contrast, the expression of BnaC01G0497200ZS (BnaC01.KIN10), BnaA06G0322900ZS (BnaA06.KIN11), and BnaC03G0429200ZS (BnaC03.BRC1) was decreased (Figure 4i–k). No expression difference was observed for the negative control gene BnaC02G0228800ZS (Figure 4l). Taken together, these results indicate that the expression of genes related to sugar metabolism is altered in the mbm1 mutant.
To determine whether the transcriptional changes in sugar-related genes led to altered sugar levels in mbm1, we quantified sucrose and trehalose in axillary buds. Both sugars were significantly elevated in mbm1 compared with the wild type (Figure 5). Together, these results suggest that enhanced sugar accumulation in axillary buds likely contributes to the multi-branching phenotype of mbm1.
Figure 5.
Sucrose and trehalose contents increased in the axillary buds of the mbm1 mutant. Sucrose (a) and trehalose (b) contents in axillary buds of mbm1 and WT plants. Both WT and mbm1 mutant plants were cultivated in soil for two months. Axillary bud samples were then collected from individual plants, with three buds taken from each plant along the stem from the base to the upper region for measurement of sucrose and trehalose levels. Error bars indicate SD, n = 3. Statistically significant differences are shown: **** p < 0.0001 (Student’s t-test).
2.5. Association Analysis of BSA-seq and RNA-seq Data to Identify Candidate Genes Related to the Multi-Branching Trait in mbm1 Mutant
To further identify candidate genes associated with the multi-branching trait, we performed an integrative analysis combining the genes linked to the 40 SNPs identified through BSA-seq (Tables S6 and S7) and the DEGs from RNA-seq data (Tables S8 and S9). Among the genes associated with the 40 SNPs, 13 exhibited significant expression differences between mbm1 and the wild type. Of these, two were located within the ED-C03 interval, one in the ES-C03 interval, and ten in the ED-C07 interval (Table S12). We then analyzed the expression levels of these 13 candidate genes in axillary buds. Four genes, namely BnaC03G0501200ZS, BnaC07G0434100ZS, BnaC07G0437300ZS, and BnaC07G0451100ZS, showed very low expression levels, with the Transcripts Per Million (TPM) values all being below 1 (Table S8). Therefore, these four candidate genes were excluded from further consideration. Subsequent in-depth analysis was focused on the remaining nine candidate genes: BnaC07G0419600ZS, BnaC07G0436500ZS, BnaC07G0437400ZS, BnaC07G0409100ZS, BnaC07G0411200ZS, BnaC07G0419000ZS, BnaC07G0436900ZS, BnaC03G0462000ZS, and BnaC03G0491900ZS.
Homologous gene functional annotation showed that BnaC07G0419600ZS has an Arabidopsis ortholog, eIF4E1, encoding eukaryotic translation initiation factor 4E1. This factor has been reported to regulate the nitrate signaling pathway and modulate nitrate uptake and metabolism [24]. BnaC07G0436500ZS corresponds to the cysteine-rich receptor-like kinase CRK29 in Arabidopsis, which, together with CRK28, is involved in mediating the immune responses associated with cell death [25,26]. The ortholog of BnaC07G0437400ZS, AT4G21650, belongs to the Subtilase (SBT) family and encodes a subtilisin-like serine protease; however, its specific function remains uncharacterized (https://yanglab.hzau.edu.cn/BnTIR (accessed on 14 July 2025)). BnaC07G0409100ZS is orthologous to Arabidopsis INOSITOL TRANSPORTER 4 (INT4), encoding a high-affinity H+:myo-inositol symporter [27]. BnaC07G0411200ZS corresponds to AT4G16650, a potential gene for cell cycle regulation [28]. BnaC07G0419000ZS corresponds to ALUMINUM-ACTIVATED MALATE TRANSPORTER 12 (ALMT12), an R-type anion channel that mediates stomatal closure [29]. BnaC07G0436900ZS is orthologous to CHLORORESPIRATORY REDUCTION 9 (CRR9), which encodes a conserved chloroplast stromal protein [30]. Whether these seven genes are involved in the regulation of branching has not been reported.
BnaC03G0462000ZS is orthologous to Arabidopsis UDP-D-GLUCURONATE 4-EPIMERASE 6 (GAE6), a key enzyme in pectin biosynthesis that converts UDP-glucuronic acid to UDP-galacturonic acid [31]. Pectin is a fundamental component of the primary cell wall, and its abundance directly influences wall integrity and mechanical behavior [32]. Loss of GAE6 function has been shown to reduce pectin content, compromising cell wall integrity and leading to fragile leaves [33], whereas its upregulation enhances pectin precursor synthesis and increases pectin content [34]. The mechanical properties of the cell wall are modulated by the methylation and polymerization states of pectin, particularly of homogalacturonan (HG) [35]. HG can form nanofilaments that transition from crystalline to expanded conformations upon demethylation, a process that facilitates cell expansion by altering wall extensibility [36]. Changes in cell wall architecture are known to affect its permeability, which is critical for the intercellular transport of solutes such as sugars [37]. In our study, we observed significantly elevated levels of sucrose and trehalose in the axillary buds of the mbm1 mutant (Figure 5), suggesting altered sugar accumulation or transport dynamics. Given the established role of GAE6 in pectin metabolism, the documented impact of pectin on cell wall permeability, and the known influence of sugar availability on axillary bud outgrowth, we propose that BnaC03.GAE6 may affect sugar transport efficiency by modulating cell wall mechanical properties, thereby contributing to branch formation. While direct mechanistic evidence is yet to be elucidated, this hypothesis is grounded in a logical chain of supported connections from pectin biosynthesis to cell wall function and sugar transport.
BnaC03G0491900ZS is orthologous to MATERNAL EFFECT EMBRYO ARREST 14 (MEE14), which is expressed in the female gametophyte and required for early embryo development [38,39]. MEE14 has been shown to co-localize with dormancy-related miRNAs, suggesting that it plays a potential role in seed dormancy regulation [40]. Functional studies in pecan indicate its involvement in female gametophyte development [41]. More recently, MEE14 was found to possess adenylate cyclase activity, enabling cAMP production and implicating it in embryo development and abiotic stress responses [42]. Notably, its upregulation in rapeseed roots under hypoxia conditions points to it playing a possible role in energy metabolism [43]. Based on its expression patterns under energy-related stress, we hypothesize that BnaC03.MEE14 may contribute to branching regulation, potentially through modulating energy metabolism.
Based on the functions or expression patterns of their Arabidopsis orthologs, we prioritized BnaC03.GAE6 and BnaC03.MEE14 for further validation. We developed kompetitive allele-specific PCR (KASP) markers for the candidate SNPs in these two genes (Table S13). Using the KASP-BnaC03.GAE6 marker on 273 F2 plants derived from a cross between L329 and mbm1, we identified 69 wild-type (C:C), 142 heterozygous (C:T), and 62 mutant genotypes (T:T), with significant differences in branch number among genotypes (Figure 6a,b). Similarly, genotyping 317 F2 plants with the KASP-BnaC03.MEE14 marker revealed 86 wild-type (C:C), 147 heterozygous (C:T), and 84 mutant plants (T:T), again showing significant variation in branch number (Figure 6c,d). These results indicate that these loci are significantly associated with the target trait and show cosegregation.
Figure 6.
Genotyping of KASP markers KASP-BnC03.GAE6 and KASP- BnC03.MEE14 in the F2 population. (a) Scatter plot of genotyping for the KASP-BnC03.GAE6 marker in the F2 population from L329 × mbm1. (b) Genotyping of the KASP-BnC03.GAE6 marker and the corresponding branch numbers in the F2 population from L329 × mbm1. (c) Scatter plot of genotyping for the KASP-BnC03.MEE14 marker in the F2 population from L329 × mbm1. (d) Genotyping of the KASP-BnC03.MEE14 marker and the corresponding branch numbers in the F2 population from L329 × mbm1. Blue and red dots in (a,c) correspond to homozygous alleles, purple dots represent heterozygous alleles, and black dots indicate negative controls. Data in panels (b,d) are presented as mean ± standard deviation (SD). Significant differences were determined using Fisher’s LSD test (* p < 0.05, ** p < 0.01, *** p < 0.001, **** p < 0.0001).
The SNP in BnaC03.GAE6 is a G-to-A mutation located 2907 bp upstream of the transcription start site (Figure 7a; Table S14), while that in BnaC03.MEE14 is a C-to-T mutation 1327 bp downstream of the transcription end site (Figure 7b; Table S14). RNA-seq analysis showed that both genes were upregulated in mbm1 axillary buds compared with the wild type (Figure 7c; Table S8), which was confirmed by qRT-PCR (Figure 7d,e). Taken together, these results suggest that BnaC03.MEE14 and BnaC03.GAE6 are candidate genes underlying the multi-branching phenotype of the mbm1 mutant.
Figure 7.
Gene structure and expression for candidate genes BnaC03G0462000ZS (BnaC03.GAE6) and BnaC03G0462000ZS (BnaC03.MEE14) associated with the multi-branching trait in mbm1. (a,b) Gene structures and mutation sites of BnaC03G0462000ZS (BnC03.GAE6) (a) and BnaC03G0462000ZS (BnC03.MEE14).The red letters indicate the mutated bases. (b). Exons and introns are represented by black boxes and lines, respectively. (c) Heatmap showing the expression levels of BnC03.GAE6 and BnC03.MEE14 in axillary buds of mbm1 and WT. (d,e) qRT-PCR analysis of expression levels for BnC03.GAE6 (d) and BnC03.MEE14 (e) in axillary buds of mbm1 and WT. The gene expression was normalized to BnaACTIN7 expression. Bars represent the standard deviations of three independent experiments. Error bars indicate SD, n = 3. Statistically significant differences are shown: *** p < 0.001 (Student’s t-test). (f) Proposed regulatory model for multi-branching trait in the mbm1 mutant. Dash lines indicate indirect regulation, solid lines represent direct regulation, red arrows indicate an increase or decrease, and boxes show rapeseed homologs of Arabidopsis genes: MEE14 (MATERNAL EFFECT EMBRYO ARREST 14), GAE6 (UDP-D-GLUCURONATE 4-EPIMERASE 6), SUC (SUCROSE-PROTON SYMPORTER 1 and 2), SWEET12 (SUGARS WILL EVENTUALLY BE EXPORTED TRANSPORTERS), and BRC1 (BRANCHED1).
2.6. Potential Application of the Multi-Branching Mutant mbm1 in Breeding
The mbm1 mutant displays superior agronomic performance, characterized by increased branch number, higher total silique number, and enhanced yield per plant (Figure 1; Table S1). To assess its breeding potential, we statistically analyzed agronomic traits in the F1 generation derived from crosses between mbm1 and the cultivars ZS11 and L329 (Figure 2e,f, Figures S3 and S4; Table S2). In terms of total silique number, the F1 generation, although lower than that of mbm1, was significantly higher than that of ZS11 and L329 (Figures S3c and S4c; Table S2). Regarding seeds per silique, the F1 from ZS11 × mbm1 was comparable to ZS11 and superior to mbm1, while the F1 from L329 × mbm1 significantly exceeded the better parent, demonstrating obvious heterosis (Figures S3d and S4d; Table S2). For thousand-seed weight, the F1 generations of both ZS11 × mbm1 and L329 × mbm1 surpassed both parents, indicating a positive improvement trend (Figures S3e and S4e; Table S2). In terms of yield per plant, F1 yield was significantly higher than that of the commercial parents (Figures S3f and S4f; Table S2). These results demonstrate that mbm1 can stably transmit its high-yield traits to hybrids, enabling F1 generation to achieve yield levels comparable to the high-yielding parent while substantially improving the performance of lower-yielding parents. This underscores mbm1’s promising potential for use in breeding applications.
In addition, the agronomic trait analysis results revealed that there were no significant differences in key yield-related traits—including branch number, total silique number, seeds per silique, thousand-seed weight, and yield per plant—between reciprocal crosses of mbm1 with either ZS11 or L329 (Figure 2e,f, Figures S3 and S4; Table S2). These findings suggest that, in the context of heterosis breeding with the aim of improving plant architecture using these specific combinations, parental selection may not need to account for reciprocal cross effects. This provides greater flexibility in utilizing plant-type-related heterosis, at least for the combinations evaluated in this study.
3. Discussion
Branch number is a direct determinant of silique number per plant and ultimately yield in rapeseed. Previous studies have shown that the primary effective branch number contributes most significantly to yield, and modifying branch architecture can markedly increase siliques per plant [5]. Consistent with these findings, branch number indirectly promotes yield by increasing the effective silique number per plant, particularly under conventional planting densities [44]. In this study, the mbm1 mutant exhibited a branch number that was 2.04 times that of the WT, along with an approximately 50% increase in total siliques per plant and a 25% rise in yield per plant (Figure 1), further confirming the positive role played by branch number in improving yield. Moreover, no significant differences in branching traits were observed between the reciprocal F1 hybrids of mbm1 and the WT or the commercial varieties ZS11 and L329, indicating that the inheritance of branching traits is not affected by cytoplasmic effects (Figure 2a–f). This simplifies parental selection and facilitates the efficient utilization of this plant-type trait in hybrid breeding systems. Notably, transgressive heterosis for silique number on branches has been reported in F1 hybrids between compact- and loose-branching types [45], highlighting considerable potential for improving branch-related traits. In line with this, when mbm1 was crossed with parents of different genetic backgrounds (ZS11, L329), its multi-branching and high-silique-number traits were stably inherited and effectively increased both branch number and total silique number in low-yielding parents (Figure 2b,c,e,f, Figures S3 and S4; Table S2). Furthermore, for traits such as seeds per silique and thousand-seed weight, the F1 hybrids generally exhibited transgressive heterosis or positive improvements. Consequently, the yield per plant of the F1 generation was significantly higher than that of ordinary parents such as ZS11 and L329, reaching a level comparable to the high-yielding mbm1 itself (Figures S3 and S4; Table S2). These results demonstrate the potential applications of mbm1 for crop improvement and breeding programs.
BSA-seq provides an efficient gene mapping approach that avoids genotyping every individual by pooling and sequencing subjects with extreme phenotypes, making it especially useful for mapping complex traits [46,47]. In this study, we integrated BSA-seq with RNA-seq to map the multi-branching mutant mbm1. Using the HB and LB and whole-genome sequencing data, we detected several intervals that were significantly associated with the multi-branching phenotype, with the most prominent located on chromosome C03 (Figure 3). From these regions, 40 candidate SNPs were selected (Tables S6 and S7). The candidate genes harboring these SNPs were then cross-referenced with DEGs from the RNA-seq data (mbm1 vs. WT). This integrated analysis yielded nine candidate genes that were highly expressed in axillary buds and showed significant expression differences between mbm1 and the WT. Based on the functional annotation of Arabidopsis orthologs and genotype–phenotype association analysis via KASP markers (Figure 6), two genes within the candidate interval on chromosome C03—BnaC03.GAE6 and BnaC03.MEE14—were preliminarily identified as candidate genes associated with the multi-branching trait in mbm1 (Table S14).
RNA-seq and qRT-PCR analyses revealed a significant upregulation of BnaC03GAE6 and BnaC03MEE14 expression in the mbm1 mutant (Figure 7c–e). A key question remains as to how the SNPs in these genes affect their expression. Using PlantTFDB (https://planttfdb.gao-lab.org/ (accessed on 4 August 2025)), we examined cis-regulatory elements in and around the mutated genomic regions of BnaC03GAE6 and BnaC03MEE14. The results showed that the G-to-A mutation located 2907 bp upstream of the BnaC03GAE6 transcriptional start site falls within a transcription factor binding site (TFBS) for an AP2 family TF (Figure 7a, Table S15), suggesting that this mutation may interfere with TF binding and consequently affect BnaC03GAE6 expression. In contrast, no TFBS was identified at the C-to-T mutation site 1327 bp downstream of the BnaC03MEE14 transcriptional end site. A recent study reported that a natural mutation located 1.4 kb downstream of the coding sequence of the SAME1 gene significantly enhanced its expression in the shoot apical meristem, leading to increased numbers of effective primary branches and siliques on the main inflorescence [13]. Based on this, we hypothesize that the downstream mutation in BnaC03MEE14 may affect its expression by modifying local chromatin architecture or generating a novel regulatory element. Notably, a second G-to-A mutation exists 1273 bp downstream of this site, which lies within an ERF family TFBS (Figure 7b, Table S16). Previous studies have shown that plant enhancer-like modules can function through chromatin looping [48], and that genomic sequence variations—including point mutations and transposon insertions—can alter local chromatin accessibility and reshape gene regulatory networks [49]. We hypothesize that these two mutations near BnaC03MEE14 may act synergistically: the upstream mutation could promote chromatin opening, while the downstream mutation alters ERF transcription factor binding. Together, they could form a reinforced enhancer-like module that more effectively engages with the BnaC03MEE14 promoter via three-dimensional genomic interactions such as chromatin looping, ultimately leading to pronounced transcriptional upregulation. Nevertheless, the precise regulatory mechanisms underlying this upregulation require further validation through biochemical assays.
The other key question is how BnaC03.GAE6 and BnaC03.MEE14 regulate branching. BnaC03.GAE6 is orthologous to Arabidopsis GAE6, which encodes a key enzyme in the biosynthesis of UDP-galacturonic acid, a primary precursor for pectin [31]. Altering the expression of GAE6 is known to modulate pectin content, thereby influencing the mechanical properties and permeability of the cell wall [33,34,35,36]. Given that cell wall permeability is a critical determinant of intercellular sugar transport [37], and that sugars act both as essential energy sources and as signals that promote bud outgrowth across plant species [17], we hypothesized that changes in BnaC03.GAE6 expression could impact branching by altering sugar levels in buds. Consistent with this hypothesis, we observed a significant upregulation in the expression of BnaC03.GAE6 (Figure 7c,d) alongside significantly elevated levels of sucrose and trehalose (Figure 5) in the axillary buds of the mbm1 mutant. Based on this correlative evidence and the well-established functional roles of its orthologs, we propose that BnaC03.GAE6 contributes to the increased branching phenotype of mbm1 by modulating pectin biosynthesis. This, in turn, is predicted to remodel the cell wall and subsequently influence intercellular sugar transport and accumulation in the bud. Future work involving direct measurements of cell wall composition and sugar flux will be necessary to experimentally validate this proposed mechanism. In addition, BnaC03.MEE14 is an ortholog of Arabidopsis MEE14, a gene known to be required for female gametophyte and early embryo development [38,39]. Recent studies have shown that MEE14 exhibits adenylate cyclase activity, produces cAMP, and plays a role in energy metabolism and stress responses [42,43]. In the present study, we observed that BnaC03.MEE14 is upregulated in the axillary buds of the mbm1 mutant (Figure 7c,e). Based on these findings, we hypothesize that BnaC03.MEE14 may contribute to altered branching in mbm1 by modulating energy metabolism and sugar accumulation, although further experiments are needed to establish a direct causal relationship.
Sugars promote bud outgrowth, in part, by downregulating BRC1 expression [17]. BRC1 is a key repressor of axillary bud growth [23]. Tre6P, a phosphorylated disaccharide, serves as an intracellular signal of sucrose availability, integrating metabolic status with growth and developmental programs [50,51,52]. The heterologous expression of trehalose-6-phosphate phosphatase (TPP) in axillary buds reduces Tre6P levels and inhibits branching [17,53,54]. Elevated Tre6P levels downregulate BRC1 expression, thereby promoting branching. Moreover, sucrose non-fermenting-related kinase 1 (SnRK1) has also been implicated in the transcriptional regulation of BRC1 [55]. SnRK1 forms a heterotrimeric complex composed of a catalytic α subunit (KIN10/SnRK1α1 or KIN11/SnRK1α2) along with regulatory β and βγ subunits [22]. It is well-established that Tre6P inhibits SnRK1 activity [50,56,57,58,59]. Tre6P binds directly to KIN10, reducing the affinity of the activating kinase GRIK1 (Geminivirus Rep-Interacting Kinase 1) for KIN10. This results in decreased phosphorylation and activation of KIN10, ultimately lowering SnRK1 activity [59,60]. Multiple lines of evidence indicate that Tre6P-mediated inhibition of SnRK1 is required to activate biosynthetic processes in growing tissues in response to sucrose availability [21]. For example, sucrose-induced hypocotyl elongation is impaired in Tre6P synthase 1 (TPS1) mutants and in plants overexpressing SnRK1α1, supporting the model that Tre6P-dependent suppression of SnRK1 permits cell elongation [61]. Additionally, sucrose-dependent entrainment of the circadian clock—which regulates processes such as hypocotyl growth—may also depend on Tre6P-mediated inhibition of SnRK1 [62]. In this study, we observed that sucrose metabolism-related genes, including SUC1, SUC2, and SWEET12, were upregulated in the axillary buds of the mbm1 mutant (Figure 4d–g). Consistent with this, the levels of sucrose and trehalose were elevated in axillary buds (Figure 5). As expected, the expression of KIN10, KIN11, and BRC1 was reduced in mbm1 mutant buds compared with the wild type (Figure 4i–k). We therefore conclude that increased sucrose accumulation likely contributes at least partially to the multi-branching phenotype of the mbm1 mutant.
Based on our results and those of previous studies, we propose a molecular regulatory network underlying the multi-branching trait in the mbm1 mutant. This model involves two complementary pathways (Figure 7f): On the one hand, the upregulation of BnaC03MEE14, a gene encoding a protein with adenylate cyclase activity that catalyzes cAMP synthesis [42], may indirectly participate in sugar metabolism and induce the upregulation of SUC/SWEET12; this enhances sucrose transport capacity near axillary buds, thereby increasing intracellular sucrose levels and promoting Tre6P accumulation within the buds. On the other hand, upregulation of BnaC03.GAE6, which promotes pectin synthesis [31], could optimize cell wall structure or permeability. This improvement may facilitate sucrose unloading from the phloem or enhance intercellular transport [37], leading to an elevated concentration of local sucrose and subsequent Tre6P accumulation. Elevated levels of sucrose and Tre6P, in turn, suppress the expression of KIN10 and KIN11, which lowers the expression of BRC1 and ultimately promotes branch formation [50,56,57,58,59]. Interestingly, TPPA, which encodes a Tre6P-metabolizing enzyme [20], exhibits upregulated expression in the mbm1 mutant (Figure 4h). Tre6P is a well-established signal metabolite that reflects cellular sugar status, and its hydrolysis via TPPA is known to contribute to sugar homeostasis [52]. Thus, the observed upregulation may hint at a feedback response to elevated sugar signaling. Nevertheless, further research is needed to validate the functions of the candidate genes BnaC03.GAE6 and BnaC03MEE14 and to fully elucidate the molecular regulatory network controlling branch development in rapeseed.
In conclusion, this study identified two candidate loci, BnaC03.GAE6 and BnaC03.MEE14, underlying the multi-branching trait in the mbm1 mutant by integrating BSA-seq mapping, RNA-seq differential expression analysis, and validation with KASP molecular markers. The evaluation of agronomic performance in F1 crosses of mbm1 with the commercial cultivars ZS11 and L329 highlights its promising application in breeding programs. These findings offer valuable genetic resources and a theoretical basis for further deciphering the regulatory network underlying branching in rapeseed and for developing high-yielding varieties with optimized plant architecture.
4. Materials and Methods
4.1. Plant Materials and Growth Conditions
The multi-branching mutant mbm1 was obtained from ethyl methanesulfonate (EMS) mutagenesis of seeds from the polima cytoplasmic male sterility maintainer line 2B [14]. The mutant was crossed with its wild-type parent 2B (WT) as well as with the commercial rapeseed cultivars L329 (Xiangyou 15) [63] and ZS11 [64]. The resulting progeny were self-pollinated to produce F2 populations.
Plants were cultivated in experimental fields located in Changsha City, Hunan Province, China (28.12° N, 112.59°E) and in greenhouses at Hunan University (28.17° N, 112.95° E). In the field trials, plants were arranged in rows with 30 cm between rows and 20 cm between plants within a row, with 10 plants per row. In the greenhouse, plants were grown in resin pots measuring 40 cm in diameter and 27 cm in height. All plants were grown under natural climate with natural light exposure. Rapeseed (Brassica napus) was used in this study. The polima cytoplasmic male sterility maintainer line 2B was kindly provided by Prof. Wusheng Peng (Yuan Longping High-tech Agriculture Co., Ltd., Changsha, China). The commercial rapeseed cultivars L329 (Xiangyou 15) and ZS11 were kindly provided by Prof. Zhongsong Liu (Hunan Agricultural University, Changsha, China).
4.2. Agronomic Traits Analysis
Agronomic traits, including plant height (PH), branch number (BN), total number of silique (TNS), silique length (SL), number of seeds per silique (NSPS), thousand-seed weight (TSW), and yield per plant (YPP), were measured and statistically analyzed following previously described methods [65]. Plants of mbm1, WT, ZS11, L329, and the different F1 hybrid combinations were harvested and air-dried naturally to determine thousand-seed weight and yield per plant. Days to flowering (DTF) and the whole growth period (WGP) were observed and recorded as described [66]. More than 10 plants of each material were used for statistical analysis. Statistical significance was assessed using GraphPad Prism 8.0.1 software.
4.3. Bulk Construction
For bulk construction, we evaluated the phenotypic distribution in branch number within an F2 population derived from a cross between mbm1 and L329. Based on the observed distribution, two groups representing phenotypic extremes were selected: 50 plants with high branch numbers (12 or more branches) and 50 plants with low branch numbers (3–5 branches). These thresholds were determined according to the natural distribution of the trait in the population. Equal amounts of leaf tissue from each individual within each group were pooled into a single tube to generate two bulked pools: the high branch number bulk (HB) and the low branch number bulk (LB).
4.4. BSA-seq Analysis
BSA-seq analysis was conducted by HuaZhi Biotech Co., Ltd. (Changsha, China). HB and LB samples were ground into a fine powder using steel beads to ensure complete homogenization. DNA extraction was carried out using a magnetic bead-based method with a plant genomic DNA extraction kit (HuaZhi Biotech Co., Ltd., Changsha, China), which included 30 mL of Lysis Buffer LB, 60 µL of RNase, 1.2 mL of magnetic beads, 20 mL of Wash Buffer W1, 25 mL of Wash Buffer W2, and 20 mL of Elution Buffer TE.
The extraction procedure was as follows: first, 600 µL of preheated (65 °C) Lysis Buffer LB and 5 µL of RNase were added to the sample, and the tube was immediately inverted to mix. The mixture was incubated at 65 °C for 30 min, with inversion every 10 min to ensure thorough mixing. After cooling to room temperature, the sample was centrifuged at 12,000 rpm (13,400× g) for 10 min. Then, 400 µL of the supernatant was carefully transferred to a new centrifuge tube, followed by the addition of 300 µL of isopropanol and 20 µL of magnetic beads. The tube was inverted and mixed for 5 min, then subjected to magnetic separation for 2 min, after which the supernatant was discarded. Next, 750 µL of Wash Buffer W1 (with anhydrous ethanol added before use) was added, mixed by inversion for 1 min, and magnetically separated for 2 min before removing the supernatant. This washing step was repeated using 750 µL of Wash Buffer W2. After a brief centrifugation to collect residual liquid, the supernatant was discarded, and the tube was left open for 5 min to allow complete evaporation of ethanol. For DNA elution, 50–100 µL of Elution Buffer TE was added. The magnetic beads were thoroughly resuspended and incubated at 56 °C for 10 min, with intermittent mixing during incubation to improve elution efficiency. Finally, magnetic separation was performed for 2 min, and the supernatant containing the eluted DNA was transferred to a new 1.5 mL centrifuge tube for subsequent quality control.
DNA concentration was measured with a Qubit fluorometer (Invitrogen Qubit 4) (Thermo Fisher, Waltham, MA, USA), and integrity was assessed by 1% agarose gel electrophoresis. Samples meeting quality control standards (qualified DNA sample criteria: concentration ≥ 20 ng/μL, total amount ≥ 1 μg, volume 20–40 μL, or a clear main band with slight degradation and no impurities) were used to construct small-fragment libraries (300–500 bp). The DNA was fragmented with dsDNA Fragmentase, followed by end repair and 3’ end A-tailing. Fragmentation efficiency was verified by 2% agarose gel electrophoresis, and samples showing a distinct 300–500 bp band were carried forward. Sequencing adapters were ligated to the fragmented DNA using ligase, and ligation products were purified with magnetic beads. The purified product concentration was measured with the Qubit fluorometer; qualified samples were then subjected to PCR amplification. PCR products were size-selected using magnetic beads, and their concentration was again measured by Qubit. Fragment size distribution was confirmed by 2% agarose gel electrophoresis and further verified using a Qsep400 bio-analyzer (Houze Biotechnology, Hangzhou, China). Linear libraries were denatured into single strands and circularized. Linear DNA molecules that failed to circularize were digested, yielding single-stranded circular DNA libraries. The concentration of the circularized libraries was measured with the Qubit fluorometer, and qualified samples were processed further. Single-stranded circular DNA was amplified via rolling circle replication to form DNA nanoballs (DNBs), each containing over 300 copies. DNBs were loaded onto sequencing chips using the MGIDL-T7 loader (DNBSEQ-T7) (MGI Tech Co., Ltd., Shenzhen, China). Sequencing was performed using Joint Probe Anchor Polymerization technology.
Raw image data files from high-throughput sequencing were base-called to generate sequencing reads. Low-quality reads (where >50% of bases had quality score Q ≤ 20), adapter sequences, reads containing >5 ‘N’ bases, and reads shorter than 100 bp were removed by Fastp (v0.23.2). The remaining reads were aligned to the ZS11.V0 reference genome using Sentieon’s DNAseq pipeline (v202308.03), followed by sorting and duplicate marking. Variant calling was performed for each sample to generate gVCF files. A joint analysis of all gVCF files was conducted to obtain variant results for each individual in the population using the algorithm “GVCFtyper” in Sentieon. To ensure SNP accuracy, preliminary hard filtering was applied to the SNP sites from the joint analysis using the following criteria by GATK4: “QD < 2.0 || FS > 60.0 || MQ < 40.0 || SOR > 3.0 || MQRankSum < −12.5 || ReadPosRankSum < −8.0” [67]. Candidate loci were identified using the Euclidean Distance (ED) method [68] and the Δ(SNP-index) method [69]. The SNP-index was calculated using the “QTLseqr” package with a window size of 1 Mb. Threshold lines at the 95% and 99% confidence levels were set, and windows above the 95% confidence level were considered candidate intervals. SNPs were screened according to the following criteria: (1) using ZS11 as the reference genome, SNPs were those between mutant mbm1 and wild-type and were homozygous; (2) SNPs involved C/G to T/A substitutions; (3) SNPs included important mutation types such as mutations in upstream and downstream regulatory regions, loss of stop codon, gain of stop codon, and non-synonymous mutations.
4.5. KASP Markers Analysis
KASP markers were developed based on polymorphic SNPs associated with the multi-branching phenotype. The KASP marker analysis was conducted by HuaZhi Biotech Co., Ltd. (Changsha, China). SNP genotyping was performed using KASP technology from Laboratory of the Government Chemist Ltd. (LGC, Teddington, United Kingdom). Three primers were designed: two allele-specific forward primers with fluorescent adapters and one common reverse primer. The fluorescent adapters used were FAM (5′-GAAGGTGACCAAGTTCATGCT-3′) and HEX/VIC (5′-GAAGGTCGGAGTCAACGGATT-3′). The assay also included two fluorescent probes and two corresponding quencher probes. The fluorescent probes were complementary to the quencher probes, and their sequences were identical to the adapter regions of the allele-specific forward primers.
KASP assays were performed on a Douglas ArrayTape genotyping platform. Each PCR reaction had a total volume of 0.8 µL, containing: 20–50 ng of dried sample DNA, 0.0013 µL each of the 100 µM allele-specific primers, 0.0033 µL of the 100 µM common primer, 0.3945 µL of 2× KASP Master Mix, and 0.3996 µL of ultrapure water. Amplification was performed in a water-bath thermal cycler (LGC, Teddington, United Kingdom) using a touchdown PCR protocol as follows: initial denaturation at 94 °C for 15 min; first amplification stage—10 cycles of 94 °C for 20 s and a combined annealing/extension step starting at 65 °C (decreasing by 0.8 °C per cycle) for 60 s, ending at 57 °C; second amplification stage—30 cycles of 94 °C for 20 s and 57 °C for 60 s. Following amplification, fluorescence of the KASP reaction products was detected using the ArrayTape scanning system. The fluorescence data were automatically processed and converted into genotype plots. The sequences of the primers are listed in Table S13, and the composition of the assay reaction system is detailed in Table S17.
4.6. RNA-seq Analysis
Two months after sowing in soil, at the nine-leaf stage, axillary buds from both the WT and the mutant mbm1 were harvested and immediately frozen in liquid nitrogen. For each genotype, samples were collected from individual plants, with three axillary buds taken from each plant, spanning from the base to the upper stem. The plants used for collecting axillary buds are shown in Figure S5. The transcriptome sequencing and analysis were performed by HuaZhi Biotech Co., Ltd. (Changsha, China), with three biological replicates per genotype.
Clean reads from each sample were aligned to the ZS11 reference genome using HISAT2 (v2.2.1) [70]. Transcript abundance was estimated as Fragments Per Kilobase of transcript per Million mapped reads (FPKM) using RSEM software (v1.3.3) [71]. Differential gene expression analysis was performed with DESeq2. Genes were considered differentially expressed if they met the following thresholds: q-value < 0.05 and |log2FoldChange| ≥ 1, with fold changes calculated from log2-transformed expression values.
4.7. qRT-PCR Analysis
Total RNA was extracted using an RNA extraction kit (Accurate Biology, Changsha, China). cDNA was then synthesized by reverse transcription with the PrimeScript RT reagent Kit with gDNA Eraser (Takara Bio, Kyoto, Japan). Quantitative reverse transcription-PCR (qRT-PCR) was performed on a BioRad CFX96 Touch real-time PCR system with the SYBR Green Premix Pro Taq HS qPCR kit (Accurate Biology, Changsha, China), in accordance with the manufacturer’s instructions. BnaACTIN7 served as the internal reference gene. The primer sequences used are listed in Table S18. All experiments were conducted with three biological replicates.
4.8. Sucrose and Trehalose Content Measurement
WT and mbm1 mutant plants were grown in soil for two months. Axillary bud samples were then collected from individual plants, with three buds taken per plant along the stem from the base to the upper region for measuring sucrose and trehalose levels. Plants used for collecting axillary buds are shown in Figure S5.
For sucrose measurement, approximately 0.1 g of tissue was homogenized at room temperature in 0.5 mL of 80% ethanol extraction buffer. Following thorough grinding, the homogenate was promptly transferred to a centrifuge tube and incubated in an 80 °C water bath for 10 min, with intermittent shaking every 2–3 min. After cooling to room temperature, the mixture was centrifuged at 4000× g for 10 min at 25 °C, and the supernatant was collected. Sucrose was then extracted using the Plant Tissue Sucrose Content Assay Kit (Shanghai Sinobestbio Technology Co., Ltd., Shanghai, China) following the manufacturer’s protocol. The absorbance at 480 nm was recorded with a microplate reader (PerkinElmer). Sucrose concentration was quantified based on a sucrose standard. Three biological replicates were performed.
For trehalose measurement, about 0.1 g of tissue was homogenized at room temperature and combined with 1 mL of extraction buffer containing approximately 9.1% trichloroacetic acid (TCA). The mixture was incubated at room temperature for 45 min with intermittent shaking 3 to 5 times during the incubation period. After cooling, the sample was centrifuged at 8000× g at room temperature, and the supernatant was collected. Trehalose was then extracted using the Plant Tissue Trehalose Content Assay Kit (Shanghai Sinobestbio Technology Co., Ltd.) according to the supplied instructions. Absorbance was measured at 620 nm using a microplate reader (PerkinElmer), and trehalose content was determined by reference to a trehalose standard. Three biological replicates were conducted.
Supplementary Materials
The following supporting information can be downloaded at: https://www.mdpi.com/article/10.3390/ijms27062611/s1.
Author Contributions
S.L., B.L., Z.Z., T.W. and X.Z. designed the research; S.L., B.L., Z.Z., N.C. and X.L. performed the experiments; S.L., B.L., Z.Z., M.L., T.W. and X.Z. analyzed data; S.L. wrote the manuscript; S.L., B.L., T.W. and X.Z. revised the manuscript. All authors have read and agreed to the published version of the manuscript.
Funding
This research was funded by Hunan Province Science and Technology Innovation Program (2025JK2021); Yuelushan Laboratory Breeding Program (YLS-2025-ZY03003).
Institutional Review Board Statement
Not applicable.
Informed Consent Statement
Not applicable.
Data Availability Statement
The bulked segregant analysis sequencing (BSA-seq) and RNA sequencing (RNA-seq) data are available at http://bigd.big.ac.cn/ with the project number of PRJCA055317, and the accession number is CRA036898.
Acknowledgments
We thank Zhongsong Liu for providing L329 (Xiangyou 15) and ZS11 seeds, Wusheng Peng for 2B seeds. We also thank Wei Zhang (Hunan Longping Oilseed Industry Co., Ltd.) for his assistance with rapeseed cultivation and field management, and Miaoquan Fang (Huazhi Biotech Co. Ltd.) for his support in the bioinformatics analysis of the BSA-seq data and for preparing the related figures.
Conflicts of Interest
The authors declare no conflicts of interest.
References
- Kadam, D.; Lele, S.S. Value addition of oilseed meal: A focus on bioactive peptides. J. Food Meas. Charact. 2018, 12, 449–458. [Google Scholar] [CrossRef] [Scilit]
- Clarke, J.M.; Simpson, G.M. Influence of irrigation and seeding rates on the yield of Brassica napus L. Can. J. Plant Sci. 1978, 58, 731–737. [Google Scholar] [CrossRef] [Scilit]
- Chen, B.; Xu, K.; Li, J.; Li, F.; Qiao, J.; Li, H.; Gao, G.; Yan, G.; Wu, X. Evaluation of yield and agronomic traits and their genetic variation in 488 global collections of Brassica napus L. Genet. Resour. Crop Evol. 2014, 61, 979–999. [Google Scholar] [CrossRef] [Scilit]
- Guo, S.; Yuan, Y.; De, Q.; Deqing, P.; Yang, G.; Deng, G.; Dan, B. Evaluation and analysis of agronomic characters and yield of tibetan cabbage yellow-seed rape. J. Plateau Agric. 2020, 4, 447–453. [Google Scholar] [CrossRef]
- Bai, G.; Liu, K.; Tan, Y.; Yin, Y.; Yu, H.; Wang, H. Effect of agronomic traits on seed yield in high-yielding rapeseed populations. Crops 2015, 6, 33–38. [Google Scholar]
- Wang, H.; Li, X.; Meng, B.; Fan, Y.; Khan, S.U.; Qian, M.; Zhang, M.; Yang, H.; Lu, K. Exploring silique number in Brassica napus L. Genetic and molecular advances for improving yield. Plant Biotechnol. J. 2024, 22, 1897–1912. [Google Scholar] [CrossRef] [Scilit]
- Shah, S.; Karunarathna, N.L.; Jung, C.; Emrani, N. An APETALA1 ortholog affects plant architecture and seed yield component in oilseed rape (Brassica napus L.). BMC Plant Biol. 2018, 18, 380. [Google Scholar] [CrossRef] [Scilit]
- Zheng, M.; Zhang, L.; Tang, M.; Liu, J.; Liu, H.; Yang, H.; Fan, S.; Terzaghi, W.; Wang, H.; Hua, W. Knockout of two BnaMAX1 homologs by CRISPR/Cas9-targeted mutagenesis improves plant architecture and increases yield in rapeseed (Brassica napus L.). Plant Biotechnol. J. 2020, 18, 644–654. [Google Scholar] [CrossRef] [Scilit]
- Sriboon, S.; Li, H.; Guo, C.; Senkhamwong, T.; Dai, C.; Liu, K. Knock-out of TERMINAL FLOWER 1 genes altered flowering time and plant architecture in Brassica napus. BMC Genet. 2020, 21, 52. [Google Scholar] [CrossRef] [Scilit]
- Huang, K.; Tian, J.; Wang, H.; Fu, Y.; Li, Y.; Zheng, Y.; Li, X. Fatty acid export protein BnFAX6 functions in lipid synthesis and axillary bud growth in Brassica napus. Plant Physiol. 2021, 186, 2064–2077. [Google Scholar] [CrossRef] [Scilit]
- Zhang, K.; Zhang, J.; Cui, C.; Chai, L.; Zheng, B.; Jiang, L.; Li, H. The WRKY28-BRC1 transcription factor module controls shoot branching in Brassica napus. Plants 2025, 14, 486. [Google Scholar] [CrossRef] [Scilit]
- Zhang, X.; Feng, B.; Wang, Y.; Mu, T.; Zheng, M.; Gao, C.; Zhang, B.; Li, Y.; Zhang, H.; Yuan, W.; et al. Targeted disruption of five Bna.BRC1 homologs in rapeseed generates a highly branched germplasm for its multifunctional utilization. Plant Commun. 2025, 6, 101319. [Google Scholar] [CrossRef] [Scilit]
- Zhang, S.; Li, B.; Li, X.; Yu, S.; Yang, Y.; Liu, P.; He, T.; Wang, W.; Li, M.; Guo, L.; et al. Rare natural SNP activates SHOOT APICAL MERISTEM ENLARGER1 to increase branch number and silique number on the main inflorescence in Brassica napus. Plant Biotechnol. J. 2026, 1–19. [Google Scholar] [CrossRef] [Scilit]
- Liao, X.; Yan, J.; Zhong, M.; Zhuo, Y.; Wu, D.; He, R.; Zhao, X.; Liu, X. EMS mutagenesis and analysis of multi-branched and long-silique mutants in Brassica napus L. Life Sci. Res. 2016, 20, 435–441. [Google Scholar] [CrossRef]
- Feng, X.; Yang, S.; Tang, K.; Zhang, Y.; Feng, X. GmPGL1, a thiamine thiazole synthase, is required for the biosynthesis of thiamine in soybean. Front. Plant Sci. 2019, 10, 1546. [Google Scholar] [CrossRef] [Scilit] [PubMed]
- Mohanty, J.K.; Thakro, V.; Yadav, A.H.G.P. Delineation of genes for a major QTL governing heat stress tolerance in chickpea. Plant Mol. Biol. 2024, 114, 19. [Google Scholar] [CrossRef] [Scilit] [PubMed]
- Wang, M.; Le Moigne, M.; Bertheloot, J.; Crespel, L.; Perez-Garcia, M.; Ogé, L.; Demotes-Mainard, S.; Hamama, L.; Davière, J.; Sakr, S. BRANCHED1: A key hub of shoot branching. Front. Plant Sci. 2019, 10, 76. [Google Scholar] [CrossRef] [Scilit]
- Sauer, N.; Stolz, J. SUC1 and SUC2: Two sucrose transporters from Arabidopsis thaliana; expression and characterization in baker’s yeast and identification of the histidine-tagged protein. Plant J. 1994, 6, 67–77. [Google Scholar] [CrossRef] [Scilit]
- Chen, L.; Hou, B.; Lalonde, S.; Takanaga, H.; Hartung, M.L.; Qu, X.; Guo, W.; Kim, J.; Underwood, W.; Chaudhuri, B.; et al. Sugar transporters for intercellular exchange and nutrition of pathogens. Nature 2010, 468, 527–532. [Google Scholar] [CrossRef] [Scilit]
- Leyman, B.; Van Dijck, P.; Thevelein, J.M. An unexpected plethora of trehalose biosynthesis genes in Arabidopsis thaliana. Trends Plant Sci. 2001, 6, 510–513. [Google Scholar] [CrossRef] [Scilit]
- Baena-González, E.; Lunn, J.E. SnRK1 and trehalose 6-phosphate-two ancient pathways converge to regulate plant metabolism and growth. Curr. Opin. Plant Biol. 2020, 55, 52–59. [Google Scholar] [CrossRef] [Scilit]
- Ramon, M.; Ruelens, P.; Li, Y.; Sheen, J.; Geuten, K.; Rolland, F. The hybrid four-CBS-domain KINβγ subunit functions as the canonical γ subunit of the plant energy sensor SnRK1. Plant J. 2013, 75, 11–25. [Google Scholar] [CrossRef] [Scilit]
- Antonio, A.J.; César, P.; Pilar, C. Arabidopsis BRANCHED1 acts as an integrator of branching signals within axillary buds. Plant Cell 2007, 19, 458–472. [Google Scholar]
- Li, N.; Duan, Y.; Ye, Q.; Ma, Y.; Ma, R.; Zhao, L.; Zhu, S.; Yu, F.; Qi, S.; Wang, Y. The Arabidopsis eIF4E1 regulates NRT1.1-mediated nitrate signaling at both translational and transcriptional levels. New Phytol. 2023, 240, 338–353. [Google Scholar] [CrossRef] [Scilit] [PubMed]
- Quezada, E.H.; García, G.; Arthikala, M.K.; Melappa, G.; Lara, M.; Nanjareddy, K. Cysteine-rich receptor-like kinase gene family identification in the Phaseolus genome and comparative analysis of their expression profiles specific to mycorrhizal and rhizobial symbiosis. Genes 2019, 10, 59. [Google Scholar] [CrossRef] [Scilit] [PubMed]
- Mou, S.; Meng, Q.; Gao, F.; Zhang, T.; He, S. A cysteine-rich receptor-like protein kinase CaCKR5 modulates immune response against Ralstonia solanacearum infection in pepper. BMC Plant Biol. 2021, 21, 382. [Google Scholar] [CrossRef] [Scilit]
- Schneider, S.; Schneidereit, A.; Konrad, K.R.; Hajirezaei, M.; Gramann, M.; Hedrich, R.; Sauer, N. Arabidopsis INOSITOL TRANSPORTER4 mediates high-affinity H+ symport of myoinositol across the plasma membrane. Plant Physiol. 2006, 141, 565–577. [Google Scholar] [CrossRef] [Scilit]
- Menges, M.; Hennig, L.; Gruissem, W.; Murray, J.A.H. Cell cycle-regulated gene expression in Arabidopsis. J. Biol. Chem. 2002, 277, 41987–42002. [Google Scholar] [CrossRef] [Scilit]
- Meyer, S.; Mumm, P.; Imes, D.; Endler, A.; Weder, B.; Al-Rasheid, K.A.S.; Geiger, D.; Marten, I.; Martinoia, E.; Hedrich, R. AtALMT12 represents an R-type anion channel required for stomatal movement in Arabidopsis guard cells. Plant J. 2010, 63, 1054–1062. [Google Scholar] [CrossRef] [Scilit]
- Yamamoto, H.; Fan, X.; Sugimoto, K.; Fukao, Y.; Peng, L.; Shikanai, T. Chlororespiratory reduction 9 is a novel factor required for formation of subcomplex A of the chloroplast NADH dehydrogenase-like complex. Plant Cell Physiol. 2016, 57, 2122–2132. [Google Scholar] [CrossRef] [Scilit]
- Usadel, B.R.; Schlüter, U.; Mølhøj, M.; Gipmans, M.; Verma, R.; Kossmann, J.; Reiter, W.D.; Pauly, M. Identification and characterization of a UDP-D-glucuronate 4-epimerase in Arabidopsis. FEBS Lett. 2004, 569, 327–331. [Google Scholar] [CrossRef] [Scilit] [PubMed]
- Du, J.; Anderson, C.T.; Xiao, C. Dynamics of pectic homogalacturonan in cellular morphogenesis and adhesion, wall integrity sensing and plant development. Nat. Plants 2022, 8, 332–340, Erratum in Nat. Plants 2022, 8, 721. https://doi.org/10.1038/s41477-022-01183-1. [Google Scholar] [CrossRef] [Scilit] [PubMed]
- Bethke, G.; Thao, A.; Xiong, G.; Li, B.; Glazebrook, J. Pectin Biosynthesis Is Critical for Cell Wall Integrity and Immunity in Arabidopsis thaliana. Plant Cell 2016, 28, 537–556. [Google Scholar] [CrossRef] [Scilit] [PubMed]
- Vlaar, L.E. The Role of Rhizosphere Signalling in the Plant-Cyst Nematode Interaction. Ph.D. Thesis, Universiteit van Amsterdam, Amsterdam, The Netherlands, 2022. [Google Scholar]
- FraderaSoler, M.; Mravec, J.; Harholt, J.; Grace, O.M.; Jørgensen, B. Cell wall polysaccharide and glycoprotein content tracks growth-form diversity and an aridity gradient in the leaf-succulent genus Crassula. Physiol. Plantarum. 2023, 175, e14007. [Google Scholar] [CrossRef] [Scilit]
- Haas, K.T.; Wightman, R.; Meyerowitz, E.M.; Peaucelle, A. Pectin homogalacturonan nanofilament expansion drives morphogenesis in plant epidermal cells. Science 2020, 367, 1003. [Google Scholar] [CrossRef] [Scilit]
- Lalonde, S.; Tegeder, M.; Throne-Holst, M.; Frommer, W.B.; Patrick, J.W. Phloem loading and unloading of sugars and amino acids. Plant Cell Environ. 2003, 26, 37–56. [Google Scholar] [CrossRef] [Scilit]
- Terrasson, E.; Buitink, J.; Righetti, K.; Vu, B.L.; Pelletier, S.; Zinsmeister, J.; Lalanne, D.; Leprince, O. An emerging picture of the seed desiccome: Confirmed regulators and newcomers identified using transcriptome comparison. Front. Plant Sci. 2013, 4, 497. [Google Scholar] [CrossRef] [Scilit]
- Pagnussat, G.C. Genetic and molecular identification of genes required for female gametophyte development and function in Arabidopsis. Development 2005, 132, 603–614. [Google Scholar] [CrossRef] [Scilit]
- Barakat, A.; Sriram, A.; Park, J.; Zhebentyayeva, T.; Main, D.; Abbott, A. Genome wide identification of chilling responsive microRNAs in Prunus persica. BMC Genom. 2012, 13, 481. [Google Scholar] [CrossRef] [Scilit]
- Xie, Y.; Hou, Z.; Shi, M.; Wang, Q.; Yang, Z.; Lim, K.; Wang, Z. Transcriptional regulation of female and male flower bud initiation and development in pecan (Carya illinoensis). Plants 2023, 12, 1378. [Google Scholar] [CrossRef] [Scilit]
- Kawadza, D.; Dikobe, T.; Chatukuta, P.; Takundwa, M.; Bobo, E.; Sehlabane, K.; Ruzvidzo, O. An Arabidopsis maternal effect embryo arrest protein is an adenylyl cyclase with predicted roles in embryo development and response to abiotic stress. Open Biotechnol. J. 2023, 17, e187407072212060. [Google Scholar] [CrossRef] [Scilit]
- Ambros, S.; Kotewitsch, M.; Wittig, P.R.; Bammer, B.; Mustroph, A. Transcriptional response of two Brassica napus cultivars to short-term hypoxia in the root zone. Front. Plant Sci. 2022, 13, 897673. [Google Scholar] [CrossRef] [Scilit] [PubMed]
- Song, X.; Liu, F.; Zheng, P.; Zhang, X.; Lu, G.; Fu, G.; Cheng, Y. Correlation analysis between agronomic traits and yield of rapeseed (Brassica napus L.) for high-density planting. Sci. Agric. Sin. 2010, 43, 1800–1806. [Google Scholar]
- Zhang, W.; Tian, L.D. Genetic effect of hybrid F1 branching character of CCT and LCT in Brassica napus. Chin. Agric. Sci. Bull. 2000, 16, 17–19. [Google Scholar]
- Zegeye, W.A.; Zhang, Y.; Cao, L.; Cheng, S. Whole genome resequencing from bulked populations as a rapid QTL and gene identification method in rice. Int. J. Mol. Sci. 2018, 19, 4000. [Google Scholar] [CrossRef] [Scilit]
- Zou, C.; Wang, P.; Xu, Y. Bulked sample analysis in genetics, genomics and crop improvement. Plant Biotechnol. J. 2016, 14, 1941–1955. [Google Scholar] [CrossRef] [Scilit]
- Dong, Q.; Wang, J.; Li, X.; Gong, L. Progresses in the plant 3D chromatin architecture. Hereditas 2020, 42, 73–86. [Google Scholar] [CrossRef]
- Mengqi, L.; Yilong, F.; Qi, H.; Ying, Y.; Yining, S.; Dongyang, Z.; Wenli, Z. Genomic variations combined with epigenetic modifications rewire open chromatin in rice. Plant Physiol. 2023, 193, 1880–1896. [Google Scholar] [CrossRef] [Scilit]
- Figueroa, C.M.; Lunn, J.E. A Tale of Two Sugars: Trehalose 6-Phosphate and Sucrose. Plant Physiol. 2016, 172, 7. [Google Scholar] [CrossRef] [Scilit]
- Schluepmann, H.; Pellny, T.; van Dijken, A.; Smeekens, S.; Paul, M. Trehalose 6-phosphate is indispensable for carbohydrate utilization and growth in Arabidopsis thaliana. Proc. Natl. Acad. Sci. USA 2003, 100, 6849–6854. [Google Scholar] [CrossRef] [Scilit]
- Yadav, U.P.; Ivakov, A.; Feil, R.; Duan, G.Y.; Lunn, J.E. The sucrose-trehalose 6-phosphate (Tre6P) nexus: Specificity and mechanisms of sucrose signalling by Tre6P. J. Exp. Bot. 2014, 65, 1051–1068. [Google Scholar] [CrossRef] [Scilit]
- Fichtner, F.; Barbier, F.F.; Feil, R.; Watanabe, M.; Annunziata, M.G.; Chabikwa, T.G.; Höfgen, R.; Stitt, M.; Beveridge, C.A.; Lunn, J.E. Trehalose 6-phosphate is involved in triggering axillary bud outgrowth in garden pea (Pisum sativum L.). Plant J. 2017, 92, 611–623. [Google Scholar] [CrossRef] [Scilit] [PubMed]
- Fichtner, F.; Barbier, F.F.; Annunziata, M.G.; Feil, R.; Olas, J.J.; Mueller-Roeber, B.; Stitt, M.; Beveridge, C.A.; Lunn, J.E. Regulation of shoot branching in arabidopsis by trehalose 6-phosphate. New Phytol. 2021, 229, 2135–2151. [Google Scholar] [CrossRef] [Scilit] [PubMed]
- Wang, M. Molecular Regulatory Network of BRANCHED1 (BRC1) Expression in Axillary Bud of Rpsa sp. in Response to Sugar and Auxin. Ph.D. Thesis, Agrocampus Ouest, Rennes, France, 2019. [Google Scholar]
- Zhang, Y.; Primavesi, L.F.; Jhurreea, D.; Andralojc, P.J.; Mitchell, R.A.C.; Powers, S.J.; Schluepmann, H.; Delatte, T.; Wingler, A.; Paul, M.J. Inhibition of SNF1-related protein kinase1 activity and regulation of metabolic pathways by trehalose-6-phosphate. Plant Physiol. 2009, 149, 1860–1871. [Google Scholar] [CrossRef] [Scilit] [PubMed]
- Nunes, C.; O’Hara, L.E.; Primavesi, L.F.; Delatte, T.L.; Schluepmann, H.; Somsen, G.W.; Silva, A.B.; Fevereiro, P.S.; Wingler, A.; Paul, M.J. The trehalose 6-phosphate/SnRK1 signaling pathway primes growth recovery following relief of sink limitation. Plant Physiol. 2013, 162, 1720–1732. [Google Scholar] [CrossRef] [Scilit]
- Blanford, J.; Zhai, Z.; Baer, M.D.; Guo, G.; Liu, H.; Liu, Q.; Raugei, S.; Shanklin, J. Molecular mechanism of trehalose 6-phosphate inhibition of the plant metabolic sensor kinase SnRK1. Sci. Adv. 2024, 10, 10. [Google Scholar] [CrossRef] [Scilit]
- Zhai, Z.; Keereetaweep, J.; Liu, H.; Feil, R.; Lunn, J.E.; Shanklin, J. Trehalose 6-phosphate positively regulates fatty acid biosynthesis by stabilizing WRINKLED1. Plant Cell 2018, 30, 2616–2627. [Google Scholar] [CrossRef] [Scilit]
- Shen, W.; Reyes, M.I.; Hanley-Bowdoin, L. Arabidopsis protein kinases GRIK1 and GRIK2 specifically activate SnRK1 by phosphorylating its activation loop. Plant Physiol. 2009, 150, 996–1005. [Google Scholar] [CrossRef] [Scilit]
- Noriane, M.L.S.; Jelena, K.; Fernandez-Lopez, A.; Chembath, A.; Belbin, F.E.; Dodd, A.N. The energy-signaling hub SnRK1 is important for sucrose-induced hypocotyl elongation. Plant Physiol. 2018, 176, 1299–1310. [Google Scholar] [CrossRef] [Scilit]
- Frank, A.; Matiolli, C.C.; Viana, A.J.C.; Hearn, T.J.; Kusakina, J.; Belbin, F.E.; Newman, D.W.; Yochikawa, A.; Cano-Ramirez, D.L.; Chembath, A.; et al. Circadian entrainment in Arabidopsis by the sugar-responsive transcription factor bZIP63. Curr. Biol. 2018, 28, 2597. [Google Scholar] [CrossRef] [Scilit]
- Zhang, Z.; Xiao, G.; Liu, R.; Tan, T.; Guan, C.; Wang, G.; Chen, S.; Wu, X.; Guan, M.; Li, Q. Proteomic analysis of differentially expressed proteins between Xiangyou 15 variety and the mutant M15. Front. Biol. 2014, 9, 234–243. [Google Scholar] [CrossRef] [Scilit]
- Sun, F.; Fan, G.; Hu, Q.; Zhou, Y.; Guan, M.; Tong, C.; Li, J.; Du, D.; Qi, C.; Jiang, L.; et al. The high-quality genome of Brassica napus cultivar ‘ZS11’ reveals the introgression history in semi-winter morphotype. Plant J. 2017, 92, 452–468. [Google Scholar] [CrossRef] [Scilit] [PubMed]
- Li, X.; Xiang, F.; Zhang, W.; Yan, J.; Li, X.; Zhong, M.; Yang, P.; Chen, C.; Liu, X.; Mao, D.; et al. Characterization and fine mapping of a new dwarf mutant in Brassica napus. BMC Plant Biol. 2021, 21, 117. [Google Scholar] [CrossRef] [Scilit] [PubMed]
- Wang, T.; Wei, L.; Wang, J.; Xie, L.; Li, Y.Y.; Ran, S.; Ren, L.; Lu, K.; Li, J.; Timko, M.P.; et al. Integrating GWAS, linkage mapping and gene expression analyses reveals the genetic control of growth period traits in rapeseed (Brassica napus L.). Biotechnol. Biofuels 2020, 13, 134. [Google Scholar] [CrossRef] [Scilit]
- Kendig, K.I.; Baheti, S.; Bockol, M.A.; Drucker, T.M.; Mainzer, L.S. Sentieon DNASeq variant calling workflow demonstrates strong computational performance and accuracy. Front. Genet. 2019, 10, 736. [Google Scholar] [CrossRef] [Scilit]
- Hill, J.T.; Demarest, B.L.; Bisgrove, B.W.; Gorsi, B.; Su, Y.; Yost, H.J. MMAPPR: Mutation mapping analysis pipeline for pooled RNA-seq. Genome Res. 2013, 23, 687–697. [Google Scholar] [CrossRef] [Scilit]
- Mansfeld, B.N.; Grumet, R. QTLseqr: An R package for bulk segregant analysis with next-generation sequencing. Plant Genome 2018, 11, 180006. [Google Scholar] [CrossRef] [Scilit]
- Kim, D.; Paggi, J.M.; Park, C.; Bennett, C.; Salzberg, S.L. Graph-based genome alignment and genotyping with HISAT2 and HISAT-genotype. Nat. Biotechnol. 2019, 37, 907–915. [Google Scholar] [CrossRef] [Scilit]
- Li, B.; Dewey, C.N. RSEM: Accurate transcript quantification from RNA-Seq data with or without a reference genome. BMC Bioinform. 2011, 12, 323. [Google Scholar] [CrossRef] [Scilit]
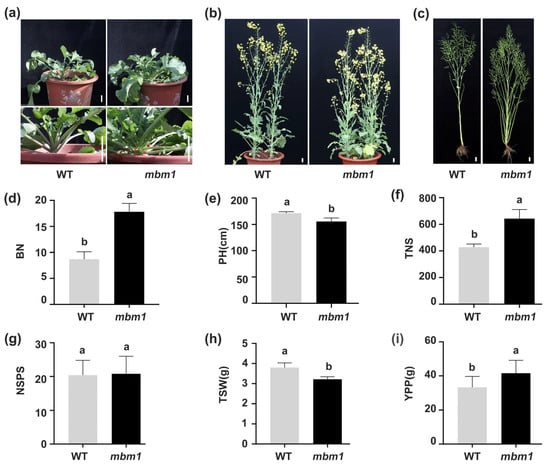
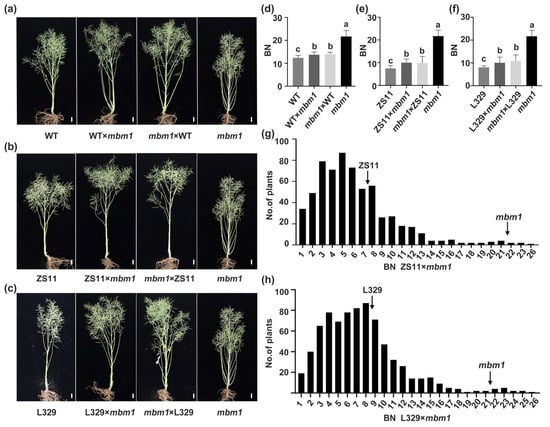
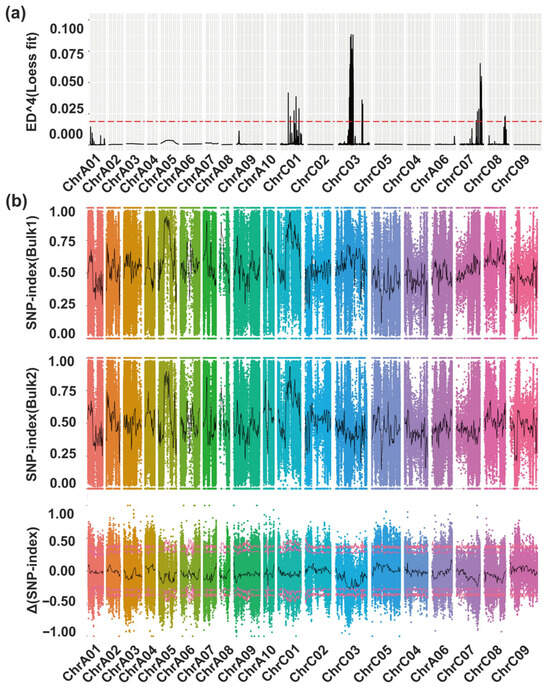
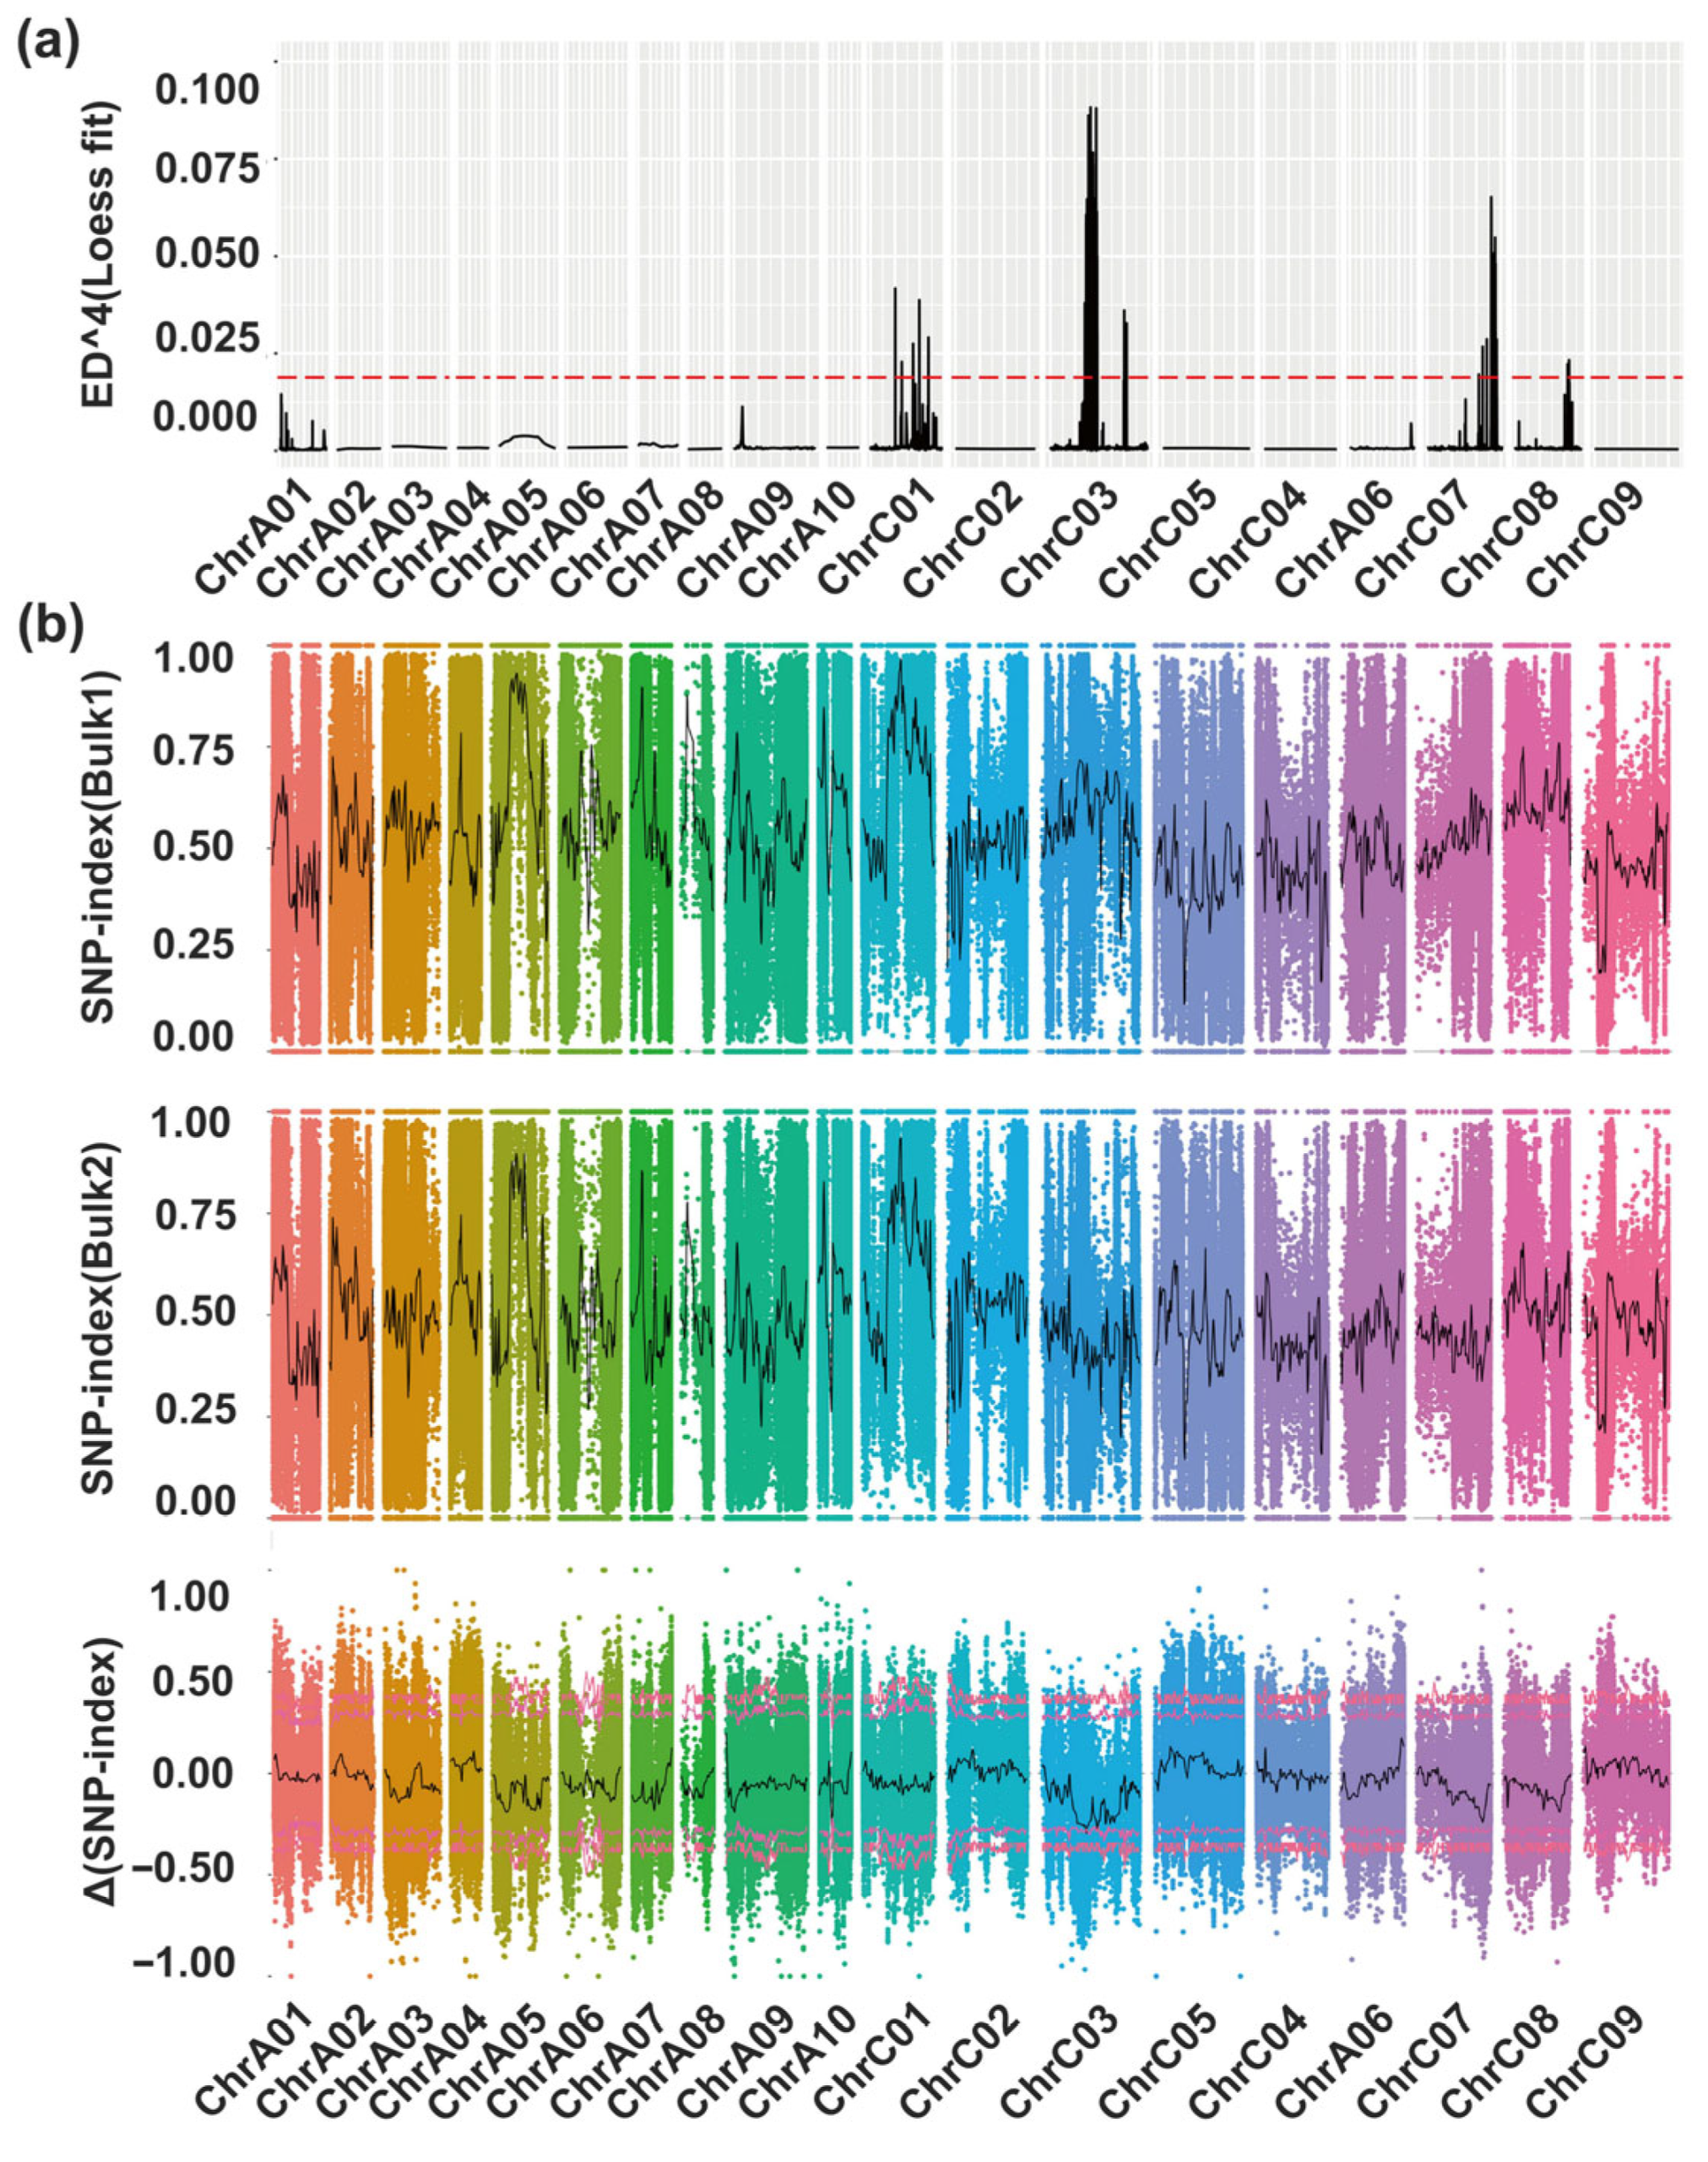
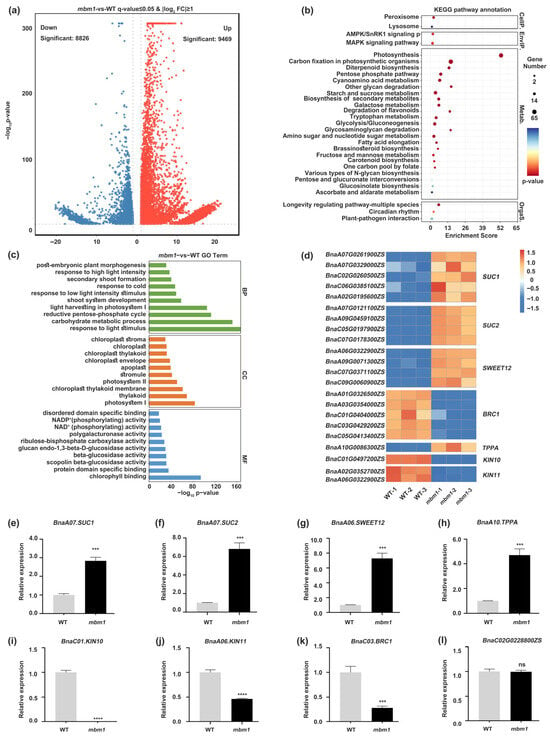
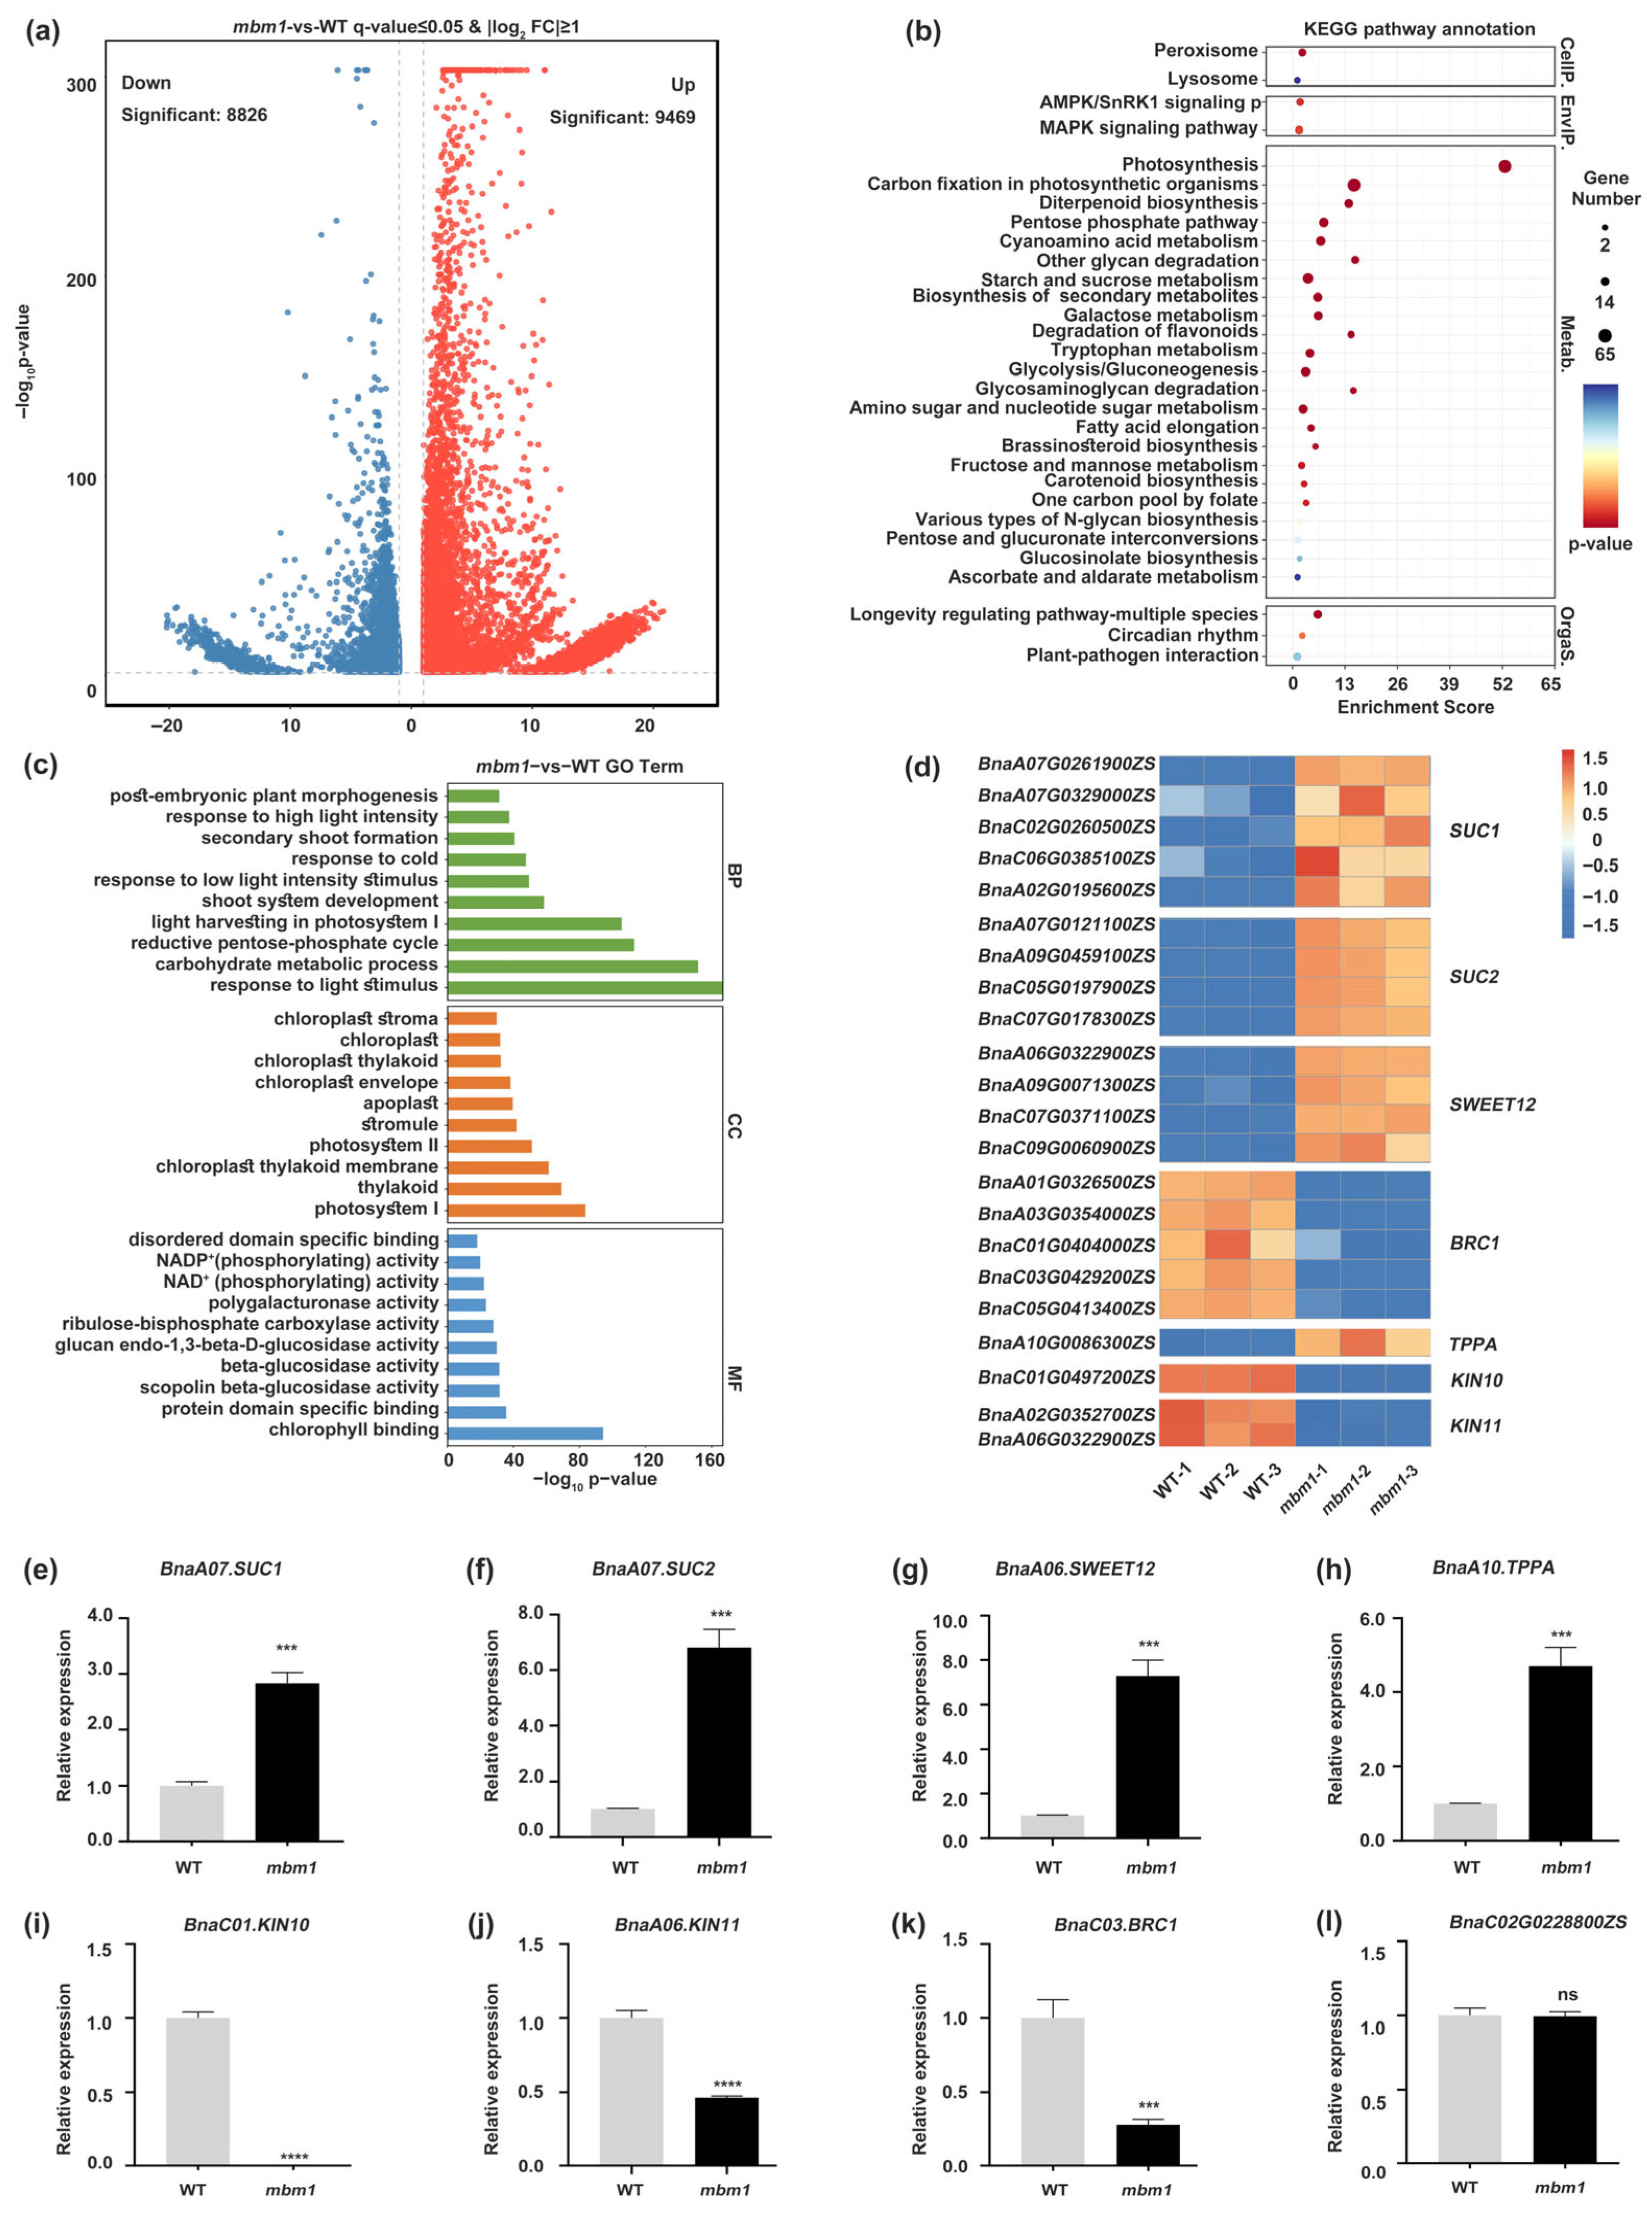
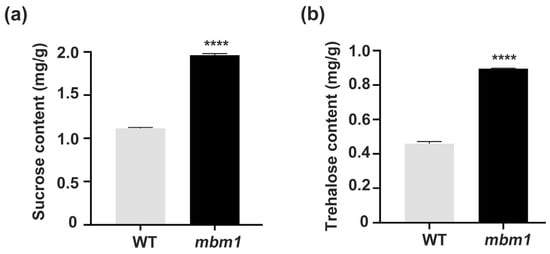
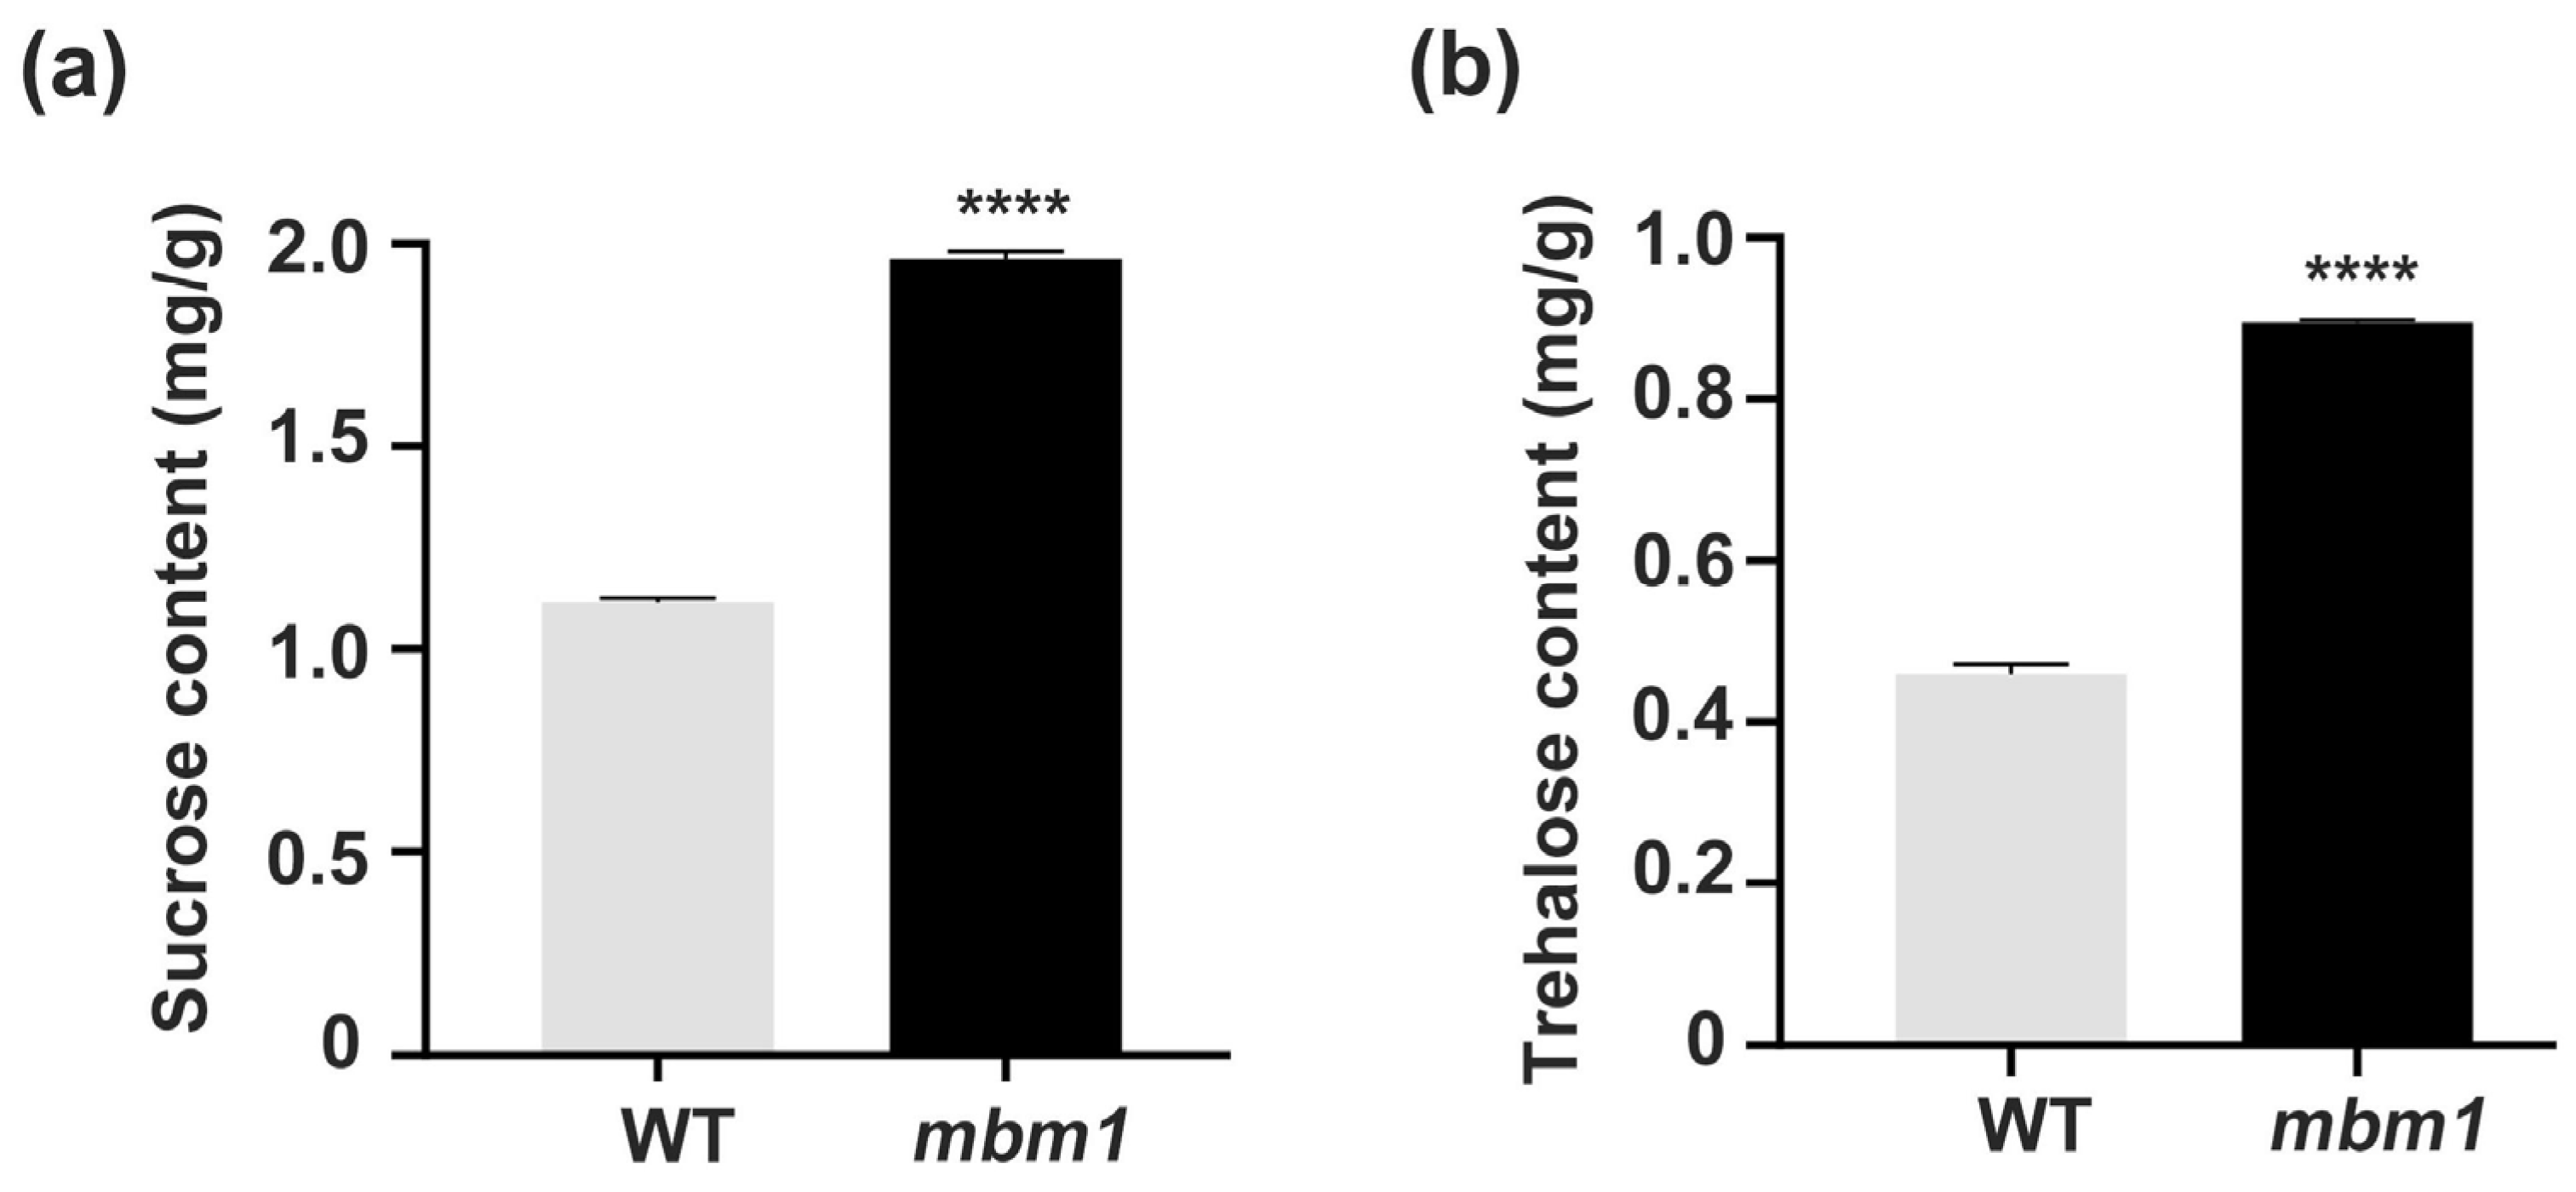
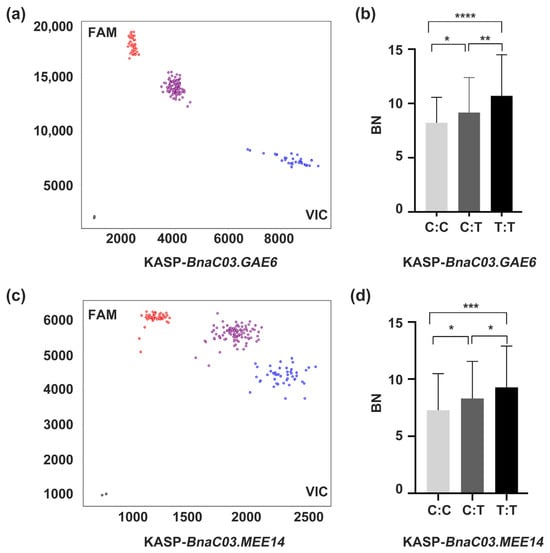
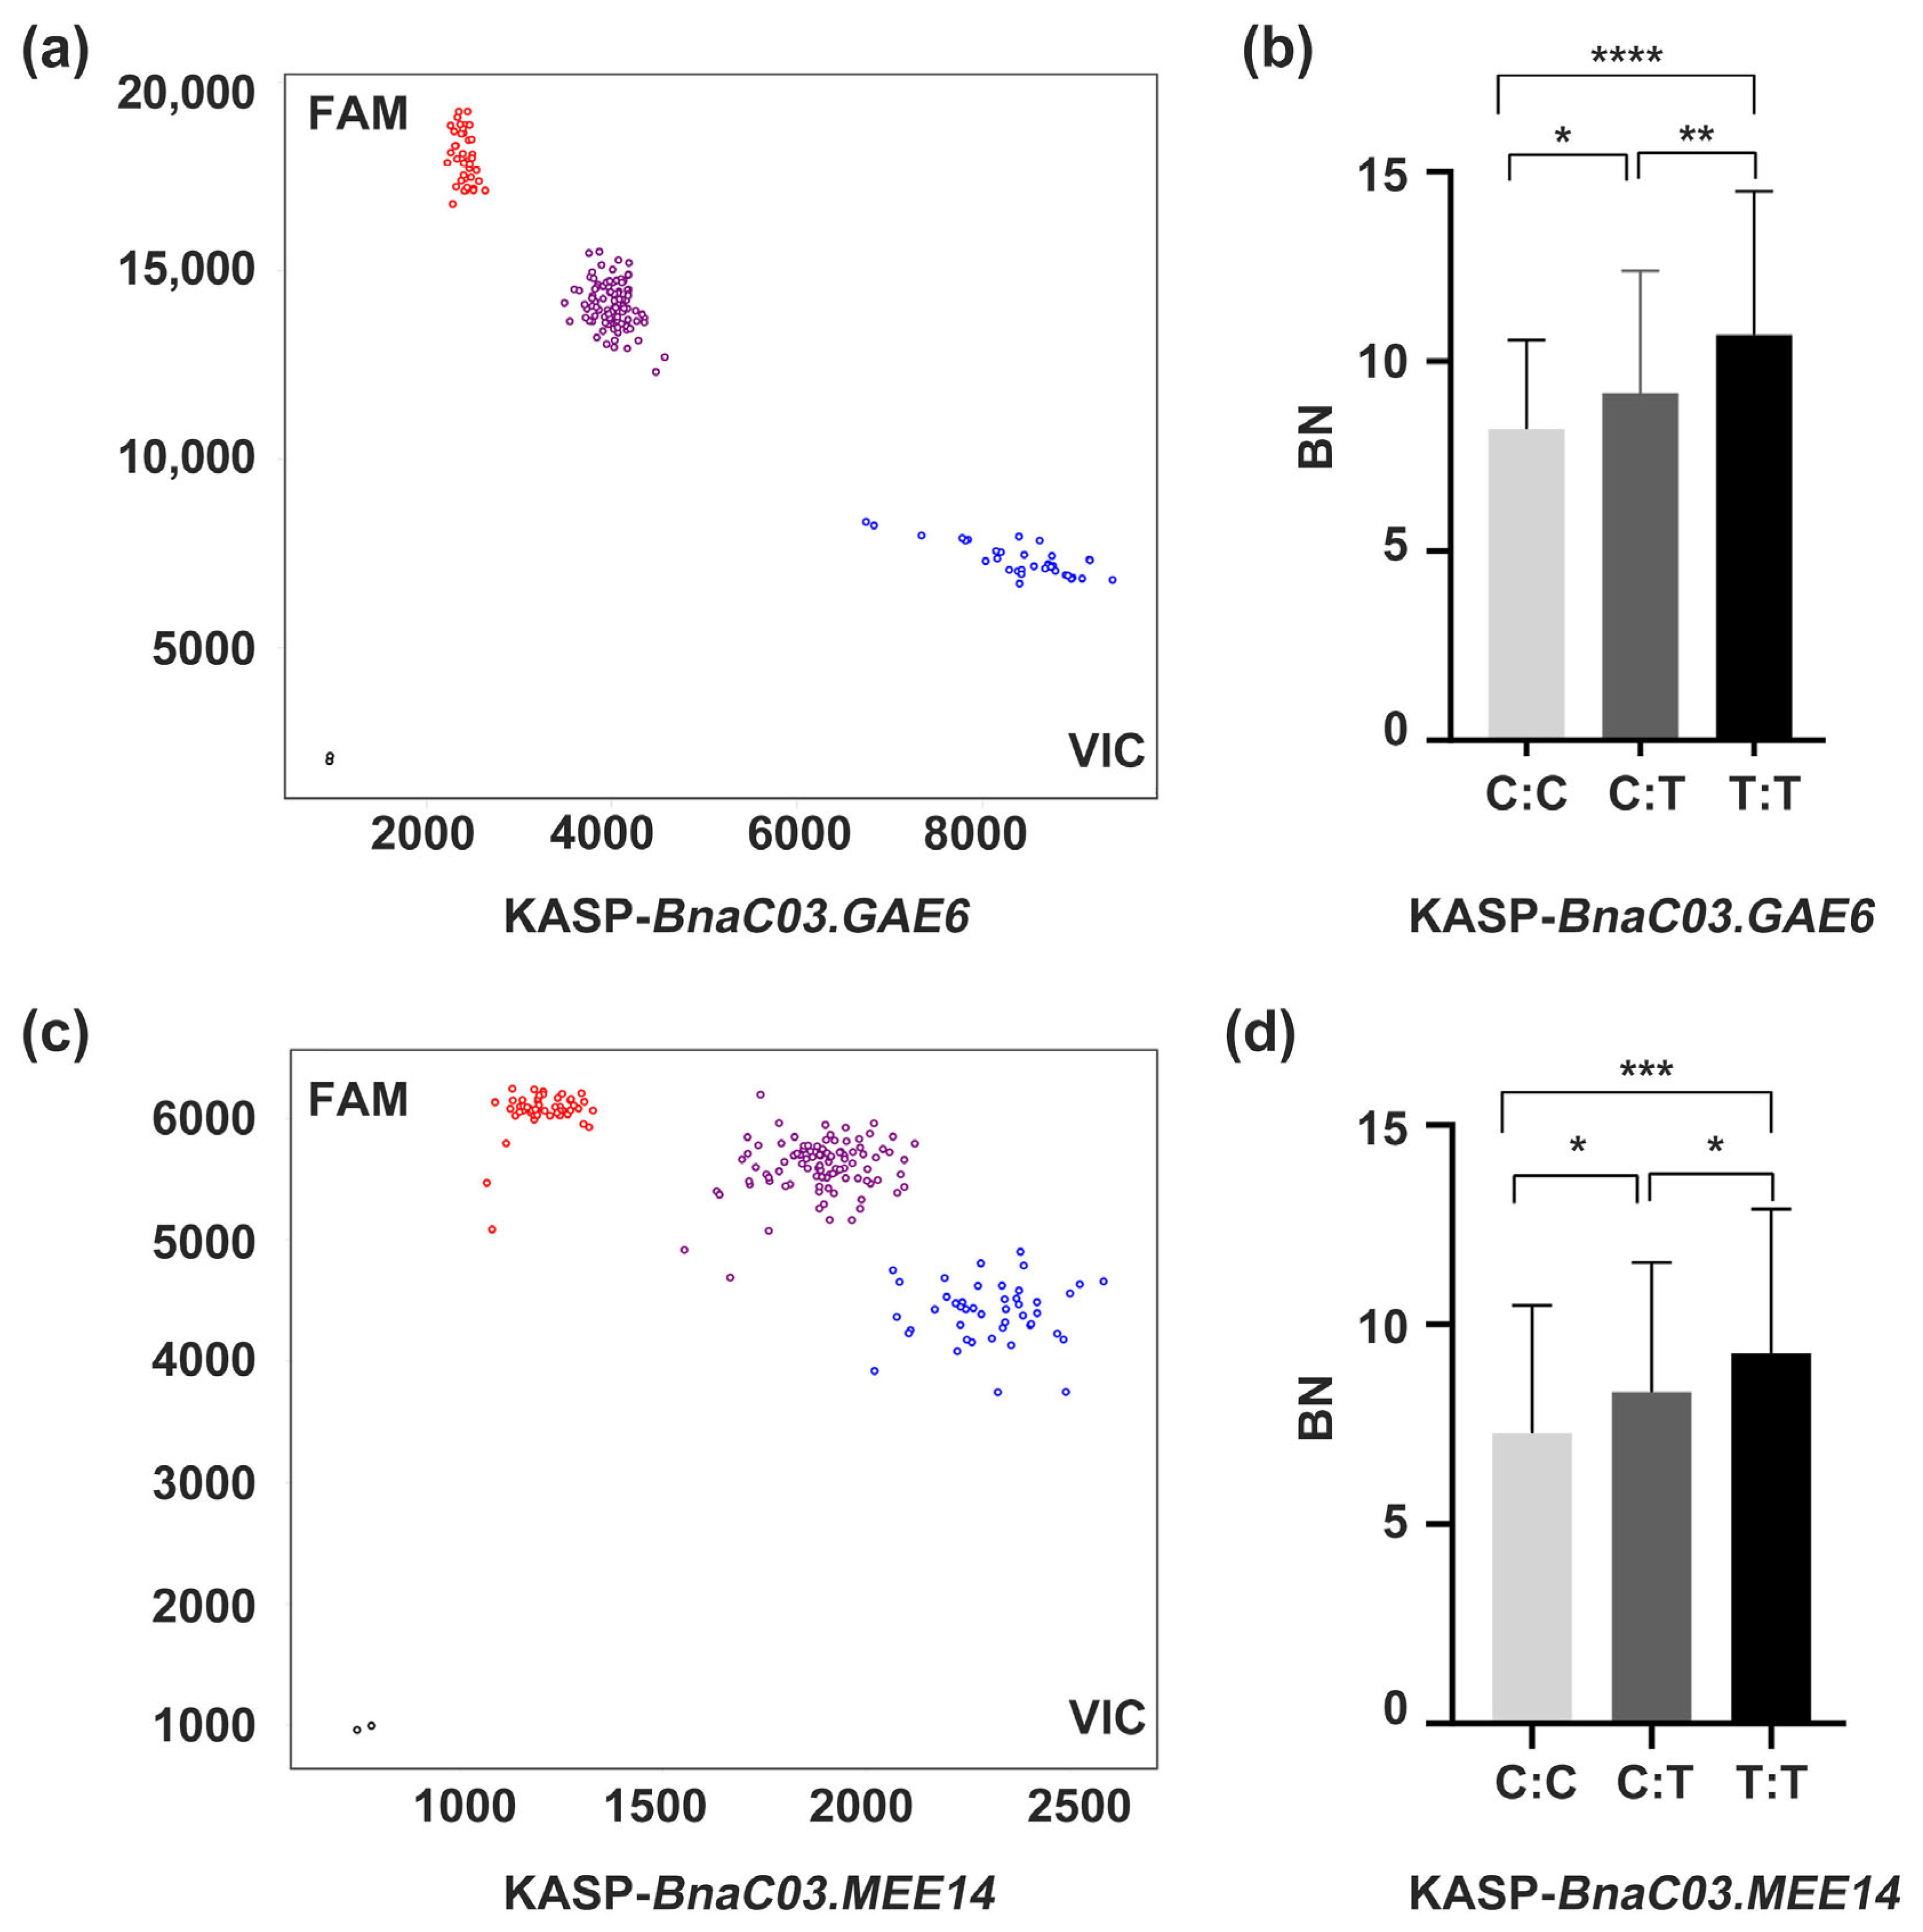
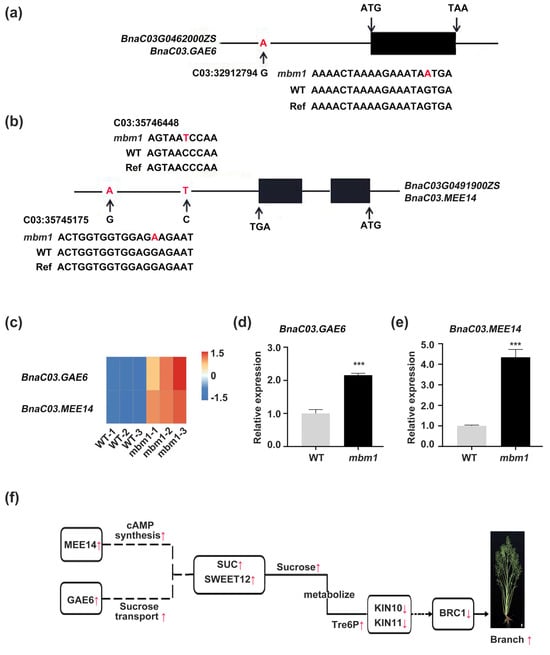
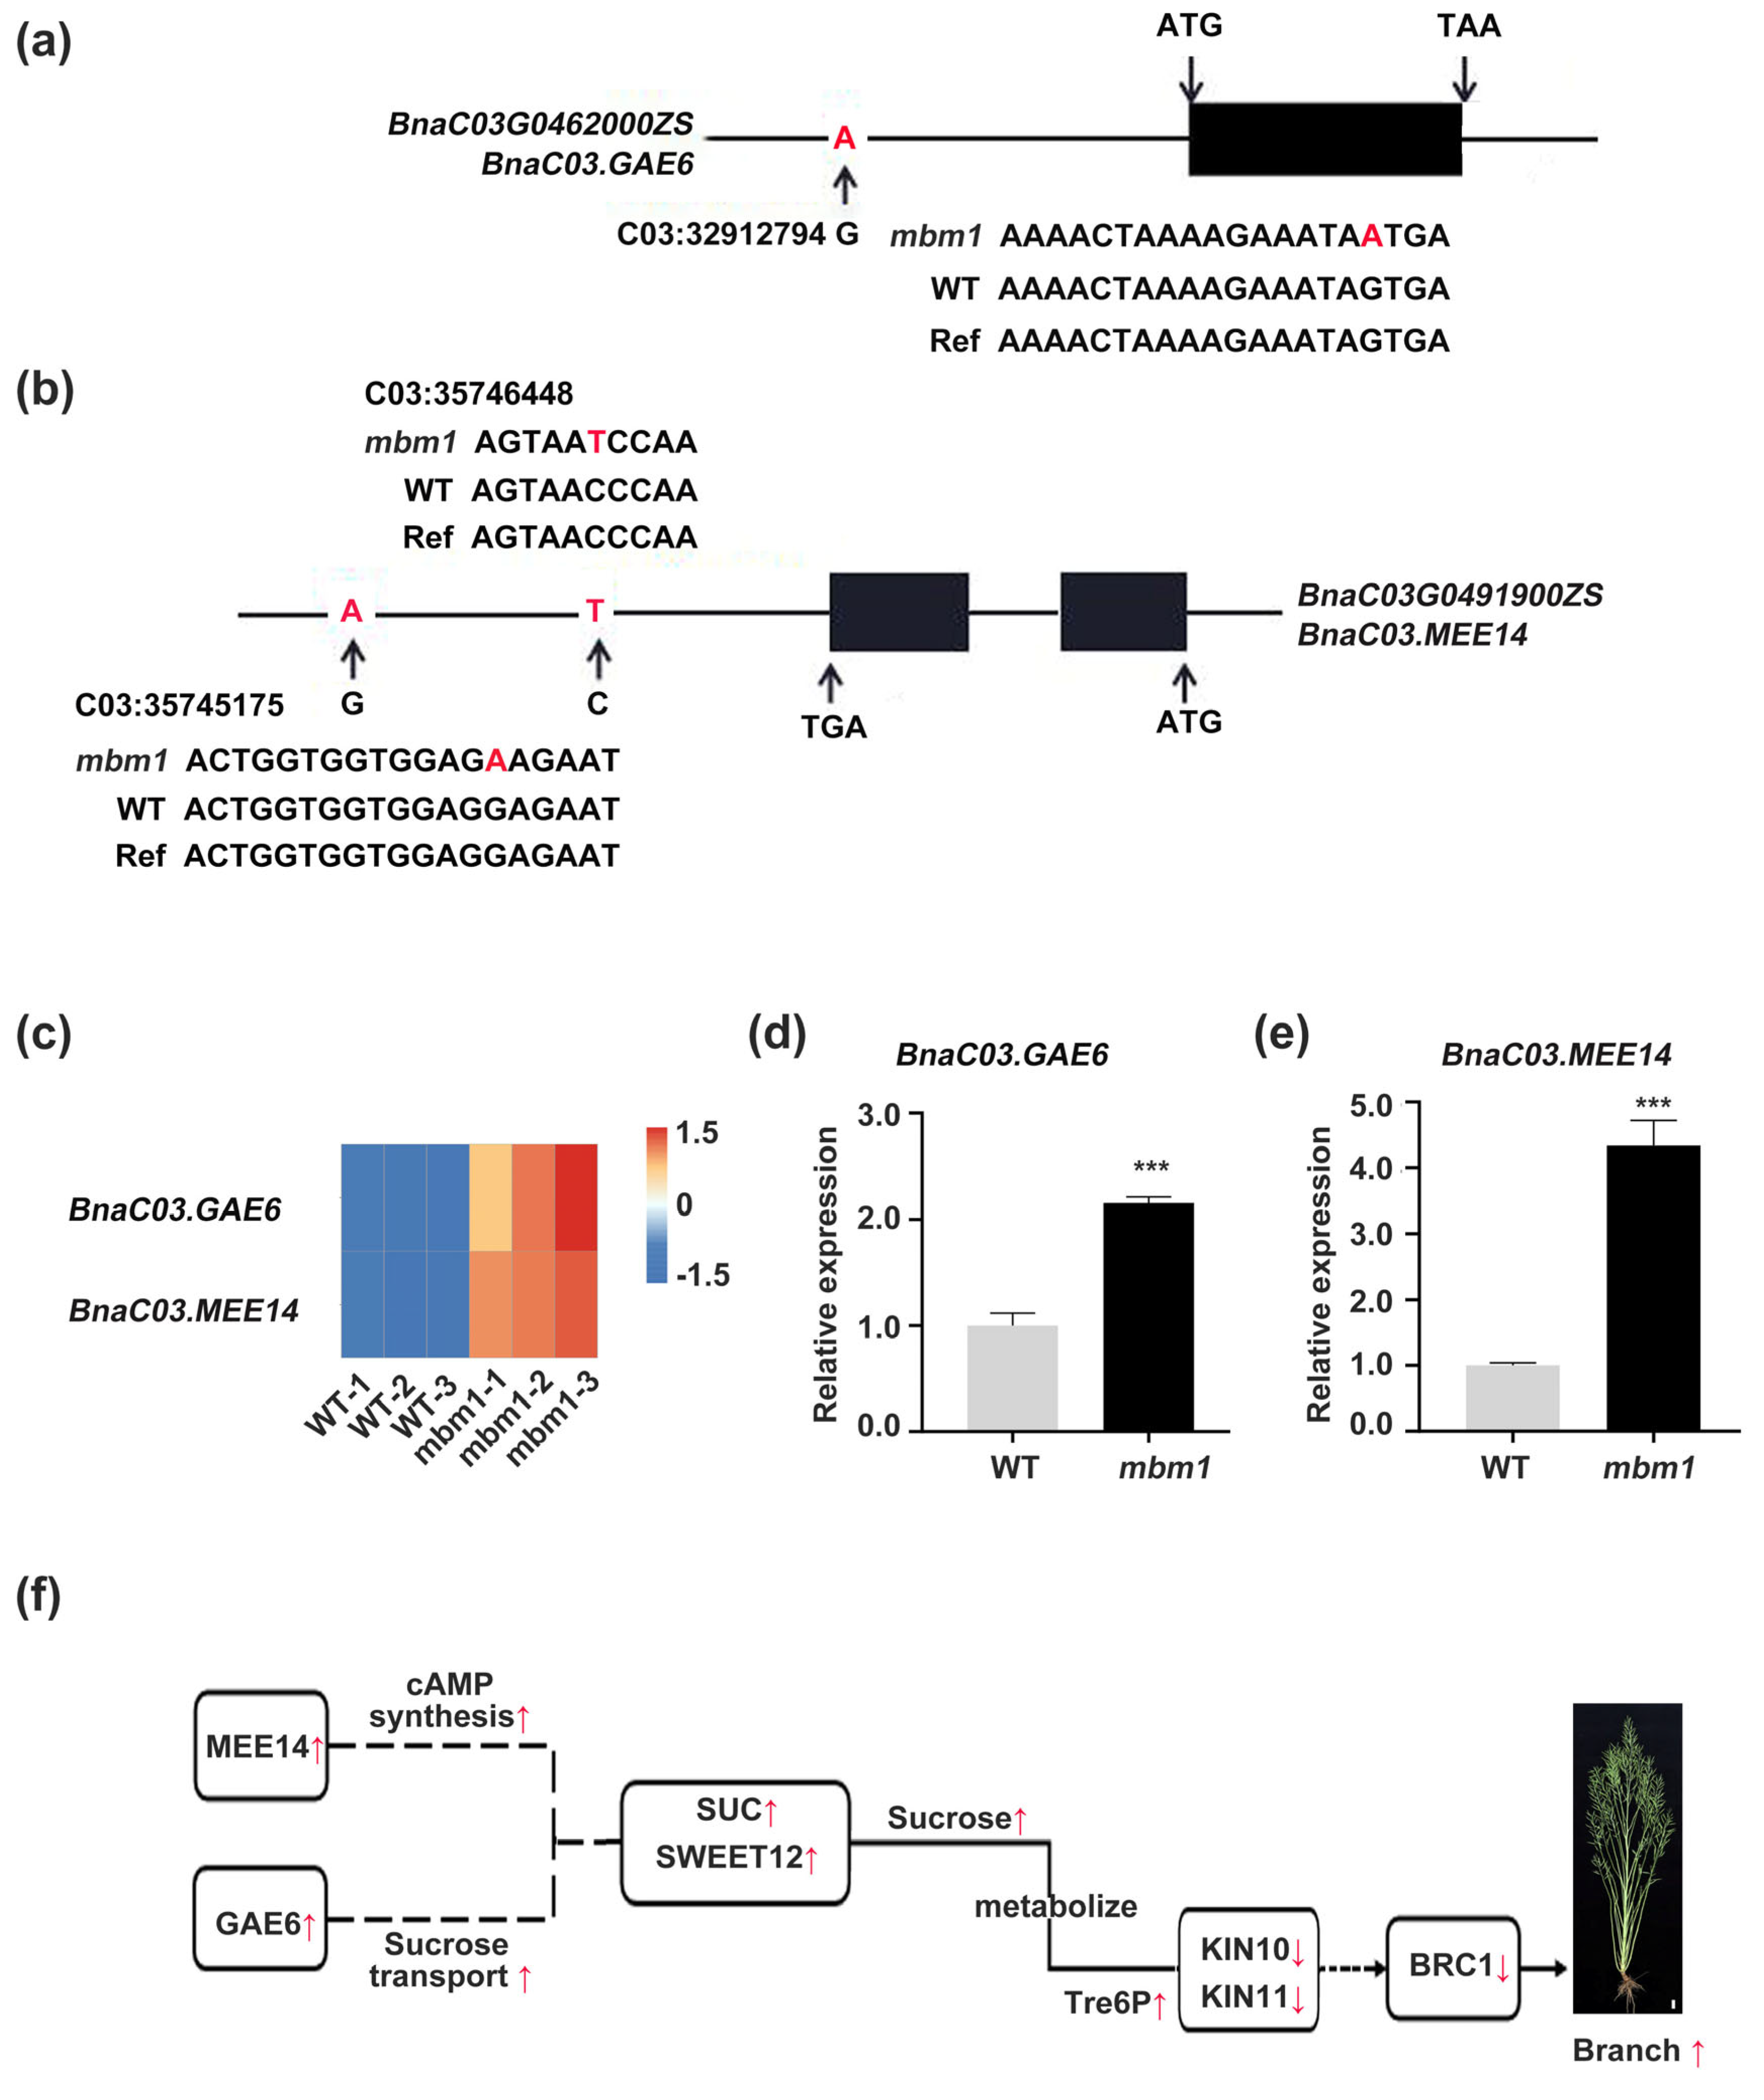
Disclaimer/Publisher’s Note: The statements, opinions and data contained in all publications are solely those of the individual author(s) and contributor(s) and not of MDPI and/or the editor(s). MDPI and/or the editor(s) disclaim responsibility for any injury to people or property resulting from any ideas, methods, instructions or products referred to in the content. |
© 2026 by the authors. Licensee MDPI, Basel, Switzerland. This article is an open access article distributed under the terms and conditions of the Creative Commons Attribution (CC BY) license.