Article

Early Pro-Inflammatory Remodeling of HDL Proteome in a Model of Diet-Induced Obesity: 2H2O-Metabolic Labeling-Based Kinetic Approach

1
Department of Pharmacy Practice, College of Pharmacy, Northeast Ohio Medical University, Rootstown, OH 44272, USA
2
Department of Pharmaceutical Sciences, College of Pharmacy, Northeast Ohio Medical University, Rootstown, OH 44272, USA
*
Authors to whom correspondence should be addressed.
Int. J. Mol. Sci. 2020, 21(20), 7472; https://doi.org/10.3390/ijms21207472
Submission received: 11 September 2020 / Revised: 6 October 2020 / Accepted: 7 October 2020 / Published: 10 October 2020

Abstract

:
Mice fed a high-fat diet for 12 weeks or longer develop hyperglycemia, insulin resistance, dyslipidemia, and fatty liver. Additionally, a high-fat diet induces inflammation that remodels and affects the anti-inflammatory and antiatherogenic property of the high-density lipoprotein (HDL). However, the precise time course of metabolic disease progression and HDL remodeling remains unclear. Short-term (four weeks) high-fat feeding (60% fat calories) was performed in wild-type male C57BL/6J mice to gain insights into the early metabolic disease processes in conjunction with a HDL proteome dynamics analysis using a heavy water metabolic labeling approach. The high-fat diet-fed mice developed hyperglycemia, impaired glucose tolerance, hypercholesterolemia without hypertriglyceridemia or hepatic steatosis. A plasma HDL proteome dynamics analysis revealed increased turnover rates (and reduced half-lives) of several acute-phase response proteins involved in innate immunity, including complement C3 (12.77 ± 0.81 vs. 9.98 ± 1.20 h, p < 0.005), complement factor B (12.71 ± 1.01 vs. 10.85 ± 1.04 h, p < 0.05), complement Factor H (19.60 ± 1.84 vs. 16.80 ± 1.58 h, p < 0.05), and complement factor I (25.25 ± 1.29 vs. 19.88 ± 1.50 h, p < 0.005). Our findings suggest that an early immune response-induced inflammatory remodeling of the plasma HDL proteome precedes the diet-induced steatosis and dyslipidemia.

Graphical Abstract

1. Introduction

It is common for diet-induced metabolic disturbances to manifest as a spectrum of conditions including adiposity, hyperinsulinemia, hyperglycemia, hepatic steatosis, and dyslipidemia [1]. The downstream cardiovascular sequelae of these metabolic disorders, including atherosclerosis, cause significant human morbidity and mortality [2]. The growing epidemic of these cardiometabolic conditions has necessitated an urgent need for a thorough understanding of the development and progression of these diseases. Furthermore, the chronic nature of these conditions and the fact that they often go undetected for several years has emphasized the need for the early indicators of metabolic disturbances [3,4].
The convergence of these multiple diet-induced metabolic disturbances is a significant clinical challenge. Among the animal models used to replicate this human clinical syndrome is high-fat diet (HFD) feeding in mice [5]. The pathophysiological changes produced due to caloric overload associated with high-fat intake mimics the clinical metabolic disease with high fidelity. This model of HFD-induced obesity in mice is marked by hyperinsulinemia, hyperglycemia, non-alcoholic fatty liver disease (NAFLD), and a dysregulated lipoprotein profile—high low-density lipoprotein (LDL)-cholesterol, decreased high-density lipoprotein (HDL)-cholesterol (HDL-C), and hypertriglyceridemia. In addition to the nutritional disbalance, dietary fat intake is also known to result in underlying “low-grade systemic inflammation”. The role of systemic inflammation in the pathogenesis of metabolic diseases, including obesity-associated type 2 diabetes mellitus, NAFLD, and atherosclerotic cardiovascular disease (CVD) is now widely recognized [6,7]. Additionally, the serum levels of HDL are inversely related to CVD risk. However, not merely the levels of HDL, but the composition of HDL particles ultimately determines the CVD risk. Recently more than 100 HDL-associated proteins with distinct functions have been characterized [8]. Alterations in HDL proteome composition can compromise HDL functions and increase CVD risk. Inflammation can profoundly remodel the HDL proteome composition and inhibit its antioxidant, reverse cholesterol transport, and other atheroprotective properties [9,10].
Various strains of mice (C57BL/6J, ob/ob, AKR/J, BALB/c) and rats (Sprague–Dawley, Wistar, Zucker, Lewis, Osborne) have shown a varying degree of susceptibility for the development of diet-induced obesity [11,12,13,14]. A commonly used HFD study design is feeding male wild-type C57BL/6J mice an HFD for 12–16 weeks. At the completion of this feeding regimen, mice exhibit the full spectrum of metabolic disorders discussed above [5]. The animal models generated using these relatively long-term feeding studies have significant application in the study of various interventions, including genetic or pharmacological ones [15]; however, they have limited utility in the elucidation of early steps involved in disease manifestation and progression. While there is evidence for insulin resistance even as early as three days after the onset of HFD feeding [16], the timescale of development of early inflammatory signature remains unknown. In particular, the effects of short-term duration of HFD feeding (e.g., four weeks) on metabolic parameters and the underlying pathophysiological processes have not been studied in detail. A previous report has suggested the impairment of glucose tolerance during HFD feeding occurs over two distinct phases—an early phase over the first week of feeding characterized by an acute-phase response and a delayed phase between 12–16 weeks of feeding characterized by inflammation in the adipose tissue and skeletal muscle [17]. Other studies have assessed the time-dependent progressive changes in the metabolic parameters upon HFD feeding [18]; however, the role of the acute-phase response in the HDL proteome composition in short-term HFD feeding has not been evaluated.
In the early stages of metabolic diseases, the compensatory mechanisms protect against the full-blown metabolic disturbances associated with the changes in static levels of metabolites and proteins. In contrast to static measurements representing the net results of synthesis and degradation, the kinetic analysis of circulatory metabolites and proteins can detect early changes in physiological homeostasis [19]. In this study, we have examined the extent of metabolic disturbances at four weeks after the initiation of HFD in male mice using biochemical and stable isotope-based kinetic analyses. We specifically focused on HDL-associated proteins as they are sensitive to diet-induced inflammation and are involved in reverse cholesterol transport, anti-inflammatory, antioxidant, and antithrombotic functions of HDL that protect against atherosclerosis [20].

2. Results

The present study used a combination of biological and analytical methods to detail the early metabolic perturbations, including those involved in lipid and glucose homeostasis, in an HFD-induced obesity model. Additionally, we analyzed the plasma HDL proteome dynamics to gain unique insights into concurrent changes in HDL proteome composition using a heavy water-based (2H2O, a non-radioactive isotope) metabolic labeling approach [21]. This method is based on the rationale that a loading dose of 2H2O rapidly labels amino acids prior to their incorporation into newly made proteins. The rate of labeled amino acids incorporation into the specific protein depends on the rate of synthesis of the protein. Tryptic peptides are analyzed by high-resolution mass spectrometry and protein turnover rates are assessed based on 2H enrichment of peptides (Figure 1) [22]. We have previously applied this method to a mouse model of NAFLD and demonstrated that HFD results in an increased degradation of plasma and hepatic mitochondrial proteins [23,24,25].

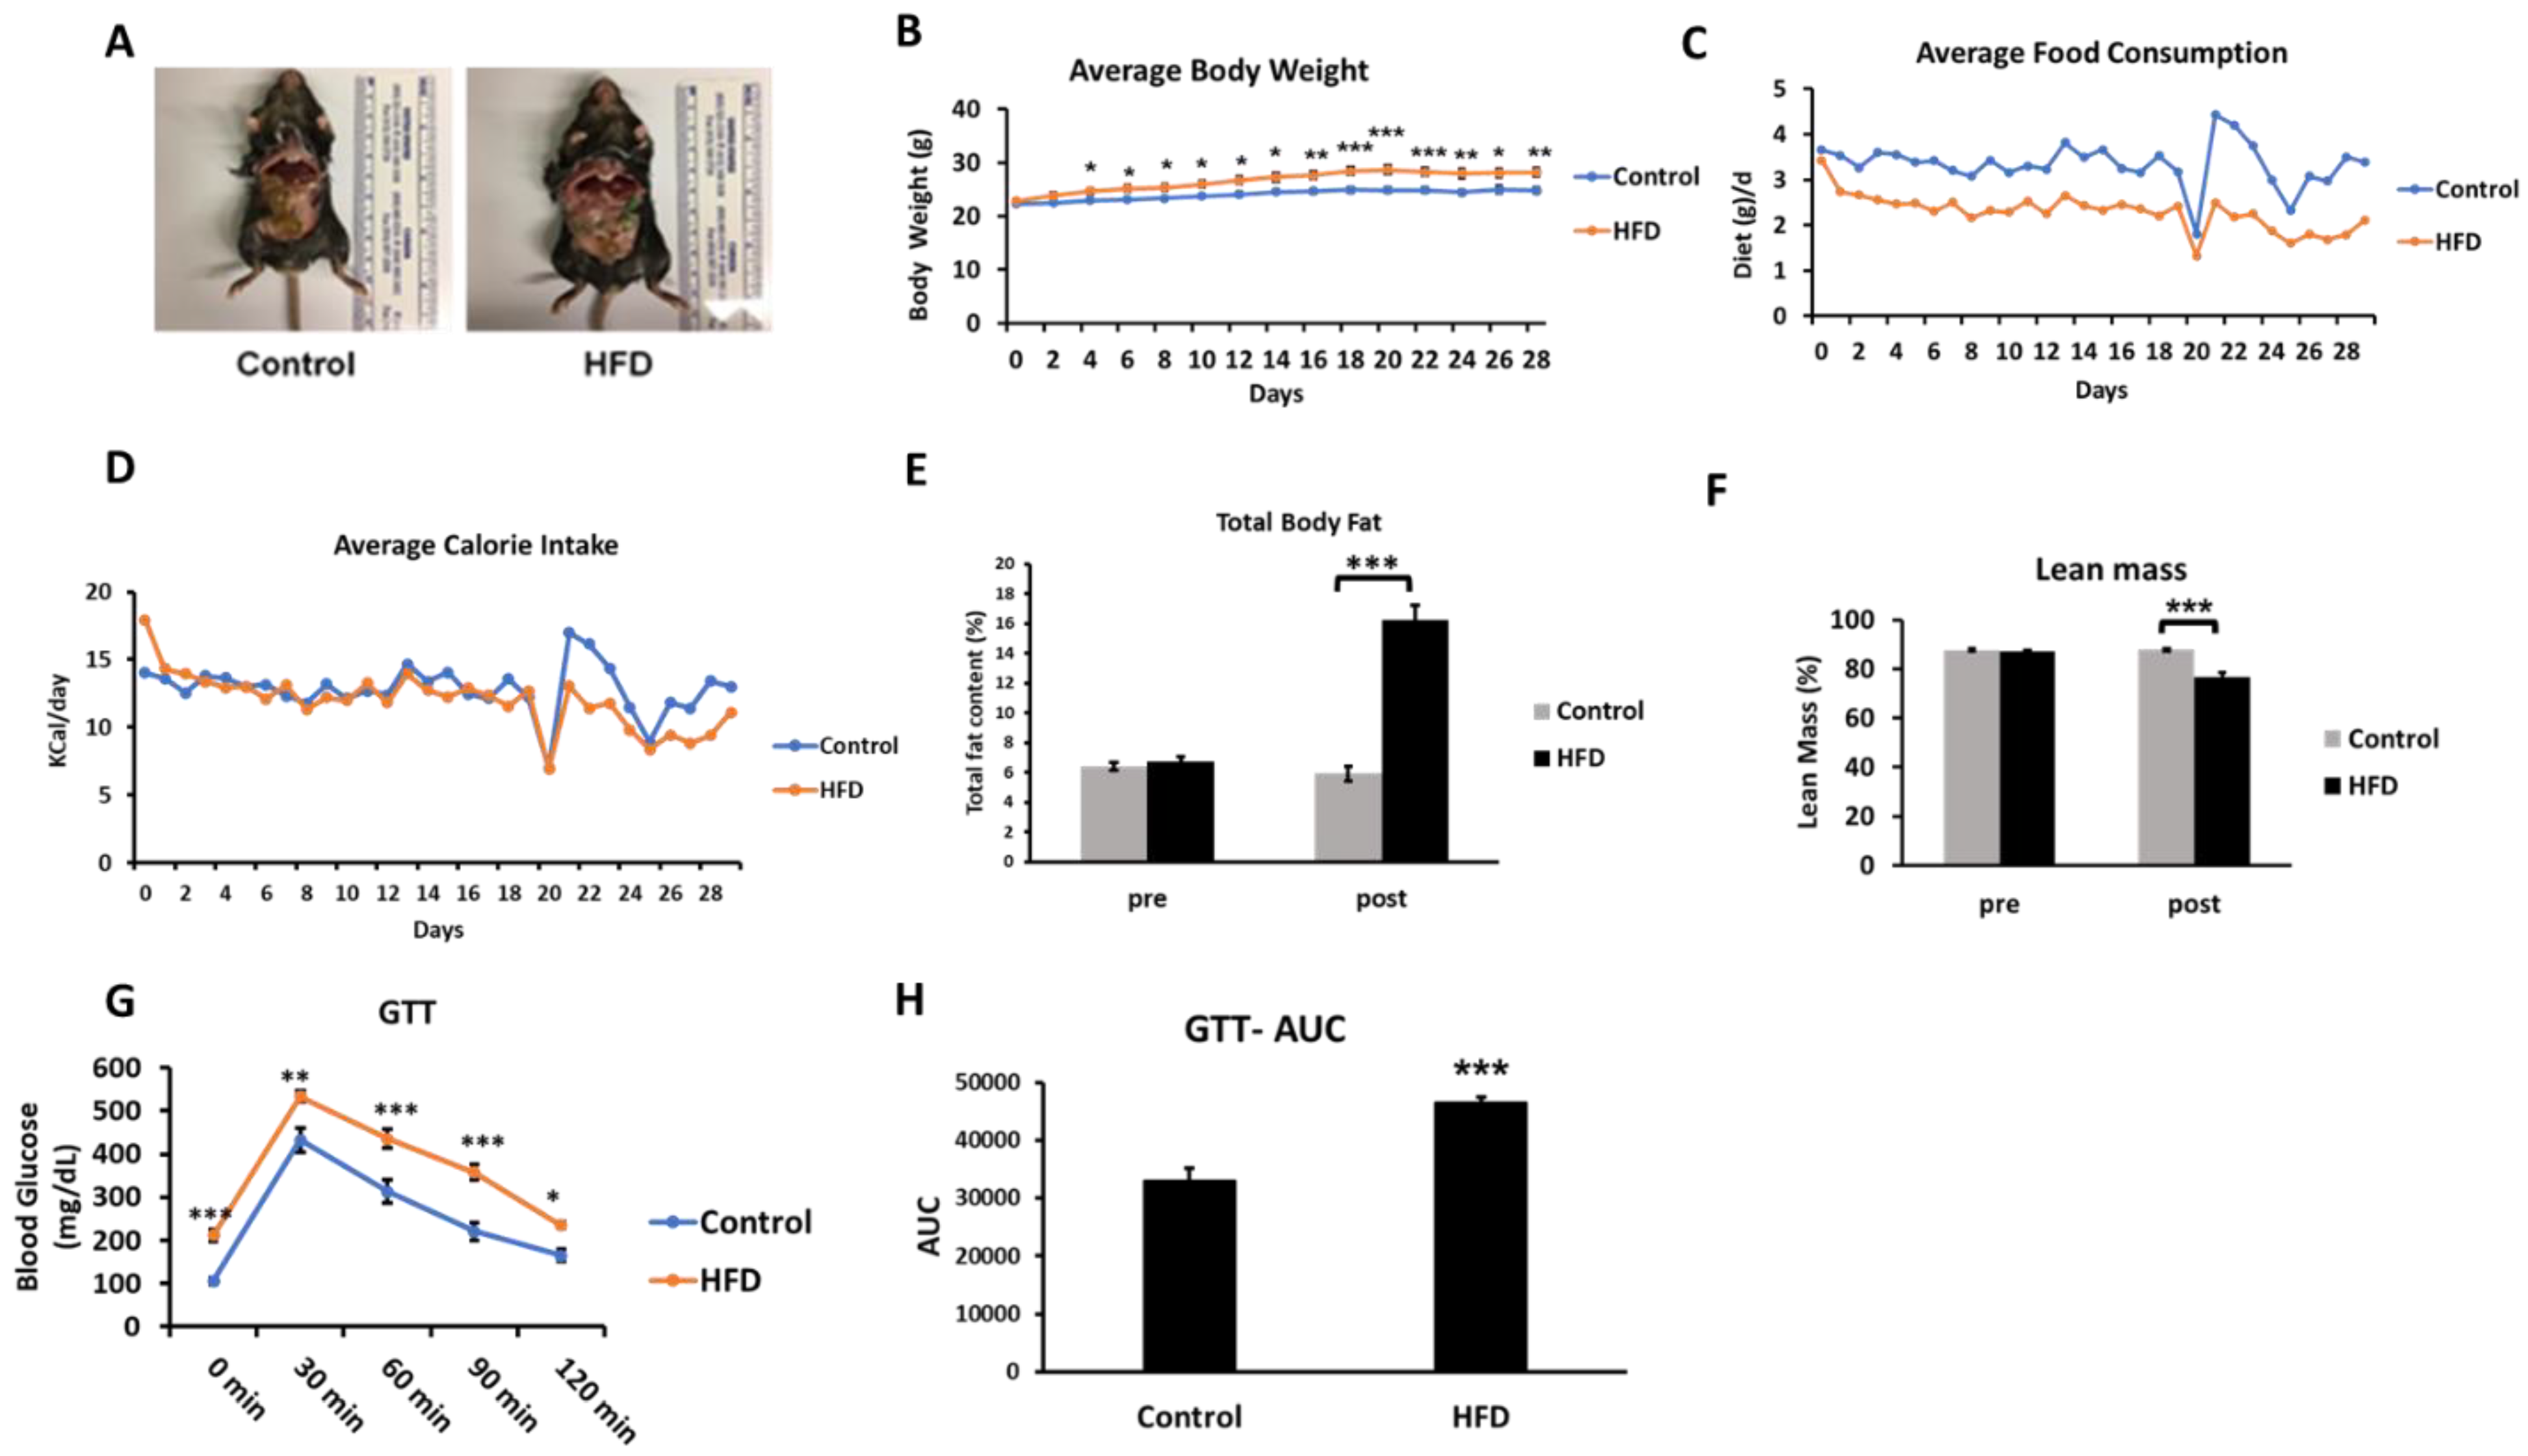
2.1. HFD Induces Partial Perturbation of Metabolic Profile at Four Weeks of Feeding

Since the metabolic disturbances precede the disease onset, the present study was designed with the deliberate focus on identifying early events in metabolic diseases, including NAFLD. Notably, the literature reported that the lengths of “short-term” diet feeding are inconsistent with durations ranging from three days to eight weeks. In the present study, the four-week HFD feeding duration is sufficiently long enough to induce pathophysiological changes that initiate the development of metabolic disease without establishing the complete disease phenotype.
The HFD consumption for four weeks led to an obesogenic effect with mice showing a generally increased adiposity and increased body weight (Figure 2A,B). While the HFD group showed lower average daily food consumption (in grams) (Figure 2C), the two groups were evenly matched in respect to kilocalories consumed each day (Figure 2D). A body composition analysis revealed a significant increase in total body fat in the HFD group (fat content (%), 5.95 ± 0.27 vs. 16.22 ± 0.32, control vs. HFD, respectively) (Figure 2E). A statistically significant decrease in lean mass (%) was observed in the HFD group (76.73 ± 1.58) over the control group (87.76 ± 0.65) (Figure 2F). The HFD mice showed basal fasting hyperglycemia (Figure 2G) and impaired glucose tolerance assessed in the third week of the feeding protocol. The increased area under the curve in the glucose tolerance test is suggestive of insulin resistance in the HFD mice (Figure 2H). This is consistent with previous studies demonstrating insulin resistance based on glucose tolerance tests and hyperinsulinemia even as early as three days after an HFD feeding regimen [16]. The hyperglycemia observed in these mice (211.7 ± 13.5 mg/dL) was in the prediabetes range [26].
The metabolic and biochemical characterization show that -four-week HFD consumption results in a partially developed metabolic syndrome phenotype (Table 1). The HFD mice show a statistically significant increase in plasma total cholesterol (TC), HDL-C, and non-HDL cholesterol (non-HDL-C), over the control mice. HDL-C comprises the majority of the plasma cholesterol pool in the C57Bl/6J mice [27] and an increase in HDL-C upon HFD feeding has been reported previously [28]. Importantly, non-HDL-C, a well-established indicator of pro-atherogenic Apo-B-containing lipoproteins, was increased upon HFD feeding (p < 0.05). Additionally, the TC/HDL-C ratio, another measure of cardiovascular risk, showed an increasing trend, although it did not reach statistical significance [29]. Although the biochemical analysis revealed increased hepatic triglyceride (TG) contents, the histological staining of liver sections showed an absence of steatotic changes upon HFD feeding (Supplementary Figure S1). Importantly, the hepatic TGs, although elevated, were at least 5- to 10-fold lower than previously reported steatotic levels after a 12–16-week HFD feeding [30]. Interestingly, while plasma lipoprotein lipase (LPL) activity showed a statistically significant decrease, the plasma TG levels were essentially unchanged. Overall, the 4-week high-fat feeding results in a metabolic profile that is transitional compared to 12–16-week feeding; while some elements of metabolic derangements are evident (hyperglycemia, insulin resistance, cholesterol changes), other aspects (TG changes in the blood and liver) have not yet manifested.

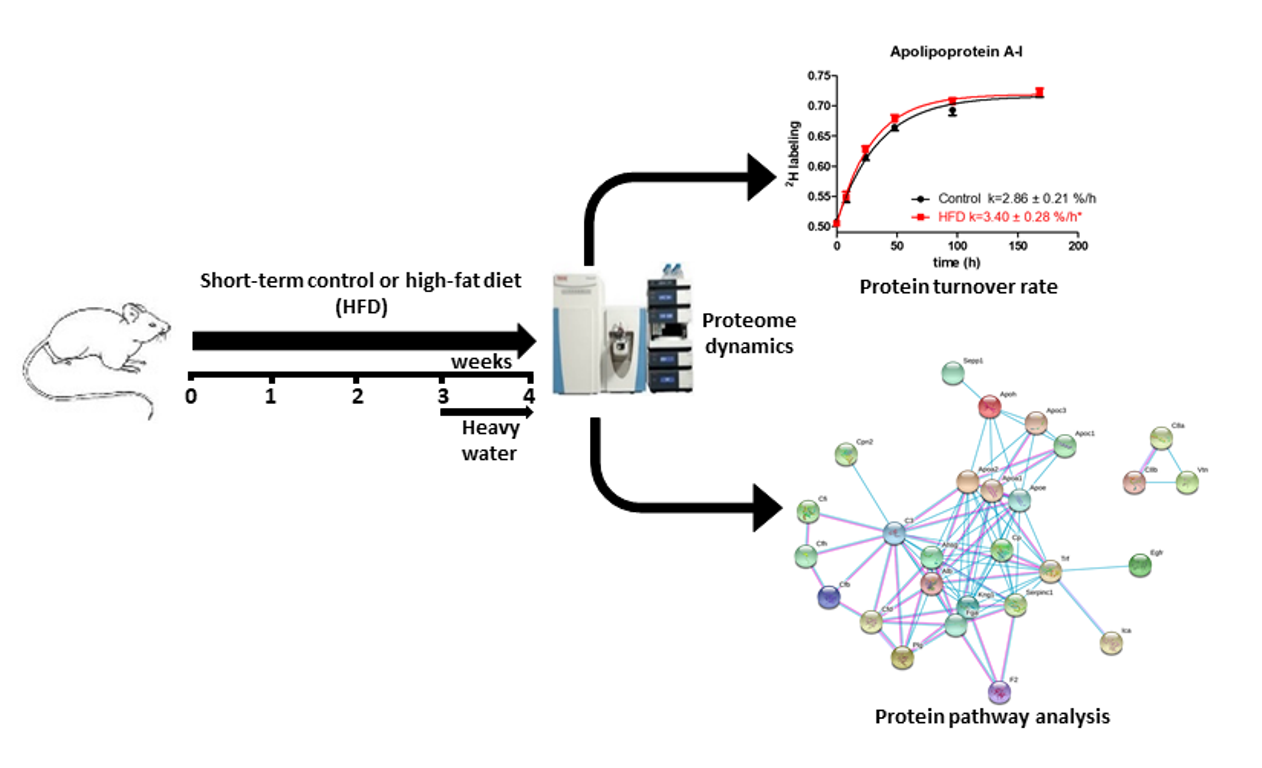
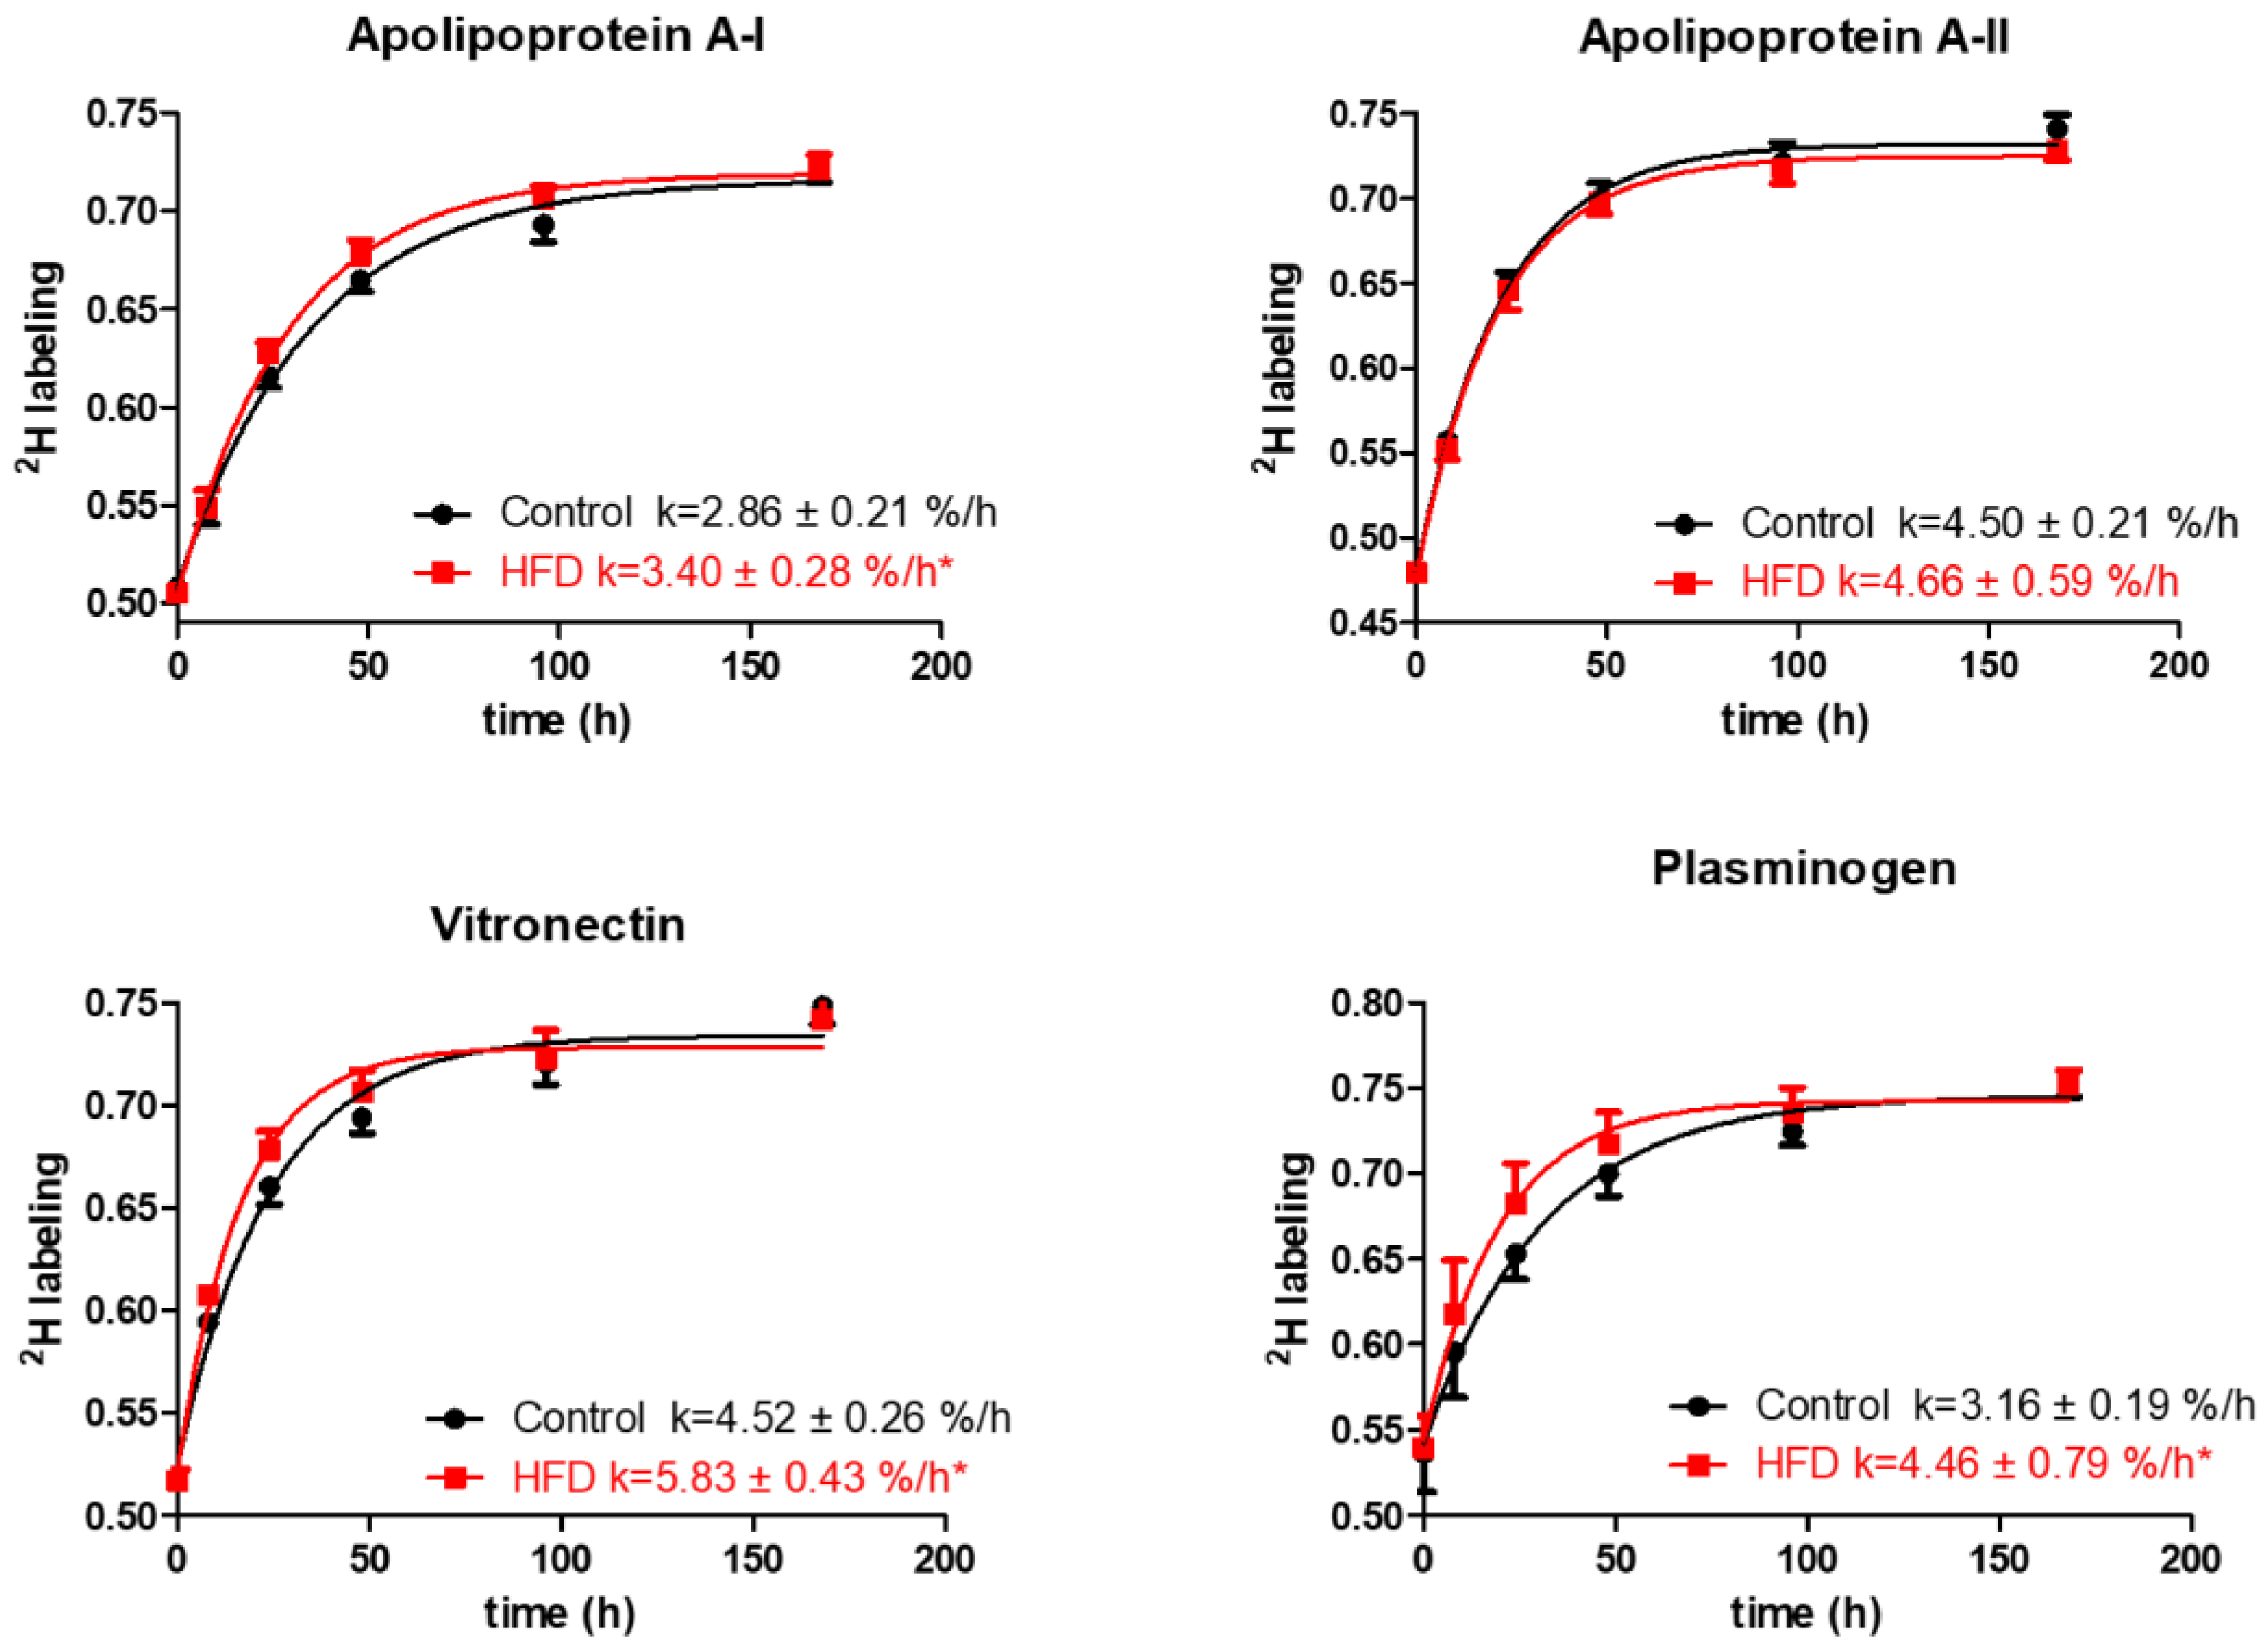
2.2. Effect of Short-Term HFD on Plasma HDL Proteome Dynamics

A key effect of HFD-induced chronic low-grade inflammation is an alteration in the functions of the protein cargo of the HDL particles [10]. In addition to apolipoproteins, HDL carries several other protein families including those involved in the complement activation, lipid transfer, acute-phase response, immune response, anti-inflammatory pathways, proteinase inhibitors, and others. Proteins associated with HDL are continuously exchanged with other apolipoprotein B (ApoB)-containing lipoprotein particles, synthesized, and removed from circulation through degradation. Therefore, the static measurements of HDL proteins may not reveal alterations in the dynamics of the HDL proteome. To understand early diet-induced changes in these metabolic diseases and their CVD complications, we examined the effect of four weeks of HFD on plasma HDL proteome dynamics.
Different HDL isolation methods have been used to analyze the HDL proteome. The effect of ApoB depletion, a well-established method for HDL isolation, on the HDL proteome composition has been characterized [31]. It was demonstrated that among multiple ApoB-depletion methods, ApoB-precipitation with dextran sulfate/MgCl2 does not affect the HDL proteome composition. Recently, we demonstrated that ApoB-depletion is compatible with the immunocapture method that is known to preserve the HDL composition [32]. Thus, in this study, we used shotgun proteomics to monitor the kinetics of HDL proteins in ApoB-depleted plasma.
Protein turnover was quantified using 2H2O as a tracer and high-resolution mass spectrometry. Briefly, after three weeks of the diet experiment, each mouse was loaded with a bolus of heavy water (30 μL/g body weight, 99.99% isotopic and chemical purity) followed by 8% (v/v) heavy water in drinking water for seven days. According to this method, the time course of 2H-enrichment in unique peptides allows the estimation of the fraction of a protein pool that is newly synthesized. The high sensitivity of this method allows the assessment of the HDL dynamics in a single mouse by collecting multiple small blood samples (~60 μL) from the same animal at different time points [33]. The major criteria for the kinetic analysis using this method are a sufficiently high intensity of analyzed isotopomers (106–108 ion counts) and the presence of the same tryptic peptide in 5 to 6 time points that restricts the number of quantifiable proteins.
Our labeling protocol resulted in ~5% body water enrichment in mice (Figure 3A). A total of 96 and 89 proteins were identified in ApoB-depleted plasma in all animals from the control and HFD groups, respectively. Overall, 78 of these proteins were present in both groups. Due to the stringent criteria listed above, the kinetics of only 35 proteins could be accurately quantified in all animals from both groups. Each of these proteins has previously been characterized in HDL particles [34]. The proteome dynamics study revealed that the HFD resulted in increased turnover rates (i.e., a reduced half-life) of two-thirds (67%) of all analyzed proteins (Table 2). The average half-life of HDL-associated proteins was significantly reduced in HDL isolated from HFD-fed mice (23.52 ± 8.8 h in control vs. 19.23 ± 7.39 h in HFD, p < 0.05) (Figure 3B). This effect of HFD on plasma HDL protein kinetics was also shown in a scatter plot of the half-life of proteins in the HFD group relative to the control group (Figure 3C). In addition to a significant correlation of half-lives of proteins in control and HFD groups (r2 = 0.938, p < 0.0001), the slope of the regression curve (0.83) indicates that the mean half-life of proteins was reduced by ~17% due to four weeks of HFD consumption in mice.
The analysis of quantified proteins shows that the HFD resulted in a significant increase in turnover rates of several proteins involved in lipid metabolism and transport, thrombosis, and acute-phase responses. Particularly, the HFD results in an increased turnover of ApoA-I, the principal protein of HDL involved in cholesterol transport (2.86 ± 0.21 vs. 3.40 ± 0.28 %/h, p < 0.001, Figure 4).
Additionally, HFD also increased the turnover rates and reduced half-lives of vitronectin, prothrombin, and plasminogen, the HDL proteins with antithrombotic activities (Figure 4, Table 2). Vitronectin binds to integrin and consequently promotes cell adhesion [35]. It also inhibits the detrimental effects of the complement system on the membranes that result in increased permeability of vessels and the initiation of inflammatory atherosclerotic processes [36]. Plasminogen serves as a precursor for plasmin, a serine protease that helps to dissolve clots in circulation [37]. The increased turnover of these proteins in our study suggests their compensatory enhanced synthesis in response to HFD-induced inflammation. The HFD also significantly increased the turnover rate of albumin, reducing its half-life (76.93 ± 7.49 vs. 66.08 ± 6.13 h, p < 0.001) (Table 2). Previous studies have identified albumin as an HDL-associated protein [38,39,40]. However, it also likely that albumin could present as a contaminant in the HDL purification process, although the possibility of such contamination was not investigated in these samples. Similarly, reduced half-lives were observed for ceruloplasmin and serotransferrin and other acute-phase proteins involved in oxidative defense, immune responses, and iron metabolism. Intriguingly, the turnover study also revealed a strong effect of HFD on the kinetics of multiple proteins involved in complement pathway activation. For example, HFD increased the turnover rates of C3 and complement factors B, D, I, and H (p < 0.05), components of the alternative complement pathway. Similar boosts in turnover were observed for C8 and clusterin, proteins of the terminal complement pathway (all p < 0.05). Although the HFD significantly enhanced the turnover of the majority of the analyzed proteins, the kinetics of some proteins remained unchanged. We did not observe a significant change in the turnover of hemopexin, fibrinogen alpha, and other proteins (Table 2). In addition, HFD had only a modest effect on the turnover of proteins involved in lipid metabolism, including ApoA-II, ApoE, ApoC-I, and ApoC-III.

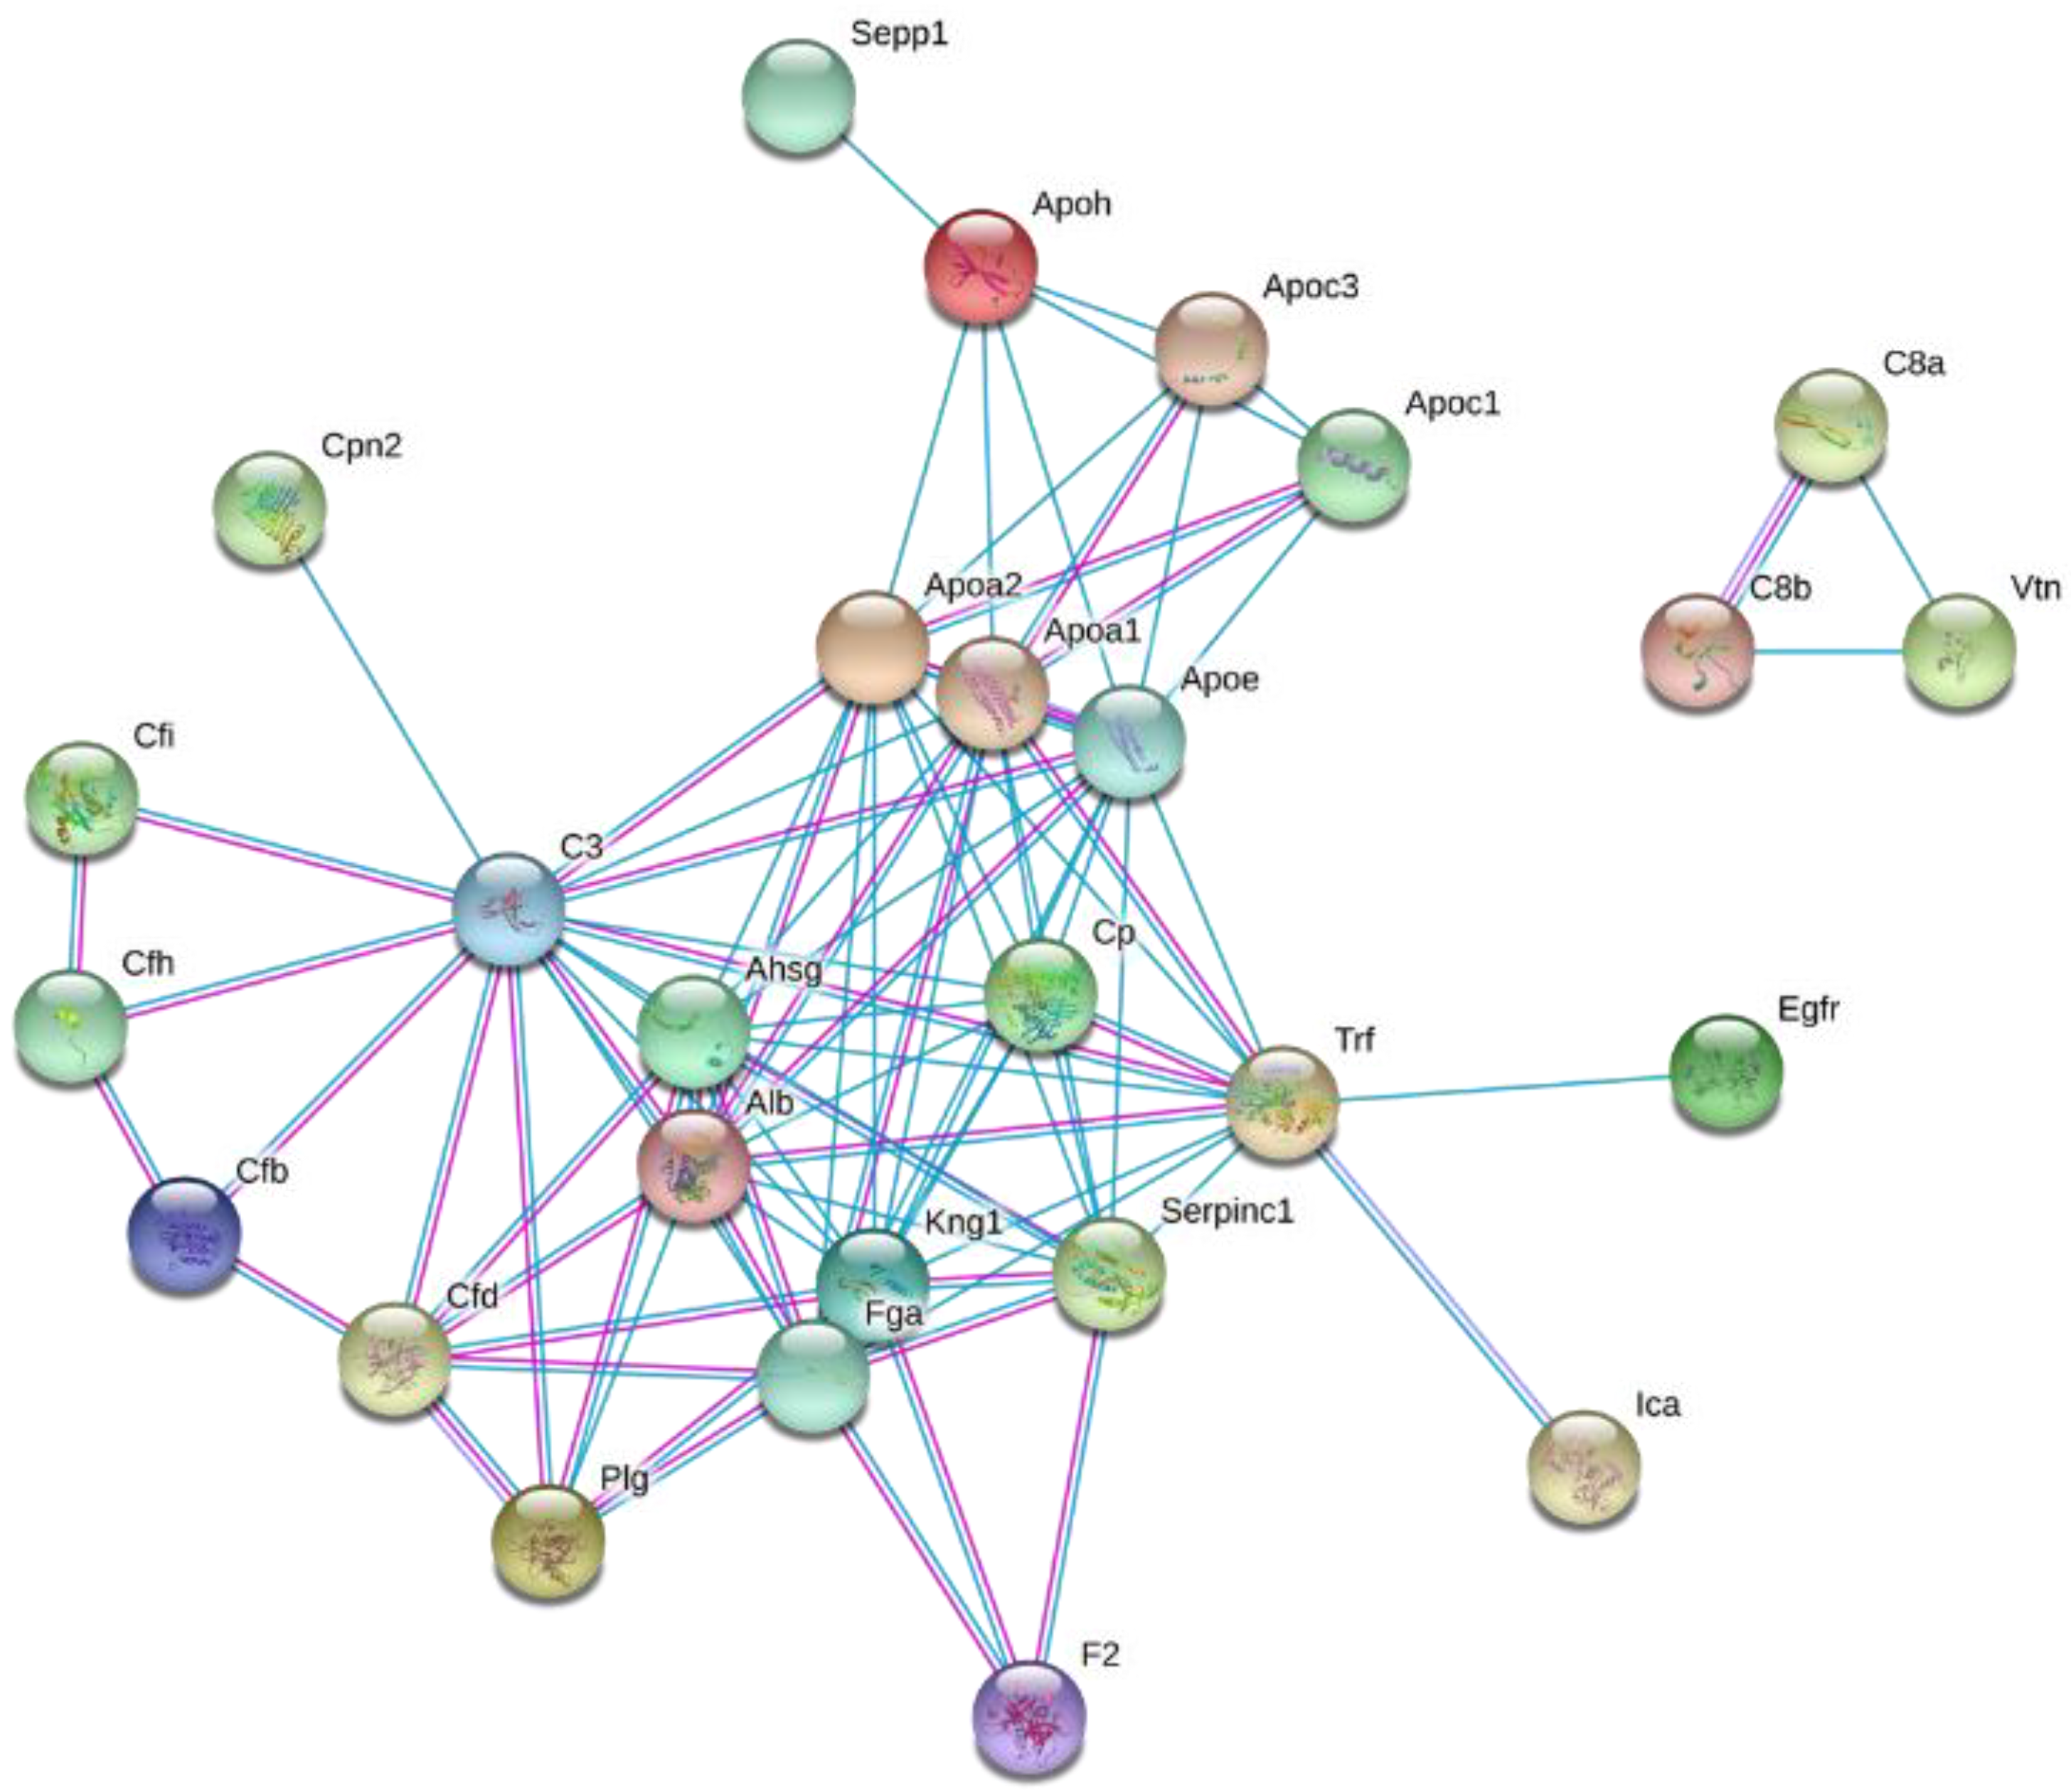
2.3. Pathways Associated with the HFD-Induced Alterations in Plasma HDL Proteome Dynamics

To explore the biological significance of the altered plasma HDL proteome dynamics in the context of diet-induced obesity, the changes in protein turnover were further analyzed using STRING [41]. The functional grouping revealed that the majority of the proteins with increased turnover are associated with pathways involved in the innate immunity and inflammation, protein degradation, acute-phase response, and lipid and vitamin transport (all p < 0.05) (Figure 5). Consistent with these results, STRING-based pathway analysis suggested HFD-induced activation of the alternative complement pathway (Supplementary Figure S2). Recently, we demonstrated a similar stimulation of the alternative complement pathway in LDLR-/- mice fed a Western-type diet for 12 weeks [42]. The pathway analysis also demonstrated that the HFD significantly increased the flux of proteins involved in the stress response suggesting that the short-term HFD results in a hepatic acute-phase response leading to a pro-inflammatory remodeling of the HDL proteome.

3. Discussion

Our findings suggest that significant metabolic disturbances can occur over a relatively short duration of HFD intake in mice. However, the observed absence of hepatic steatosis upon short-term HFD feeding contrasts with the development of NAFLD in the long-term HFD feeding regimens. While insulin resistance is rapidly established upon starting the HFD, a compensatory surge in fatty acid oxidation capacity in the liver is likely able to offset the effects of the enhanced flux of fatty acids to the liver at this early stage of disease progression. In agreement with this notion, we observed a statistically significant increase in the gene expression of lipin-1 and a trend for increased gene expression of carnitine palmitoyltransferase-1 alpha (Cpt1a)—both of which stimulate fatty acid oxidation (Supplementary Figure S3). Previous studies have also observed a dichotomous effect of HFD on fatty acid oxidation—an early increase in oxidative capacity followed by a later decrease which eventually leads to the development of NAFLD [43]. In the same study, the expression of Cpt1a was shown to mirror the changes in the gene expression of peroxisome proliferator activated receptor alpha (PPARα), which transcriptionally activates Cpt1a. While the effect of HFD on PPARα is still debatable [44,45], we speculate that PPARα signaling is part of a compensatory response in the liver to the high dietary fat intake. Overall, there is an apparent lack of hepatic abnormality in mice fed HFD for four weeks, whereas the insulin sensitivity is impaired, dyslipidemia is evident to some extent, and the kinetics of liver-derived proteins are altered, which leads to HDL remodeling.
This HDL-associated proteome remodeling is characterized by an increased turnover of the acute-phase response proteins and the complement pathway proteins associated with HDL. The observed increase in the turnover rate of these proteins suggests their enhanced synthesis and the activation of these pathways. The association of acute-phase response proteins with HDL has widely been reported [46]. An increased expression of acute-phase response proteins is correlated with pro-inflammatory HDL. A major acute-phase reactant that associates with HDL is serum amyloid alpha-1 (SAA-1). Our proteome dynamics study failed to estimate an HFD-induced change in SAA-1 kinetics due to its low abundance in ApoB-depleted plasma. However, a robust increase in the liver expression of the SAA-1 gene was observed (Supplementary Figure S3). Under the condition of the acute-phase response, SAA-1 proteins assume the role of the primary apolipoprotein of the HDL particle. While healthy HDL protects against LDL oxidation, the acute-phase HDL with increased SAA-1 enhances LDL oxidation in cell culture [47]. Evidence from SAA-1 and SAA-2 knockout mice shows that SAA has a causal role in HDL dysfunction by impairing its anti-inflammatory activity [48].
Additionally, our HDL protein turnover findings reveal a major role of the complement pathway in HFD-induced metabolic dysfunction. Complement C3 levels have been linked with insulin resistance, hepatic steatosis, risk of metabolic syndrome, type 2 diabetes mellitus, and CVD [49,50,51,52]. Overall, the activation of upstream classical and alternative pathways and the common terminal complement pathway are implicated in cardiometabolic diseases [53]. Our findings support the role of complement proteins in metabolic dysregulation including its effect on early HDL remodeling.
Interestingly, along with the increased flux of HDL proteins, we also noted a significant increase in HDL-C levels upon high-fat feeding. These findings have also been observed in other reported studies performed in rodents as well as in humans [17,28,54,55,56]. The increased concentration of HDL-C following a high-fat feeding protocol is believed to be related to an increase in both the transport rates and the fractional catabolic rate (FCR) for cholesterol-esters and increased translation of ApoA-I [28]. The association between HDL-C and CVD risk is more convoluted than originally proposed, and as such, increased HDL-C levels should be cautiously interpreted. Rather, observations of increased SAA-1 gene expression and the increased flux of acute-phase response proteins suggest a potential pro-inflammatory remodeling of HDL composition and function despite elevated HDL-C levels. Future studies are warranted to assess the functional consequences of altered plasma HDL proteome dynamics. Nevertheless, the observed changes in protein turnover are significant insights into the short-term HFD-induced HDL remodeling process. While lacking absolute protein quantification data can be inferred as a study limitation, it is important to recognize that a protein kinetics analysis is a more sensitive means of detecting disturbances in protein homeostasis as these typically precede alterations in steady-state protein levels.
The evidence for connections between the innate immune response and metabolic dysregulation has grown over the past decade [57]. Under conditions of nutrient excess and obesity, the innate immune system becomes activated and drives the systemic and organ-specific inflammatory response. The central role of inflammasome activation, an innate immunity signaling pathway, in obesity, insulin resistance, type 2 diabetes mellitus, NAFLD, and atherosclerosis has recently become evident [58,59,60]. Interestingly, the SAA proteins are known to activate the inflammasome in macrophages, neurons, and other cell types [61,62]. Similarly, C-reactive protein activates the inflammasome in the endothelial cells [63]. As a critical component of the inflammatory process, the acute-phase response amplifies tissue inflammation, exacerbates tissue damage, and causes metabolic dysregulation that enhances disease complications. Our observations of increased turnover of HDL-associated acute-phase response proteins in mice fed HFD help to support the hypothesis that these proteins contribute to the pathogenesis of the metabolic disease. Whether the activation of the acute-phase response under conditions of high-fat feeding leads to the downstream inflammasome activation in the liver and arteries still remains to be investigated.
This study was performed in male mice. Several previous studies have demonstrated a greater propensity of male mice to develop an aggravated metabolic phenotype in response to HFD feeding [64,65]. In addition, sex-dependent differences in the responses to proteolytic stress have been reported. [66,67]. Interestingly, females have a lower basal rate of autophagic flux, a major protein degradation pathway [67]. Therefore, male mice may potentially exhibit a higher basal protein turnover rate as compared to females under the conditions of high-fat feeding performed in our study. The effect of gender on HDL proteome dynamics requires further assessment.
In conclusion, the 2H2O-based metabolic labeling in conjunction with the pathway analysis demonstrates that an early immune response-induced inflammatory remodeling of liver-secreted proteins precedes diet-induced steatosis and dyslipidemia. These findings emphasize the importance of understanding early events in the onset of the full spectrum of metabolic disease induced by HFD feeding. The elucidation of these processes is crucial to early identification and intervention in these widely prevalent diseases.

4. Materials and Methods

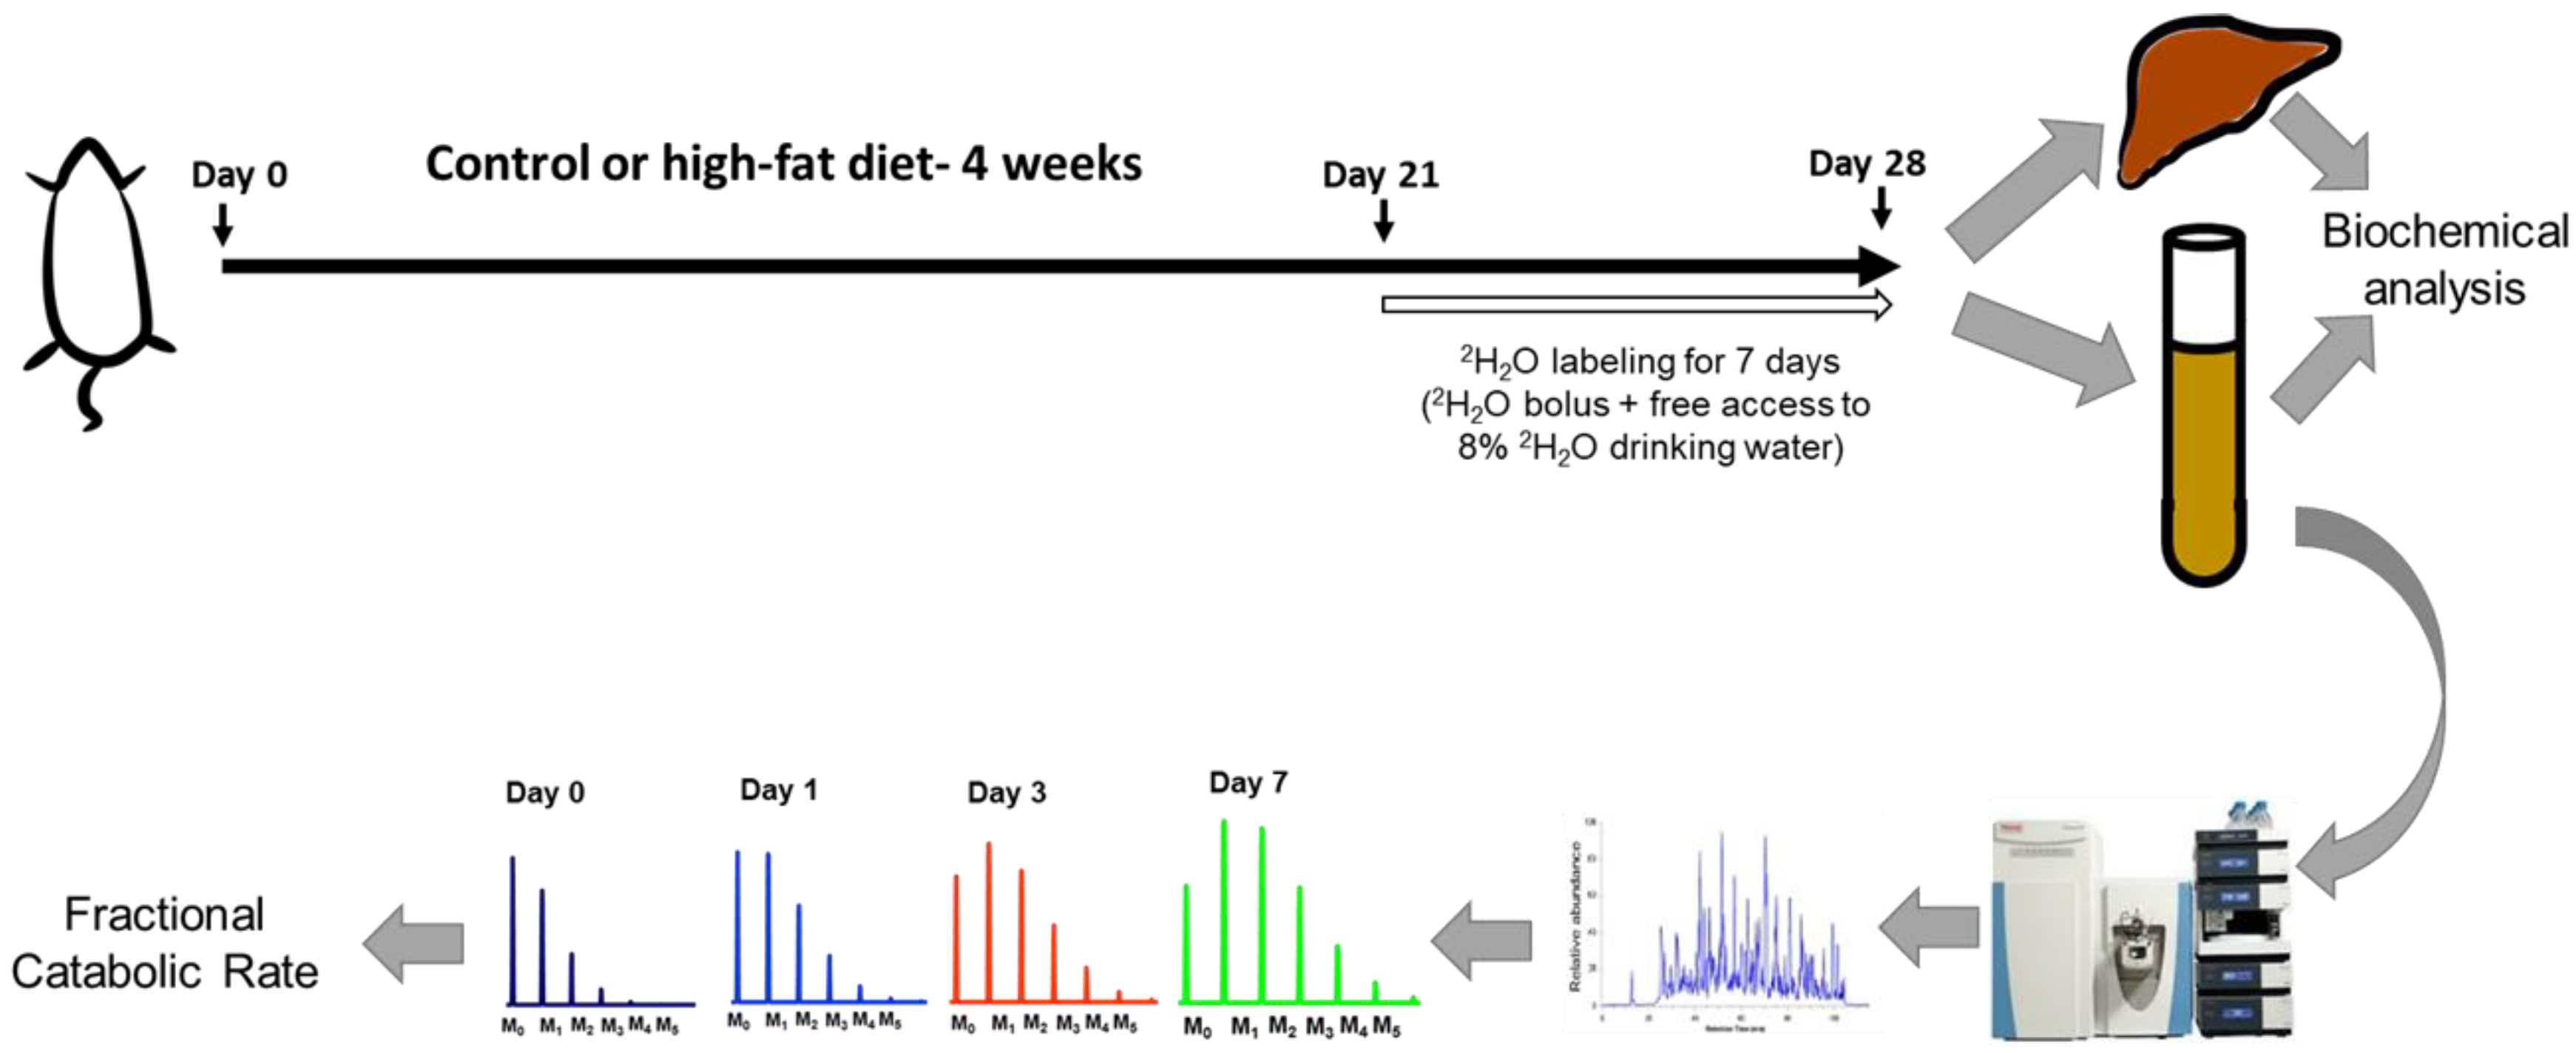
4.1. Animal Experiments

The animal study protocol was approved by the Institutional Animal Care and Use Committee (protocol # 15-010, approval date-10/17/2016) at the Northeast Ohio Medical University (NEOMED). Animal experiments were performed in accordance with the National Institutes of Health (NIH) guidelines. Eight-week-old male C57BL/6J mice (Jackson Laboratories) were adapted to a 12-h light–dark cycle, chow diet (20% kcal from protein, 70% kcal from carbohydrate and 10% kcal from fat, Harlan Teklad), and water. Mice (n = 6–7/group) were fed either a normal chow diet (ND) or an HFD (HFD D12492, 20% kcal from protein, 20% kcal from carbohydrate, and 60% kcal from fat, Research Diets) for 4 weeks. Body weights of mice were measured every two days and food consumption was tracked every day of the feeding period. The fat mass and lean tissue mass were determined in live mice using an EchoMRI 3-in-1 Body Composition Analyzer (EchoMRI; Houston, TX, USA) before the initiation of the feeding period and before sacrificing mice after the feeding period.
After three weeks of the feeding period, the glucose tolerance test was performed following a 10-h overnight fast. A blood sample was taken prior to (0 min) an intraperitoneal (i.p.) injection with D-Glucose at 2g/kg body weight and subsequent blood samples being collected from the tail vein at 30, 60, 90, and 120 min after glucose injection. Blood glucose was measured using a OneTouch Ultra Mini glucometer (LifeScan; Milpitas, CA, USA). The area under the curve calculation based on the trapezoid rule was performed using the GraphPad prism.
The 2H2O-based kinetic study was performed during the last week of the diet experiment. To reduce the stress associated with multiple blood sampling, the baseline blood samples were collected through the retro-orbital sinus a week before the kinetic study. Seven days before sacrifice, animals received a bolus dose (i.p. injection) of 2H2O (30 μL of 99.9% 2H-labeled saline per gram body weight), followed by 8% 2H2O in drinking water. Blood samples (60–80 µL) from the retro-orbital sinus were taken at 8 h, 1 day, 2 days, and 4 days after the initiation of 2H2O labeling and were collected in potassium ethylenediaminetetraacetic acid (EDTA)-containing tubes (Figure 1). The animals were euthanized seven days after 2H2O exposure, and the terminal EDTA-preserved blood was collected through the retro-orbital sinus. Plasma was saved at -80 ˚C until the analyses.

4.2. In Vivo LPL Activity

Post-heparin LPL activity was determined in mice at the completion of the feeding period. Mice were injected with heparin (0.5 units/g body weight) 15 min before sacrifice. Blood was collected and LPL activity was determined in the plasma using the Roar-LPL activity assay kit (Roar RB-LPL; Sigma MAK109).

4.3. Lipid Measurements

Terminal fasted samples from fasted mice were collected and lipid content was assayed using cholesterol and triglyceride reagents (Infinity, Thermo Scientific, #TR13421 and #TR22421, respectively). The non-HDL cholesterol level was calculated by subtracting the HDL-C from the TC. Liver tissue (100 mg) was homogenized in methanol and lipids were extracted in a chloroform:methanol (2:1, v/v) solvent mixture, as described previously [68].

4.4. RNA Isolation, cDNA Synthesis, and Quantitative Real-Time Polymerase Chain Reaction (qRT-PCR)

Total RNA from the liver was isolated with TRIzol reagent (ThermoFisher). The reverse transcription reaction (Verso cDNA synthesis kit, AB1453B, ThermoFisher) was performed on 900 ng of the RNA to generate cDNA. Sybr Green (Fermentas) fluorescence was used to perform the PCR reaction. Glyceraldehyde-3-phosphate dehydrogenase (GAPDH) was used as an internal control. Relative mRNA expression was quantified using the ΔΔCT method. The PCR primers used for the amplification of target genes are presented in Supplementary Table S1.

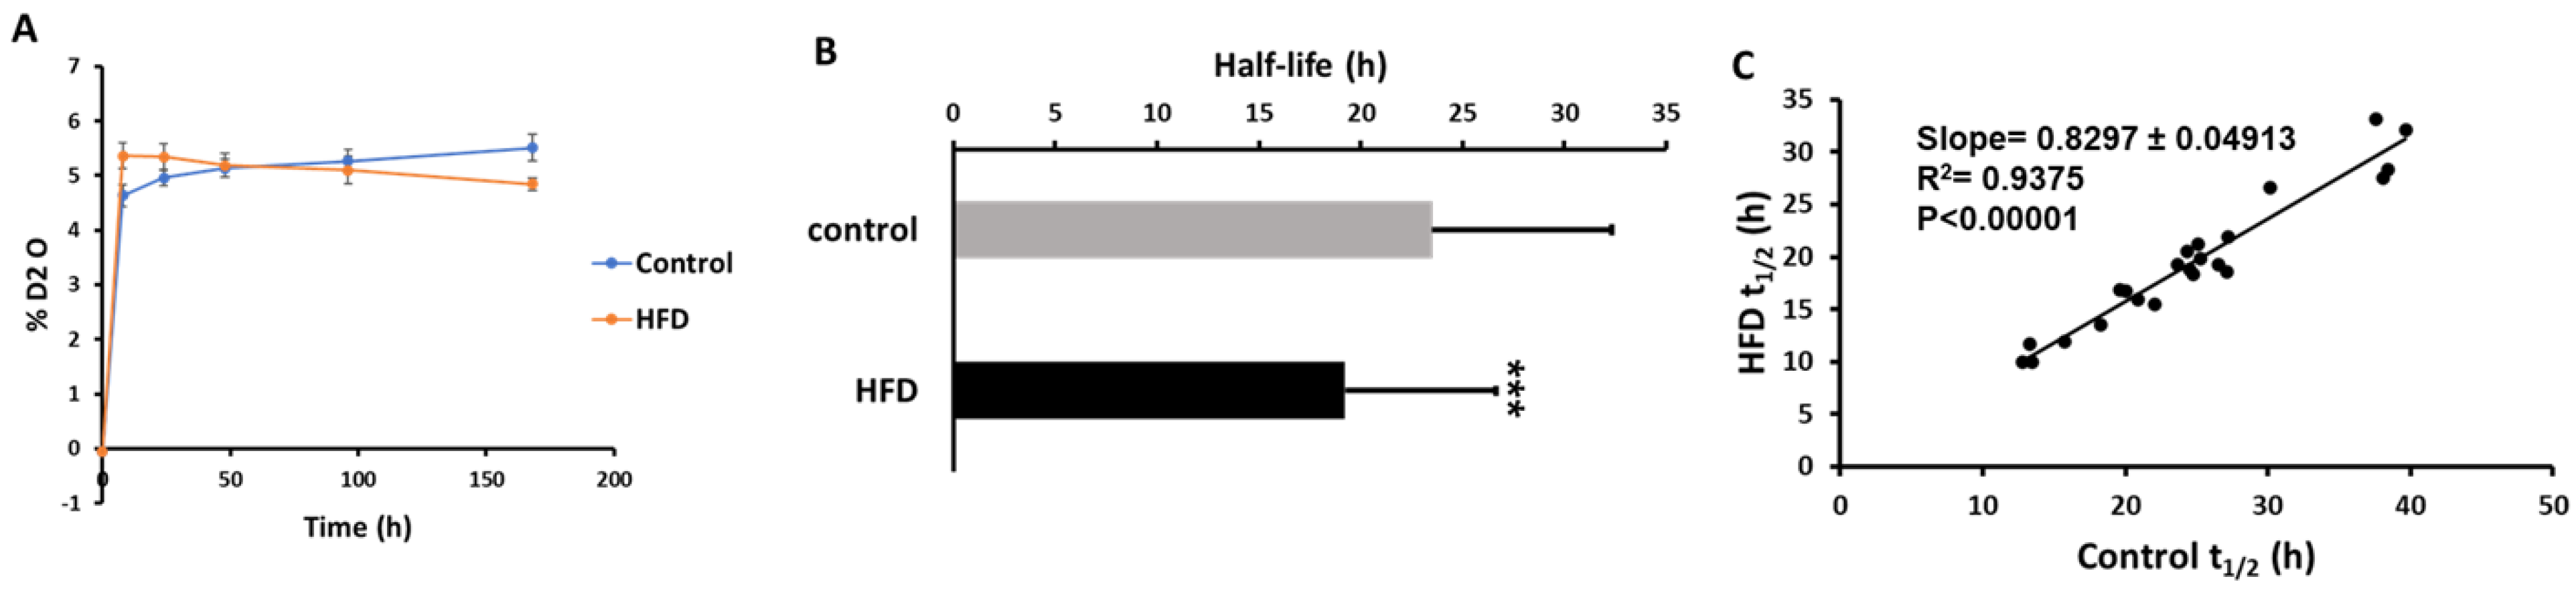
4.5. Total Body Water Enrichment Measurements

The 2H-enrichment of total body water was measured using a modification of the acetone exchange method as described [69]. Body water enrichment was calculated using the regression equation derived from the analysis of a set of calibration curve samples containing 0 to 5% 2H2O.

4.6. Isolation of HDL Proteins

HDL was isolated by the depletion of ApoB-containing lipoprotein particles using a commercially available kit (Stanbio Laboratory, Boerne, TX, USA) [33], which allows reproducible tryptic digestion and quantification of plasma proteins associated with HDL [24].

4.7. Tryptic Digestion of Proteins

Proteins in the supernatant from the ApoB-depleted plasma (25 μL) were used for the proteomics analysis. Proteins were precipitated with 1 mL of cold acetone (−20 °C); the protein pellets were digested with trypsin as described [70]. Protein digests were isolated using a solid-phase extraction on the Pierce Pepclean C18 spin columns. Samples were reconstituted in 0.1% formic acid and 2% of acetonitrile (ACN) and analyzed by nanospray LC-MS/MS.

4.8. Tandem Mass Spectrometry Analysis

A solution containing the tryptic peptides was fractionated using Ultimate 3000 UHPLC (Thermo Scientific, Waltham, MA, USA) and analyzed on a Q Exactive™ Plus Hybrid Quadrupole-Orbitrap™ Mass Spectrometer (Thermo Scientific, CA, USA). The samples were desalted on an Acclaim PepMap100 precolumn (300 μm × 5 mm, C18, 5 μm, 100Å, Thermo Fisher Scientific), and then peptides were introduced to an Acclaim PepMap RSLC reverse-phase nanocolumn (75 μm × 15 cm, C18, 2 μm, 100Å, Thermo Fisher Scientific) at 300 nL/min with a mobile phase A (0.1% formic acid and 2% ACN in water) and B (20% water in ACN with 0.1% formic acid). For the chromatographic separation of tryptic peptides, a 120-min gradient was employed with 2% of mobile phase B. After 4 min of desalting, mobile phase B was linearly increased to 40% in 100 min. Mobile phase B was then ramped to 90% in 5 min and then held at 90% B for 10 min. Subsequently, mobile phase B was decreased to 2% for 2 min and equilibrated for 13 min with 2% of phase B.
A tandem mass spectrometry analysis was performed with a 70,000 resolution (200 m/z) and m/z 380–1300 (MS) range. The fragment ions were generated by higher-energy collisional dissociation (HCD) performed at a normalized collision energy of 27%. MS/MS spectra were collected in the data-dependent analysis mode for the 15 most abundant product ions with an isolation window of 1.4 m/z and offset of 0.3 m/z at a 17,500 resolution (200 m/z). The automatic gain control (AGC) target was set at 3.0 × 10⁶ and 2.0 × 10⁴ ions for MS and MS/MS scans, respectively. Dynamic exclusion was enabled for a duration of 20 s.

4.9. Proteome Dynamics Analysis

For the characterization of HDL proteins, all the spectra obtained from the mass spectrometer were transformed into an mzML file format. The data were searched using Mascot software (Matrix Science, London, UK) version 2.3 against the mouse subset of the SwissProt protein database released in October 2016 (containing 552,884 entries) with cysteine carbamidomethylation as a fixed modification and methionine oxidation as a variable modification and trypsin digestion with a maximum of two missed cleavages per peptide. 2H-labeling of the peptides precursor ions from high-resolution full scan (MS1) spectra was extracted for each isotopomer [22]. Isotopomers are molecules that differ by the presence of isotopes in different positions resulting in an isotopomer pattern in a mass spectrum. The 2H-enrichment of analyzed peptides was calculated as described below.

4.10. Turnover Rate Constant and Half-Life Calculation

The protein synthesis was calculated based on the 2H-enrichment of tryptic peptides [71]. The rate of the 2H-labeling of unique proteolytic peptides of a protein represents the synthesis rate of that protein. The total 2H-labeling of peptides (I(t)) is expressed as shown below in Equation (1) [71]:
I ( t ) = 1 I o ( t ) =   j = 1 n M j ( t ) / j = 0 n M j ( t )
The rate constant (k) was determined using single compartmental kinetic modeling. A time course of 2H-labeling (I(t)) of peptides was fitted to an exponential rise curve equation after the removal of statistical outliers using the Prism software [71]:
I(t) = I(0) + (I(plateau) − I(0)) × (1 − ekt)
In this equation, I(0) and I(plateau) represent the total labeling at the baseline (t = 0) and plateau, respectively.
Our calculations assume the metabolic steady-state when the total content of a protein (pool size) does not change. In this condition, the fractional synthesis rate (FSR) is equal to FCR and both are expressed as the rate constant. The data from multiple unique peptides were averaged to calculate the mean rate constant and half-life ( = ln2/k) of a protein.

4.11. Network Analysis

The kinetic data from the proteome dynamics experiments were further analyzed by STRING (string-db.org) [41]. Protein–protein interaction networks identified the proteins with altered turnover rates from the STRING library of proteins. This analysis allows the identification of networks of proteins with related biological functions.

4.12. Data Accession

The mass spectrometry proteomics data have been deposited to the ProteomeXchange Consortium via the PRIDE [72] partner repository with the dataset identifier PXD010272.

4.13. Statistical Analysis

To evaluate the effect of a short-term HFD on plasma HDL proteome dynamics, we compared the rate constant values calculated for different proteins in each mouse (n = 6–7/group) determined from the time course of 2H-labeling of several (n = 3–20) peptides unique to each protein. For this purpose, all six time points in each mouse (n = 6–7/group) were fitted into the first-order kinetic equation (Equation (2)). The results from the unique peptides were averaged to calculate the final turnover rate of protein in each mouse. A two-tailed Student t-test or two-way ANOVA with repeated measures (for the GTT) were used for the determination of statistical significance, with p < 0.05 considered as statistically significant.

Supplementary Materials

Supplementary materials can be found at https://www.mdpi.com/1422-0067/21/20/7472/s1. Figure S1: Representative images of the isolated liver tissue and hematoxylin and eosin (H&E) stained liver sections from mice fed either a control diet or a high-fat diet for 4-weeks. The staining shows a lack of steatotic changes in the liver after four weeks of high-fat feeding. Figure S2: Representation of the protein-protein interaction networks of complement activation. Functional enrichment analysis of the proteins identified in the HDL proteome dynamics study revealed increased turnover rates of alternative and terminal complement activation pathways (denoted in red) upon high-fat feeding in wild type mice for four weeks. Figure S3: Gene expression analysis using RNA isolated from livers of mice fed either the control diet or the high-fat diet. At the end of the study, the livers from the mice were harvested and RNA was isolated. Complementary DNA (cDNA) was synthesized from the RNA and the quantitative real-time polymerase chain reaction (qRT-PCR) was performed. The relative expression of indicated genes was calculated using the Ct method. Statistical significance, ** indicates p < 0.01, n = 6–7/group. Table S1: Primer sequences used for quantitative real-time polymerase chain reaction (qRT-PCR).

Author Contributions

Conceptualization and study design, P.S. and T.K.; methodology, P.S., T.K., L.L., S.I.; software, T.K., S.I.; data collection, L.L., S.I., M.A.; data analysis, L.L., P.S., S.I., M.A., T.K.; writing, P.S. and T.K.; editing, P.S., T.K., L.L., S.I., M.A. All authors have read and agreed to the published version of the manuscript.

Funding

This research was supported in parts by the National Institute of Health grants 5R01GM112044-02, 1R01HL129120-01A1, and 3U24DK097771-07S1.

Acknowledgments

We thank Chrisovalantis Paxos for his critical review of the manuscript and assistance with language editing.

Conflicts of Interest

The authors declare no conflict of interest.

References

  1. Atawia, R.T.; Bunch, K.L.; Toque, H.A.; Caldwell, R.B.; Caldwell, R.W. Mechanisms of obesity-induced metabolic and vascular dysfunctions. Front. Biosci. 2019, 24, 890–934. [Google Scholar]
  2. Herrington, W.; Lacey, B.; Sherliker, P.; Armitage, J.; Lewington, S. Epidemiology of atherosclerosis and the potential to reduce the global burden of atherothrombotic disease. Circ. Res. 2016, 118, 535–546. [Google Scholar] [CrossRef] [PubMed]
  3. Upadhyay, R.K. Emerging risk biomarkers in cardiovascular diseases and disorders. J. Lipids 2015, 2015, 971453. [Google Scholar] [CrossRef]
  4. Thomas, M.R.; Lip, G.Y. Novel risk markers and risk assessments for cardiovascular disease. Circ. Res. 2017, 120, 133–149. [Google Scholar] [CrossRef] [PubMed]
  5. Wang, C.Y.; Liao, J.K. A mouse model of diet-induced obesity and insulin resistance. Methods Mol. Biol. 2012, 821, 421–433. [Google Scholar]
  6. Hotamisligil, G.S. Inflammation and metabolic disorders. Nature 2006, 444, 860–867. [Google Scholar] [CrossRef]
  7. Libby, P. Inflammation in atherosclerosis. Arterioscler. Thromb. Vasc. Biol. 2012, 32, 2045–2051. [Google Scholar] [CrossRef] [Green Version]
  8. Ronsein, G.E.; Vaisar, T. Deepening our understanding of HDL proteome. Expert Rev. Proteom. 2019, 16, 749–760. [Google Scholar] [CrossRef]
  9. Ronsein, G.E.; Vaisar, T. Inflammation, remodeling, and other factors affecting HDL cholesterol efflux. Curr. Opin. Lipidol. 2017, 28, 52–59. [Google Scholar] [CrossRef] [Green Version]
  10. Feingold, K.R.; Grunfeld, C. Effect of inflammation on HDL structure and function. Curr. Opin. Lipidol. 2016, 27, 521–530. [Google Scholar] [CrossRef]
  11. Jovicic, N.; Jeftic, I.; Jovanovic, I.; Radosavljevic, G.; Arsenijevic, N.; Lukic, M.L.; Pejnovic, N. Differential immunometabolic phenotype in Th1 and Th2 dominant mouse strains in response to high-fat feeding. PLoS ONE 2015, 10, e0134089. [Google Scholar] [CrossRef] [PubMed] [Green Version]
  12. Hariri, N.; Thibault, L. High-fat diet-induced obesity in animal models. Nutr. Res. Rev. 2010, 23, 270–299. [Google Scholar] [CrossRef] [PubMed] [Green Version]
  13. Rossmeisl, M.; Rim, J.S.; Koza, R.A.; Kozak, L.P. Variation in type 2 diabetes-related traits in mouse strains susceptible to diet-induced obesity. Diabetes 2003, 52, 1958–1966. [Google Scholar] [CrossRef] [PubMed] [Green Version]
  14. Holmes, A.; Coppey, L.J.; Davidson, E.P.; Yorek, M.A. Rat models of diet-induced obesity and high fat/low dose streptozotocin type 2 diabetes: Effect of reversal of high fat diet compared to treatment with enalapril or menhaden oil on glucose utilization and neuropathic endpoints. J. Diabetes Res. 2015, 2015, 307285. [Google Scholar] [CrossRef] [PubMed] [Green Version]
  15. Lutz, T.A.; Woods, S.C. Overview of animal models of obesity. Curr. Protoc. Pharmacol. 2012, 58, 5.61.1–5.61.18. [Google Scholar] [CrossRef] [PubMed] [Green Version]
  16. Lee, Y.S.; Li, P.; Huh, J.Y.; Hwang, I.J.; Lu, M.; Kim, J.I.; Ham, M.; Talukdar, S.; Chen, A.; Lu, W.J.; et al. Inflammation is necessary for long-term but not short-term high-fat diet-induced insulin resistance. Diabetes 2011, 60, 2474–2483. [Google Scholar] [CrossRef] [PubMed] [Green Version]
  17. Williams, L.M.; Campbell, F.M.; Drew, J.E.; Koch, C.; Hoggard, N.; Rees, W.D.; Kamolrat, T.; Thi Ngo, H.; Steffensen, I.L.; Gray, S.R.; et al. The development of diet-induced obesity and glucose intolerance in c57bl/6 mice on a high-fat diet consists of distinct phases. PLoS ONE 2014, 9, e106159. [Google Scholar] [CrossRef] [Green Version]
  18. Lai, Y.S.; Chen, W.C.; Kuo, T.C.; Ho, C.T.; Kuo, C.H.; Tseng, Y.J.; Lu, K.H.; Lin, S.H.; Panyod, S.; Sheen, L.Y. Mass-spectrometry-based serum metabolomics of a c57bl/6j mouse model of high-fat-diet-induced non-alcoholic fatty liver disease development. J. Agric. Food Chem. 2015, 63, 7873–7884. [Google Scholar] [CrossRef]
  19. Kashyap, S.R.; Osme, A.; Ilchenko, S.; Golizeh, M.; Lee, K.; Wang, S.; Bena, J.; Previs, S.F.; Smith, J.D.; Kasumov, T. Glycation reduces the stability of apoai and increases HDL dysfunction in diet-controlled type 2 diabetes. J. Clin. Endocrinol. Metab. 2018, 103, 388–396. [Google Scholar] [CrossRef] [Green Version]
  20. Rosenson, R.S.; Brewer, H.B., Jr.; Ansell, B.J.; Barter, P.; Chapman, M.J.; Heinecke, J.W.; Kontush, A.; Tall, A.R.; Webb, N.R. Dysfunctional HDL and atherosclerotic cardiovascular disease. Nat. Rev. Cardiol. 2016, 13, 48–60. [Google Scholar] [CrossRef]
  21. McCullough, A.; Previs, S.F.; Dasarathy, J.; Lee, K.; Osme, A.; Kim, C.; Ilchenko, S.; Lorkowski, S.W.; Smith, J.D.; Dasarathy, S.; et al. HDL flux is higher in patients with nonalcoholic fatty liver disease. Am. J. Physiol. Endocrinol. Metab. 2019, 317, E852–E862. [Google Scholar] [CrossRef] [PubMed]
  22. Sadygov, R.G.; Avva, J.; Rahman, M.; Lee, K.; Ilchenko, S.; Kasumov, T.; Borzou, A. D2ome, software for in vivo protein turnover analysis using heavy water labeling and lc-ms, reveals remodeling of hepatic proteome dynamics in a mouse model of NAFLD. J. Proteome Res. 2018, 17, 3740–3748. [Google Scholar] [CrossRef]
  23. Kasumov, T.; Li, L.; Li, M.; Gulshan, K.; Kirwan, J.P.; Liu, X.; Previs, S.; Willard, B.; Smith, J.D.; McCullough, A. Ceramide as a mediator of non-alcoholic fatty liver disease and associated atherosclerosis. PLoS ONE 2015, 10, e0126910. [Google Scholar] [CrossRef] [PubMed]
  24. Li, L.; Bebek, G.; Previs, S.F.; Smith, J.D.; Sadygov, R.G.; McCullough, A.J.; Willard, B.; Kasumov, T. Proteome dynamics reveals pro-inflammatory remodeling of plasma proteome in a mouse model of NAFLD. J. Proteome Res. 2016, 15, 3388–3404. [Google Scholar] [CrossRef] [PubMed] [Green Version]
  25. Lee, K.; Haddad, A.; Osme, A.; Kim, C.; Borzou, A.; Ilchenko, S.; Allende, D.; Dasarathy, S.; McCullough, A.; Sadygov, R.G.; et al. Hepatic mitochondrial defects in a nonalcoholic fatty liver disease mouse model are associated with increased degradation of oxidative phosphorylation subunits. Mol. Cell Proteom. 2018, 17, 2371–2386. [Google Scholar] [CrossRef] [Green Version]
  26. Fajardo, R.J.; Karim, L.; Calley, V.I.; Bouxsein, M.L. A review of rodent models of type 2 diabetic skeletal fragility. J. Bone Miner. Res. 2014, 29, 1025–1040. [Google Scholar] [CrossRef] [Green Version]
  27. Yin, W.; Carballo-Jane, E.; McLaren, D.G.; Mendoza, V.H.; Gagen, K.; Geoghagen, N.S.; McNamara, L.A.; Gorski, J.N.; Eiermann, G.J.; Petrov, A.; et al. Plasma lipid profiling across species for the identification of optimal animal models of human dyslipidemia. J. Lipid Res. 2012, 53, 51–65. [Google Scholar] [CrossRef] [Green Version]
  28. Hayek, T.; Ito, Y.; Azrolan, N.; Verdery, R.B.; Aalto-Setala, K.; Walsh, A.; Breslow, J.L. Dietary fat increases high density lipoprotein (HDL) levels both by increasing the transport rates and decreasing the fractional catabolic rates of HDL cholesterol ester and apolipoprotein (apo) a-i. Presentation of a new animal model and mechanistic studies in human apo a-i transgenic and control mice. J. Clin. Investig. 1993, 91, 1665–1671. [Google Scholar]
  29. Brunner, F.J.; Waldeyer, C.; Ojeda, F.; Salomaa, V.; Kee, F.; Sans, S.; Thorand, B.; Giampaoli, S.; Brambilla, P.; Tunstall-Pedoe, H.; et al. Application of non-HDL cholesterol for population-based cardiovascular risk stratification: Results from the multinational cardiovascular risk consortium. Lancet 2019, 394, 2173–2183. [Google Scholar] [CrossRef] [Green Version]
  30. Pan, X.; Zhang, Y.; Kim, H.G.; Liangpunsakul, S.; Dong, X.C. FOXO transcription factors protect against the diet-induced fatty liver disease. Sci. Rep. 2017, 7, 44597. [Google Scholar] [CrossRef] [Green Version]
  31. Davidson, W.S.; Heink, A.; Sexmith, H.; Melchior, J.T.; Gordon, S.M.; Kuklenyik, Z.; Woollett, L.; Barr, J.R.; Jones, J.I.; Toth, C.A.; et al. The effects of apolipoprotein B depletion on HDL subspecies composition and function. J. Lipid Res. 2016, 57, 674–686. [Google Scholar] [CrossRef] [PubMed] [Green Version]
  32. Kheniser, K.G.; Osme, A.; Kim, C.; Ilchenko, S.; Kasumov, T.; Kashyap, S.R. Temporal dynamics of high-density lipoprotein proteome in diet-controlled subjects with type 2 diabetes. Biomolecules 2020, 10, 520. [Google Scholar] [CrossRef] [PubMed] [Green Version]
  33. Kasumov, T.; Willard, B.; Li, L.; Li, M.; Conger, H.; Buffa, J.A.; Previs, S.; McCullough, A.; Hazen, S.L.; Smith, J.D. 2H2O-based high-density lipoprotein turnover method for the assessment of dynamic high-density lipoprotein function in mice. Arterioscler. Thromb. Vasc. Biol. 2013, 33, 1994–2003. [Google Scholar] [CrossRef] [PubMed] [Green Version]
  34. Shah, A.S.; Tan, L.; Long, J.L.; Davidson, W.S. Proteomic diversity of high density lipoproteins: Our emerging understanding of its importance in lipid transport and beyond. J. Lipid Res. 2013, 54, 2575–2585. [Google Scholar] [CrossRef] [PubMed] [Green Version]
  35. Preissner, K.T.; Reuning, U. Vitronectin in vascular context: Facets of a multitalented matricellular protein. Semin. Thromb. Hemost. 2011, 37, 408–424. [Google Scholar] [CrossRef] [PubMed]
  36. Ekmekci, O.B.; Ekmekci, H. Vitronectin in atherosclerotic disease. Clin. Chim. Acta 2006, 368, 77–83. [Google Scholar] [CrossRef] [PubMed]
  37. Heissig, B.; Salama, Y.; Takahashi, S.; Osada, T.; Hattori, K. The multifaceted role of plasminogen in inflammation. Cell Signal. 2020, 75, 109761. [Google Scholar] [CrossRef]
  38. Heller, M.; Stalder, D.; Schlappritzi, E.; Hayn, G.; Matter, U.; Haeberli, A. Mass spectrometry-based analytical tools for the molecular protein characterization of human plasma lipoproteins. Proteomics 2005, 5, 2619–2630. [Google Scholar] [CrossRef]
  39. Vaisar, T.; Pennathur, S.; Green, P.S.; Gharib, S.A.; Hoofnagle, A.N.; Cheung, M.C.; Byun, J.; Vuletic, S.; Kassim, S.; Singh, P.; et al. Shotgun proteomics implicates protease inhibition and complement activation in the antiinflammatory properties of HDL. J. Clin. Investig. 2007, 117, 746–756. [Google Scholar] [CrossRef]
  40. Davidson, W.S.; Silva, R.A.; Chantepie, S.; Lagor, W.R.; Chapman, M.J.; Kontush, A. Proteomic analysis of defined HDL subpopulations reveals particle-specific protein clusters: Relevance to antioxidative function. Arterioscler. Thromb. Vasc. Biol. 2009, 29, 870–876. [Google Scholar] [CrossRef]
  41. Szklarczyk, D.; Morris, J.H.; Cook, H.; Kuhn, M.; Wyder, S.; Simonovic, M.; Santos, A.; Doncheva, N.T.; Roth, A.; Bork, P.; et al. The string database in 2017: Quality-controlled protein-protein association networks, made broadly accessible. Nucleic Acids Res. 2017, 45, D362–D368. [Google Scholar] [CrossRef] [PubMed]
  42. Li, L.; Willard, B.; Rachdaoui, N.; Kirwan, J.P.; Sadygov, R.G.; Stanley, W.C.; Previs, S.; McCullough, A.J.; Kasumov, T. Plasma proteome dynamics: Analysis of lipoproteins and acute phase response proteins with 2H2O metabolic labeling. Mol. Cell Proteom. 2012, 11, 1–16. [Google Scholar] [CrossRef] [PubMed] [Green Version]
  43. Chan, M.Y.; Zhao, Y.; Heng, C.K. Sequential responses to high-fat and high-calorie feeding in an obese mouse model. Obesity (Silver Spring) 2008, 16, 972–978. [Google Scholar] [CrossRef] [PubMed]
  44. Lee, Y.; Wang, M.Y.; Kakuma, T.; Wang, Z.W.; Babcock, E.; McCorkle, K.; Higa, M.; Zhou, Y.T.; Unger, R.H. Liporegulation in diet-induced obesity. The antisteatotic role of hyperleptinemia. J. Biol. Chem. 2001, 276, 5629–5635. [Google Scholar] [CrossRef] [Green Version]
  45. Sun, B.; Jia, Y.; Hong, J.; Sun, Q.; Gao, S.; Hu, Y.; Zhao, N.; Zhao, R. Sodium butyrate ameliorates high-fat-diet-induced non-alcoholic fatty liver disease through peroxisome proliferator-activated receptor alpha-mediated activation of beta oxidation and suppression of inflammation. J. Agric. Food Chem. 2018, 66, 7633–7642. [Google Scholar] [CrossRef] [PubMed]
  46. Jahangiri, A.; de Beer, M.C.; Noffsinger, V.; Tannock, L.R.; Ramaiah, C.; Webb, N.R.; van der Westhuyzen, D.R.; de Beer, F.C. Hdl remodeling during the acute phase response. Arterioscler. Thromb. Vasc. Biol. 2009, 29, 261–267. [Google Scholar] [CrossRef] [Green Version]
  47. Navab, M.; Hama-Levy, S.; Van Lenten, B.J.; Fonarow, G.C.; Cardinez, C.J.; Castellani, L.W.; Brennan, M.L.; Lusis, A.J.; Fogelman, A.M.; La Du, B.N. Mildly oxidized ldl induces an increased apolipoprotein j/paraoxonase ratio. J. Clin. Investig. 1997, 99, 2005–2019. [Google Scholar] [CrossRef] [Green Version]
  48. Han, C.Y.; Tang, C.; Guevara, M.E.; Wei, H.; Wietecha, T.; Shao, B.; Subramanian, S.; Omer, M.; Wang, S.; O’Brien, K.D.; et al. Serum amyloid a impairs the antiinflammatory properties of HDL. J. Clin. Investig. 2016, 126, 266–281. [Google Scholar] [CrossRef] [Green Version]
  49. Barbu, A.; Hamad, O.A.; Lind, L.; Ekdahl, K.N.; Nilsson, B. The role of complement factor c3 in lipid metabolism. Mol. Immunol. 2015, 67, 101–107. [Google Scholar] [CrossRef]
  50. Engstrom, G.; Hedblad, B.; Eriksson, K.F.; Janzon, L.; Lindgarde, F. Complement. c3 is a risk factor for the development of diabetes: A population-based cohort study. Diabetes 2005, 54, 570–575. [Google Scholar] [CrossRef] [Green Version]
  51. Kolev, M.; Kemper, C. Keeping it all going-complement meets metabolism. Front. Immunol. 2017, 8. [Google Scholar] [CrossRef] [PubMed] [Green Version]
  52. Onat, A.; Hergenc, G.; Can, G.; Kaya, Z.; Yuksel, H. Serum complement c3: A determinant of cardiometabolic risk, additive to the metabolic syndrome, in middle-aged population. Metabolism 2010, 59, 628–634. [Google Scholar]
  53. Hertle, E.; Stehouwer, C.D.; van Greevenbroek, M.M. The complement system in human cardiometabolic disease. Mol. Immunol. 2014, 61, 135–148. [Google Scholar] [CrossRef] [PubMed]
  54. Arisqueta, L.; Navarro-Imaz, H.; Labiano, I.; Rueda, Y.; Fresnedo, O. High.-fat diet overfeeding promotes nondetrimental liver steatosis in female mice. Am. J. Physiol. Gastrointest. Liver Physiol. 2018, 315, G772–G780. [Google Scholar] [CrossRef]
  55. Wolf, G. High-fat, high-cholesterol diet raises plasma HDL cholesterol: Studies on the mechanism of this effect. Nutr. Rev. 1996, 54, 34–35. [Google Scholar] [CrossRef]
  56. Siri-Tarino, P.W. Effects of diet on high-density lipoprotein cholesterol. Curr. Atheroscler. Rep. 2011, 13, 453–460. [Google Scholar] [CrossRef]
  57. Lackey, D.E.; Olefsky, J.M. Regulation of metabolism by the innate immune system. Nat. Rev. Endocrinol. 2016, 12, 15–28. [Google Scholar] [CrossRef]
  58. Stienstra, R.; van Diepen, J.A.; Tack, C.J.; Zaki, M.H.; van de Veerdonk, F.L.; Perera, D.; Neale, G.A.; Hooiveld, G.J.; Hijmans, A.; Vroegrijk, I.; et al. Inflammasome is a central player in the induction of obesity and insulin resistance. Proc. Natl. Acad. Sci. USA 2011, 108, 15324–15329. [Google Scholar] [CrossRef] [Green Version]
  59. Grant, R.W.; Dixit, V.D. Mechanisms of disease: Inflammasome activation and the development of type 2 diabetes. Front. Immunol. 2013, 4, 50. [Google Scholar] [CrossRef] [PubMed] [Green Version]
  60. Jin, Y.; Fu, J. Novel insights into the nlrp 3 inflammasome in atherosclerosis. J. Am. Heart Assoc. 2019, 8, e012219. [Google Scholar] [CrossRef] [PubMed] [Green Version]
  61. Shridas, P.; De Beer, M.C.; Webb, N.R. High-density lipoprotein inhibits serum amyloid a-mediated reactive oxygen species generation and nlrp3 inflammasome activation. J. Biol. Chem. 2018, 293, 13257–13269. [Google Scholar] [CrossRef] [Green Version]
  62. Yu, J.; Zhu, H.; Taheri, S.; Mondy, W.; Bonilha, L.; Magwood, G.S.; Lackland, D.; Adams, R.J.; Kindy, M.S. Serum amyloid a-mediated inflammasome activation of microglial cells in cerebral ischemia. J. Neurosci. 2019, 39, 9465–9476. [Google Scholar] [CrossRef]
  63. Bian, F.; Yang, X.Y.; Xu, G.; Zheng, T.; Jin, S. CRP-induced NLRP3 inflammasome activation increases ldl transcytosis across endothelial cells. Front. Pharmacol. 2019, 10, 40. [Google Scholar] [CrossRef]
  64. Hwang, L.L.; Wang, C.H.; Li, T.L.; Chang, S.D.; Lin, L.C.; Chen, C.P.; Chen, C.T.; Liang, K.C.; Ho, I.K.; Yang, W.S.; et al. Sex differences in high-fat diet-induced obesity, metabolic alterations and learning, and synaptic plasticity deficits in mice. Obesity (Silver Spring) 2010, 18, 463–469. [Google Scholar] [CrossRef]
  65. Pettersson, U.S.; Walden, T.B.; Carlsson, P.O.; Jansson, L.; Phillipson, M. Female mice are protected against high-fat diet induced metabolic syndrome and increase the regulatory t cell population in adipose tissue. PLoS ONE 2012, 7, e46057. [Google Scholar] [CrossRef]
  66. Tower, J.; Pomatto, L.C.D.; Davies, K.J.A. Sex differences in the response to oxidative and proteolytic stress. Redox Biol. 2020, 31, 101488. [Google Scholar] [CrossRef]
  67. Congdon, E.E. Sex differences in autophagy contribute to female vulnerability in alzheimer’s disease. Front. Neurosci. 2018, 12, 372. [Google Scholar] [CrossRef]
  68. Bligh, E.G.; Dyer, W.J. A rapid method of total lipid extraction and purification. Can. J. Biochem. Physiol. 1959, 37, 911–917. [Google Scholar] [CrossRef] [Green Version]
  69. Mahsut, A.; Wang, S.P.; McLaren, D.G.; Bhat, G.; Herath, K.; Miller, P.L.; Hubbard, B.K.; Johns, D.G.; Previs, S.F.; Roddy, T.P. Headspace analyses of 2H labeling of acetone: Enabling studies of fatty acid oxidation in vivo. Anal. Biochem. 2011, 408, 351–353. [Google Scholar] [CrossRef]
  70. Walsh, M.T.; Atkinson, D. Solubilization of low-density lipoprotein with sodium deoxycholate and recombination of apoprotein b with dimyristoylphosphatidylcholine. Biochemistry 1983, 22, 3170–3178. [Google Scholar] [CrossRef]
  71. Kasumov, T.; Ilchenko, S.; Li, L.; Rachdaoui, N.; Sadygov, R.G.; Willard, B.; McCullough, A.J.; Previs, S. Measuring protein synthesis using metabolic 2H labeling, high-resolution mass spectrometry, and an algorithm. Anal. Biochem. 2011, 412, 47–55. [Google Scholar] [CrossRef] [Green Version]
  72. Vizcaino, J.A.; Csordas, A.; Del-Toro, N.; Dianes, J.A.; Griss, J.; Lavidas, I.; Mayer, G.; Perez-Riverol, Y.; Reisinger, F.; Ternent, T.; et al. 2016 update of the pride database and its related tools. Nucleic Acids Res. 2016, 44, 11033. [Google Scholar] [CrossRef] [Green Version]
Figure 1. A schematic of the study design. Wild-type C57BL/6J male mice were fed a high-fat diet (HFD) or control diet for four weeks. During the last week of feeding, heavy water was administered to determine the turnover rates of high-density lipoprotein (HDL) proteome. The HDL proteins were isolated, followed by their tryptic digestion and analysis by tandem mass spectrometry. The turnover rate constants of proteins were determined based on their time course of 2H-labeling. Metabolic changes were evaluated using biochemical analyses of liver and plasma samples.
Ijms 21 07472 g001
Figure 2. Effects of an HFD in wild-type C57BL/6J male mice at four weeks of feeding (n = 6–7/group). A, Representative images of mice fed either the control or HFD. B, The change in average body weight over the duration of the study in the control and HFD-fed mice. C and D, The average daily food consumption and calorie intake in the control and HFD-fed mice. E and F, Analysis of total fat content and lean mass percentage in mice recorded at the start of the study (pre) and on the day of sacrifice (post) using EchoMRI body composition analyzer. G and H, The time course and the area under the curve (AUC) of the glucose tolerance test (GTT) in the mice after intraperitoneal injection of glucose following an eight-hour fast. Results are mean ± SEM. Statistical significance, * indicates p < 0.05, ** indicates p < 0.01, and *** indicates p < 0.005 compared to control.
Ijms 21 07472 g002
Figure 3. Effect of an HFD on plasma HDL proteome dynamics. A, Total body water enrichment. The mice were given a bolus load of heavy water (30 μL/g body weight) and followed by maintenance of 8% (v/v) heavy water in drinking water for seven days which resulted in a steady-state body water enrichment of ~5%. B, Comparison of average half-lives of HDL proteins in the control and HFD groups. Results are mean ± SD; n = 6–7/group. Statistical significance, *** indicates p < 0.005 compared to control. C, The relationships between the half-lives of individual proteins in HFD mice as a function of these values in control mice.
Ijms 21 07472 g003
Figure 4. Typical kinetics curves of HDL proteins. The time course of 2H-labeling of apolipoprotein A-I, apolipoprotein A-II, vitronectin, and plasminogen peptides is shown for mice fed either the control diet or the HFD groups. The fractional catabolic rate is denoted by the rate constant k. Statistical significance, * indicates p < 0.05 compared to control.
Ijms 21 07472 g004
Figure 5. Interaction network of proteins with HFD-induced altered turnover rates. The identified proteins with altered turnover rates were analyzed using the STRING database [41].
Ijms 21 07472 g005
Table 1. Biochemical characteristics of control and HFD-fed mice. C57BL/6J male mice were fed a control diet or a high-fat diet for four weeks. After an 8-h fast, the mice were sacrificed, and blood and tissue samples were collected for biochemical analysis.
Control DietHigh-Fat Dietp-Value
Body weight (g)25.4 ± 0.428.2 ± 0.7<0.005
Liver weight (g)1.04 ± 0.030.85 ± 0.02<0.005
Liver weight/Body weight (%)4.27 ± 0.103.01 ± 0.06<0.005
Blood glucose (mg/dL)106.5 ± 7.5211.7 ± 13.5<0005
Plasma TG (mg/dL)35.5 ± 2.136.7 ± 2.40.718
Plasma LPL activity (nmol FFA/min/mL)362.6 ± 11.5312.6 ± 7.7<0.005
Plasma TC (mg/dL)87.3 ± 2.7139.9 ± 6.3<0.005
Plasma HDL-C (mg/dL)69.9 ± 3.097.3 ± 6.5<0.005
Plasma non-HDL-C (mg/dL) (calculated)17.5 ± 4.249.3 ± 10.9<0.05
TC/HDL-C ratio1.26 ± 0.061.54 ± 0.140.120
Hepatic TG (μg/mg liver tissue)11.3 ± 0.414.3 ± 0.9<0.05
HDL-C: high-density lipoprotein-cholesterol; LPL: lipoprotein lipase; TC: total cholesterol; TG: triglycerides.
Table 2. Half-lives of HDL proteins.
Accession
(Uniprot)
ProteinMolecular Weight
(kDa)
Function #ControlHFD
Mean t½ (hours ±SD)Mean t½ (hours ±SD)
Q546G4Albumin68.7Chaperone binding; DNA binding; drug binding; enzyme binding; fatty acid binding; identical protein binding76.93 ± 7.4966.09 ± 6.13 *
P29699Alpha-2-HS-glycoprotein 37.3 Cysteine-type endopeptidase inhibitor activity; endopeptidase inhibitor activity; receptor signaling protein tyrosine kinase inhibitor activity 20.92 ± 1.6015.92 ± 2.74 *
A0A0A6YWH7Antithrombin-III (fragment) 52.0Heparin binding; peptidase inhibitor activity; protease binding; serine-type endopeptidase inhibitor activity 24.77 ± 2.1318.34 ± 1.16 *
Q3V2G1Apolipoprotein A-I30.6Amyloid-beta binding; apolipoprotein A-I receptor binding; apolipoprotein receptor binding; chemorepellent activity; cholesterol binding24.33 ± 1.7620.51 ± 1.64 *
Q6LD55Apolipoprotein A-II11.3Apolipoprotein receptor binding; cholesterol binding; cholesterol transporter activity; heat shock protein binding; high-density lipoprotein particle binding15.43 ± 0.6915.09 ± 1.68
Q6LAL7Beta-2-glycoprotein 138.6 Heparin binding; identical protein binding; lipid binding; phospholipid binding30.88 ± 3.4620.75 ± 4.67 *
Q9DBB9Carboxypeptidase N subunit 2 60.5Enzyme regulator activity; metallocarboxypeptidase activity30.14 ± 2.2626.60 ± 2.00 *
P01027Complement C3186.5C5L2 anaphylatoxin chemotactic receptor binding; cofactor binding; endopeptidase inhibitor activity; lipid binding; protein binding12.77 ± 0.819.98 ± 1.20 *
Q3UEG8Complement Factor B85.5Complement binding; protein binding; serine-type endopeptidase activity12.71 ± 1.0110.85 ± 1.04
D6RGQ0Complement Factor H139.1Complement component C3b binding; heparan sulfate proteoglycan binding; heparin binding; protein binding19.60 ± 1.8416.80 ± 1.58 *
Q61129Complement Factor I67.3Hydrolase activity; metal ion binding; peptidase activity; scavenger receptor activity; serine-type endopeptidase activity25.25 ± 1.2919.88 ± 1.50 *
Q91X72Hemopexin51.3Cellular iron ion homeostasis; heme metabolic process; heme transport; hemoglobin metabolic process; positive regulation of humoral immune response mediated by circulating immunoglobulin39.82 ± 6.5739.92 ± 9.65
A0A0R4J039Histidine-rich Glycoprotein59.6Cysteine-type endopeptidase inhibitor activity; heme binding; heparan sulfate proteoglycan binding; heparin binding; immunoglobulin binding23.63 ± 1.9919.28 ± 2.83 *
A0A0R4J038Kininogen-173.1Cysteine-type endopeptidase inhibitor activity; peptidase inhibitor activity; receptor binding25.09 ± 1.5921.18 ± 0.91 *
P28665Murinoglobulin-1165.3 Endopeptidase inhibitor activity; peptidase inhibitor activity; serine-type endopeptidase inhibitor activity39.67 ± 3.2232.08 ± 1.73 *
Q3V1T9Plasminogen90.8Apolipoprotein binding; chaperone binding; endopeptidase activity; enzyme binding; hydrolase activity22.04 ± 1.2515.45 ± 3.42 *
Q61838Pregnancy Zone Protein165.8 Brain-derived neurotrophic factor binding; endopeptidase inhibitor activity; nerve growth factor binding; peptidase inhibitor activity; protein complex binding41.71 ± 3.5038.91 ± 2.29
Q07456Protein AMBP39.0Heme binding; IgA binding; peptidase inhibitor activity; protein homodimerization activity; serine-type endopeptidase inhibitor activity14.23 ± 1.9713.21 ± 1.09
Q3TJ94Prothrombin70.3Calcium ion binding; heparin binding; hydrolase activity; lipopolysaccharide binding; peptidase activity 27.20 ± 6.0421.87 ± 4.66 *
Q921I1Serotransferrin77.0 Ferric iron binding; ferric iron transmembrane transporter activity; ferrous iron binding; protein binding37.62 ± 1.7433.12 ± 6.63 *
P21614Vitamin D-binding Protein53.6Actin binding; vitamin D binding; vitamin transporter activity13.48 ± 0.5010.00 ± 0.84 *
G3X8Q5Ceruloplasmin121.1Chaperone binding; copper ion binding; ferroxidase activity; metal ion binding; oxidoreductase activity27.10 ± 6.1218.55 ± 3.41 *
P34928Apolipoprotein C-I9.3Fatty acid binding; lipase inhibitor activity; phosphatidylcholine binding; phospholipase inhibitor activity 17.66 ± 6.5210.39 ± 8.06
P33622Apolipoprotein C-III10.9Lipase inhibitor activity; lipid binding; phospholipid binding10.16 ± 1.5711.30 ± 2.18
P08226Apolipoprotein E35.9Amyloid-beta binding; antioxidant activity; cholesterol binding; cholesterol transporter activity; heparin binding10.50 ± 5.538.09 ± 1.95
A2A997Complement component C8 Alpha Chain66.1Complement binding; protein complex binding26.50 ± 2.2219.24 ± 3.85 *
Q9QWK4CD5 Antigen-Like38.9Scavenger receptor activity32.66 ± 8.3528.42 ± 3.43
Q8BH35Complement component C8 beta chain66.2 Constituent of the membrane attack complex (MAC) that plays a key role in the innate and adaptive immune response by forming pores in the plasma membrane of target cells 24.51 ± 4.6818.83 ± 1.95 *
Q9EP98Epidermal growth factor receptor 138.4Protein tyrosine kinase activity38.05 ± 3.8227.58 ± 3.90 *
P03953Complement Factor D28.1 actor D cleaves factor B when the latter is complexed with factor C3b, activating the C3bbb complex, which then becomes the C3 convertase of the alternate pathway. Its function is homologous to that of C1s in the classical pathway 20.06 ± 1.1916.71 ± 0.61 *
A0A075B5P6Ig mu chain C region (fragments)50.1Immunoglobin receptor binding44.95 ± 8.2335.34 ± 11.15
Q9DBD0Inhibitor of Carbonic Anhydrase76.7 Inhibitor for carbonic anhydrase 2 (CA2). Does not bind iron ions 18.24 ± 1.3613.52 ± 0.41 *
P29788 Vitronectin 54.9 Interact with glycosaminoglycans and proteoglycans. Is recognized by certain members of the integrin family and serves as a cell-to-substrate adhesion molecule. Inhibitor of the membrane-damaging effect of the terminal cytolytic complement pathway. 15.71 ± 2.2711.95 ± 0.88 *
E9PV24Fibrinogen alpha chain87.4 40.15 ± 7.3541.78 ± 3.03
HFD: High-Fat Diet; HDL: high-density lipoprotein. # These functions were curated from the UNIPROT database. * p < 0.05 vs. control.

