Abstract
The growth of e-commerce has led to a rapid increase in user-generated content (UGC), attracting scholars’ attention as a new data source for investigating customer requirements. However, existing requirements analysis methods fail to integrate three critical requirement indicators: stated importance, derived importance, and performance. Using only one or two of these indicators inevitably has its limitations. This paper proposes a novel framework for analyzing and prioritizing customer requirements based on multi-source UGC. First, customer requirements are extracted from online reviews and questions & answers using non-negative matrix factorization. Next, aspect-level sentiment analysis and multi-source data fusion are employed to calculate dual importance and performance. Specifically, we developed an improved importance–performance analysis (IPA) model, named dual importance–performance analysis (Du-IPA), which integrates the three indicators to classify requirement types in a 3D cube with corresponding improvement strategies. Finally, by combining the three indicators, an improved prospect value and PROMETHEE-II are proposed using prospect theory to prioritize CRs for product service improvement. The effectiveness of the proposed method is demonstrated through a case study of fresh food in online retail.
1. Introduction
In the context of today’s rapidly evolving business environment, understanding customer requirements (CRs) has emerged as a key driver for companies seeking to enhance their products and services while achieving sustainable growth. By gaining profound insights into customer perceptions and expectations, businesses can strategically refine existing products or innovatively develop services that align more closely with CRs [1,2]. This process represents a core strategy for enhancing customer satisfaction and serves as a vital pathway for building customer loyalty, fostering positive brand word-of-mouth, and securing a competitive advantage in the marketplace [3,4]. Consequently, how can CRs be effectively analyzed? Which requirements are most critical for improving product service? Addressing these questions is of significant importance for business.
Traditionally, companies have relied on questionnaires and interviews to gather CRs [5,6,7]. However, these methods often entail lengthy, resource-intensive processes, heavily depending on the surveyor’s expertise and experience, as well as respondents’ cooperation [8]. In contrast, the advent of the big data era and the rapid growth of e-commerce have led to the proliferation of online customer reviews [9]. These reviews are assessments of products and services based on personal experiences [10], providing insightful and genuine feedback from customers [11], thereby more accurately reflecting their opinions [12,13]. Consequently, numerous studies have concentrated on analyzing CRs derived from online reviews to help companies enhance their products and services, thereby enhancing customer satisfaction [5,7,14,15,16,17,18,19].
Most studies focus on analyzing CRs based on a single source of online reviews. However, online reviews may contain inaccurate information, and reliance on a single source can lead to biased conclusions [20,21]. Most e-commerce platforms provide user-generated content (UGC), which includes both online reviews and question-and-answer (Q&A) sections. Extracting CRs from Q&A sections may be more reliable, as the design of these systems makes manipulation more difficult [21,22]. Furthermore, according to information fusion theory, the integration of multi-source data can reduce biases associated with relying on a single data source through scenario complementarity. Online reviews capture post-purchase experience-related requirements, while Q&A data can capture CRs related to before and during the purchasing process [23]. The combination of these two sources provides a comprehensive coverage of the CR generation scenarios. Based on this, this study aims to propose a novel framework for analyzing CRs based on the two sources of UGC.
According to the dichotomy of explicit and implicit requirements, CRs can be classified into explicit and implicit CRs [24]. In CR analysis, stated importance serves as a core indicator of customer attention to various requirements, reflecting explicit CRs, while derived importance measures the impact of these CRs on customer satisfaction, corresponding to implicit CRs. These two dimensions together form the foundation of CR analysis. However, relying solely on stated importance and derived importance to prioritize improvements does not fully meet the practical needs of product and service optimization. Performance metrics should also be incorporated, which quantify the degree to which current CRs are satisfied. For instance, a CR may have high stated or derived importance, but if its performance is already close to or meets customer expectations, prioritizing its improvement may not be the most optimal choice, especially under resource constraints. Conversely, CRs with relatively low dual importance but significantly insufficient satisfaction are often more amenable to improvement and should be prioritized to enhance customer satisfaction in a competitive environment. Based on this, the first research question (RQ) of this study is proposed:
RQ1: How can CRs be identified from multi-source UGC, and how can their dual importance and actual performance be quantified?
Visualization methods, by transforming data features into spatial representations, allow managers to comprehensively and accurately grasp the multidimensional relationships of CRs with minimal cognitive load. Researchers have combined stated importance or derived importance with performance to construct the importance–performance analysis (IPA) model, which is used for visualizing and classifying CRs, while formulating improvement strategies [25,26,27,28,29,30]. Additionally, scholars have proposed the Kano model by measuring the asymmetric impact of customer demand quality on overall satisfaction. This model has become a key tool for assessing derived importance and has been applied to build the asymmetric impact-performance analysis (AIPA) model [31]. To provide a comprehensive analysis of CR, these models have been further optimized.
However, existing requirement visualization models focus on one or two indicators of dual importance and performance to analyze and classify CRs, and have not fully integrated the three key indicators. Although variants of the IPA or Kano models, such as the asymmetric impact–attention–performance analysis, improve the understanding of CRs by refining the classifications of stated importance, they fail to fully leverage the specific values of stated importance for deeper analysis. Relying on only one or two of these three indicators inevitably has limitations [32,33,34]. According to expectancy confirmation theory, customer satisfaction depends on the gap between expectations and actual performance, so neglecting the performance indicators makes it impossible to assess whether a CR requires improvement. According to the satisfaction asymmetry theory, the impact of CR fulfillment on satisfaction is asymmetric. For instance, an unmet requirement may lead to a significant decrease in satisfaction, while meeting this requirement only brings a slight increase. Therefore, ignoring derived importance could cause companies to overlook key requirements that are mentioned infrequently but are crucial, leading to resource misallocation. The core value of stated importance is to capture customers’ explicit CRs, and neglecting this indicator may result in product and service improvements that are disconnected from users’ explicit concerns, making the investment unable to translate into meaningful user-perceived value. Existing visualization methods struggle to integrate all three indicators to support decision-making effectively. Based on this, the second question of this study is proposed:
RQ2: How can three-dimensional visualization methods for CR analysis be constructed based on dual importance and performance to achieve precise classification of CRs?
Existing CR visualization methods based on IPA or Kano models effectively define CR categories, but they struggle to establish clear prioritization within the same category. To address this issue, researchers have attempted to incorporate additional dimensions, such as Kano types in the I-Kano model and stated importance in the AIPA model, to rank CRs within the same category [26,33]. Moreover, opportunity algorithms that determine improvement priorities by calculating the difference between CR importance and performance can handle attribute rankings. However, they overlook the unique asymmetric impact of CR performance on overall satisfaction, known as derived importance [35,36]. In general, most ranking methods based on IPA/Kano model classification results fail to integrate the three key indicators mentioned above, resulting in insufficient ranking accuracy.
A more critical issue lies in the psychological blind spot of existing ranking methods. When prioritizing CRs within the same type, traditional models often overlook the inherent risk aversion of decision-makers. They fail to assign higher priority to CRs that remain unmet and could more significantly lead to customer dissatisfaction or even complaints. This essentially ignores the “loss aversion” psychology exhibited by decision-makers under conditions of uncertainty and resource constraints. In practical product and service improvement decisions, managers tend to prioritize avoiding a decline in customer satisfaction (avoiding “losses”) rather than simply seeking an increase in satisfaction (seeking “gains”). This asymmetric psychological bias is difficult to capture accurately using symmetric mathematical optimization models that assume fully rational decision-making, such as simple difference calculations.
To address this gap, this study introduces prospect theory as the theoretical foundation for reconstructing the priority ranking of CR improvements. Prospect theory reveals that individuals are generally more sensitive to losses than to equivalent gains when making risk-based decisions [37]. This principle provides a more realistic psychological basis for understanding the actual decision-making behavior of managers. Based on this, the third research question of this study is proposed:
RQ3: How to determine the improvement priorities of CRs based on prospect theory, combined with dual importance and performance indicators, to provide clear directions for product and service improvement.
The remainder of this paper is organized as follows: Section 2 reviews related work; Section 3 elaborates on the proposed CR analysis and product service improvement framework based on multi-source UGC and prospect theory; Section 4 presents a case study on requirement analysis and prioritization for fresh food e-commerce (FFEC); Section 5 concludes this study and discusses the future work.
2. Related Works
This study aims to propose a new approach for CR analysis and product service improvement to address the three issues stated above. Therefore, this section provides a systematic review of the existing research in both domains.
2.1. CR Analyzing Methods
Existing methods for analyzing CRs primarily rely on the IPA and the Kano model. The IPA, introduced by Martilla and James [38], is widely used for product and service improvements to enhance customer satisfaction. It has been extensively applied to assess the importance and performance of various attributes across sectors, such as hotel services [39,40,41], public transportation services [42], and airport services [43], among others [44,45].
In the traditional IPA framework, attributes are plotted on a graph, with importance on the horizontal axis and satisfaction on the vertical axis (Figure 1). Using average values of importance and satisfaction as a reference, attributes are categorized into four quadrants, providing valuable insights for the development and optimization of products and services. Quadrant I includes attributes with high importance and satisfaction. Quadrant II includes attributes of high importance but lower satisfaction, indicating the need for urgent improvement. Quadrant III comprises attributes with both low importance and satisfaction, presenting opportunities for innovation. Finally, Quadrant IV holds attributes with low importance but high satisfaction, which are the lowest priority for improvement. Recently, scholars have made various enhancements to the IPA model to offer more effective strategies for improving products and services in competitive and dynamic environments [29,46].
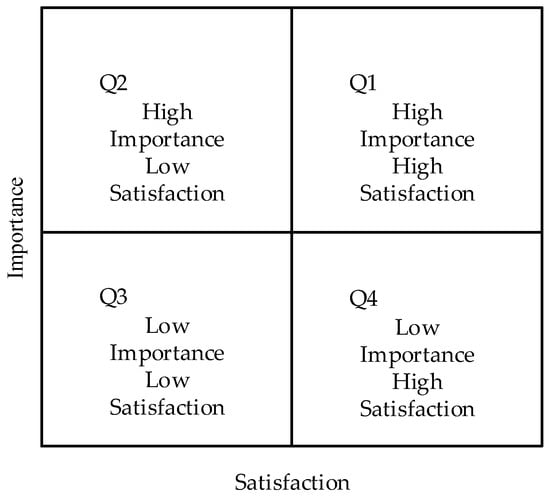
Figure 1.
Traditional IPA model.
Traditional IPA methods based on surveys can be costly and time-consuming. Consequently, there has been increasing interest in IPA using online reviews. Scholars have made certain improvements in this context. Online reviews, as direct feedback from customers, provide a wealth of information [34,47,48,49,50]. For example, Pan et al. [26] proposed an asymmetric impact-based importance–performance analysis (AIAPA) model that incorporates customer concerns to prioritize attributes. However, this model only classifies customer concern levels into two categories: high concern and low concern. It marks different symbols on a two-dimensional matrix of asymmetric influence and performance to represent the integrated concern level, but does not fully utilize the numerical values of concern for CR analysis.
By analyzing the mention frequency of specific CRs in UGCs, we can effectively assess stated importance, which reflects customers’ genuine concerns. Simultaneously, examining the impact of satisfaction on overall ratings helps uncover the objective weight of attributes in customer evaluations. This study integrates these two forms of importance and performance to improve IPA, balancing between customer concerns and objective importance. This approach enables a more comprehensive and accurate understanding of customers’ multi-dimensional evaluations of products and services, reducing biases associated with using a single method. Additionally, it provides businesses with a more scientific and rational basis for decision-making, facilitating the identification of areas for improvement in products and services, and ultimately enhancing overall customer satisfaction.
2.2. Prioritizing CRs for Product Service Improvement
One of the core purposes of categorizing CRs is to establish a reasonable priority order for those CRs, strategically enhancing products or services’ market competitiveness [46]. A common approach is to prioritize CRs based on the characteristics of their categories [17,51,52]. However, within the IPA framework, although it provides preliminary guidance for the improvement direction of CRs, it often struggles to distinguish priorities among CRs within the same category, leading to managerial indecision in resource allocation and strategy execution. To overcome this limitation, researchers have developed opportunity algorithms that rank CRs by calculating the difference between the importance and satisfaction levels of attributes within the same quadrant [35,36,53,54].
Although the Kano classification results can also be used to rank CRs, they similarly face challenges in ordering requirements within the same category. To address this, scholars have constructed differentiated satisfaction functions to rank CRs, which utilize coefficients derived from punishment and reward coefficient analysis (PRCA) to quantify customer satisfaction at the lowest and highest performance levels of attributes [55]. Subsequently, the satisfaction function is developed, and improvement priorities are established based on CRs’ marginal utility [56,57]. However, this method has a significant drawback: it fails to adequately consider CR’s performance, as it focuses solely on functions fitting for asymmetric effects and marginal utility calculation. Therefore, even if a CR’s marginal utility appears highest, its urgency for improvement may be minimal if it already meets or is close to meeting customer expectations.
The prioritization of CRs can also be regarded as a multi-attribute decision-making problem [58,59,60,61,62,63]. Existing literature has proposed several methods to address this issue. Firstly, point-scoring methods are considered the simplest approaches. Some researchers have employed the analytic hierarchy process (AHP) to rank CRs. To minimize the subjectivity of experts and customers, group decision-making methods have been adopted. Other scholars have proposed comprehensive methods to address the interval nature of evaluative language. However, many ranking methods overlook the psychological factors that influence managers, particularly the tendency for loss aversion. Only a few studies have incorporated psychological perspectives into CR prioritization. For instance, Du et al. [64] utilized a regret theory-based comprehensive method. Wang et al. [65] and Yang et al. [61] combined cumulative prospect theory with market survey methods. These approaches have limitations in dealing with complex CRs, as they mainly rely on single performance indicators or expert evaluations (offline survey), making it difficult to fully capture both the CRs’ dual importance and actual performance, as well as the value of UGC.
In light of this, this study aims to integrate the three key indicators of CR analysis—stated importance, derived importance, and performance—while considering the risk-averse psychology of managers in product service improvement using multi-source UGC. It enables precise quantification and intuitive presentation of CRs by constructing a three-dimensional visual analysis cube. The ranking process also captures the CRs’ multidimensional characteristics and managers’ psychological preferences, providing more effective decision support for product optimization and service enhancement.
3. Methodology
As illustrated in Figure 2, this study innovatively proposes a five-stage CR analysis and product service improvement framework —comprising CR extraction, performance analysis, dual importance determination, Du-IPA cube analysis, and prioritizing CRs —designed to systematically address the three core research questions raised earlier, with each stage’s design intentionally tailored to fill existing methodological gaps and align with the multi-source UGC characteristics.
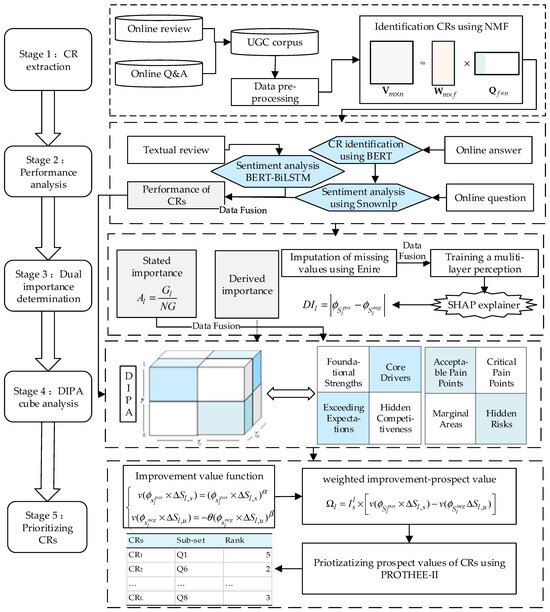
Figure 2.
The proposed framework to analyze CRs and product service improvement from multi-source UGC.
The first to third stages are tasked with addressing the first research question. Built on multi-source UGC, these three stages separately perform three tasks: CR extraction, calculation of CR performance, and calculation of dual importance. In the first stage, online reviews and Q&A are integrated at the data level and form a UGC corpus to avoid single-source bias, and then data pre-processing is conducted. Non-negative matrix factorization (NMF) is employed for CR extraction. Next, the second stage, performance analysis, adopts differentiated aspect-level sentiment models for the two data sources: BERT-BiLSTM for online reviews (to handle multi-aspect opinions and achieve fine-grained CR sentiment recognition) and BERT-SnowNLP for Q&A (to first align attributes in questions with concise answers, then analyze sentiment), followed by a decision-level fusion strategy to reconcile satisfaction differences between sources and obtain comprehensive performance values. For the third stage, dual importance determination, stated importance is quantified via frequency analysis, while derived importance—focusing on the asymmetric impact of CR fulfillment on overall satisfaction—is explored using enhanced representation through knowledge integration (ERNIE), a multi-layer perceptron (MLP), and Shapley additive explanations (SHAP).
The fourth stage is designed to address the second question. In this stage, an enhanced IPA model—dual importance–performance analysis (Du-IPA)—is developed on the basis of the quantified dual importance and performance. This model integrates the three indicators into a 3D cube, using 3D visualization to intuitively display CRs and dividing them into eight subcategories based on dual importance and performance values. This design overcomes the limitation of traditional 2D IPA and provides decision-makers with granular insights for preliminary improvement strategy planning.
Finally, the fifth stage is designed to address the third question. In this stage, an improved CR improvement prospect function based on prospect theory is developed—this function meticulously analyzes the increase in customer satisfaction and decrease in dissatisfaction to quantify improvement potential, fully incorporating decision-makers’ loss-aversion psychology. It then uses the preference ranking organization method for enrichment evaluations (PROMETHEE-II) to rank CRs within the same Du-IPA sub-cube, generating a comprehensive and operable priority sequence for product and service improvements.
3.1. CR Extraction
This section will introduce the specific process for CR extraction.
3.1.1. Data Collection, Fusion, and Preprocessing
Online reviews and online Q&A can be crawled from relevant platforms using Python 3.9, which is a widely used tool in text mining and analysis. The collected data need to be preprocessed to provide a basis for subsequent research, including word segmentation and removing stop words. In this study, “Jieba” is used for word segmentation. And a Chinese stop word list is applied for removing stop words.
3.1.2. Identifying CRs Using NMF
The NMF model, introduced by Lee and Seung [66], has been widely applied in areas such as theme identification from text, face/facial expression recognition [3,67,68]. By incorporating the term frequency-inverse document frequency (TFIDF) of words as priors, it generates semantically coherent topics. Its core concept is as follows: given any non-negative matrix , the NMF finds two non-negative matrices, and , enabling the decomposition of the original matrix into the product of two non-negative matrices.
In this study, we use NMF to identify the CRs from the collected corpus . We utilize the non-negative matrix , which contains the topic keywords’ probability results, to determine the general content of each topic discussion. The naming of topics should be done by researchers. The topic can be regarded as the corresponding . And the identified CRs set can be defined as .
3.2. Performance Analysis of the User-Generated Corpus
Performance is a core metric for assessing the extent to which CRs are met. This section focuses on the performance quantification methods for multi-source UGC. Considering that online reviews contain multi-dimensional feedback from experiences and that Q&A data targets specific needs, we design differentiated aspect-level sentiment analysis strategies. Subsequently, we integrate these insights at the decision-making level to eliminate biases from single data sources. Ultimately, this approach enables a precise measurement of the actual fulfillment levels of various CRs, providing the foundational data support for the subsequent integration analysis of dual importance and performance.
3.2.1. Performing Sentiment Analysis of Online Reviews
After extracting the CRs, aspect-level sentiment analysis is conducted to identify the sentiment polarity expressed by each customer concerning each CR. Since contradictory opinions may appear towards different CRs within the same text (e.g., “the customer service is excellent, but delivery is slow”), aspect-level sentiment analysis is employed to improve accuracy. This study constructs a combined sentiment analysis model using BERT and BiLSTM to assess the sentiment polarity of customers toward each CR from online reviews. BERT-BiLSTM is an improved model based on BERT to obtain the text representation vector and BiLSTM to collect the context information. In this combination sentiment model, BERT is the upstream part, and BiLSTM is the downstream part. Finally, a softmax classifier is used to translate BiLSTM’s results into sentiment results. The detailed steps for aspect-level sentiment analysis based on BERT-BiLSTM are as follows: First, select the customer evaluation scale as , based on this project’s characteristics. Second, extract a certain percentage (e.g., 10% or 20%) of reviews from the review set, for manual labeling. During labeling, each CR is marked individually: analyze whether each review contains a description of this CR. If not, label it as “9”. If yes, determine the customer’s evaluation scale for that CR and label accordingly. Next, train the sentiment analysis model for each CR using the labeled data, splitting it into for training, 10% for validation, and 10% for testing. Finally, input the full online review data into the trained models to perform sentiment analysis on each CR.
This study employs PLTS to represent sentiment analysis results further, thereby measuring the performance in satisfying CRs. The specific steps are as follows:
First, sentiment analysis results are expressed by using PLTS. Let represents probability linguistic term sets. The conversion rules between the probabilistic linguistic term set and the sentiment evaluation scale are as follows:
Then, probability linguistic sets are defined as:
where is the linguistic term along with the probability , and is the number of linguistic terms in PLTS . The probability that the specific CR is and the linguistic term is , is defined as
Finally, the customer satisfaction value of online reviews toward is calculated based on Equation (4).
where represents the satisfaction degree of in the corpus of online reviews.
3.2.2. Performing Sentiment Analysis of Online Answers
Online answers are typically brief responses to the queries posed in online questions, often omitting explicit attribute references in the text. This study proposed a sentiment analysis procedure specifically tailored for online answers (Figure 3). First, we leverage BERT to identify CRs in the online questions through training. Subsequently, we apply a widely used Chinese NLP tool, SnowNLP 0.12.3, to assess the sentiment conveyed in each online answer, reducing the need for manual labeling. Finally, we assume that the CRs identified in the queries correspond to their answers, and each answer’s sentiment value is determined based on Equation (5) in conjunction with SnowNLP output.
where represents the sentiment results of SnowNLP of the th online answer.
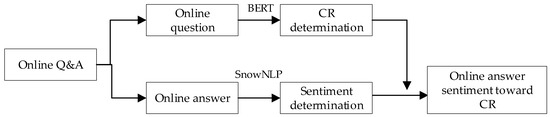
Figure 3.
The procedure for performing sentiment analysis of online answers.
The calculation of customer satisfaction for online answers can refer to the methods used for online reviews. First, online answers’ sentiment analysis results are presented using PLTS based on Equations (1)–(4). Then, customer satisfaction with online Q&A toward is calculated according to Equation (6).
where represents the satisfaction degree of in the corpus of online Q&A.
3.2.3. Acquiring Performance of Each CR Based on Decision-Level Fusion
The fusion of customer satisfaction from online reviews and online Q&A enables a more comprehensive evaluation, reducing biases that may arise from relying on a single data source. This study calculates overall customer satisfaction by combining the satisfaction scores from both sources, as shown in Equation (7).
An adjustment parameter is introduced to dynamically modulate the weights of online Q&A and online review satisfaction in the aggregated evaluation. The value of this parameter can be determined based on the product’s lifecycle, in line with lifecycle theory. For instance, during the early stages of the lifecycle, when the focus is on attracting new customers, can be set to less than 0.5, giving more weight to online Q&A. In the later stages, when the goal is to retain customers and reduce churn, can be set above 0.5, giving more weight to online reviews.
3.3. Dual Importance Determination for Each CR
3.3.1. Acquiring the Stated Importance of Each CR
The stated importance calculated from UGC is typically gauged by analyzing the mention frequency related to specific CRs. The more frequently a requirement is mentioned, the greater their concern or interest in that CR, implying higher stated importance. In this study, we count the occurrences of online reviews (Q&A) that mention specific CRs through aspect-level sentiment analysis results. We define the number of online reviews containing the in online reviews (Q&A) as (). Then, employ Equation (8) to calculate the frequency of requirement .
where represents the total number of online reviews in the collected corpus, and is the total number of online Q&A. is the frequency calculated from online reviews, while is derived from online Q&A. It is crucial to note that, although a CR may be mentioned multiple times in a single review or Q&A, for our calculation, the multiple times are counted only once. This ensures that the frequency reflects the level of focus or attention given to the CR by the customers, without being inflated by repeated mentions within the single review or Q&A.
Similarly to the calculation process of CR performance, this study integrates the frequencies from two data sources to compute the stated importance of . The calculation formula is as follows:
3.3.2. Acquiring the Derived Importance of Each CR
The derived importance refers to the influence of a specific attribute on overall customer satisfaction, often measured through star ratings. This study introduces an innovative methodology with the primary objective of precisely determining the derived importance of various attributes. The complete procedure is summarized in Algorithm 1.
| Algorithm 1: Calculation of Derived Importance |
| Input: online_reviews, online_qa, customer_requirement Output: derived_importance # Step 1: Data preprocessing and missing value imputation for each qa in online_qa: qa_vector = ERNIE.encode(qa.text) max_similarity = 0 best_match_rating = None for each review in online_reviews: review_vector = ERNIE.encode(review.text) similarity = cosine_similarity(qa_vevtor, review_vector) if similarity > max_similarity: max_similarity = similarity best_match_rating = review.star_rating qa.assiged_rating = best_match_rating # Step 2: Construct training dataset combined_data = merge(online_review, online_qa) structured_data = [] for each data_point in combined_data features = [] for each CR in customer_requirements: sentiment = get_sentiment_value(data_point, CR) fearures.append(sentiment) structured_data.append({ ‘features’: features, ‘target_rating’: data_point.star_rating }) # Step 3: Train MLP model mlp_model = MLP(layers = [input_size, 128, 128, 128, output_size]) mlp_model.train(structured_data.features,structured_data.target_rating) # Step 4: Determining feature importance SHAP values shap_explainer = SHAPExplainer(mlp.model) shap_values = shap_explainer.shap_values(structured_data.features) # Step 5: calculate derived importance derived_importance = [] for each CR_i in customer_requirements: cr_shap_values = shap_values[:, i] positive_impact = mean(positive(cr_shap_values)) negative_impact = mean(negative(cr_shap_values)) derived_importance[i] = abs(positive_impact − negative_impact) return derived_importance |
- (1)
- Data preprocessing and missing value imputation: The absence of a star-rating system in online answers constrains calculating the derived importance of attributes based solely on this data source. We initially utilize ERNIE to map both online answers and online review texts into vector representations. Subsequently, based on the vectorization results, the cosine similarity is calculated between each online answer and every review within the collection of online reviews. Finally, we match each online answer with online reviews, identifying the one with the highest similarity score, and assigning the corresponding star rating of that online review to the online answer.
- (2)
- Construct training dataset. In this step, firstly, online answers with online review data are integrated to form a new set of UGC, denoted as UGC_2, which comprises a total of data entries, such that . The input data for the MLP consists of satisfaction scores with various CRs. Let denote the structure data of th data of UGC_2. Let and represent the sentiment value of th data toward , and can be obtained according to Equation (10). The structure of the training data is shown in Table 1, which serves as a structured example of the data format. Subsequently, the structured input data is fed into the MLP.
 Table 1. The structure of the training data (a structured example).
- (3)
- Training an MLP. When quantifying the asymmetric impact of CR fulfillment on overall satisfaction, approaches such as multiple linear regression or neural networks are commonly employed. Given that neural networks can circumvent the assumptions of multiple linear regression, such as the normal distribution of variables, this study constructed an MLP, a type of neural network, to model the impact of attribute sentiments on overall satisfaction.
- (4)
- Determining feature importance using SHAP. We employ SHAP to quantify the specific contributions of each feature towards the model’s prediction outcomes. The calculation of the SHAP value for each input feature is as follows:
- (5)
- Calculate the derived importance of each requirement. The difference between pos and neg, as determined by Equation (12), represents the influence scope of each requirement on overall satisfaction.
3.4. Requirement Analysis Using Du-IPA
In analyzing CRs, few studies have simultaneously examined frequency, asymmetric impact, and performance. Previous research often focused on constructing an IPA model based solely on frequency (as importance) and performance, or an AIPA model that incorporates asymmetric impact and performance to guide product and service improvements, but rarely integrates all three indicators comprehensively. This study, therefore, proposes a requirement analysis cube, named Du-IPA, that integrates these three indicators (Figure 4). This cube encompasses three axes: the horizontal axis represents the stated importance, the vertical axis depicts derived importance, and the axis, traversing up and down, depicts CR performance.
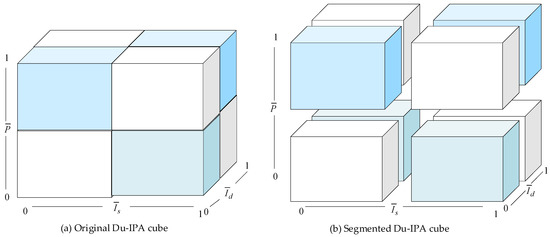
Figure 4.
Du-IPA cube.
The steps to conduct a Du-IPA cube are as follows: First, the stated importance, derived importance, and performance values are standardized to facilitate comparative analysis across different CRs (Equation (13)).
Then, each CR is characterized by the values of these three dimensions as . The center lines along the horizontal, vertical, and up-down represent the mean values of these dimensions, calculated according using Equation (14). These center lines serve as thresholds dividing the Du-IPA cube into eight sub-cubes, as shown in Figure 4b.
Finally, the Du-IPA cube is established for CR classification and analysis. This Du-IPA model categorizes CRs into eight distinct types. Figure 5a shows CR types with satisfaction levels above the mean, while Figure 5b illustrates those below the mean. The corresponding managerial implications for each type are illustrated in Table 2.
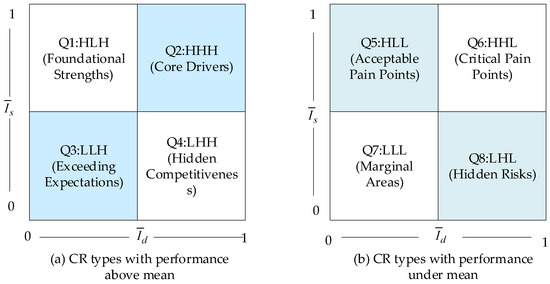
Figure 5.
CR types in Du-IPA.
Table 2.
The managerial implications of CR types.
To improve product service and enhance customer satisfaction, managers should prioritize their focus on unmet CRs with high importance initially. Attention should be directed towards those CRs that customers deem essential and have a higher potential to elevate their satisfaction levels. Consequently, based on the Du-IPA cube, a preliminary prioritizing of requirements can be derived, offering insights to guide managerial decision-making: Q6 > Q8 > Q5 > Q7 > Q2 > Q4 > Q1 > Q3.
3.5. Improvement Index Calculation for Product Service Improvement
Du-IPA can initially rank requirements based on their sub-cube. To refine the priority within the same quadrant, this study integrates stated importance, derived importance, and performance, and utilizes prospect theory to calculate each CR’s improvement prospect value. The final ranking is then determined using the PROMETHEE-II method. The steps are as follows:
First, calculate the performance improvement value, assuming that improvements can bring attributes to a state of perfect satisfaction (satisfaction probability = 1). The increment in satisfaction can then be calculated using Equation (15).
Similarly, assuming that improvements can completely eradicate dissatisfaction (dissatisfaction probability = 0). The decrement in dissatisfaction corresponds directly to the current dissatisfaction probability, as shown in Equation (16).
Second, calculate the weighted performance improvement value. In this step, we employ the value function from prospect theory to nonlinearly adjust the increment in satisfaction and the decrement in dissatisfaction. The value function has the following characteristics: for the increment in satisfaction (gains), it is concave, meaning marginal value decreases as gains increase; for the decrement in dissatisfaction (losses), it is convex, meaning marginal value increases as losses diminish. Additionally, the psychological impact of losses often exceeds that of equivalent gains.
where represents the th linguistic term of . In this study, according to Tversky and Kahneman [15], the parameters are set as .
Let denote the weighted performance-improvement-prospect value of , calculated according to Equation (18). This calculation takes into account the stated importance , the asymmetry of satisfaction and dissatisfaction , as well as the decrement in dissatisfaction and increment in satisfaction .
Third, the dominance degree matrix for pairwise comparisons of CRs can be constructed using weighted performance-improvement-prospect value and the PROMETHEE-II method, where denotes dominance degree and is expressed by:
represents the preference threshold and is defined as
where
Based on the dominance degree matrix, let be the dominant degree, “outflow,” which measures the degree to dominate the other CRs. Let be the non-dominant degree, “inflow,” which describes how is dominated by others. and are defined as
Let be the “netflow,” which measures the difference between the degree of dominance and non-dominance of , and can be calculated as
Obviously, CRs with higher “netflow” have relatively higher improvement prospect values and a higher priority to improve.
4. Case Study
A case study of FFEC’s requirement analysis and prioritization is conducted to verify the proposed method’s applicability. This section provides a detailed explanation of the complete process and analysis results for demand extraction, performance analysis, dual importance analysis, Du-IPA, and prioritization in this case study.
4.1. Results of CR Extraction
4.1.1. Data Collection and Pre-Processing
The UGC of FFEC companies was scraped from www.jd.com, one of the largest online shopping platforms in China. Using Python, online review and Q&A were automatically collected, online reviews, questions, and answers were automatically collected, with data spanning from April 2019 to July 2024. To enhance representativeness, data for 129 types of fresh food products were scraped. Detailed data information is provided in Table 3.
Table 3.
The details of the collected data.
Then, we integrate these data to form a user-generated corpus. For the convenience of the next step, this corpus must be pre-processed. “Jieba” was used for word segmentation. A Chinese stop-word list was used to conduct stop-word removal.
4.1.2. Results of CR Extraction Using NMF
Based on NMF, we extract CRs from the UGC corpus in this study. We imported the NMF model from the “sklearn” library for this study. However, the matrix generated during NMF construction results in high memory requirements. We therefore adopted the “MiniBatch” strategy, which fits the NMF model via mini-batch gradient descent, aiming to mitigate the out-of-memory issue when processing large datasets.
An important parameter in the construction of the NMF model is the rank, which corresponds to the number of topics in the topic modeling process. To determine the optimal number of candidate topics, we first fit the NMF model with different ranks (ranging from 1 to 20) following the method proposed by Bellstam et al. [69]. During this process, we observed that when the number of topics was set to 10, the keywords for each topic were highly similar. Additionally, we applied the elbow method to further validate the optimal topic number by calculating the reconstruction error for different numbers of clusters (as shown in Figure 6). When the number of topics reached 10, the reconstruction started to decline at a slower rate, indicating that this was an appropriate truncation point. To ensure the robustness of the results, we also tested clustering results for other topic numbers. In conclusion, too few topics may lead to the omission of some topics, while too many can cause redundancy. Therefore, choosing 10 as the optimal number of topics is both reasonable and well-supported.
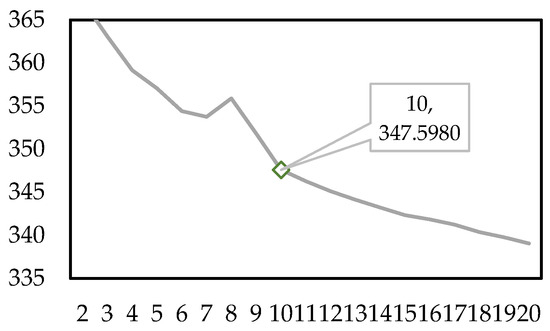
Figure 6.
Results of reconstruction error of different rank numbers.
Then, human intervention was necessary to assign names to the topics based on the obtained keyword results of NMF. The topic keywords and human naming results are shown in Table 4. Despite initially setting the number of topics for NMF fitting at 10, we ultimately obtained 7 distinct topics, as two of them, named “Taste,” were found to be duplicated and were manually merged. The topics named “Comprehensiveness” and “repurchase intention” were removed as they were deemed less relevant to CRs.
Table 4.
NMF topic keywords and human naming results.
Each topic represents a specific CR identified from the online review corpus. According to the topics , the set of CRs can be defined as express delivery (), cost-effectiveness (), customer service (), freshness (), mouth-feel (), specification and weight (), and packaging ().
4.2. Results of Performance Analysis
Based on the performance analysis method outlined in Section 3.2, this section presents the performance analysis processes and results derived from online reviews and online Q&A.
4.2.1. Results of Sentiment Analysis of Online Reviews
In this phase, we randomly selected 20 percent of the online reviews in the corpus, a total of 15,816 data pieces, as the manually tagged data set for manual labeling. For one online review in the manually tagged data set, we determine whether it contains relevant descriptions of the , and if so, further determine whether the sentiment polarity of the description of this CR is positive, neutral, or negative. Positive is marked with 1, neutral with 0, and negative with −1. The online review that does not include a description of this CR is marked with 4. Then, we divided the manually tagged data set into training, validation, and test sets. The number of online reviews in the training set accounted for 80 percent of the manually tagged data set, 10 percent in the validation set, and 10 percent in the test set.
Notably, the BERT-BiLSTM models used in this study were built based on the Keras framework, leveraging the pre-trained Chinese BERT model “chinese_L-12_H-768_A-12” as the backbone. For the BERT component, we set “max_seq_length” to 128 to adapt to the short-sequence nature of Chinese online reviews, which do not require long sequences to capture core semantic information. For the BiLSTM component, we configured the “hidden size” to 128 to balance contextual feature capture and model complexity, and set the dropout rate to 0.3 to mitigate overfitting [70].
The training and validation sets were sent to fit the BERT-BiLSTM models. The test set was used to evaluate the performance of these trained models. Further, we use the seven trained models to analyze the sentiment polarity of each review in the collected review set. Finally, we obtain the number of online reviews of different sentiment polarities concerning each CR, as shown in Table 5.
Table 5.
Number of online reviews and answers expressing different sentiment polarities.
4.2.2. Results of Sentiment Analysis of Online Answers
Similarly to capturing sentiments from online reviews, this study initially annotated the requirements embodied in 20% of the online questions. If a particular requirement was present, it was labeled as 1; otherwise, it was labeled as 0 (with separate annotations for each CR, resulting in seven training sets). By constructing and training the 7 BERT classifiers, we identified the CRs associated with each online question. Subsequently, we employed SnowNLP to discern the sentiment orientation of the corresponding online answers. Leveraging Equation (5) and Figure 3, we extracted the requirements mentioned in each online answer along with their sentiment polarities. Table 5 presents the frequency of each sentiment polarity for each identified CR.
4.2.3. Calculation Results of the Performance of CRs
In this section, sentiment analysis outcomes are represented using PLTS, as illustrated in Table 6. Subsequently, customer satisfaction for both online reviews and answers is calculated individually using Equations (4) and (6). Finally, the overall performance values of the requirement are derived through the fusion method in Equation (7) (Table 7). In this case study, for the purpose of validating the effectiveness of the proposed method, is taken as a general value of 0.5.
Table 6.
Sentiment analysis outcomes represented by PLTS.
Table 7.
Performance values of CRs.
Figure 7 visualizes the calculation results of performance. It shows that the comprehensive performance value balances the differences between online answers and reviews. Customers express more dissatisfaction in online Q&A, likely due to the focused nature of user inquiries, which typically target specific CR. Responders address the performance related to those CRs. In contrast, reviews reflect a border range of factors, where dissatisfaction regarding one CR may be alleviated by satisfaction in others. Additionally, Figure 7 reveals that customers are most satisfied with packaging and delivery services after purchasing fresh food. Conversely, they are most dissatisfied with cost-effectiveness and customer service.
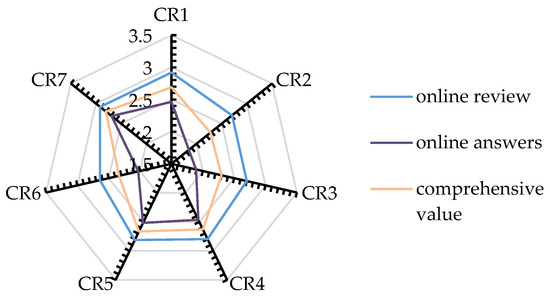
Figure 7.
Performance across different CRs.
4.3. Results of Dual Importance Determining
Based on the dual importance determination method presented in Section 3.3, this section outlines the specific processes and results for determining the dual importance in this case study.
4.3.1. Results of Stated Importance Calculation
Using the BERT-BiLSTM results, we count the number of online reviews containing the seven CRs. Customer attention for each CR is calculated using Equation (9) and shown in Table 8.
Table 8.
Stated importance of CRs.
Similarly to CR performance, Figure 8 shows that customer attention given to various CRs in the Q&A system is noticeably lower than that in the review system. This difference can also be attributed to the distinct mechanisms of the two systems. A customer’s question typically addresses a single CR, and responders focus solely on that aspect. In contrast, an online review may cover multiple CRs, leading to a higher proportion of each CR within the total review set. Figure 8 also reveals that customers are more focused on freshness, taste, and product specifications, while paying less attention to customer service and packaging.
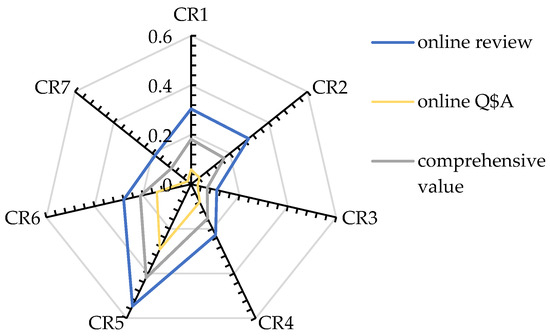
Figure 8.
Stated importance (frequency) distribution of CRs.
4.3.2. Results of Derived Importance Calculation
In this section, we commence by vectorizing the online reviews and answer data utilizing the ERNIE 3.0-scale model. Based on commonly used settings in research, we configure the Transformer with 12 layers, a hidden layer dimension of 768, 12 attention heads, and a maximum sequence length of 512. Subsequently, we calculate the closest online review for each online answer and supplement the rating of the online answers.
To assess the impact of the fulfillment degree of individual requirements on overall satisfaction, we have constructed an MLP using TensorFlow 2.8.0. Typically, for simpler fitting tasks, selecting a smaller number of layers suffices to prevent overfitting [71,72,73]. Consequently, the number of hidden layers for the MLP in this study is determined to be three, each comprising 128 neurons. Furthermore, we employ SHAP values to compute the asymmetric influence coefficients of each requirement on satisfaction, along with their derived importance, as presented in Table 9.
Table 9.
The derived importance of CRs.
4.4. Results of Du-IPA
To construct the Du-IPA cube, the dual importance and performance results must be standardized according to Equation (13), as shown in Table 10. Then, the standardized results are integrated into the Du-IPA cube for representation and initial prioritization. Figure 9 illustrates the Du-IPA results of fresh food e-commerce. Decision-makers can use this to gain insights into CRs and generate strategies for product service improvement.
Table 10.
The standardized results of the dual importance and performance of CRs.
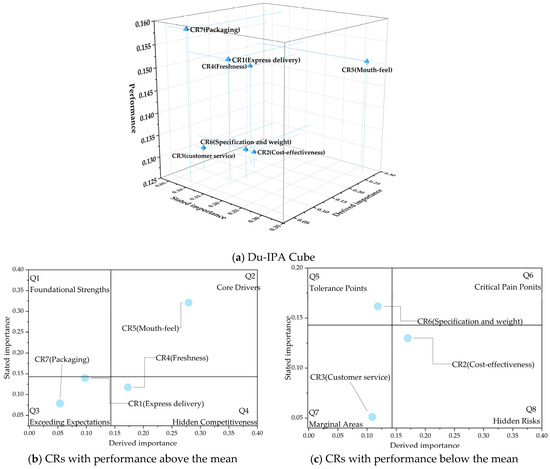
Figure 9.
Du-IPA results of fresh food E-commerce.
Du-IPA results indicate that “Mouth-feel” is the “Core driver” for fresh e-commerce, with high attention, performance, and impact. FFEC should continue investing in services related to this CR, actively develop new flavors, and maintain product diversity to meet the growing taste preferences of customers. Additionally, establishing strict taste testing standards will ensure that each batch of products meets high-quality taste requirements. “Packaging” and “Express delivery” are “Exceeding Expectations,” characterized by low customer attention and impact, but high performance. These areas do not require further investment. Instead, resources should be redirected to areas needing more urgent improvement while maintaining these CRs’ current performance.
“Freshness” is a “Hidden Competitiveness” that receives less customer attention but significantly impacts satisfaction and exhibits high performance. FFEC must recognize its importance and maintain its current high performance. Additionally, FFEC should also strengthen supply chain management and establish clear, quantifiable freshness standards to adapt to potential market or CR changes. “Specifications and weight” fall into the “Acceptable Pain Points”, characterized by low impact and performance, but high attention. The current low performance here does not significantly affect customer satisfaction. FFEC can optimize this CR by clearly communicating information about product specifications and weight to enhance customer satisfaction.
“Customer service” falls into the “Marginal Areas”. Although its performance is lacking, its limited impact on satisfaction means immediate improvements are not essential. However, when resources allow, enhancing this CR could boost overall satisfaction, as this CR may present innovative opportunities for FFEC to explore competitive advantages. “Cost-effectiveness” represents a “hidden risk.” Though customers pay little attention to this CR, its performance significantly impacts overall satisfaction, and current offerings fail to meet customer expectations. Improving performance here is essential. FFEC must recognize this hidden risk and enhance product service quality to increase customers’ perceived value.
4.5. Results of the Improvement Index
Since and fall within the same quadrant in the Du-IPA results, their priorities cannot be distinguished. Therefore, this study further calculates the priorities of these two CRs. First, the improvement prospect value is calculated using Equations (15)–(18). The results are shown in Table 11.
Table 11.
The results of the improvement prospect value.
Then, the preference thresholds can be calculated by Equations (20) and (21). The result is . Based on the stochastic dominance relation matrices constructed above and these thresholds, the stochastic dominance degree matrices on pairwise comparisons of and are derived as:
Finally, the dominant degree and non-dominant degree can be calculated using Equations (22) and (23). Then, the “netflow”, which measures the improvement index, is obtained via Equation (24) and shown in Table 12. Table 13 presents the sub-cubes where each CR falls, and the results of both the initial and final ranking.
Table 12.
Improvement index of CR1 and CR7.
Table 13.
Final prioritization results of CRs.
4.6. Comparison Analysis and Sensitivity Analysis
To validate the superiority and stability of the methods employed in this study, this section presents a comparative analysis between the sentiment analysis methods and CR analysis methods used in this paper and existing methodologies. Furthermore, sensitivity analyses of the data fusion weights and the parameters in prospect theory are conducted.
4.6.1. Comparison of Sentiment Analysis Methods
Sentiment analysis results serve as a crucial input for CR analysis, and their reliability directly affects the accuracy of the final analysis outcomes. Given the outstanding performance of BERT in various fields in recent years, this study employs the BERT-BiLSTM model for sentiment analysis. To validate the reliability of this method, we compared it with commonly used models, including BiLSTM [28], BERT [29], and SVM [74]. Based on the data collected in this study and the labeled dataset described in Section 3.2.3, we calculated the precision, accuracy, recall, and F1 score for each model, as shown in Figure 10. The results indicate that the sentiment analysis model employed in this study outperforms the other three models.
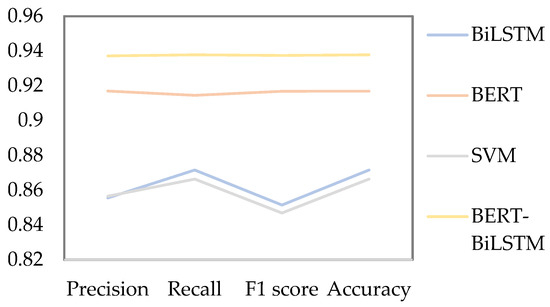
Figure 10.
Performance metrics of sentiment analysis models.
4.6.2. Comparison of the Existing CR Analysis Methods
This study aims to develop a CR analysis model based on multi-source data from online reviews and online Q&A, integrating both the dual importance and performance of CR, alongside a product service improvement method based on prospect theory. In this regard, this study compares existing literature that is most similar to the problem addressed here to assess whether the proposed decision-making method is more effective than existing methods. Lee et al. [33] proposed an Importance-Kano analysis framework, which integrates the stated importance, derived importance, and Kano types, and visualizes them through the I-Kano matrix. The I-Kano matrix, constructed using the online review data collected in this study, is shown in Figure 11.
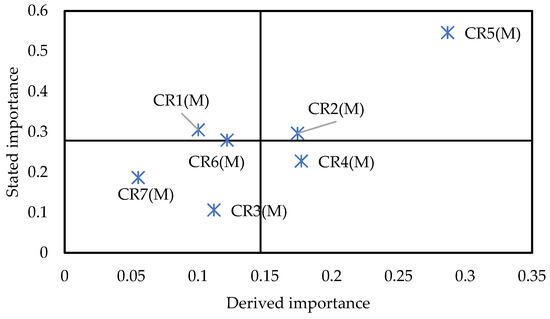
Figure 11.
Results of the I-Kano matrix.
Firstly, the differences in stated importance results (Figure 9 and Figure 11) highlight the advantages of multi-source data integration. For example, the importance of “Express delivery” and “Cost-effectiveness” in the I-Kano matrix is above the average, but below the average in the Du-IPA cube. In the I-Kano matrix, “Express delivery” holds more stated importance than “Specification and weight,” while conversely in the Du-IPA cube. These discrepancies arise primarily because the Du-IPA cube analysis framework incorporates data from both online reviews and Q&A, whereas the I-Kano matrix relies solely on review data. The inclusion of online Q&A data reduces the stated importance of these two CRs, likely because customers pay less attention to them in online Q&A. On the other hand, “Specification and weight,” compared to “Express delivery,” may receive less attention in reviews but is more frequently discussed in online Q&A. The Du-IPA cube, therefore, allows for adjustments in prioritizing these CRs, such as elevating “Specification and weight” while deprioritizing “Express delivery” and “Cost-effectiveness”, minimizing decision-making errors. To optimize product service, managers should consider both online reviews and Q&A data to gain richer insights, reduce cognitive biases, and improve decision-making.
Secondly, Du-IPA divides CRs into eight quadrants based on their importance and performance, formulating optimization strategies tailored to each quadrant. In contrast, the I-Kano framework classifies CRs into Kano types, providing multi-dimensional insights for managers, but it is less suited to all stages of the product service lifecycle. In the early stages, fulfilling a CR might induce pleasure, making it a “delight” attribute, but as the product or service becomes more familiar, it may evolve into a “one-dimensional” CR and eventually a “basic” CR [75,76]. The I-Kano framework fails to provide the current performance data for these CRs, limiting managers’ ability to optimize the product service. In contrast, Du-IPA enables companies to track CR performance, identify areas requiring improvement, and dynamically adjust resource allocation based on the dual importance and performance of CRs. This supports ongoing optimization across multiple stages, from product launch to the entire lifecycle.
Finally, existing research primarily focuses on optimizing the IPA or Kano models, providing decision-making support for managers’ practical work [25,26,27,28]. However, regarding further service improvements, most studies rely on these models to prioritize CR improvements based on the managerial implications of CR classification. This study, however, applies prospect theory and utilizes the three indicators of Du-IPA to construct an improved prospect value, prioritizing CR improvements. This approach offers a more in-depth decision-making tool for managers in service improvement, which is the key advantage of the proposed method.
4.6.3. Sensitivity Analysis of Data Fusion Weights
Existing studies typically use online reviews for CR analysis, while only a few studies have employed online Q&A to extract customer opinions. This study integrates both data sources through a weighted fusion method with a parameter . Although the value of this parameter allows managers to adjust it based on the characteristics of their products/services, to help them better understand the role of and the advantages of multi-source data fusion, we construct the Du-IPA using only online Q&A (), only online reviews (), and values of 0.3, 0.5, and 0.8. The data points of each CR are connected by curves to illustrate their variations in Figure 12.
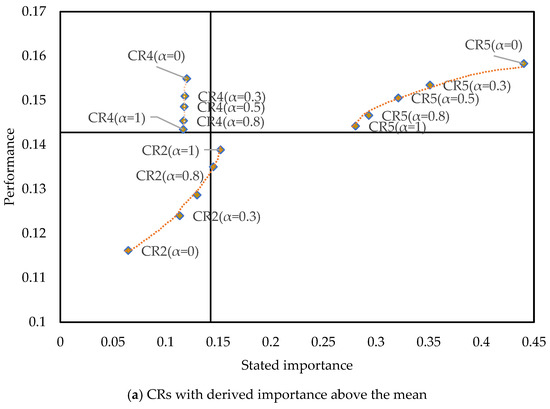
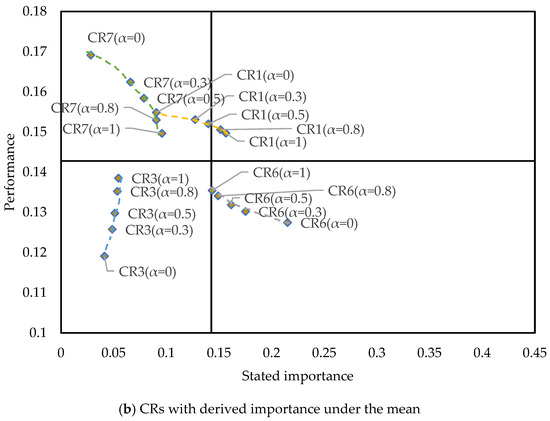
Figure 12.
The Du-IPA with different adjusting parameters.
It is noteworthy that and exhibit different CR classifications when using only online review data or only online Q&A data, indicating that the conclusions drawn from these two data sources can differ. The parameter adjusts the difference between the two, enabling the final classification results to incorporate both the manager’s expertise of a specific product (the setting of value) and the differing customer opinions from the two distinct data sources. In Figure 12, it can be observed that the greater the discrepancy between the results of the single data sources, the more pronounced the effect of , with the curves connecting different points becoming longer.
4.6.4. Sensitivity Analysis of Risk Preference Coefficients and Loss Aversion Coefficient
According to Prospect Theory, risk preference coefficient measures a decision-maker’s risk attitude toward “gains” (the smaller is, the more conservative the decision-maker is regarding gains). As illustrated in Figure 13, when varies within the range of 0.18–0.98, the improved prospect values of and both exhibit a trend of “decreasing rapidly in the early stage and converging gently in the later stage”. Throughout the entire range, the improved prospect value of is consistently higher than that of , while is more sensitive to the initial changes of than . For instance, when α increases from 0.18 to 0.38, the relative decrease rate of reaches 0.7171, whereas that of is 0.5980. As approaches its benchmark value (0.88), the variation amplitudes of the two CR types gradually converge. In general, the stronger a decision-maker’s risk preference for gains (i.e., the higher is), the lower the improved prospect values of and will be, with the initial impact on being more prominent.
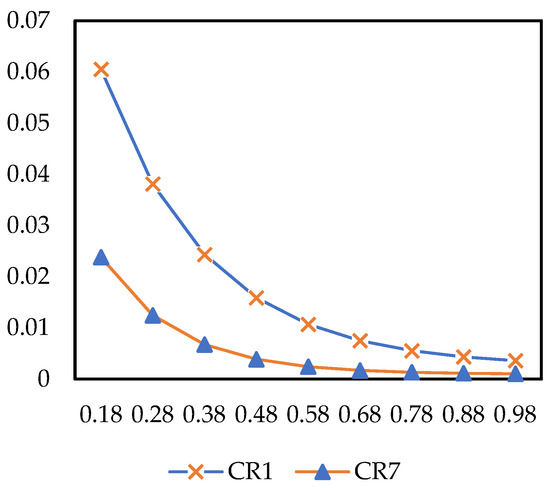
Figure 13.
The impact of on improved prospect value.
The risk preference coefficient measures a decision-maker’s risk attitude toward “losses” (the smaller is, the more sensitive the decision-maker is to losses). In Figure 14, when varies within the range of 0.18–0.98, the improved prospect value shows a significant decreasing trend, and its initial fluctuation amplitude is much larger than that of α. In summary, an increase in risk preference for losses (i.e., a higher ) will significantly weaken the improved prospect values of both demand types, and the impact is most pronounced in the loss-sensitive stage (when is relatively small).
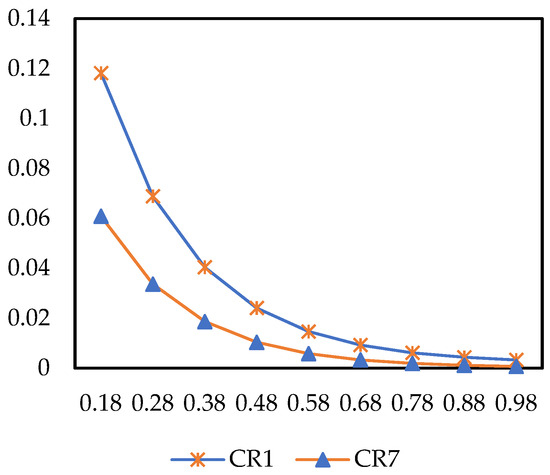
Figure 14.
The impact of on improved prospect value.
measures the psychological weight of losses relative to gains ( > 1 indicates loss aversion). When varies within the range of 0.25–4.25, the improved prospect values of and show a continuously stable increasing trend (Figure 15). The higher the degree of loss aversion (i.e., the higher is), the higher the improved prospect values of both demand types will be, with the positive promotion effect on being more obvious.
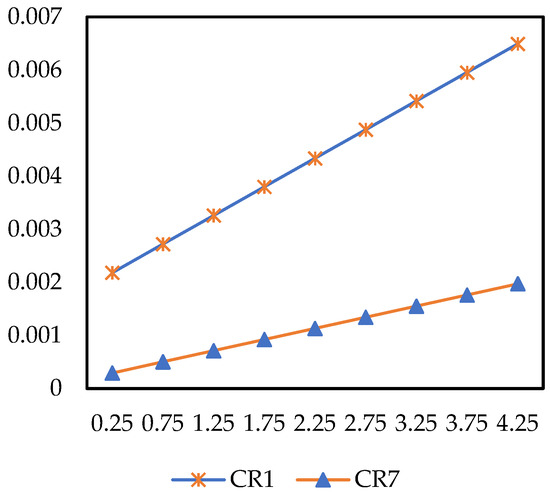
Figure 15.
The impact of on improved prospect value.
In conclusion, the influence intensity of the three coefficients on the improved prospect value is ranked as: risk preference coefficient for losses > loss aversion coefficient > risk preference coefficient for gains. Fluctuations in loss-related coefficients are the core factors affecting the improved prospect value. Additionally, although the two demand types differ in their sensitivity to coefficient changes, the improved prospect value of is consistently higher than that of throughout the entire range, which also verifies the stability of the improved prospect value calculation in this case study.
5. Conclusions
In the fierce competitive business environment, many companies are struggling to maintain growth, underscoring the need to analyze and prioritize CRs to improve products and services. However, existing methods typically rely on a single data source, such as online reviews, and often focus on only one aspect of importance or fail to integrate CR performance to inform product and service optimization decisions. This study proposes a multidimensional CR analysis framework that combines multi-source UGC, considering both the dual importance and performance of CRs. It is also designed to prioritize CRs based on prospect theory. Compared to existing methods, the innovation and advantages of the proposed method are reflected in the following aspects: First, this study innovatively introduces a method for analyzing CRs using two data sources—online reviews and Q&A—reducing the potential biases that may arise from relying on a single data source. Second, by integrating the dual importance of CRs with CR performance, it constructs an improved IPA, Du-IPA, which divides CRs into eight categories. This provides managers with a more detailed, visualized tool for CR classification and optimization strategy recommendations. Finally, this study extends existing research by applying prospect theory to calculate the improvement prospects of each CR, offering an improved performance improvement value calculation method to provide more specific decision-making support in product and service improvement.
This study provides several management insights: First, for managers, this study highlights the importance of using online reviews and Q&A to jointly uncover CRs. As shown in Figure 12, the categorization of CRs can vary depending on the data sources. Managers can assign different weights to these two data sources based on their understanding of the product lifecycle stages, enabling a more comprehensive assessment of customer opinions across different stages of the purchase journey. Second, managers can integrate three key indicators of CRs and utilize Du-IPA to generate specific strategies and plans for product service optimization. For instance, in the case of FFEC, managers should prioritize cost-effectiveness, as it is a hidden risk for the FFEC operation. Finally, this study emphasizes the need to prioritize the CRs within the same category to establish a total order of all CRs. This is crucial for supporting managers in making more effective decisions in practice. By quantifying the non-linear utility of “dissatisfaction reduction” and “satisfaction increase,” managers can accurately identify key CRs within the same quadrant that, if left unaddressed, would result in greater losses, thereby maximizing the loss-avoidance benefits of each investment.
However, this study also has some limitations. First, while deep learning methods are used for fine-grained sentiment analysis to categorize customer sentiments as positive, negative, or neutral, real-world emotions can vary in intensity. More granular sentiment classification, such as “very positive,” “positive,” “neutral,” “negative,” and “very negative,” could provide deeper insights. The failure to consider these intensity variations may result in the loss of valuable information for decision-making. Future research will consider more fine-grained sentiment classification methods. Second, this study treats all customers as a single group, but in segmented markets, customer needs may differ. Future research can segment customers based on factors such as product price, demographic, or regional to explore the needs of various market segments. This would enable more targeted resource allocation and customize the provision of differentiated system products and services tailored to specific market customer groups, thereby enhancing the company’s core competitiveness.
Author Contributions
Conceptualization, Z.S.; Data curation, Z.S. and C.Z.; Funding acquisition, Y.L.; Investigation, C.Z.; Project administration, Y.L.; Software, Z.S. and C.Z.; Supervision, Y.L.; Validation, Z.S.; Writing—original draft, Z.S.; Writing—review and editing, C.Z. All authors have read and agreed to the published version of the manuscript.
Funding
This research was funded by the Major Entrusted Project of Liaoning Provincial Social Science Planning Fund (No. L23ZD045), and the Liaoning Provincial Federation of Social Sciences Research Project on Economic and Social Development (No. 2024lslybkt-026).
Institutional Review Board Statement
Not applicable.
Informed Consent Statement
Not applicable.
Data Availability Statement
The data that support the findings of this study are available from the corresponding author, Zhao C., upon reasonable request.
Conflicts of Interest
The authors declare that they have no known competing financial interests or personal relationships that could have appeared to influence the work reported in this paper.
References
- Zhao, M.; Wang, X. Perception value of product-service systems: Neural effects of service experience and customer knowledge. J. Retail. Consum. Serv. 2021, 62, 102617. [Google Scholar] [CrossRef]
- Lan, S.L.; Jiang, Y.F.; Guo, T.; Li, S.C.; Yang, C.; Cheng, T.C.E.; Sethanan, K.; Tseng, M.L. Personalized product design and user review and experience analysis: A data-driven hybrid novel approach. Comput. Ind. Eng. 2025, 202, 110939. [Google Scholar] [CrossRef]
- Mejia, J.; Mankad, S.; Gopal, A. Service quality using text mining: Measurement and consequences. MSOM-Manuf. Serv. Oper. Manag. 2021, 23, 1354–1372. [Google Scholar] [CrossRef]
- Wang, Z.; Liu, C.; Li, Z. Mining Customer Experiences of Hybrid Customized Cultural Fashion: The Case of High-End Qipaos for Weddings. J. Theor. Appl. Electron. Commer. Res. 2024, 19, 3584–3605. [Google Scholar] [CrossRef]
- Chen, R.; Wang, Q.; Xu, W. Mining user requirements to facilitate mobile app quality upgrades with big data. Electron. Commer. Res. Appl. 2019, 38, 100889. [Google Scholar] [CrossRef]
- Timoshenko, A.; Hauser, J.R. Identifying Customer Needs from User-Generated Content. Mark. Sci. 2019, 38, 1–20. [Google Scholar] [CrossRef]
- Qi, J.; Zhang, Z.; Jeon, S.; Zhou, Y. Mining customer requirements from online reviews: A product improvement perspective. Inf. Manag. 2016, 53, 951–963. [Google Scholar] [CrossRef]
- Decker, R.; Trusov, M. Estimating aggregate consumer preferences from online product reviews. Int. J. Res. Mark. 2010, 27, 293–307. [Google Scholar] [CrossRef]
- Liu, X.X.; Chen, Z.Y. Service quality evaluation and service improvement using online reviews: A framework combining deep learning with a hierarchical service quality model. Electron. Commer. Res. Appl. 2022, 54, 101174. [Google Scholar] [CrossRef]
- Xu, X. Examining the role of emotion in online consumer reviews of various attributes in the surprise box shopping model. Decis. Support Syst. 2020, 136, 113344. [Google Scholar] [CrossRef]
- Guo, Y.; Barnes, S.J.; Jia, Q. Mining meaning from online ratings and reviews: Tourist satisfaction analysis using latent dirichlet allocation. Tour. Manag. 2017, 59, 467–483. [Google Scholar] [CrossRef]
- Xu, X.; Wang, X.; Li, Y.; Haghighi, M. Business intelligence in online customer textual reviews: Understanding consumer perceptions and influential factors. Int. J. Inf. Manag. 2017, 37, 673–683. [Google Scholar] [CrossRef]
- Gao, S.; Tang, O.; Wang, H.; Yin, P. Identifying competitors through comparative relation mining of online reviews in the restaurant industry. Int. J. Hosp. Manag. 2018, 71, 19–32. [Google Scholar] [CrossRef]
- Shi, Y.; Peng, Q. Enhanced customer requirement classification for product design using big data and improved Kano model. Adv. Eng. Inform. 2021, 49, 101340. [Google Scholar] [CrossRef]
- Jiang, Z.G.; Sun, B.L.; Zhu, S.; Yan, W.; Wang, Y.A.; Zhang, H. A knowledge graph—Based requirement identification model for products remanufacturing design. J. Eng. Des. 2024, 36, 1401–1424. [Google Scholar] [CrossRef]
- Bai, S.Z.; Shi, S.L.; Han, C.J.; Yang, M.; Gupta, B.B.; Arya, V. Prioritizing user requirements for digital products using explainable artificial intelligence: A data-driven analysis on video conferencing apps. Future Gener. Comput. Syst. Int. J. Escience 2024, 158, 167–182. [Google Scholar] [CrossRef]
- Zhang, K.; Lin, K.-Y.; Wang, J.; Ma, Y.; Li, H.; Zhang, L.; Liu, K.; Feng, L. UNISON framework for user requirement elicitation and classification of smart product-service system. Adv. Eng. Inform. 2023, 57, 101996. [Google Scholar] [CrossRef]
- Wang, B.; Zhao, Q.; Zhang, Z.; Xu, P.; Tian, X.; Jin, P. Understanding the Heterogeneity and Dynamics of Factors Influencing Tourist Sentiment with Online Reviews. J. Theor. Appl. Electron. Commer. Res. 2025, 20, 22. [Google Scholar] [CrossRef]
- Maidar, U.; Ra, M.; Yoo, D. A Cross-Product Analysis of Earphone Reviews Using Contextual Topic Modeling and Association Rule Mining. J. Theor. Appl. Electron. Commer. Res. 2024, 19, 3498–3519. [Google Scholar] [CrossRef]
- Yan, L.; Tao, B.; Han, Z.; Ouyang, L. Online reviews analysis in product defects and customer requirements via two-stage model. Total Qual. Manag. Bus. Excell. 2025, 36, 788–810. [Google Scholar] [CrossRef]
- Song, Y.M.; Li, G.X.; Zhu, H.L. Multisource data driven product ranking model with heterogeneous customers. IEEE Trans. Eng. Manag. 2024, 71, 9440–9459. [Google Scholar] [CrossRef]
- Liu, Z.; Qin, C.X.; Zhang, Y.J. Mining product competitiveness by fusing multisource online information. Decis. Support Syst. 2021, 143, 113477. [Google Scholar] [CrossRef]
- Fernando, A.G.; Aw, E.C.-X. What do consumers want? A methodological framework to identify determinant product attributes from consumers’ online questions. J. Retail. Consum. Serv. 2023, 73, 103335. [Google Scholar] [CrossRef]
- Guo, Q.; Xue, C.; Yu, M.; Shen, Z. A New User Implicit Requirements Process Method Oriented to Product Design. J. Comput. Inf. Sci. Eng. 2019, 19, 011010. [Google Scholar] [CrossRef]
- Hu, F.; Li, H.X.; Liu, Y.; Teichert, T. Optimizing service offerings using asymmetric impact-sentiment- performance analysis. Int. J. Hosp. Manag. 2020, 89, 102557. [Google Scholar] [CrossRef]
- Pan, M.; Li, N.; Huang, X. Asymmetrical impact of service attribute performance on consumer satisfaction: An asymmetric impact-attention-performance analysis. Inf. Technol. Tour. 2022, 24, 221–243. [Google Scholar] [CrossRef]
- Zhao, M.; Liu, M.J.; Xu, C.; Zhang, C.X. Classifying travellers’ requirements from online reviews: An improved Kano model. Int. J. Contemp. Hosp. Manag. 2023, 36, 91–112. [Google Scholar] [CrossRef]
- Sha, K.; Li, Y.; Dong, Y.N.; Zhang, N. Modelling the dynamics of customer requirements considering their lability and sensitivity in product development. Adv. Eng. Inform. 2024, 59, 102296. [Google Scholar] [CrossRef]
- Shen, Z.; Li, Y.; Wang, S.; Zhao, C. Exploring dynamic customer requirement trend of buffet restaurant: A two-stage analysis from online reviews. Br. Food J. 2025, 127, 413–430. [Google Scholar] [CrossRef]
- Tontini, G.; Picolo, J.D.; Silveira, A. Which incremental innovations should we offer? Comparing importance–performance analysis with improvement-gaps analysis. Total Qual. Manag. Bus. Excell. 2014, 25, 705–719. [Google Scholar] [CrossRef]
- Bi, J.-W.; Liu, Y.; Fan, Z.-P.; Zhang, J. Exploring asymmetric effects of attribute performance on customer satisfaction in the hotel industry. Tour. Manag. 2020, 77, 104006. [Google Scholar] [CrossRef]
- Pai, F.-Y.; Yeh, T.-M.; Tang, C.-Y. Classifying restaurant service quality attributes by using Kano model and IPA approach. Total Qual. Manag. Bus. Excell. 2018, 29, 301–328. [Google Scholar] [CrossRef]
- Lee, S.; Park, S.; Kwak, M. Revealing the dual importance and Kano type of attributes through customer review analytics. Adv. Eng. Inform. 2022, 51, 101533. [Google Scholar] [CrossRef]
- Kim, S.-A.; Park, S.; Kwak, M.; Kang, C. Examining product quality and competitiveness via online reviews: An integrated approach of importance performance competitor analysis and Kano model. J. Retail. Consum. Serv. 2025, 82, 104135. [Google Scholar] [CrossRef]
- Hua, J.; Chen, W.Y. Prioritizing urban rivers’ ecosystem services: An importance-performance analysis. Cities 2019, 94, 11–23. [Google Scholar] [CrossRef]
- Sun, H.; Guo, W.; Wang, L.; Rong, B. An analysis method of dynamic requirement change in product design. Comput. Ind. Eng. 2022, 171, 108477. [Google Scholar] [CrossRef]
- Tversky, A.; Kahneman, D. Advances in prospect theory: Cumulative representation of uncertainty. J. Risk Uncertain. 1992, 5, 297–323. [Google Scholar] [CrossRef]
- Martilla, J.A.; James, J.C. Importance-Performance Analysis. J. Mark. 1977, 41, 77–79. [Google Scholar] [CrossRef]
- Gang, Z.; Chenglin, L. Dynamic measurement and evaluation of hotel customer satisfaction through sentiment analysis on online reviews. J. Organ. End User Comput. 2021, 33, 8. [Google Scholar] [CrossRef]
- Bi, J.W.; Zhu, X.E.; Han, T.Y. Text Analysis in Tourism and Hospitality: A Comprehensive Review. J. Travel Res. 2024, 63, 1847–1869. [Google Scholar] [CrossRef]
- Bi, J.-W.; Liu, Y.; Fan, Z.-P.; Zhang, J. Wisdom of crowds: Conducting importance-performance analysis (IPA) through online reviews. Tour. Manag. 2019, 70, 460–478. [Google Scholar] [CrossRef]
- Aghajanzadeh, M.; Aghabayk, K.; Esmailpour, J.; De Gruyter, C. Importance—Performance analysis (IPA) of metro service attributes during the COVID-19 pandemic. Case Stud. Transp. Policy 2022, 10, 1661–1672. [Google Scholar] [CrossRef] [PubMed]
- Tseng, C.C. An IPA-Kano model for classifying and diagnosing airport service attributes. Res. Transp. Bus. Manag. 2020, 37, 100499. [Google Scholar] [CrossRef]
- Hu, K.-C.; Chia, K.-C.; Lu, M.; Liang, Y.-L. Using importance–performance analysis, goal difficulty and the Kano model to prioritize improvements in the quality of home delivery logistics services. Int. J. Logist. Manag. 2022, 33, 477–498. [Google Scholar] [CrossRef]
- Li, Y.L.; Shen, Z.F.; Zhao, C.M.; Chin, K.S.; Lang, X.W. Understanding customer opinion change on fresh food e-commerce products and services-comparative analysis before and during COVID-19 pandemic. Sustainability 2024, 16, 2699. [Google Scholar] [CrossRef]
- Albayrak, T.; Cengizci, A.D.; Caber, M.; Fong, L.H.N. Big data use in determining competitive position: The case of theme parks in Hong Kong. J. Destin. Mark. Manag. 2021, 22, 100668. [Google Scholar] [CrossRef]
- Pan, X.-H.; He, S.-F.; García-Zamora, D.; Wang, Y.-M.; Martínez, L. A novel online reviews-based decision-making framework to manage rating and textual reviews. Expert Syst. Appl. 2025, 259, 125367. [Google Scholar] [CrossRef]
- Pu, Z.M.; Xu, Z.S.; Zhang, C.X.; Zeng, X.J.; Gan, W.D. An online review-driven two-stage hotel recommendation model considering customers’ risk attitudes and personalized preferences. Omega-Int. J. Manag. Sci. 2025, 131, 103197. [Google Scholar] [CrossRef]
- Liu, Y.; Shi, J.L.; Huang, F.; Hou, J.R.; Zhang, C.Z. Unveiling consumer preferences in automotive reviews through aspect-based opinion generation. J. Retail. Consum. Serv. 2024, 77, 103605. [Google Scholar] [CrossRef]
- Cai, M.; Yang, C. Customer preference analysis integrating online reviews: An evidence theory-based method considering criteria interaction. Eng. Appl. Artif. Intell. 2024, 133, 108092. [Google Scholar] [CrossRef]
- Madzík, P.; Shahin, A.; Zimon, D.; Yadav, N. Requirements classification in Kano Model—From strict categories to satisfaction and dissatisfaction potential. Total Qual. Manag. Bus. Excell. 2024, 35, 1418–1438. [Google Scholar] [CrossRef]
- Chen, C.; Zhang, C.X.; Xu, Z.S. Online reviews-driven kano-qfd method for service design. IEEE Trans. Eng. Manag. 2024, 71, 8153–8165. [Google Scholar] [CrossRef]
- Hinterhuber, A. Can competitive advantage be predicted? Towards a predictive definition of competitive advantage in the resource-based view of the firm. Manag. Decis. 2013, 51, 795–812. [Google Scholar] [CrossRef]
- Li, Y.; Yu, H.; Shen, Z. Dynamic prediction of product competitive position: A multisource data-driven competitive analysis framework from a multi-competitor perspective. J. Retail. Consum. Serv. 2025, 85, 104289. [Google Scholar] [CrossRef]
- Zhang, C.; Xu, Z.; Gou, X.; Chen, S. An online reviews-driven method for the prioritization of improvements in hotel services. Tour. Manag. 2021, 87, 104382. [Google Scholar] [CrossRef]
- Bacon, D.R. Understanding Priorities for Service Attribute Improvement. J. Serv. Res. 2012, 15, 199–214. [Google Scholar] [CrossRef]
- Pan, M.Q.; Li, N.; Law, R.; Huang, X.K.; Wong, I.A.; Zhang, B.R.; Li, L.Y. Service attribute prioritization based on the marginal utility of attribute performance. Int. J. Hosp. Manag. 2023, 114, 103560. [Google Scholar] [CrossRef]
- Wu, T.; Liu, X.W.; Qin, J.D.; Herrera, F. An interval type-2 fuzzy Kano-prospect-TOPSIS based QFD model: Application to Chinese e-commerce service design. Appl. Soft Comput. 2021, 111, 107665. [Google Scholar] [CrossRef]
- Zhao, M.; Shen, X.Y.; Liao, H.C.; Cai, M.Y. Selecting products through text reviews: An MCDM method incorporating personalized heuristic judgments in the prospect theory. Fuzzy Optim. Decis. Mak. 2022, 21, 21–44. [Google Scholar] [CrossRef]
- Wang, H.; Xin, Y.J.; Deveci, M.; Pedrycz, W.; Wang, Z.Q.; Chen, Z.S. Leveraging online reviews and expert opinions for electric vehicle type prioritization. Comput. Ind. Eng. 2024, 197, 110579. [Google Scholar] [CrossRef]
- Yang, Q.; Chen, Z.S.; Chan, C.Y.P.; Pedrycz, W.; Martinez, L.; Skibniewski, M.J. Large-scale group decision-making for prioritizing engineering characteristics in quality function deployment under comparative linguistic environment. Appl. Soft Comput. 2022, 127, 109359. [Google Scholar] [CrossRef]
- Liu, D.; Xu, J.; Du, Y.F. An integrated HPF-TODIM-MULTIMOORA approach for car selection through online reviews. Ann. Oper. Res. 2025, 348, 631–670. [Google Scholar] [CrossRef]
- Xiang, H.; Li, W.Q.; Hong, Y.D.; Li, C.X. A novel requirement elicitation and evaluation framework for product-service systems based on contextual matching and hybrid decision-making. Comput. Ind. Eng. 2024, 194, 110391. [Google Scholar] [CrossRef]
- Du, Y.; Liu, D.; Duan, H. A textual data-driven method to identify and prioritise user preferences based on regret/rejoicing perception for smart and connected products. Int. J. Prod. Res. 2022, 60, 4176–4196. [Google Scholar] [CrossRef]
- Wang, Z.; Fung, R.Y.K.; Li, Y.-L.; Pu, Y. An integrated decision-making approach for designing and selecting product concepts based on QFD and cumulative prospect theory. Int. J. Prod. Res. 2018, 56, 2003–2018. [Google Scholar] [CrossRef]
- Lee, D.D.; Seung, H.S. Learning the parts of objects by non-negative matrix factorization. Nature 1999, 401, 788–791. [Google Scholar] [CrossRef]
- Wang, Y.-X.; Zhang, Y.-J. Nonnegative matrix factorization: A comprehensive review. IEEE Trans. Knowl. Data Eng. 2013, 25, 1336–1353. [Google Scholar] [CrossRef]
- Zhou, J.; Wang, T. FER based on the improved convex nonnegative matrix factorization feature. Multimed. Tools Appl. 2020, 79, 26305–26325. [Google Scholar] [CrossRef]
- Bellstam, G.; Bhagat, S.; Cookson, J.A. A text-based analysis of corporate innovation. Manag. Sci. 2021, 67, 4004–4031. [Google Scholar] [CrossRef]
- Jiang, X.C.; Song, C.; Xu, Y.C.; Li, Y.; Peng, Y.L. Research on sentiment classification for netizens based on the BERT-BiLSTM-TextCNN model. PeerJ Comput. Sci. 2022, 8, e1005. [Google Scholar] [CrossRef]
- Zhang, Y.R.; Guo, W.; Chang, Z.X.; Ma, J.; Fu, Z.L.; Wang, L.; Shao, H.Y. User requirement modeling and evolutionary analysis based on review data: Supporting the design upgrade of product attributes. Adv. Eng. Inform. 2024, 62, 102861. [Google Scholar] [CrossRef]
- Wei, W.; Hao, C.L.; Wang, Z.X. User needs insights from UGC based on large language model. Adv. Eng. Inform. 2025, 65, 103268. [Google Scholar] [CrossRef]
- Joung, J.; Kim, H.M. Explainable neural network-based approach to Kano categorisation of product features from online reviews. Int. J. Prod. Res. 2022, 60, 7053–7073. [Google Scholar] [CrossRef]
- Wu, J.; Ma, X.; Chiclana, F.; Liu, Y.; Wu, Y. A consensus group decision making method for hotel selection with online reviews by sentiment analysis. Appl. Intell. 2022, 52, 10716–10740. [Google Scholar] [CrossRef]
- Lai, I.K.W.; Hitchcock, M. Sources of satisfaction with luxury hotels for new, repeat, and frequent travelers: A PLS impact-asymmetry analysis. Tour. Manag. 2017, 60, 107–129. [Google Scholar] [CrossRef]
- Nilsson-Witell, L.; Fundin, A. Dynamics of service attributes: A test of Kano’s theory of attractive quality. Int. J. Serv. Ind. Manag. 2005, 16, 152–168. [Google Scholar] [CrossRef]


Disclaimer/Publisher’s Note: The statements, opinions and data contained in all publications are solely those of the individual author(s) and contributor(s) and not of MDPI and/or the editor(s). MDPI and/or the editor(s) disclaim responsibility for any injury to people or property resulting from any ideas, methods, instructions or products referred to in the content. |
© 2026 by the authors. Licensee MDPI, Basel, Switzerland. This article is an open access article distributed under the terms and conditions of the Creative Commons Attribution (CC BY) license.