Abstract
Online review images shape consumer perceptions by offering visual cues of product quality and use. Existing studies focus on aesthetics or object presence but overlook the functional balance among image types. This study introduces the Holistic Image Proportion (HIP)—the ratio of holistic to detailed review images—as a key determinant of visual information completeness. Using deep learning (ResNet-101) to classify over 240,000 images from 4450 clothing products, we find an inverted U-shaped relationship between HIP and sales: a balanced mix (HIP ≈ 0.5) maximizes performance. A follow-up experiment confirms that balanced image composition enhances perceived completeness, which fully mediates its effect on purchase intention. Review sentiment further moderates this relationship, amplifying the effect under positive sentiment. This research extends information completeness theory to visual data, highlighting that completeness emerges from functional image composition rather than quantity or aesthetics, offering new insights for multimodal persuasion and e-commerce design.
1. Introduction
The proliferation of user-generated content (UGC) on e-commerce platforms has dramatically reshaped the way consumers evaluate products and make purchasing decisions [1,2]. Within this landscape, online review images have emerged as a central modality through which consumers gather visual cues regarding product appearance, quality, and utility. Unlike textual reviews, images offer a direct, multidimensional representation of products, allowing for intuitive and immediate assessments [3,4,5,6]. Especially in visually driven categories such as fashion, furniture, and cosmetics, review images often serve as the most credible and influential form of consumer-to-consumer communication. While prior research has demonstrated that review images enhance consumer engagement, foster trust, and improve review helpfulness [3,7,8], key questions remain regarding how the structure and composition of these images influence consumer cognition and behavior.
The global e-commerce market has expanded rapidly in recent years and is projected to exceed USD 6 trillion in annual retail sales [9]. Against this backdrop, visual user-generated content (UGC) has become increasingly influential in shaping online purchase decisions. According to a global consumer survey by Bazaarvoice, 54% of shoppers report that photo-reviews—i.e., user-submitted images accompanying textual reviews—influence their purchase decisions, and 75% prefer seeing products displayed in authentic, real-life contexts rather than in professionally staged images [10]. These findings indicate that review images have become a central informational component in digital commerce, particularly in visually driven categories such as fashion and apparel. As online platforms continue to experience rapid growth in image-based UGC, understanding not only the presence of review images but also their functional composition becomes critical for explaining how consumers process visual information and form judgments.
Existing literature has made significant strides in analyzing visual content using deep learning methods, with two dominant approaches: object detection and classification [11]. Object detection focuses on identifying specific elements within images, thereby enabling platforms to assess the presence or alignment of visual components with textual content [3,8]. As for classification method, many apply rating-based classification techniques by implementing models such as CNNs, VAEs, or GANs to evaluate aesthetic quality, facial presence, or emotional valence, yielding numerical assessments that capture certain visual dimensions [5,12,13]. While these approaches have enriched our understanding of how visual features affect consumer judgments, they tend to treat images as static entities, focusing on individual-level attributes such as attractiveness, clarity, or object presence.
However, such methods overlook the functional role that images play within the broader context of online reviews. In related literature, informational richness has often been conceptualized using diversity- or entropy-based notions, which implicitly equate greater dispersion across categories with more complete information. However, such dispersion-oriented constructs primarily capture distributional variety, rather than whether different elements serve complementary informational functions. Building on this distinction, this study conceptualizes information completeness not in terms of dispersion per se, but in terms of the balance between elements that support global, integrative understanding and those that enable focused, attribute-level inspection. In particular, there has been limited attention to how different types of images—those that present the overall product versus those that highlight specific features—work in tandem to shape consumer perceptions. This paper addresses this gap by introducing a functional categorization framework for review images. Rather than evaluating isolated visual attributes, we classify images based on their communicative intent: holistic images, which provide an overview of the product, and detailed images, which showcase specific aspects such as fabric, stitching, or component features. By focusing on the Holistic Image Proportion (HIP)—the ratio of holistic to total relevant review images—this study offers a new lens through which to assess the completeness and efficacy of visual content in shaping purchase decisions.
This methodological shift—from rating to categorization based on visual function—marks a substantial departure from previous studies. While prior work emphasizes how aesthetic quality enhances social media engagement or booking rates [5,7,14], these analyses do not differentiate between the informational roles played by different types of images. For example, a professionally shot image may score highly on visual quality but still fail to provide sufficient functional cues for consumers assessing specific product features. Similarly, studies leveraging object detection, such as Yang, et al. [15], primarily focus on the presence or alignment of visual elements, without accounting for the broader composition of image types within a review set. As a result, we lack a comprehensive understanding of how the balance between holistic and detailed images contributes to perceived information sufficiency and influences consumer decision-making.
To bridge this gap, this study draws on the concept of information completeness, a critical dimension of information quality [16,17,18]. Information completeness refers to the extent to which a set of information fully and adequately covers all necessary aspects of a decision-relevant object. In the context of online shopping, completeness has been shown to reduce information asymmetry, increase trust, and facilitate accurate consumer judgments [19,20]. However, previous applications of this concept have primarily focused on textual or structured information, such as product descriptions, attribute listings, or chatbot dialogues. By extending the completeness framework to visual content, this study emphasizes that images—like text—can vary in how thoroughly they convey decision-relevant information, and that this variation is a function of image composition, not merely quality. Specifically, we argue that the balance between holistic and detailed images, as captured by HIP, directly affects perceived completeness. Holistic images allow consumers to form an overall impression of the product, offering context, scale, and real-world usage cues. In contrast, detailed images support focused assessments of materials, workmanship, or other fine-grained attributes. When these two types are appropriately balanced, consumers are more likely to perceive the review as complete, which in turn enhances their confidence and increases purchase intention. Conversely, when reviews contain only one image type—whether only holistic or only detailed—consumers may feel that the information is either superficial or fragmented, leading to reduced engagement and decision uncertainty.
This research employs a multi-method empirical strategy to investigate these relationships. First, using a deep learning framework trained on a manually labeled dataset, we classify over 240,000 review images into three categories: holistic, detailed, and non-relevant. To clarify how review images were categorized in this study, Figure 1 presents typical examples of holistic, detailed, and non-relevant images used to construct the HIP measure.

Figure 1.
Examples of image categories.
We then compute the HIP metric for 4450 women’s clothing products on a leading e-commerce platform in China and test its relationship with sales using regression models. The results reveal a robust inverted U-shaped relationship, with sales peaking when HIP is approximately 0.5, indicating a balanced composition of image types. Second, we conduct a controlled online experiment to establish the causal mechanism underlying this effect. Participants exposed to balanced HIP images report significantly higher levels of perceived information completeness and stronger purchase intention, with mediation analysis confirming that completeness fully explains the HIP–intention link.
Beyond examining the nonlinear effect of HIP, this study also incorporates review sentiment (RS) as a boundary condition. Extant literature shows that consumers’ evaluations are shaped jointly by visual and textual cues [14,21]. While HIP captures the functional balance of visual information, the overall valence of textual sentiment may amplify or attenuate this effect. Specifically, positive sentiment can strengthen the persuasive power of balanced images, whereas negative sentiment may offset or even reverse the expected benefits. By theorizing sentiment as a moderator, this study provides a more comprehensive account of how multimodal review content influences consumer decision-making.
Although the concept of information completeness (IC) has been extensively explored in structured or textual data contexts, its application to unstructured visual content—especially through a compositional lens—remains underdeveloped. Prior studies have focused predominantly on image quality, clarity, or aesthetic ratings as static attributes. In contrast, this study conceptualizes IC as a perceptual outcome arising from the balance between holistic and detailed images, rather than simply the number or clarity of images provided. This reframing positions completeness not merely as an information property but as an emergent cognitive experience shaped by image composition.
Furthermore, by integrating review sentiment as a moderator, we extend completeness theory into the realm of multimodal interaction, theorizing that affective valence systematically alters how visual completeness is perceived and processed. This approach offers a new pathway for understanding how visual and textual modalities interact to influence perceived IC and purchase behavior, providing a more nuanced account of online consumer cognition.
In summary, this study contributes to the literature by (1) introducing a novel functional categorization of review images, (2) reconceptualizing information completeness as a perceptual and compositional construct in the context of unstructured visual data, thereby extending its application beyond textual content, and (3) empirically validating a nonlinear relationship between image composition and consumer behavior. By identifying sentiment as a moderator of visual completeness effects, this study also contributes to a deeper understanding of multimodal information processing in digital commerce contexts. It shifts the focus of visual content analysis from how good an image looks to what role it plays in helping consumers make decisions. This reorientation has important implications for platform design, review curation, and consumer engagement strategies in digital commerce environments.
2. Literature Review
2.1. Image Analysis via Deep Learning in Online Platforms
The rapid expansion of online platforms has positioned unstructured data as a central medium for influencing consumer behavior. Apart from text [21,22,23,24,25,26,27,28], images serve as a richer and more multidimensional source of information [29,30,31,32,33]. Scholars have increasingly turned to deep learning techniques to analyze and optimize visual content. Among the most commonly employed methods are image classification and object detection, each offering distinct insights into the role of images in shaping consumer perceptions. Wang, Bendle and Pan [11] identified these two approaches as dominant in studies on image analysis, setting the stage for understanding how platforms use visual data to drive engagement and decision-making.
Object detection has proven instrumental in identifying specific elements or regions within images, providing a granular understanding of their relevance and composition. For instance, Ceylan, Diehl and Proserpio [8] utilized object detection to explore the alignment between review images and accompanying text. Their findings revealed that semantic consistency between images and text significantly enhances the perceived helpfulness of reviews. Guan, Tan, Wei and Chen [3] further expanded on this by using face detection algorithms to assess user-generated image composition. Their research demonstrated that while well-composed images positively affect consumer perceptions, inconsistencies can undermine product ratings. Similarly, Yang, Wang and Zhao [15] applied YOLO-V3 to evaluate the accuracy and relevance of review images, showing that these factors are critical in boosting review helpfulness across diverse product categories. Collectively, these studies underscore the capacity of object detection to illuminate the nuanced interplay between image attributes and consumer decision-making.
The other method, image classification, is often employed to assign specific attributes or ratings to images, with a focus on quantifying visual features such as aesthetic quality or sentiment. Classification models, including variational autoencoders (VAEs) and generative adversarial networks (GANs), were utilized by Burnap, Hauser and Timoshenko [12] to predict consumer preferences for product designs. Through their analysis, it was demonstrated that aesthetic evaluations could inform strategies for innovative product design. A different perspective was provided by Zhang, Lee, Singh and Srinivasan [5], as they applied convolutional neural networks (CNNs) to assess the visual appeal of Airbnb listings. Their research emphasized how booking rates are significantly influenced by the professional quality of photography. Similarly, Li and Xie [7] examined the effects of high-quality, colorful images on social media engagement, showing that user interactions are markedly enhanced by visually appealing content. Collectively, these studies highlight the effectiveness of classification in quantifying visual attributes and generating actionable insights for platform optimization.
A more comprehensive analysis of visual data has been facilitated by studies that integrate object detection with image classification. Guan, Tan, Wei and Chen [3] and Zhang, Lee, Singh and Srinivasan [5] applied a combination of these techniques to examine the interplay between image composition and quality. In Guan’s research, the dual effects of user-generated image composition on consumer perceptions were explored, while Zhang focused on the balance between aesthetic quality and functional composition within Airbnb listings. Hu, He and Liu [13] utilized Google Vision API and Baidu API to score facial attractiveness, linking these ratings to consumer behaviors such as review length and sentiment expression. An integrated approach was also adopted by Shin, et al. [34] to evaluate visual complexity, with their findings demonstrating its effectiveness in predicting the popularity of social media posts. These studies underscore how the integration of object detection and classification methodologies allows for richer and more nuanced insights to be obtained.
Despite the substantial progress in image analysis, a significant gap persists in the current body of research. Most studies focus predominantly on static visual attributes, such as aesthetic ratings or the accuracy of object detection, without addressing the functional roles that images play in these contexts. Limited attention has been given to how the interplay and proportional balance between holistic and detail-oriented images influence consumer perceptions and decision-making. This underexplored area presents an opportunity to advance our understanding of the dynamic impact of visual content on user behavior.
This study seeks to bridge this gap by focusing on categorization rather than merely evaluating static attributes through rating the images. Specifically, online review images are classified into two distinct functional categories: holistic images, which provide an overall view, and detail-oriented images, which highlight specific product features. The research analyzes the proportional balance between these categories to understand how they collectively shape consumer perceptions and purchase intentions. By emphasizing the functional categorization of images, this study extends the application of deep learning methodologies beyond traditional approaches. It moves from static evaluations of isolated attributes to a more nuanced understanding of how the composition and roles of different image types influence consumer behavior. Through this lens, the study offers actionable insights for optimizing visual content strategies on digital platforms, contributing to enhanced consumer engagement and improved decision-making in visually driven online environments.
2.2. Information Completeness
Information completeness, as one of the core dimensions of information quality (IQ), refers to the extent to which information comprehensively covers all essential aspects of its target object [16,17,18]. Lee, Strong, Kahn and Wang [16] identified information completeness as part of contextual information quality, emphasizing its role alongside accuracy, timeliness, and relevance in forming a holistic understanding of information’s effectiveness. Within their methodology, completeness is described as a critical element that ensures users receive sufficient and well-rounded data to make informed decisions. This conceptualization has been widely adopted in subsequent studies to evaluate the quality of information systems and their impact on user behavior.
In the context of e-commerce platforms, information completeness plays a critical role in reducing information asymmetry and supporting consumer decision-making. Heinrich, Hopf, Lohninger, Schiller and Szubartowicz [19] emphasized the significance of completeness in recommender systems, where the thorough representation of item attributes directly enhances predictive accuracy. They demonstrated that providing detailed and complete product information, such as comprehensive descriptions or visual elements, would strengthen consumer trust and foster purchase decisions. Similarly, Ruan and Mezei [20] investigated the role of AI chatbots and human frontline employees (HFLEs) in online shopping assistance. Their study found that AI chatbots excel in delivering complete and consistent information, particularly regarding functional product attributes. This reduces information gaps and enhances customer satisfaction in task-oriented interactions, highlighting the practical importance of completeness in digital consumer experiences.
Beyond e-commerce, information completeness extends its impact to organizational decision-making and public health monitoring. Hjelle, et al. [35] explored its influence through dashboard visualizations, demonstrating that complete information reduces decision-makers’ perceived task complexity while improving satisfaction with the provided data. Comprehensive dashboards not only enhance decision efficiency but also promote confidence in outcomes, reflecting the value of completeness in structured decision-support environments. Moreover, Kitchens, et al. [36] investigated its role in social listening platforms for public health. Through their HealthSense system, they ensured comprehensive data aggregation from diverse sources, significantly improving the reliability and applicability of health monitoring systems in addressing dynamic crises.
This study advances the understanding of information completeness by applying the concept to the context of online product reviews. It explores the dynamic relationship between holistic and detailed visual content, emphasizing how their proportional balance shapes perceived completeness and impacts consumer cognition and purchase decisions. By investigating the structural and compositional dimensions of online review images, this research addresses existing gaps in the literature and provides fresh perspectives on enhancing user experiences in digital environments. Furthermore, it connects traditional studies on static data completeness with the evolving, interactive characteristics of online content, offering actionable strategies for e-commerce platforms to build consumer trust and support more informed decision-making.
3. Research Hypotheses
The composition of visual content in online reviews plays a pivotal role in shaping consumer behavior, as it provides the necessary cues for evaluating product quality, utility, and fit. Central to this is the balance between holistic images, which offer an overall perspective of the product, and detailed images, which focus on specific attributes. Achieving an optimal balance between these two types of images is critical for providing a comprehensive understanding of the product to potential consumers. Prior research underscores the significance of balance in various contexts, particularly in visual communication and information processing. For instance, Guan, Tan, Wei and Chen [3] emphasize that well-composed images in consumer-generated content enhance perceptions of quality and trust. Similarly, Zhang, Lee, Singh and Srinivasan [5] highlight how the combination of broad and specific perspectives in visual content improves decision-making by reducing ambiguity. In the context of online reviews, the interplay between holistic and detailed images is particularly impactful, as it directly influences consumers’ perceptions of information completeness and their subsequent purchase intentions.
Holistic images provide a global impression of the product by conveying its overall appearance, contextual cues, and typical usage scenarios. Prior research shows that broad scene-level visuals and well-composed images help consumers form intuitive judgments about product attractiveness and fit [3,5,8]. Conversely, detailed images draw attention to specific product attributes—such as fabric texture, stitching, or component features—and support fine-grained evaluations of product quality. Existing studies similarly demonstrate that close-up or attribute-focused visuals enhance consumers’ ability to assess material characteristics and craftsmanship, thereby reducing uncertainty about product quality [5,8,13]. Such detailed visual cues offer diagnostic information beyond what holistic images can provide, enabling more deliberate inspection of product features. While detailed images are invaluable for assessing specific characteristics, an overabundance of them can overwhelm consumers, making it difficult to form a cohesive understanding of the product. The importance of balancing these two types of images lies in their complementary roles—holistic images provide context, while detailed images fill in the specifics. A disproportionate emphasis on either type can disrupt the flow of information and reduce its effectiveness, leading to diminished consumer confidence and lower purchase intentions.
3.1. The Impact of Holistic Image Proportion on Sales
The balance between holistic and detailed images can be captured quantitatively through the metric holistic image proportion (HIP), defined as the proportion of holistic images among all review images. A balanced HIP, where holistic and detailed images are equally represented (HIP ≈ 0.5), is hypothesized to maximize the effectiveness of online review images. When HIP is balanced, consumers are likely to perceive the product more comprehensively, benefiting from both the general context provided by holistic images and the specific insights offered by detailed images. This balance facilitates smoother information processing and fosters a sense of involvement with the review content, as it provides a well-rounded depiction of the product.
Conversely, when HIP deviates significantly from this balance, its effectiveness diminishes. An overrepresentation of holistic images may fail to address specific concerns, such as material or functional details, leading to uncertainty and skepticism. On the other hand, an excessive proportion of detailed images may fragment the narrative, preventing consumers from visualizing the product’s overall utility or fit. Building on these insights, this study proposes that the relationship between HIP and sales follows an inverted U-shaped curve. At moderate levels of HIP, where holistic and detailed images are balanced, sales are expected to peak. Thus, the following hypothesis is proposed:
H1.
The relationship between purchase behavior and holistic image proportion (HIP) in online reviews is inverted U-shaped, where a balanced proportion of holistic and detailed images (HIP ≈ 0.5) results in higher sales compared to proportions dominated by either holistic or detailed images.
3.2. The Mediating Role of Information Completeness
Existing studies highlight the critical role of visual content in shaping consumer behavior, emphasizing attributes such as image composition, quality, and relevance [5,8,15,37]. However, few studies have explicitly explored the concept of information completeness as a mediating factor in the effectiveness of review images. Information completeness, defined as the extent to which visual content provides sufficient and well-rounded information for decision-making, is essential for building consumer confidence and driving purchase intentions. Unlike visual attributes such as clarity or quality, which are static, information completeness reflects the holistic perception of how effectively images serve the informational needs of consumers.
In the context of online review images, a balanced holistic image proportion (HIP) fosters a sense of completeness by presenting both the broader context (via holistic images) and detailed attributes (via detailed images). This balance enables consumers to process information more effectively and form comprehensive judgments about the product. When HIP deviates from this balance, perceived completeness is disrupted. For instance, an overemphasis on holistic images may lead to an absence of critical details, while too many detailed images can overwhelm consumers, making it difficult to grasp the product’s overall utility.
Thus, we propose that information completeness acts as a critical mediator in the relationship between HIP and purchase behavior. Specifically, when HIP is balanced, it enhances information completeness, which in turn positively impacts purchase intentions. Based on this reasoning, we hypothesize:
H2.
A balanced proportion of holistic and detailed images leads to higher perceived information completeness than highly unbalanced proportions.
Information completeness plays a pivotal role in shaping consumers’ purchase intentions. As consumers evaluate products through online reviews, their confidence in making purchasing decisions largely depends on their perception of whether the provided information is sufficient and well-rounded. High levels of perceived completeness reduce uncertainty, enhance trust in the review content, and foster a stronger intention to purchase. Conversely, when information is perceived as incomplete, consumers are more likely to experience doubt and hesitation, leading to lower purchase likelihood.
In this context, we propose that information completeness serves as a mediating mechanism, connecting HIP to purchase behavior. By enhancing consumers’ understanding of the product, completeness facilitates smoother cognitive processing and increases the likelihood of favorable purchase decisions. Thus, we hypothesize:
H3.
Information completeness mediates the relationship between purchase behavior and HIP.
3.3. The Moderating Role of Review Sentiment and Number of Reviews
While HIP captures the balance of visual content, consumer responses are rarely determined by visual cues alone. Online reviews are inherently multimodal, and textual sentiment provides an additional layer of evaluative information. Extant research indicates that sentiment significantly shapes consumers’ perceptions of product quality, trustworthiness, and purchase likelihood [21,22]. In this context, we argue that the effectiveness of balanced HIP is contingent upon the emotional valence conveyed in accompanying review text. When sentiment is positive, the inverted U-shaped relationship between HIP and sales should become stronger, as favorable emotions enhance the persuasiveness of balanced visual information. Conversely, when sentiment is negative, the benefits of HIP balance are likely to diminish, as affective disconfirmation reduces consumers’ reliance on visual cues.
H4.
Review sentiment moderates the relationship between image composition and sales, such that more positive sentiment reinforces the beneficial effects of composition balance.
While review sentiment captures the emotional valence of textual content, the volume of accumulated reviews (NCR) reflects the overall information richness of the review environment. A high NCR may signal product popularity and credibility, thereby reducing consumer reliance on image composition. In contrast, when the number of cumulative reviews is low, consumers may rely more heavily on visual cues—particularly balanced image composition—to assess product quality. From a cue utilization perspective, when NCR is high, consumers may experience information overload and defer to easily accessible cues such as average ratings or review counts, reducing the incremental value of balanced visual composition. Conversely, in a low NCR setting, consumers may process visual content more attentively, enhancing the impact of image composition.
H5.
Review volume (NCR) moderates the inverted U-shaped relationship between HIP and sales. Specifically, under low NCR conditions, the effect of HIP on sales is more pronounced, while under high NCR conditions, the effect is attenuated.
4. Balancing Visuals: Empirical Evidence on the Power of Online Review Images
This section presents the empirical analysis conducted to examine the relationship between the composition of online review images and product sales. Using a large-scale dataset from a major e-commerce platform, the study leverages advanced deep learning techniques to classify review images into holistic and detailed categories and derives the Holistic Image Proportion (HIP) metric. By employing regression models, this analysis investigates the hypothesized inverted U-shaped relationship between HIP and sales while controlling for relevant product, review, and contextual variables. The findings provide robust evidence supporting the theoretical framework, demonstrating the critical role of balancing holistic and detailed images in shaping consumer behavior.
4.1. Data
Taobao was selected as the data source because it is the largest and most influential e-commerce platform in China, with a dominant market share in the fashion and apparel sector. According to public industry reports, Taobao consistently accounts for a substantial proportion of national online apparel transactions, making it a natural setting for studying image-based consumer behavior in the women’s clothing category. Importantly, Taobao is the platform where user-generated review images are most abundant and diverse, providing a rich environment for examining the functional composition of visual review content. While the dataset reflects consumer behavior within this specific platform, its scale, diversity of sellers, and wide user base make it broadly representative of typical online shopping interactions in China’s fashion category. Thus, although platform-level characteristics may vary across different e-commerce ecosystems, Taobao offers a highly suitable and empirically grounded context for investigating the role of review images in shaping consumer decisions.
The dataset for this study includes information on 4450 products from the women’s clothing category on the Taobao e-commerce platform, covering a one-month period in 2020. It incorporates a wide range of data, including one-month sales figures for each product, detailed product information, and user-generated content such as online reviews and associated images(See Table 1 and Table 2). The dataset is particularly rich in visual content, comprising over 240,000 review images, providing a unique opportunity to examine the balance between holistic and detailed images in online reviews and their impact on sales performance. The reliability of this dataset is supported by several factors. First, it reflects real consumer behavior, capturing actual sales data and genuine user-generated content, which ensures the authenticity and practical relevance of the analysis. Second, the dataset is comprehensive, covering key dimensions such as product characteristics, review metadata, and detailed visual content. This multidimensionality allows for an in-depth exploration of the relationships between review image composition and consumer decision-making. Third, the data are consistent and uniform in structure, reducing the likelihood of errors or missing values and ensuring a robust basis for statistical analysis. Finally, the dataset, sourced from one of the largest e-commerce platforms in China, provides a representative sample of online consumer behavior within the women’s clothing category, enhancing the external validity of the findings.

Table 1.
Variables description.
Table 2.
Descriptive statistics.
To ensure data relevance and consistency, we applied several criteria when selecting products for inclusion in this study. First, we restricted the dataset to the women’s clothing category, which is one of the largest apparel segments on Taobao (Feb, 2020) and contains sufficient visual review content for analysis. Second, only products with at least one user-generated review image during the data collection window were retained, as HIP requires visual content to be measurable. Third, duplicate listings and products with incomplete metadata (e.g., missing sales information or product attributes) were removed. After applying these criteria, a total of 4450 unique products were included in the final dataset. The data were collected over a continuous one-month period from February to March in 2020, during which both sales information and review content were fully recorded.
4.2. Categorization of Online Review Images via Deep Learning
To categorize the review images, this study employed ResNet-101, a state-of-the-art deep learning model, using a transfer learning approach. After extensive observation and analysis of the dataset, it was determined that categorizing images based on their functional roles would be most effective. Online review images were thus divided into three categories: holistic images, detailed images, and non-relevant images. Holistic images depict the overall appearance of the product, such as consumers modeling the clothing they purchased. In contrast, detailed images focus on specific product features, such as sleeves, collars, or fabric texture. Non-relevant images are those unrelated to the product, often including memes or decorative elements unrelated to the review context.
Deep learning architectures such as Convolutional Neural Networks (CNNs) process an image through layers of convolution, activation, and pooling:
where × denotes convolution, is the activation function (ReLU), and is the feature map at layer l [38].
ResNet-101 specifically introduces residual blocks to mitigate vanishing gradients, defined as:
where is the block input and is the learned residual mapping [39]. This structure allows training of very deep networks without degradation in accuracy. The final classification layer outputs probabilities for K = 3 classes (holistic, detailed, non-relevant) via the softmax function:
where denotes the logit, i.e., the pre-activation output value from the final fully connected layer of the ResNet-101 model for class k, and K is the total number of output classes [40]. In the context of this study, K = 3, corresponding to holistic images, detailed images, and non-relevant images. For a given input image x, represents the model’s unnormalized confidence score that the image belongs to class k. The softmax function normalizes these scores into probabilities such that , enabling a probabilistic interpretation of the classification output.
The labeling process involved 5000 images being annotated by three experienced research assistants (RAs). These RAs independently assigned each image to one of the three categories, and the labels were cross-validated to ensure consistency and reliability. This manually labeled dataset was then used to fine-tune the ResNet-101 model. The model, pre-trained on the ImageNet dataset, was adjusted by adding a fully connected layer for three-class classification. The labeled data were split into training and validation sets in an 80:20 ratio, with balanced representation across the three categories. The model achieved a validation accuracy exceeding 93.0%, demonstrating its robustness and effectiveness. Using the trained model, the classification was extended to the entire dataset of over 240,000 review images. Each image was assigned to one of the three categories: holistic, detailed, or non-relevant. This automated classification ensured consistency across the dataset while leveraging the accuracy and reliability of the trained ResNet-101 model.
Then, the primary variable, Holistic Image Proportion (HIP), was derived using the following formula:
where and denote the counts of holistic and detailed images for product . This metric captures the relative balance between holistic and detailed images for each product, forming the basis for subsequent regression analysis.
It is important to clarify that HIP is conceptually distinct from existing image-level metrics such as image diversity or entropy. Diversity-based measures quantify the dispersion of image categories and treat them as unordered labels, thereby capturing variability but not the informational roles conveyed by different types of images. In contrast, HIP is a theory-driven compositional indicator that reflects the relative dominance of holistic versus detailed visual perspectives within a review. This distinction matters because holistic and detailed images serve fundamentally different informational purposes—global contextual understanding versus localized attribute inspection—which diversity or entropy cannot capture. Thus, HIP offers a task-specific and theoretically grounded measure rather than a repurposed diversity index.
4.3. Empirical Model
With the HIP variable constructed, a regression analysis was conducted to examine its relationship with product sales. The analysis hypothesized a nonlinear relationship, wherein a balanced HIP maximizes sales. The regression model is specified as follows:
Here, represents the log-transformed sales of product i. and capture the linear and quadratic effects of the holistic image proportion. The model also includes a set of control variables , such as average review length, product price, product lifetime, and so on. The quadratic term allows for testing the hypothesized inverted U-shaped relationship. This specification allows us to test not only the main inverted U-shaped effect of HIP but also the moderating role of review sentiment (RS) and number of cumulated reviews (NCR). The interaction term HIP × RS, HIP × NCR captures shifts in the turning point of the curve, while HIP_sq × RS, HIP_sq × NCR captures changes in the curvature (steeper or flatter) of the inverted U-shaped relationship.
To assess the relationships among variables and check for potential multicollinearity, Table 3 reports the pairwise Pearson correlation coefficients. Most correlation values are relatively low, with the majority below 0.5. As expected, a high correlation is observed between HIP and its squared term HIP_sq (r = 0.952), which reflects their mathematical dependency rather than a modeling issue. Other than this pair, all variables exhibit correlations well below the conventional threshold of 0.7, suggesting that multicollinearity is not a major concern. Notably, the dependent variable Sales_lg is significantly correlated with several key independent variables such as HIP, NRI, and NCR, lending preliminary support to the model specification. Overall, the correlation analysis indicates that the selected variables are suitable for inclusion in the regression models.
Table 3.
Correlation analysis.
4.4. Results for Secondary Data Analysis
Table 4 presents the regression results for the relationship between holistic image proportion (HIP) and product sales. Model 1 includes only the linear HIP term and shows no significant effect. Model 2 incorporates the quadratic term HIP_sq and reveals a significant inverted U-shaped relationship between HIP and sales (β = 1.405, p < 0.01 for HIP; β = −1.458, p < 0.01 for HIP_sq). This supports Hypothesis 1, indicating that sales increase with HIP until a turning point of approximately 0.48, after which excessive holistic images reduce sales performance.
Table 4.
Results for secondary data analysis.
Model 3 introduces review sentiment (RS) as a moderator by including HIP × RS and HIP_sq × RS interaction terms. Both interaction terms are significant (HIP × RS: β = 1.772, p < 0.05; HIP_sq × RS: β = −1.410, p < 0.1), suggesting that sentiment meaningfully alters the HIP–sales relationship. Specifically, higher review sentiment shifts the optimal HIP level toward a higher proportion (≈0.51 when RS = 1) and amplifies the curvature of the inverted U-shaped relationship. As illustrated in Figure 2, under low sentiment (RS = 0), the optimal HIP is approximately 0.15 with modest sales levels, whereas under high sentiment (RS = 1), the optimal HIP moves rightward and reaches a substantially higher sales peak. These findings provide strong support for Hypothesis 4, highlighting review sentiment as a boundary condition that strengthens the effectiveness of balanced visual content in driving sales.
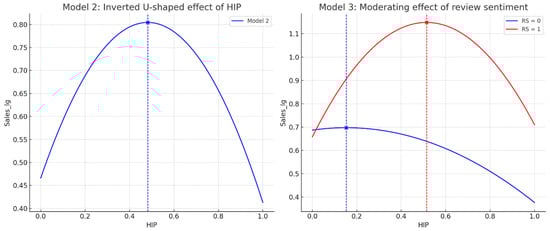
Figure 2.
Results of model 2 and 3.
Model 4 and 5 incorporates the interaction terms HIP × NCR and HIP_sq × NCR to evaluate whether the volume of cumulative reviews moderates the effect of image composition on product sales. While the main effects of HIP and HIP_sq remain significant and consistent with Model 2, the interaction terms with NCR are not statistically significant (HIP × NCR: β = −0.000, p > 0.1; HIP_sq × NCR: β = 0.000, p > 0.1). These results suggest that the total number of accumulated reviews does not significantly alter the strength or shape of the relationship between HIP and sales.
In other words, the persuasive power of a balanced composition of holistic and detailed images appears to be robust across different levels of review volume. This finding does not support H5, which proposed that HIP would be more influential under low-review conditions. Nonetheless, the inclusion of NCR as a boundary condition contributes to a more comprehensive understanding of contextual moderators and may inform future research directions.
The dashed lines represent the inflection points of HIP in different contexts, where the relationship between HIP and sales changes. These points vary depending on the review sentiment (RS), indicating the moderating effect of sentiment on the shape of the curve.
4.5. Robustness Checks
To assess the robustness of our findings, we conducted two additional analyses. First, we re-estimated the baseline models using a Tobit specification, which accounts for the lower-censoring of the dependent variable log(sales + 1) at zero. The results in Table 4 remained consistent with our OLS estimations. In Model (2), HIP and HIP_sq were both significant and in the expected directions, supporting the inverted U-shaped effect of HIP on sales. More importantly, in Model (3), the interaction terms (RS × HIP and RS × HIP_sq) remained significant, confirming that review sentiment (RS) continues to moderate the HIP–sales relationship. These results suggest that our conclusions are not sensitive to the choice of regression model.
Second, we employed an alternative measure of HIP by constructing the log-ratio of holistic to detailed images, defined as:
This transformation mitigates the influence of extreme values when HIP approaches one and captures the relative emphasis on holistic versus detailed visual content. The results in Table 5 and Table 6 again revealed a significant inverted U-shaped effect of HIP (Model 2) and, more importantly, significant interaction terms with RS (Model 3). Specifically, RS positively moderated the HIP effect, shifting the optimal HIP level rightward and steepening the curve, consistent with our main findings.
Table 5.
Robustness check: Tobit model.
Table 6.
Robustness check: HIP_logratio.
Taken together, these robustness checks reinforce the validity of our conclusions. Both alternative model specifications (Tobit) and alternative variable operationalizations (log-ratio of HIP) yield qualitatively consistent results, confirming that the inverted U-shaped effect of HIP and the moderating role of review sentiment are stable and reliable.
5. Study 2: Information Completeness as the Mediator
This section builds on the empirical findings by examining the causal relationship between Holistic Image Proportion (HIP) and purchase intention through an experimental study. By controlling the content and composition of review images in a laboratory setting, the experiment investigates the impact of varying HIP levels on perceived information completeness and purchase intention. Additionally, the study evaluates whether information completeness mediates this relationship, providing further insight into the mechanisms underlying the observed effects.
5.1. Experimental Design
The products used in this experiment were from the same women’s clothing category as in the empirical analysis, ensuring consistency across studies. We recruited 120 participants (all women, 85% aged between 20 and 40) through Credamo, an online experiment platform, and randomly assigned them to one of three between-subject conditions based on varying levels of Holistic Image Proportion (HIP). Each participant was compensated with monetary incentives for their engagement. For experiment stimuli, images of a white T-shirt were used to explore the underlying mechanism, as shown in Figure 3.
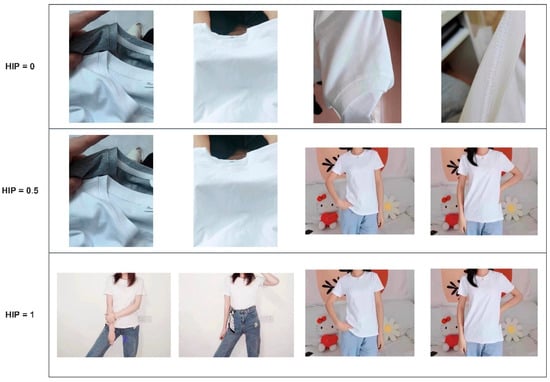
Figure 3.
Experiment stimuli.
At the start of the experiment, participants were instructed to imagine themselves browsing an e-commerce platform. They were shown an online review containing exactly four images, with the content of these images varying based on their assigned condition. In the HIP = 0 condition, participants viewed four detailed images highlighting specific product features such as material texture and stitching. In the HIP = 0.5 condition, participants viewed two holistic images showing the overall appearance of the product when worn and two detailed images. Finally, in the HIP = 1 condition, participants viewed four holistic images.
After viewing the assigned review images, participants were asked to evaluate their purchase intention and perceived information completenesss [16,41]. Measurement items for purchase intention and information completeness, along with their scale sources and response formats, are provided in Supplementary Material Section A. Specifically, purchase intention was measured using four items adapted from [41], and information completeness was measured using six items adapted from [16]. All items were assessed on five-point Likert scales (1 = strongly disagree, 5 = strongly agree), and item scores were averaged to construct composite measures for each construct. Additional measures were included to assess the broader dimensions of information quality [16], such as accuracy, timeliness, and relevance, as well as source credibility [42], which included trustworthiness and expertise.
5.2. Results for Study 2
The experimental results provide strong support for the hypothesized effects of Holistic Image Proportion (HIP) on purchase intention and the mediating role of information completeness.
Purchase intention. Participants in the HIP = 0.5 condition (, SD = 0.76) reported significantly higher purchase intentions (α = 0.94, F(2117) = 4.62, p < 0.05) compared to those in the HIP = 0 (, SD = 1.15, p = 0.027) or HIP = 1 conditions (, SD = 1.15, p = 0.025). This finding confirms the hypothesized inverted U-shaped relationship between HIP and purchase intention, demonstrating that a balanced combination of holistic and detailed images maximizes consumer engagement and decision-making. Specifically, purchase intention was highest when the proportion of holistic and detailed images was approximately equal, supporting the critical role of visual balance in shaping consumer behavior.
Information completeness. Further analysis revealed a significant inverted U-shaped relationship between information completeness and HIP, consistent with the experimental design’s predictions (H2). Participants in the HIP = 0.5 condition (, SD = 0.91) perceived the review images as significantly more complete (F(2117) = 8.38, p < 0.001) than those in the HIP = 0 (, SD = 1.20, p = 0.014) or HIP = 1 conditions (, SD = 1.04, p < 0.001). This relationship underscores the importance of achieving a balance between holistic and detailed images to optimize the informational value of review content. At extreme HIP levels, either dominated by holistic or detailed images, participants perceived the information as less balanced and insufficient, further supporting the theoretical framework of this study.
Mediation analysis. To test the mediating role of information completeness, we conducted a mediation analysis using the PROCESS macro for SPSS 22 [43], employing model 4. The analysis revealed that information completeness fully mediates the relationship between HIP and purchase intention. The indirect effect of HIP on purchase intention through information completeness was statistically significant, with a 95% confidence interval that did not include zero, confirming the mediation effect. When comparing HIP = 0.5 and HIP = 0, information completeness fully mediated the effect of HIP on purchase intention. Participants in the HIP = 0.5 condition perceived the review images as more complete, which directly enhanced their purchase intention (b = 0.280, SE = 0.131, 95% CI = [0.068, 0.582]). Similarly, for HIP = 0.5 and HIP = 1, the mediation analysis revealed a full mediation effect through information completeness. Participants in the balanced condition (HIP = 0.5) reported significantly higher levels of information completeness compared to the holistic-dominated group (HIP = 1), which in turn positively influenced their purchase intention (b = −0.256, SE = 0.142, 95% CI = [−0.605, −0.034]).
Alternative mechanisms. Additional analyses were conducted on other dimensions of information quality (accuracy, timeliness, and relevance) and source credibility (trustworthiness and expertise). These measures were found to be non-significant in mediating the relationship between HIP and purchase intention, further emphasizing the unique role of information completeness.
5.3. Discussion
The findings of this experimental study strongly support the proposed theoretical framework, demonstrating that a balanced Holistic Image Proportion (HIP) maximizes purchase intention by enhancing perceived information completeness. Specifically, the results indicate that participants in the HIP = 0.5 condition reported the highest levels of purchase intention and information completeness, confirming the hypothesized inverted U-shaped relationships (H1 and H2). These results reinforce the critical role of visual balance in shaping consumer perceptions and decision-making in the context of online reviews.
The mediation analysis further highlights the pivotal role of information completeness as the underlying mechanism through which HIP influences purchase intention (H3). By providing a balanced combination of holistic and detailed images, the HIP = 0.5 condition optimally fulfills consumers’ informational needs, thereby increasing their confidence and willingness to purchase. The non-significance of alternative mediators, such as other dimensions of information quality (accuracy, timeliness, and relevance) and source credibility (trustworthiness and expertise), underscores the unique contribution of information completeness in this context.
Beyond the supported hypotheses, the findings from Study 1 also reveal that review volume (NCR) does not significantly moderate the inverted U-shaped relationship between HIP and sales. A plausible explanation is that NCR functions primarily as a broad popularity heuristic rather than interacting directly with visual compositional cues. When review volume is high, consumers tend to rely more on easily accessible aggregate signals such as star ratings and total review counts, reducing their attention to image-level information. Conversely, under low-NCR conditions, image cues should theoretically play a more diagnostic role; however, the moderating effect of review sentiment already captures much of this variance, leaving little explanatory power for NCR. These results suggest that the influence of balanced image composition is relatively robust across different levels of review volume and that visual diagnosticity and social-proof signals may operate through largely independent cognitive routes.
These findings have important implications for e-commerce platforms and marketers. First, the results suggest that optimizing the balance between holistic and detailed images in online reviews leads to meaningful improvements in downstream consumer responses such as purchase intention and behavior. Empirically, a balanced HIP is associated with a significant increase in sales performance (Model 2: standardized β for HIP = 0.221; HIP_sq = −0.232) and higher purchase intention in the experiment (HIP = 0.5 condition yielding significantly higher intention scores than HIP = 0 or HIP = 1; F(2117) = 4.62, p < 0.05). These outcomes collectively indicate that balanced image composition materially enhances how consumers process and respond to review content. Platforms should encourage reviewers to include a mix of both image types, ensuring that reviews provide comprehensive and balanced product information. Second, the study highlights the importance of designing algorithms and content curation strategies that prioritize information completeness, thereby improving the overall quality of the consumer experience.
6. Discussion and Contribution
In the context of increasing reliance on user-generated content in digital commerce, visual elements—particularly review images—have emerged as a critical source of product information. While prior research has extensively examined the aesthetic quality, object presence, and other attributes within review images, limited attention has been paid to the functional composition of these visuals and their combined impact on consumer perception and decision-making. This study addresses this gap by conceptualizing and empirically testing the Holistic Image Proportion (HIP)—the relative balance between holistic and detailed images in online reviews—as a core driver of information completeness and, by extension, purchase behavior.
Our results contribute to several streams of literature on visual information processing and user-generated content. The finding that balanced holistic–detailed image composition yields superior performance aligns with research showing that consumers integrate both global, scene-level cues and attribute-level details when forming product judgments [3,5]. This complementary cue structure is consistent with visual composition theories, which suggest that images combining contextual breadth with diagnostic detail enhance processing effectiveness [8]. Moreover, the positive effect of balanced composition on perceived information completeness extends work on information diagnosticity, which argues that consumers perceive information as more credible and complete when visual cues provide both contextual understanding and concrete attribute-level evidence [5,13]. Finally, the moderating role of review sentiment complements affective processing research by indicating that positive emotional tone amplifies attention to favorable visual cues [8], thereby strengthening the persuasive impact of balanced image composition on sales.
Drawing on a multi-method research design, we integrated deep learning-based image classification, large-scale observational data analysis, and a randomized online experiment to explore the mechanism through which HIP influences consumer decisions. Our deep learning model, based on ResNet-101 and trained on manually labeled data, successfully classified over 240,000 review images into functional categories. From this, the HIP metric was calculated and entered into a regression framework analyzing the relationship between image composition and product sales.
The results of the secondary data analysis reveal a robust inverted U-shaped relationship between HIP and sales performance, confirming that a balanced mix of holistic and detailed images (HIP ≈ 0.5) is optimal for driving consumer engagement. This pattern held across multiple model specifications, including linear and quadratic regressions and robustness checks with count models. In addition, this study identifies review sentiment (RS) as an important boundary condition. Higher sentiment shifts the optimal HIP rightward and strengthens the inverted U-shaped effect, whereas lower sentiment weakens it. This finding underscores the multimodal nature of online reviews, where textual and visual cues jointly shape consumer evaluations.
Subsequently, an experimental study validated these findings by demonstrating that HIP influences purchase intention through its effect on perceived information completeness. Participants exposed to review images with balanced HIP reported significantly higher levels of completeness and stronger purchase intention compared to those in imbalanced conditions (HIP = 0 or HIP = 1). Mediation analysis further confirmed that information completeness fully mediates the effect of HIP on consumer decision-making, while alternative mechanisms such as information accuracy or source credibility did not yield significant effects.
In conclusion, this study contributes a novel perspective to the literature on online consumer behavior and information quality by emphasizing the importance of balance and functional synergy in visual content. By identifying information completeness as the mediating cognitive mechanism, and HIP as a key predictor of that completeness, we provide a more nuanced understanding of how consumers process visual information in high-choice, low-touch online environments. These insights are not only theoretically robust but also carry tangible implications for the design, regulation, and strategic deployment of user-generated content in digital commerce ecosystems.
While prior research has paid considerable attention to visual aesthetics or object detection, few studies have examined visual information completeness—that is, how well a set of images collectively conveys decision-relevant information. This study is among the first to operationalize completeness in a visual-compositional sense by examining the ratio between holistic and detailed images. Our findings suggest that completeness is not a static property of individual images, but rather an emergent perception shaped by how different visual functions are combined. Through a controlled experiment (Study 2), we demonstrate that completeness plays a central role in driving purchase intention: when holistic and detailed images are balanced, participants report significantly higher perceptions of completeness, which in turn fully mediates the effect on purchase intention. This confirms the psychological relevance and explanatory power of visual completeness as a cognitive mechanism. In parallel, our observational analysis (Study 1) further reveals that the effect of completeness is not unconditional. Specifically, we identify review sentiment as a critical boundary condition: the positive impact of balanced HIP is significantly amplified under positive sentiment and attenuated under negative sentiment. Other factors, such as review volume (NCR), did not moderate this relationship. This suggests that sentiment uniquely shapes how visual completeness is perceived and acted upon, revealing the affective-cognitive interplay at the heart of multimodal persuasion.
Taken together, these findings expand current understandings of information completeness by extending its scope to unstructured visual data, modeling its functional composition, and situating it within a broader multimodal framework of consumer decision-making.
6.1. Theoretical Implications
This research makes several important theoretical contributions to the literature on online consumer behavior, information quality, and visual communication in digital environments.
First, it redefines the analytical unit of online review images by shifting from a static, attribute-based view (e.g., aesthetic appeal, resolution, or face presence) to a functional-compositional perspective. By categorizing images into holistic and detailed types and introducing Holistic Image Proportion (HIP) as a continuous variable, this study provides a new conceptual framework for evaluating visual information richness. This shift responds to recent calls in information systems and marketing literature for more nuanced interpretations of visual content that account for its functional roles in shaping consumer cognition.
Second, the study extends the concept of information completeness by empirically demonstrating its central mediating role in online decision-making contexts. Previous research has largely examined completeness in textual or structured data formats. By applying the concept to unstructured visual data, this research broadens the scope and applicability of information completeness. It underscores that completeness is not an inherent property of images per se, but a relational and perceptual outcome shaped by the composition and interaction of different image types.
Third, this work contributes to the understanding of nonlinear effects in digital information processing. The observed inverted U-shaped relationships challenge the prevalent linearity assumptions in visual content evaluation and suggest that more is not always better. Excessive dominance of either image type can hinder information processing and lead to reduced purchase intention. This theoretical insight adds complexity to existing models of visual persuasion and offers a more realistic account of how consumers process image-heavy content in e-commerce environments.
Fourth, this research contributes to the literature on multimodal information processing by identifying review sentiment as a boundary condition that interacts with visual completeness. While prior studies have examined how visual and textual cues influence purchase intentions separately, few have modeled their interactive effects. Our findings reveal that the impact of balanced visual composition is amplified under positive sentiment and weakened under negative sentiment, suggesting that affective valence governs how consumers interpret and weigh visual completeness. This insight advances theory by situating completeness not only as a content property but also as a sentiment-contingent cognitive mechanism, enriching our understanding of persuasion in multimodal environments.
Finally, by combining deep learning techniques with behavioral experimentation, the study showcases a multi-method approach that bridges computational and behavioral paradigms. This methodological integration strengthens the theoretical contribution by validating conceptual constructs (e.g., HIP, completeness) through both large-scale observational analysis and controlled causal inference, reinforcing the credibility and generalizability of the findings.
6.2. Managerial Implications
The findings of this study hold significant implications for e-commerce platforms, online retailers, and content strategy managers who seek to enhance user experience and improve conversion rates through visual content design.
First, the results suggest that a compositional balance between holistic and detailed images in user-generated reviews is not merely aesthetic but substantively improves perceived information completeness and consumer decision-making. By compositional balance, we refer to a functional equilibrium in which holistic and detailed images are present in roughly equal proportion (HIP ≈ 0.5), ensuring that consumers receive both an overall visual impression of the product and specific feature-level information. This also implies that perceived completeness can be actively designed and optimized by platforms through UI nudges or upload templates that encourage balanced visual composition. Since completeness is perceptual rather than inherent, platforms can guide users to “show the whole and the parts” to boost review efficacy. Platforms should therefore consider implementing interface nudges, upload guidelines, or automated prompts that encourage users to contribute both types of images. This could be operationalized through algorithmically generated suggestions or balanced review templates that structure image contributions.
Second, platform algorithms that rank or highlight reviews should incorporate HIP-based metrics to assess the functional completeness of visual information. Reviews exhibiting balanced composition can be algorithmically prioritized in default sorting, thereby improving the informational quality of displayed content and reducing the cognitive load on consumers navigating product pages.
Third, sellers and brands can leverage these insights in their post-sale engagement strategies by guiding satisfied customers to share both types of images. In parallel, they may proactively curate their own review sections by supplementing imbalanced user content with targeted visuals that fill missing informational gaps, thus maintaining an optimal HIP level. Moreover, managers should consider the sentiment context when curating and promoting review content. For products with predominantly positive sentiment, emphasizing balanced image compositions can maximize persuasive impact, whereas in cases with more negative sentiment, visual balance may be less effective.
Moreover, given that the impact of completeness is contingent on positive sentiment, platforms may use sentiment analysis to determine when to prioritize balanced reviews in content recommendation algorithms. Under favorable sentiment contexts, visually complete reviews can be more prominently displayed to maximize persuasion. Conversely, when sentiment is negative, other signals (e.g., textual content, star rating) may be more informative.
6.3. Limitations
Despite the contributions, several limitations should be acknowledged. First, our dataset focuses on the women’s clothing category, which may limit generalizability to other product types where the informational value of images may differ. Second, the classification of images into only three categories (holistic, detailed, non-relevant) simplifies the complexity of visual content and may overlook other functional or emotional cues conveyed through images. Third, the experimental setting, while controlled, may not fully capture the browsing behavior dynamics on real e-commerce platforms. Fourth, we conducted a post hoc sensitivity power analysis for Study 2. With a total sample size of 120 and a three-condition between-subjects design, the study has 80% power at the 0.05 significance level to detect medium-to-large effects (Cohen’s f ≈ 0.26). While this level of power is consistent with prior experimental research in this domain, smaller effects may not have been detected, and future studies with larger samples are encouraged. Finally, future research could expand on this work by incorporating multimodal content fusion (images + text + video), cross-category analysis, and longitudinal tracking of consumer responses to review image composition.
Supplementary Materials
The following supporting information can be downloaded at: https://www.mdpi.com/article/10.3390/jtaer21010018/s1, File S1: Section A: Measurement Items for Purchase Intention and Information Completeness. Section B: Confusion Matrix and Classification Metrics for Secondary Data Analysis. Section C: Additional Visualization of Model Predictions with 95% Confidence Intervals. Section D: Standardized Regression Coefficients for Main Models.
Author Contributions
Conceptualization, M.W. and Y.T.; Methodology, M.W.; Software, M.W.; Validation, M.W. and Y.T.; Formal analysis, M.W.; Investigation, M.W. and Y.T.; Resources, M.W. and Y.T.; Data curation, M.W.; Writing–original draft, M.W.; Writing–review & editing, M.W. and Y.T.; Visualization, M.W.; Supervision, M.W.; Project administration, M.W. and Y.T.; Funding acquisition, M.W. and Y.T. All authors have read and agreed to the published version of the manuscript.
Funding
This research received no external funding.
Institutional Review Board Statement
The study was conducted in accordance with the Declaration of Helsinki, and approved by the Institutional Review Board of School of Management at Zhejiang University (protocol code ZJUSOM20250618 and date of approval 15 June 2025).
Informed Consent Statement
For Study 1, no informed consent was required as the analysis was based entirely on publicly accessible, anonymized secondary data. For Study 2, informed consent was obtained electronically from all participants prior to their participation in the online experiment. Participants were informed of the study’s academic purpose, the voluntary nature of their involvement, and their right to withdraw at any time without consequence.
Data Availability Statement
The data presented in this study are available on request from the corresponding author.
Conflicts of Interest
The authors declare no conflict of interest.
Abbreviations
The following abbreviations are used in this manuscript:
| HIP | Holistic Image Proportion |
References
- Dong, H.; Park, K.K.; Kim, J.M. The Role of Product Type in Online Review Generation and Perception: Implications for Consumer Decision-Making. J. Theor. Appl. Electron. Commer. Res. 2025, 20, 135. [Google Scholar] [CrossRef]
- Liu, C.; Chen, T.; Pu, Q.; Jin, Y. Text Mining for Consumers’ Sentiment Tendency and Strategies for Promoting Cross-Border E-Commerce Marketing Using Consumers’ Online Review Data. J. Theor. Appl. Electron. Commer. Res. 2025, 20, 125. [Google Scholar] [CrossRef]
- Guan, Y.; Tan, Y.; Wei, Q.; Chen, G.Q. When Images Backfire: The Effect of Customer-Generated Images on Product Rating Dynamics. Inform. Syst. Res. 2023, 34, 1641–1663. [Google Scholar] [CrossRef]
- Yang, S.-B.; Hlee, S.; Lee, J.; Koo, C. An empirical examination of online restaurant reviews on Yelp.com. Int. J. Contemp. Hosp. Manag. 2017, 29, 817–839. [Google Scholar] [CrossRef]
- Zhang, S.Y.; Lee, D.; Singh, P.V.; Srinivasan, K. What Makes a Good Image? Airbnb Demand Analytics Leveraging Interpretable Image Features. Manag. Sci. 2022, 68, 5644–5666. [Google Scholar] [CrossRef]
- Chu, Y.; Liu, X.; Liu, C. The Role of Visual Cues in Online Reviews: How Image Complexity Shapes Review Helpfulness. J. Theor. Appl. Electron. Commer. Res. 2025, 20, 181. [Google Scholar] [CrossRef]
- Li, Y.Y.; Xie, Y. Is a Picture Worth a Thousand Words? An Empirical Study of Image Content and Social Media Engagement. J. Mark. Res. 2020, 57, 1–19. [Google Scholar] [CrossRef]
- Ceylan, G.; Diehl, K.; Proserpio, D. Words meet photos: When and why photos increase review helpfulness. J. Mark. Res. 2024, 61, 5–26. [Google Scholar] [CrossRef]
- Lebow, S. Ecommerce to Account for More than 20% of Worldwide Retail Sales Despite Slowdown. Available online: https://www.emarketer.com/content/ecommerce-account-more-than-20--of-worldwide-retail-sales-despite-slowdown? (accessed on 1 November 2025).
- Bazaarvoice. Reviews That Influence Purchases: How User-Generated Content Drives Sales. Available online: https://www.bazaarvoice.com/blog/reviews-that-influence-purchases/ (accessed on 1 November 2025).
- Wang, X.; Bendle, N.; Pan, Y. Beyond text: Marketing strategy in a world turned upside down. J. Acad. Mark. Sci. 2024, 52, 939–954. [Google Scholar] [CrossRef]
- Burnap, A.; Hauser, J.R.; Timoshenko, A. Product aesthetic design: A machine learning augmentation. Mark. Sci. 2023, 42, 1029–1056. [Google Scholar] [CrossRef]
- Hu, X.; He, L.Y.; Liu, J.J. The power of beauty: Be your ideal self in online reviews-an empirical study based on face detection. J. Retail. Consum. Serv. 2022, 67, 102975. [Google Scholar] [CrossRef]
- Li, H.Y.; Ji, H.P.; Liu, H.B.; Cai, D.T.; Gao, H.C. Is a picture worth a thousand words? Understanding the role of review photo sentiment and text-photo sentiment disparity using deep learning algorithms. Tour. Manag. 2022, 92, 104559. [Google Scholar] [CrossRef]
- Yang, Y.; Wang, Y.; Zhao, J. Effect of user-generated image on review helpfulness: Perspectives from object detection. Electron. Commer. Res. Appl. 2023, 57, 101232. [Google Scholar] [CrossRef]
- Lee, Y.W.; Strong, D.M.; Kahn, B.K.; Wang, R.Y. AIMQ: A methodology for information quality assessment. Inform. Manag. 2002, 40, 133–146. [Google Scholar] [CrossRef]
- Ge, M.; Helfert, M.; Jannach, D. Information quality assessment: Validating measurement dimensions and processes. In Proceedings of the European Conference on Information Systems, Helsinki, Finland, 9–11 June 2011; p. 75. [Google Scholar]
- Knight, S.-A.; Burn, J. Developing a Framework for Assessing Information Quality on the World Wide Web. Informing Sci. 2005, 8, 159–172. [Google Scholar] [CrossRef]
- Heinrich, B.; Hopf, M.; Lohninger, D.; Schiller, A.; Szubartowicz, M. Data quality in recommender systems: The impact of completeness of item content data on prediction accuracy of recommender systems. Electron. Mark. 2021, 31, 389–409. [Google Scholar] [CrossRef]
- Ruan, Y.; Mezei, J. When do AI chatbots lead to higher customer satisfaction than human frontline employees in online shopping assistance? Considering product attribute type. J. Retail. Consum. Serv. 2022, 68, 103059. [Google Scholar] [CrossRef]
- Jiang, C.Q.; Wang, J.F.; Tang, Q.; Lyu, X.Z. Investigating the Effects of Dimension-Specific Sentiments on Product Sales: The Perspective of Sentiment Preferences. J. Assoc. Inf. Syst. 2021, 22, 459–489. [Google Scholar] [CrossRef]
- Chevalier, J.A.; Mayzlin, D. The effect of word of mouth on sales: Online book reviews. J. Mark. Res. 2006, 43, 345–354. [Google Scholar] [CrossRef]
- Forman, C.; Ghose, A.; Wiesenfeld, B. Examining the relationship between reviews and sales: The role of reviewer identity disclosure in electronic markets. Inform. Syst. Res. 2008, 19, 291–313. [Google Scholar] [CrossRef]
- Kuan, K.K.Y.; Hui, K.L.; Prasarnphanich, P.; Lai, H.Y. What Makes a Review Voted? An Empirical Investigation of Review Voting in Online Review Systems. J. Assoc. Inf. Syst. 2015, 16, 48–71. [Google Scholar] [CrossRef]
- Kwark, Y.; Lee, G.M.; Pavlou, P.A.; Qiu, L.F. On the Spillover Effects of Online Product Reviews on Purchases: Evidence from Clickstream Data. Inform. Syst. Res. 2021, 32, 895–913. [Google Scholar] [CrossRef]
- Lee, H.A.; Choi, A.A.; Sun, T.; Oh, W. Reviewing Before Reading? An Empirical Investigation of Book-Consumption Patterns and Their Effects on Reviews and Sales. Inform. Syst. Res. 2021, 32, 1368–1389. [Google Scholar] [CrossRef]
- Li, L.Y.; Gopinath, S.; Carson, S.J. History Matters: The Impact of Online Customer Reviews Across Product Generations. Manag. Sci. 2022, 68, 3878–3903. [Google Scholar] [CrossRef]
- Mudambi, S.M.; Schuff, D. What Makes a Helpful Online Review? A Study of Customer Reviews on Amazon.Com. Mis Quart. 2010, 34, 185–200. [Google Scholar] [CrossRef]
- Jiang, Z.J.; Benbasat, I. The effects of presentation formats and task complexity on online consumers’ product understanding. Mis Quart. 2007, 31, 475–500. [Google Scholar] [CrossRef]
- Maier, E.; Dost, F. The positive effect of contextual image backgrounds on fluency and liking. J. Retail. Consum. Serv. 2018, 40, 109–116. [Google Scholar] [CrossRef]
- Wang, M.; Tong, Y. Does review image matter? A deep learning-based study on online product reviews. In Proceedings of the PACIS 2022 Proceedings, Taipei, Taiwan, 5–9 July 2022. [Google Scholar]
- Xia, H.S.; Pan, X.T.; Zhou, Y.J.; Zhang, Z.P. Creating the best first impression: Designing online product photos to increase sales. Decis. Support. Syst. 2020, 131, 113235. [Google Scholar] [CrossRef]
- Xu, P.; Chen, L.; Santhanam, R. Will video be the next generation of e-commerce product reviews? Presentation format and the role of product type. Decis. Support. Syst. 2015, 73, 85–96. [Google Scholar] [CrossRef]
- Shin, D.; He, S.; Lee, G.M.; Whinston, A.B.; Cetintas, S.; Lee, K.C. Enhancing Social Media Analysis with Visual Data Analytics: A Deep Learning Approach. Mis Quart. 2020, 44, 1459–1492. [Google Scholar] [CrossRef]
- Hjelle, S.; Mikalef, P.; Altwaijry, N.; Parida, V. Organizational decision making and analytics: An experimental study on dashboard visualizations. Inform. Manag. 2024, 61, 104011. [Google Scholar] [CrossRef]
- Kitchens, B.; Claggett, J.L.; Abbasi, A. Timely, Granular, and Actionable: Designing a Social Listening Platform for Public Health 3.0. Mis Quart. 2024, 48, 899–930. [Google Scholar] [CrossRef]
- Peng, L.; Cui, G.; Chung, Y.H.; Zheng, W.Y. The Faces of Success: Beauty and Ugliness Premiums in e-Commerce Platforms. J. Mark. 2020, 84, 67–85. [Google Scholar] [CrossRef]
- Lecun, Y.; Bottou, L.; Bengio, Y.; Haffner, P. Gradient-based learning applied to document recognition. Proc. IEEE 1998, 86, 2278–2324. [Google Scholar] [CrossRef]
- He, K.; Zhang, X.; Ren, S.; Sun, J. Deep residual learning for image recognition. In Proceedings of the IEEE conference on computer vision and pattern recognition, Las Vegas, NV, USA, 27–30 June 2016; pp. 770–778. [Google Scholar]
- Bishop, C.M.; Nasrabadi, N.M. Pattern Recognition and Machine Learning; Springer: Berlin/Heidelberg, Germany, 2006; Volume 4. [Google Scholar]
- Yoo, B.; Donthu, N. Developing a scale to measure the perceived quality of an Internet shopping site (SITEQUAL). Q. J. Electron. Commer. 2001, 2, 31–45. [Google Scholar]
- Ohanian, R. Construction and Validation of a Scale to Measure Celebrity Endorsers’ Perceived Expertise, Trustworthiness, and Attractiveness. J. Advert. 1990, 19, 39–52. [Google Scholar] [CrossRef]
- Hayes, A.F. Introduction to Mediation, Moderation, and Conditional Process Analysis: A Regression-Based Approach; Guilford Publications: New York, NY, USA, 2017. [Google Scholar]


Disclaimer/Publisher’s Note: The statements, opinions and data contained in all publications are solely those of the individual author(s) and contributor(s) and not of MDPI and/or the editor(s). MDPI and/or the editor(s) disclaim responsibility for any injury to people or property resulting from any ideas, methods, instructions or products referred to in the content. |
© 2026 by the authors. Licensee MDPI, Basel, Switzerland. This article is an open access article distributed under the terms and conditions of the Creative Commons Attribution (CC BY) license.