Effects of Duodenal Infusion of Lauric Acid and L-Tryptophan, Alone and Combined, on Fasting Glucose, Insulin and Glucagon in Healthy Men


Abstract
1. Introduction
2. Materials and Methods
2.1. Study Participants
2.2. Study Design and Protocol
2.3. Control and Nutrient Treatments
2.4. Measurements
Plasma Glucose, Insulin and Glucagon Concentrations
2.5. Data and Statistical Analyses
3. Results
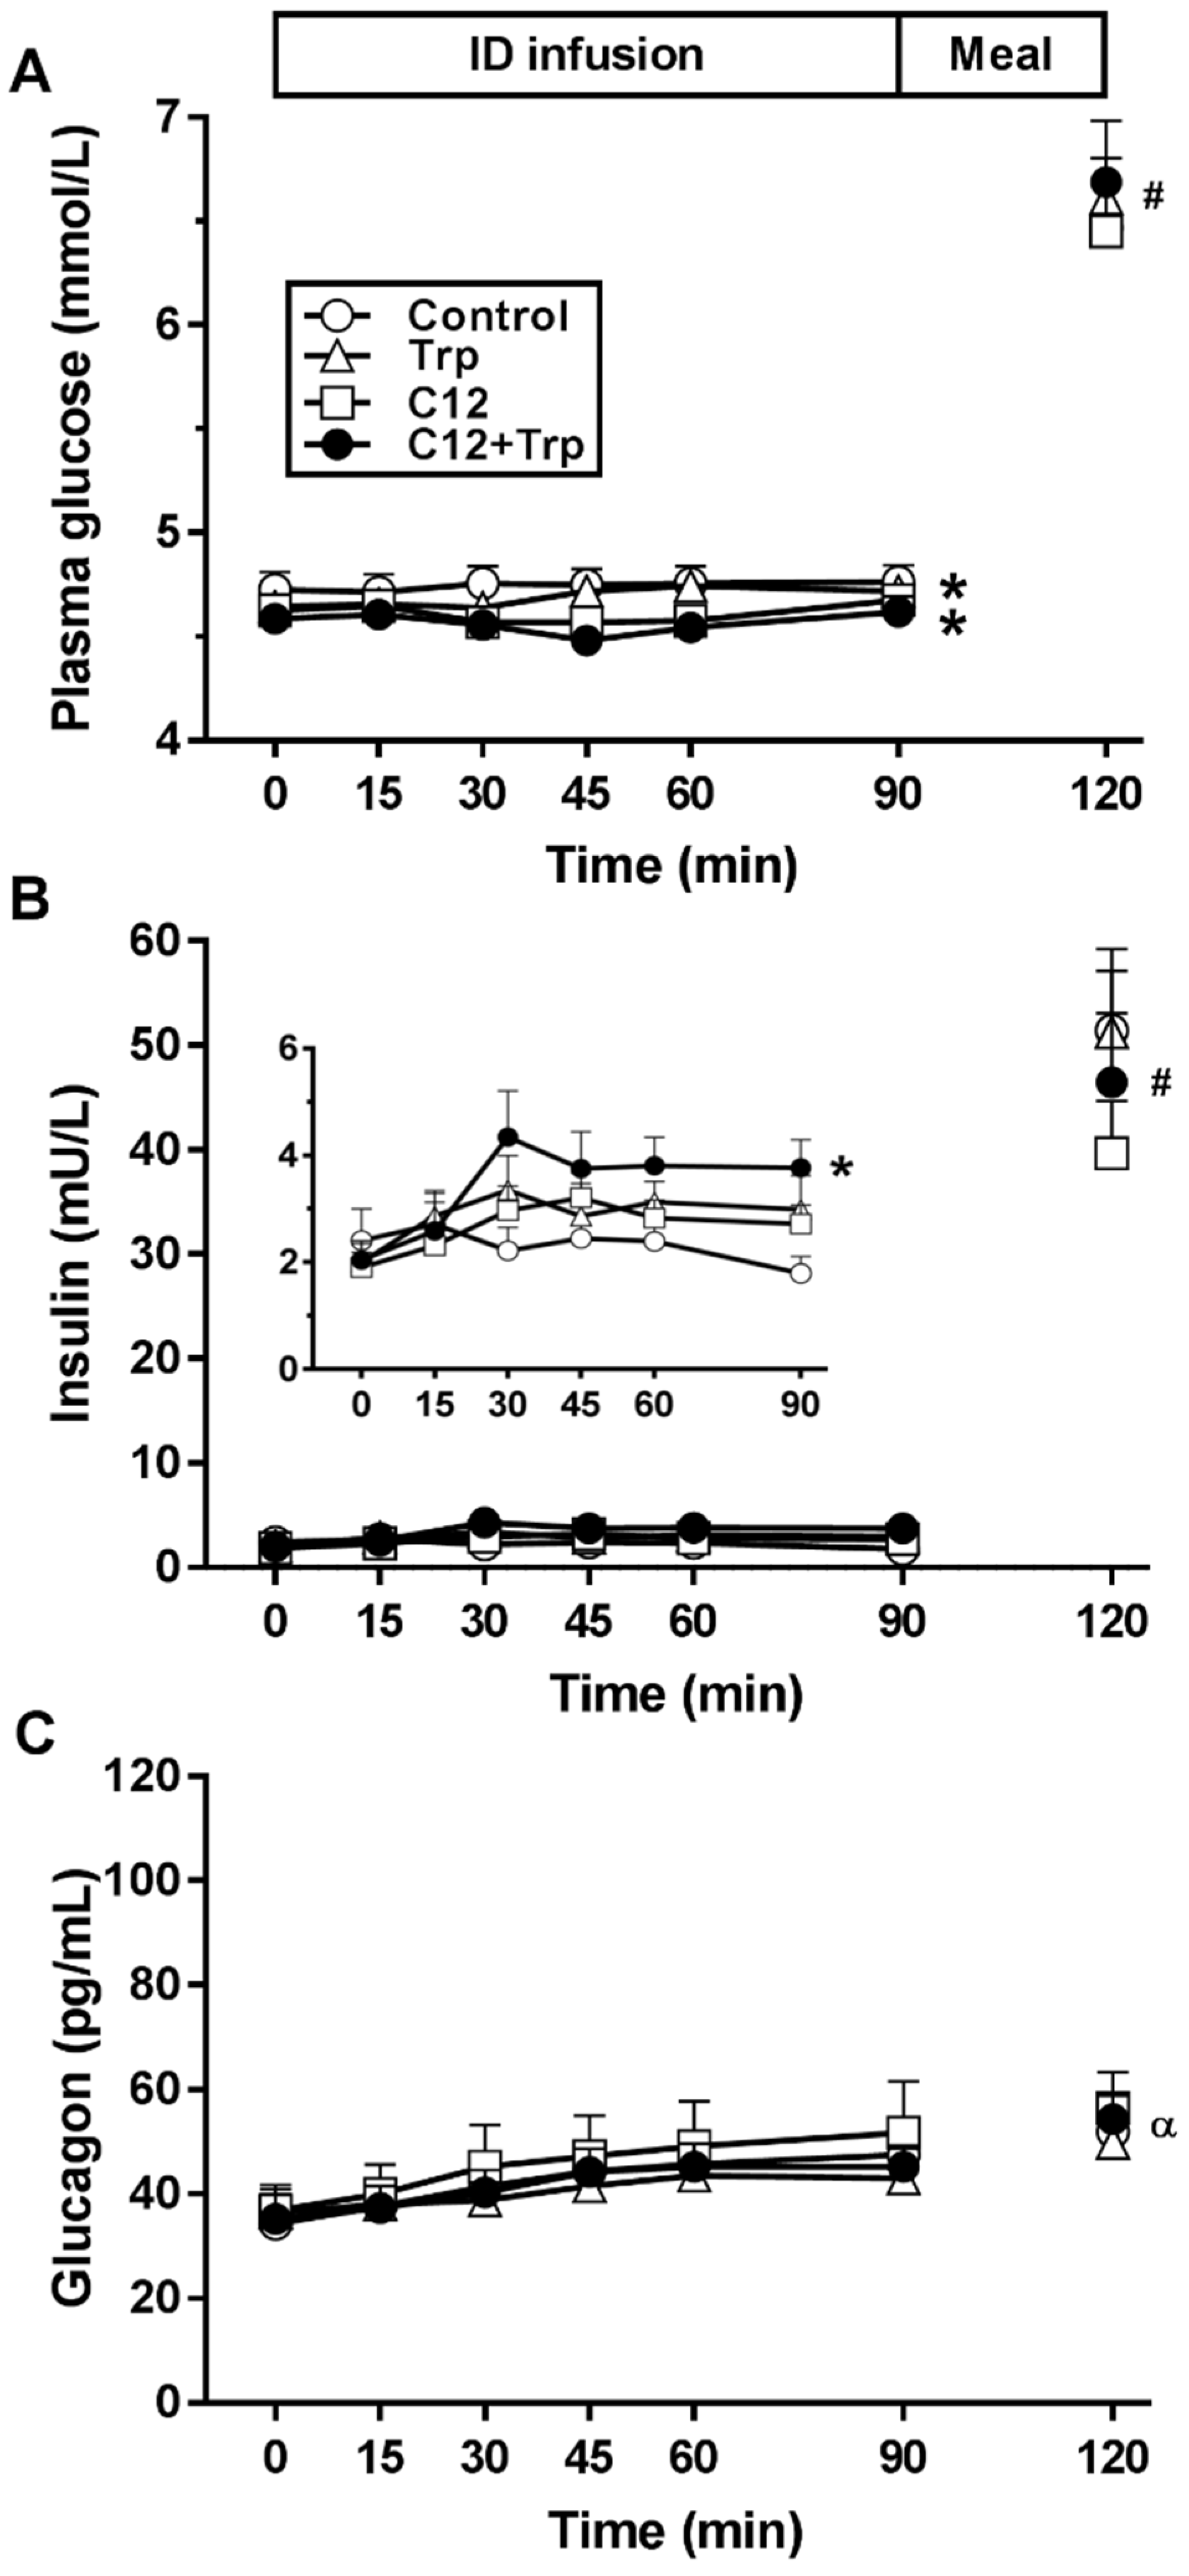
3.1. Plasma Glucose
3.2. Plasma Insulin
3.3. Insulin-to-Glucose Ratio
3.4. Plasma Glucagon
4. Discussion
5. Conclusions
Author Contributions
Funding
Acknowledgments
Conflicts of Interest
References
- Gentilcore, D.; Chaikomin, R.; Jones, K.L.; Russo, A.; Feinle-Bisset, C.; Wishart, J.M.; Rayner, C.K.; Horowitz, M. Effects of fat on gastric emptying of and the glycemic, insulin, and incretin responses to a carbohydrate meal in type 2 diabetes. J. Clin. Endocrinol. Metab. 2006, 91, 2062–2067. [Google Scholar] [CrossRef] [PubMed]
- Ma, J.; Stevens, J.E.; Cukier, K.; Maddox, A.F.; Wishart, J.M.; Jones, K.L.; Clifton, P.M.; Horowitz, M.; Rayner, C.K. Effects of a protein preload on gastric emptying, glycemia, and gut hormones after a carbohydrate meal in diet-controlled type 2 diabetes. Diabetes Care 2009, 32, 1600–1602. [Google Scholar] [CrossRef] [PubMed]
- Heer, M.; Egert, S. Nutrients other than carbohydrates: Their effects on glucose homeostasis in humans. Diabetes Metab. Res. Rev. 2015, 31, 14–35. [Google Scholar] [CrossRef] [PubMed]
- Horowitz, M.; Edelbroek, M.A.L.; Wishart, J.M.; Straathof, J.W. Relationship between oral glucose tolerance and gastric emptying in normal healthy subjects. Diabetologia 1993, 36, 857–862. [Google Scholar] [CrossRef] [PubMed]
- Little, T.J.; Pilichiewicz, A.N.; Russo, A.; Phillips, L.; Jones, K.L.; Nauck, M.A.; Wishart, J.; Horowitz, M.; Feinle–Bisset, C. Effects of intravenous glucagon–like peptide–1 on gastric emptying and intragastric distribution in healthy subjects: Relationships with postprandial glycemic and insulinemic responses. J. Clin. Endocrinol. Metab. 2006, 91, 1916–1923. [Google Scholar] [CrossRef]
- Heddle, R.; Collins, P.J.; Dent, J.; Horowitz, M.; Read, N.W.; Chatterton, B.; Houghton, L.A. Motor mechanisms associated with slowing of the gastric emptying of a solid meal by an intraduodenal lipid infusion. J. Gastroenterol. Hepatol. 1989, 4, 437–447. [Google Scholar] [CrossRef]
- Moran-Ramos, S.; Tovar, A.R.; Torres, N. Diet: Friend or foe of enteroendocrine cells-how it interacts with enteroendocrine cells. Adv. Nutr. 2012, 3, 8–20. [Google Scholar] [CrossRef]
- Ryan, A.T.; Luscombe-Marsh, N.D.; Saies, A.A.; Little, T.J.; Standfield, S.; Horowitz, M.; Feinle-Bisset, C. Effects of intraduodenal lipid and protein on gut motility and hormone release, glycemia, appetite, and energy intake in lean men. Am. J. Clin. Nutr. 2013, 98, 300–311. [Google Scholar] [CrossRef]
- Prentki, M.; Madiraju, S.R. Glycerolipid/free fatty acid cycle and islet beta-cell function in health, obesity and diabetes. Mol. Cell. Endocrinol. 2012, 353, 88–100. [Google Scholar] [CrossRef]
- Newsholme, P.; Bender, K.; Kiely, A.; Brennan, L. Amino acid metabolism, insulin secretion and diabetes. Biochem. Soc. Trans. 2007, 35, 1180–1186. [Google Scholar] [CrossRef]
- Steinert, R.E.; Luscombe-Marsh, N.D.; Little, T.J.; Standfield, S.; Otto, B.; Horowitz, M.; Feinle-Bisset, C. Effects of intraduodenal infusion of L-tryptophan on ad libitum eating, antropyloroduodenal motility, glycemia, insulinemia, and gut peptide secretion in healthy men. J. Clin. Endocrinol. Metab. 2014, 99, 3275–3284. [Google Scholar] [CrossRef] [PubMed]
- Little, T.J.; Feltrin, K.L.; Horowitz, M.; Smout, A.J.; Rades, T.; Meyer, J.H.; Pilichiewicz, A.N.; Wishart, J.; Feinle-Bisset, C. Dose-related effects of lauric acid on antropyloroduodenal motility, gastrointestinal hormone release, appetite, and energy intake in healthy men. Am. J. Physiol. Regul. Integr. Comp. Physiol. 2005, 289, R1090–R1098. [Google Scholar] [CrossRef] [PubMed]
- Ullrich, S.S.; Fitzgerald, P.C.E.; Giesbertz, P.; Steinert, R.E.; Horowitz, M.; Feinle-Bisset, C. Effects of intragastric administration of tryptophan on the blood glucose response to a nutrient drink and energy intake, in lean and obese men. Nutrients 2018, 10, 463. [Google Scholar] [CrossRef] [PubMed]
- Ma, J.; Checklin, H.L.; Wishart, J.M.; Stevens, J.E.; Jones, K.L.; Horowitz, M.; Meyer, J.H.; Rayner, C.K. A randomised trial of enteric-coated nutrient pellets to stimulate gastrointestinal peptide release and lower glycaemia in type 2 diabetes. Diabetologia 2013, 56, 1236–1242. [Google Scholar] [CrossRef] [PubMed]
- Vahl, T.P.; Tauchi, M.; Durler, T.S.; Elfers, E.E.; Fernandes, T.M.; Bitner, R.D.; Ellis, K.S.; Woods, S.C.; Seeley, R.J.; Herman, J.P.; et al. Glucagon-like peptide-1 (GLP-1) receptors expressed on nerve terminals in the portal vein mediate the effects of endogenous GLP-1 on glucose tolerance in rats. Endocrinology 2007, 148, 4965–4973. [Google Scholar] [CrossRef] [PubMed]
- Nishizawa, M.; Moore, M.C.; Shiota, M.; Gustavson, S.M.; Snead, W.L.; Neal, D.W.; Cherrington, A.D. Effect of intraportal glucagon-like peptide-1 on glucose metabolism in conscious dogs. Am. J. Physiol. Endocrinol. Metab. 2003, 284, E1027–E1036. [Google Scholar] [CrossRef] [PubMed]
- Stewart, J.E.; Feinle-Bisset, C.; Keast, R.S. Fatty acid detection during food consumption and digestion: Associations with ingestive behavior and obesity. Prog. Lipid Res. 2011, 50, 225–233. [Google Scholar] [CrossRef]
- San Gabriel, A.; Uneyama, H. Amino acid sensing in the gastrointestinal tract. Amino Acids 2013, 45, 451–461. [Google Scholar] [CrossRef]
- Steensels, S.; Depoortere, I. Chemoreceptors in the gut. Annu. Rev. Physiol. 2018, 80, 117–141. [Google Scholar] [CrossRef]
- McVeay, C.; Fitzgerald, P.C.E.; Ullrich, S.S.; Steinert, R.E.; Horowitz, M.; Feinle-Bisset, C. Effects of intraduodenal administration of lauric acid and L-tryptophan, alone and combined, on gut hormones, pyloric pressures, and energy intake in healthy men. Am. J. Clin. Nutr. 2019, 109, 1335–1343. [Google Scholar] [CrossRef]
- Stunkard, A.J.; Messick, S. The three-factor eating questionnaire to measure dietary restraint, disinhibition and hunger. J. Pyschosom. Res. 1985, 29, 71–83. [Google Scholar] [CrossRef]
- Feltrin, K.L.; Little, T.J.; Meyer, J.H.; Horowitz, M.; Rades, T.; Wishart, J.; Feinle-Bisset, C. Effects of lauric acid on upper gut motility, plasma cholecystokinin and peptide YY, and energy intake are load, but not concentration, dependent in humans. J. Physiol. 2007, 581, 767–777. [Google Scholar] [CrossRef] [PubMed]
- Heddle, R.; Dent, J.; Toouli, J.; Read, N.W. Topography and measurement of pyloric pressure waves and tone in humans. Am. J. Physiol. 1988, 255, G490–G497. [Google Scholar] [CrossRef] [PubMed]
- Ardiansyah; Shirakawa, H.; Inagawa, Y.; Koseki, T.; Komai, M. Regulation of blood pressure and glucose metabolism induced by L-tryptophan in stroke-prone spontaneously hypertensive rats. Nutr. Metab. 2011, 8, 45. [Google Scholar] [CrossRef] [PubMed]
- Holst, J.J. The physiology of glucagon-like peptide-1. Physiol. Rev. 2007, 87, 1409–1439. [Google Scholar] [CrossRef] [PubMed]
- Nauck, M.A.; Kleine, N.; Orskov, C.; Holst, J.J.; Willms, B.; Creutzfeldt, W. Normalization of fasting hyperglycaemia by exogenous glucagon-like peptide-1 (7–36 amide) in type 2 (non-insulin-dependent) diabetic patients. Diabetologia 1993, 36, 741–744. [Google Scholar] [CrossRef]
- Degn, K.B.; Brock, B.; Juhl, C.B.; Djurhuus, C.B.; Grubert, J.; Kim, D.; Han, J.; Taylor, K.; Fineman, M.; Schmitz, O. Effect of intravenous infusion of exenatide (synthetic exendin-4) on glucose-dependent insulin secretion and counterregulation during hypoglycemia. Diabetes 2004, 53, 2397–2403. [Google Scholar] [CrossRef]
- Lamont, B.J.; Li, Y.; Kwan, E.; Brown, T.J.; Gaisano, H.; Drucker, D.J. Pancreatic GLP-1 receptor activation is sufficient for incretin control of glucose metabolism in mice. J. Clin. Investig. 2012, 122, 388–402. [Google Scholar] [CrossRef]
- Stefanaki, C.; Peppa, M.; Mastorakos, G.; Chrousos, G.P. Examining the gut bacteriome, virome, and mycobiome in glucose metabolism disorders: Are we on the right track? Metabolism 2017, 73, 52–66. [Google Scholar] [CrossRef]
- David, L.A.; Maurice, C.F.; Carmody, R.N.; Gootenberg, D.B.; Button, J.E.; Wolfe, B.E.; Ling, A.V.; Devlin, A.S.; Varma, Y.; Fischbach, M.A.; et al. Diet rapidly and reproducibly alters the human gut microbiome. Nature 2014, 505, 559–563. [Google Scholar] [CrossRef]


| Control | C12 | Trp | C12+Trp | p Value | |
|---|---|---|---|---|---|
| Plasma glucose AUC (mmol/L*min) | 426 ± 7 | 414 ± 5 * | 422 ± 4 | 410 ± 5 * | <0.05 |
| Plasma glucose nadir (mmol/L) | 4.7 ± 0.1 | 4.5 ± 0.1 * | 4.6 ± 0.1 | 4.4 ± 0.1 * | <0.05 |
| Plasma insulin AUC (mU/L*min) | 210 ± 35 | 246 ± 28 | 266 ± 39 | 318 ± 47 * | <0.05 |
| Plasma glucagon AUC (pg/mL*min) | 3849 ± 457 | 4146 ± 690 | 3675 ± 492 | 3787 ± 375 | NS |
| Insulin-to-glucose ratio | 0.5 ± 0.1 | 0.6 ± 0.1 | 0.6 ± 0.1 | 0.8 ± 0.1 # | <0.01 |
© 2019 by the authors. Licensee MDPI, Basel, Switzerland. This article is an open access article distributed under the terms and conditions of the Creative Commons Attribution (CC BY) license (http://creativecommons.org/licenses/by/4.0/).
Share and Cite
McVeay, C.; Fitzgerald, P.C.E.; Horowitz, M.; Feinle-Bisset, C. Effects of Duodenal Infusion of Lauric Acid and L-Tryptophan, Alone and Combined, on Fasting Glucose, Insulin and Glucagon in Healthy Men. Nutrients 2019, 11, 2697. https://doi.org/10.3390/nu11112697
McVeay C, Fitzgerald PCE, Horowitz M, Feinle-Bisset C. Effects of Duodenal Infusion of Lauric Acid and L-Tryptophan, Alone and Combined, on Fasting Glucose, Insulin and Glucagon in Healthy Men. Nutrients. 2019; 11(11):2697. https://doi.org/10.3390/nu11112697
Chicago/Turabian StyleMcVeay, Christina, Penelope C. E. Fitzgerald, Michael Horowitz, and Christine Feinle-Bisset. 2019. "Effects of Duodenal Infusion of Lauric Acid and L-Tryptophan, Alone and Combined, on Fasting Glucose, Insulin and Glucagon in Healthy Men" Nutrients 11, no. 11: 2697. https://doi.org/10.3390/nu11112697
APA StyleMcVeay, C., Fitzgerald, P. C. E., Horowitz, M., & Feinle-Bisset, C. (2019). Effects of Duodenal Infusion of Lauric Acid and L-Tryptophan, Alone and Combined, on Fasting Glucose, Insulin and Glucagon in Healthy Men. Nutrients, 11(11), 2697. https://doi.org/10.3390/nu11112697