


Abstract
This research explores the relationship between credit risk and bank value within the framework of horizontal mergers and acquisitions (M&A), employing a quantile regression approach to analyze how horizontal M&A activities moderate this relationship across 110 operational Bank Holding Companies (BHCs) over 23 years. This paper stands out from previous studies by extending the scope beyond linear approaches and using the Quantiles via Moments estimator to address potential endogeneity concerns. The results demonstrate a significant negative link between credit risk and bank value, which decreases in magnitude as moving higher in the value distribution. Conversely, there is a consistent positive connection between M&A activities and bank value that is stable across different quantiles of value. Mergers and acquisitions worsen the negative impact of credit risk on bank value, affecting banks with both low and high values similarly. The findings provide useful information for investors, practitioners, and policymakers in the banking industry. Investors may use credit risk and value proposition assessments to make well-informed investment decisions, or to construct well-diversified portfolios, and identify appropriate institutions for mergers and acquisitions to enhance value. It is recommended that practitioners prioritize efficient credit risk management, especially before engaging in M&A activities and aligning them with the bank’s value proposition. Policymakers should develop guidelines to regulate M&A transactions, using established dynamic credit risk standards that correspond to banks’ value propositions, to promote financial stability and drive industry expansion.
1. Introduction
Since the global financial crisis (GFC) of 2007–2008, the credit risk topic has become a greater concern in the financial industry. The high-financial-leverage nature of banks makes credit risk management a top priority. Unlike other institutions, banks adapt traditional asset and liabilities management into asset default and liabilities default management. Liquidity monitoring focuses on preventing liquidity defaults. Profitability is a key consideration, assessed primarily from the perspective of economic default (Chen & Kuei, 2024). The consequences of the GFC on the global economy were initially reflected in the collapse of the value of institutions operating in the banking sector, demonstrating the importance of understanding the factors that influence banks’ value, which is commonly linked to stock price (Amimakmur et al., 2024).
Worldwide, the phenomenon of M&A in the banking sector has constantly increased. While in the year 1985 there were only 247 deals, this number peaked in the year 2018, reaching over 2000 deals (Statista, 2024). M&A benefit banks by raising capital, expanding, achieving a competitive advantage, enhancing financial operating performance and bringing financial stability (Chakraborty & Das, 2024).
Montgomery and Takahashi (2014) find that M&A lead to an increase in both shareholders’ wealth and the credit risk of banks involved in such transactions. Hassan and Giouvris (2020) observe that local bank-to-bank M&A create shareholder wealth, with local M&A associated with a reduction in credit risk, while cross-border M&A are linked to an increase in risk. Both papers rely on traditional conditional mean analysis techniques, including multivariate regression, robust regression, maximum likelihood regression and weighted least squares regression. However, Wang et al. (2024) clarify that these methods rely on assumptions of normality and homoscedasticity, which are often not met in real-world financial data. Given the high volatility and non-normal distribution of such data, these methods may be inadequate for estimation.
An alternative approach, quantile regression, offers more robust estimates and provides a comprehensive analysis of business performance changes in response to specific events. In particular, Pop and Pop (2024) observe that markets price risk differently for banks in the upper locations of the spread distribution, where market discipline is tougher for risker banks. Similarly, Fich et al. (2018) find that the characteristics related to the acquiring banks have varying effects on the distribution of abnormal returns. To understanding complex predictor–response relationships, Cunningham et al. (2020) consider quantile regression an ideal analytical tool, as it captures variations in predictor effects across different response quantiles.
While the traditional conditional mean models can address the question of “how horizontal M&A affects the relationship between credit risk and bank value”, they cannot answer an equally important question of “how horizontal M&A moderates this relationship across different quantiles of the bank value distribution”.
Therefore, this paper investigates the moderating effect of horizontal M&A on the relationship between credit risk and bank value within a quantile-based framework.
The current literature provides explanations about the relationship of credit risk with value in the context of M&A within banking industry. Our paper offers a deeper theoretical understanding of this relationship by capturing the heterogeneity in the predictor–response relationship across the distribution of response, providing a novel contribution to the theoretical literature. Empirically, our novel results cannot be captured using standard conditional mean estimations. We introduce quantile regression to uncover how lower-valued banks and higher-valued banks exhibit different sensitivities to credit risk in M&A activities, effectively addressing challenges related to violations of normality and homoscedasticity in the financial data. Practically, our novel findings guide investors in identifying rewarding investment opportunities, assist bank managers in balancing risk and value creation during M&A, and inform policymakers about regulating credit risk exposure in M&A activities within the banking sector.
The results of this paper reveal that credit risk has a significant negative effect on bank value across the entire distribution, with the magnitude of this effect decreasing from lower to upper locations. This indicates that lower-valued banks are more vulnerable to a steeper decline in value as a result of credit risk, compared to higher-valued banks. Horizonal M&A exhibit a stable and significant positive effect on bank value across the entire distribution, suggesting that horizontal M&A consistently enhance bank value, regardless of the bank’s valuation. However, the moderating effect of horizontal M&A significantly magnifies the negative impact of credit risk on bank value across the entire value distribution, but without statistically significant differences observed from lower to upper locations of the distribution. This implies that horizontal M&A amplify the adverse effect of credit risk on bank value uniformly, across banks, regardless of their valuation, assuming other factors remain constant.
Our results encourage investors to invest in banks that intend to merge and acquire, as such activities increase their wealth. However, simultaneously, they should carefully consider the credit risk profile of these banks because credit risk plays a significant counterfactor to value creation, especially for low-valued banks. We advise investors to utilize recent machine learning techniques, such as Decision Trees, to classify and categorize these investment opportunities based on credit risk and bank value. This will exclude investing in banks that are willing to undergo M&A with other banks when they are low-valued and experience high credit risk, and will prioritize those that are high-valued and experience low credit risk, as these represent the best investment opportunities. Additionally, for investors who hold a portfolio of bank stocks, we advise them to incorporate a fundamental-based diversification strategy, where they overweight banks actively involved in horizontal M&A and underweight low-valued, high-credit risk banks, as these are more vulnerable to significant declines in value. This enables investors to maximize their portfolio value while minimizing exposure to the adverse effects of credit risk and M&A activities.
For practitioners, the paper’s findings advise boards of directors in the banking sector to consider horizontal M&A as a growth strategy, as this enhances value across the entire banking sector. However, the findings emphasize the importance of implementing a tailored risk management strategy for lower-valued banks during M&A processes to minimize the adverse effects of credit risk. This approach ensures that M&A activities leverage the positive effects to the interest of shareholders. Additionally, the findings suggest that a board of directors utilize a credit risk–bank value monitoring tool that tracks both credit risk exposure and value simultaneously. This tool should adjust credit risk exposure based on the bank’s value, tightening exposure when value is low and loosening it when value is high, thereby balancing risk and reward more effectively.
Policymakers can benefit from our results by establishing a supportive framework that encourages healthy M&A activities in the banking sector, ensuring these activities contribute to growth while maintaining financial stability. We also suggest developing regulatory frameworks that address the impact of credit risk exposure on the banking sector, recognizing the increased vulnerability of lower-valued banks to greater declines in value due to credit risk; a vulnerability that becomes even more pronounced during M&A transactions. Approvals for M&A should be conditioned on banks demonstrating a low credit risk profile and/or strong valuation. Regulators should establish a dynamic capital buffer that is calibrated to credit risk exposure and bank value parameters, along with introducing event-specific capital buffers during M&A activities to safeguard against foreseen and unforeseen credit risks. Additionally, policymakers can establish a monitoring mechanism to track credit risk exposure and bank value simultaneously, ensuring that banks adhere to strict credit risk policies when their value fall below specified levels.
2. Related Literature and Hypotheses Development
2.1. Credit Risk Exposure and Banking Valuation
Takahashi and Vasconcelos (2024) demonstrate the impact of credit risk on bank profitability, clarifying that the losses resulting from credit defaults reduce the capital available for investments and the issuance of new loans. Conversely, Cobbinah et al. (2024) argue that credit risk and bank performance are positively related. Charging high interest rates increases the credit defaults, but it also generates higher interest margins, thereby enhancing bank performance.
Profitability and credit risk have a significant effect on bank value. When a bank earns strong profits and achieves revenue growth, it sends positive signals to financial markets about its expansion capability and solid base. On the other hand, when bank management does not implement efficient risk management strategies to mitigate prospective losses, the confidence of shareholders and investors in the bank shakes, leading to a collapse in value (Amimakmur et al., 2024). Despite the negative relationship between credit risk and bank value, there exists a circumstance that can transform this relationship into a positive one. This occurs when market participants view the increase in credit risk indicators, such as net charge-offs or loan loss provisions, as signals of extraordinarily expected future earnings (Calomiris & Nissim, 2014).
Ryu and Yu (2021) find that the issuance of subordinated debt decreases bank profitability in a non-linear relationship. Le and Nguyen (2020) observe that the negative effect of credit risk on bank profitability differs across banks. The more profitable a bank becomes, the more it becomes sensitive to credit risk. However, extremely profitable banks show an anomaly as they are the least sensitive institutions to credit risk. Beyond this anomaly, Li’s (2010) findings reveal a positive risk–return relationship for more profitable banks, while it remains negative for profitless banks. These results can be explained by the intuition of Jensen and Meckling (1976), which suggests that highly profitable banks have lower risk-taking incentives. Alongside profitability, Mamatzakis (2015) identifies that the relationship between credit risk and efficiency varies across quantiles. Banks incurring high expenses relative to income in upper quantiles are more exposed to the negative impacts of loan loss provisions and non-performing loans compared to those more efficient banks in lower quantiles.
Koutmos (2019) discovers that the stock returns of banks and the value premium of the Fama–French Five-Factor (FF5) model are negatively related to credit default swap spread changes across quantiles. These negative effects are stronger during periods of both low and high credit risk, compared to periods of moderate credit risk. Jareño et al. (2020) conclude that the stock returns of financial institutions are sensitive to changes in the risk factors of the FF5 model at extreme quantiles. Turning to the dynamics of risk and value, Jiang and Zhang (2017) observe that the relationship between franchise value and bank risk-taking is heterogenous across quantiles: banks in the upper quantiles of franchise value tend to be more risk-seeking because valuable banks have more ability to obtain additional funds, making them take risks on a larger scale.
H1.
The effect of credit risk on bank value varies significantly across quantiles of bank value.
2.2. Mergers and Acquisitions and Banking Valuation
Banks utilize M&A as a strategic tool to boost their capital and grow their businesses through themes of enhancing financial and operating performance (Chakraborty & Das, 2024). These improvements resulting from M&A activities in the banking industry create abnormal returns for shareholders (Krishnan & Yakimenko, 2022). Even during periods of policy uncertainty, merged banks create shareholder wealth because uncertainty enhances synergy-driven motives (Kiosses et al., 2025). However, the deviation from pursuing synergy from M&A activities destroys bank value, particularly when the purpose of engaging in such transactions stems from pre-protectionism against competitors (Hankir et al., 2011). Managers are who craft value-creating acquisitions, and their managerial biases and skewed managerial incentives can lead to a failure in realizing value from M&A activities (Sudarsanam, 2012).
The ability to linearly predict the success or failure of M&A is limited due to the complex nature of the relationship between explanatory variables and the outcomes of M&A (Lee et al., 2020). The growth opportunities for an institution post-M&A follow a non-linear pattern, specifically in the relationship with institution size (Park & Jang, 2011). There are unobserved factors that explain the variation in acquirer returns as much as the observed firm and deal characteristics combined (Golubov et al., 2015).
Alexandridis et al. (2017) highlight the importance of considering the size of acquiring institutions in understanding the dynamics of shareholder wealth creation in M&A activities, noting that for the best deals that enhance shareholder wealth (upper quantile), the size of the acquiring institution lessens the benefits brought from these deals. Bozos et al. (2013) observe that investors have a fear of large M&A deals between banks because these deals are highly susceptible to ‘black swan’ events, which leads investors to sell these stocks, putting downward pressure on stock prices. Alternatively, as DeYoung et al. (2009) suggest, the motive behind large banking M&A may not be the maximization of shareholder wealth but rather managerial ambitions to expand their personal empire or pursue growth through acquisition to attain a “too-big-to-fail” status. Fich et al. (2018) reveal that the effect of M&A activities on creating shareholder wealth differs across various quantiles of abnormal returns. Initially, they summarize findings from the existing literature that the bottom quantiles of abnormal losses are associated with large bidders or those exhibiting growth stocks. Furthermore, their findings contribute a new insight: the upper quantiles of abnormal returns can be associated with large bidders or those exhibiting growth stocks, particularly when these bidders target institutions that are relatively smaller in size. Souza and Gartner (2019) observe that at the upper quantiles of abnormal returns resulting from bank M&A, profitability plays a pivotal role in creating this wealth.
H2.
The effect of horizontal mergers and acquisitions on bank value varies significantly across quantiles of bank value.
2.3. Moderating Effect of Mergers and Acquisitions
Despite the implications of diversification in the risk–return relationship according to the portfolio theory of Markowitz (1952), and considering the co-insurance effect introduced by Lewellen (1971), which mitigates the default risk of a consolidated institution through the imperfect correlation of pre-M&A earnings, Jou et al. (2024) observe that, on average, banks become less resilient after engaging in M&A activities. The probability of default and losses during financial instability increases. Indeed, diversification reduces the probability of default. However, in the case of M&A, not all diversification enhance resiliency, and excessive diversification increases the probability of default. A greater distance and more dissimilar portfolios lead to a reduction in resiliency. Additionally, geographic diversification does not have a significant impact on resiliency. Wang (2024) observes that M&A between banks develop homogenized internal structures, thereby eliminating the potential benefits of diversification. Additionally, the researcher finds that M&A directly increase banks’ insolvency risk, and also indirectly through their interaction with diversification, because they adversely change the full picture of the risk-taking behavior of consolidated banks. Knapp and Gart (2014) explore the relationship between diversification and risk-taking behavior. They acknowledge the benefits of diversification in decreasing risk in bank M&A; however, these benefits allow banks to invest in risker loan portfolios to generate more profits and increase stock prices, eventually neutralizing the initial risk reduction.
Strong banks show increased competitive power after M&A more than weaker banks (Arbolino et al., 2024). The concentration of banking services into fewer banks due to M&A permits banks to charge higher rates on their banking services (Kobayashi & Bremer, 2022). After M&A, banks reduce their credit supply, causing an increase in borrowing costs (Na & Shimizu, 2024). While the hike in charged interest rates increases the expected returns on loans, it concurrently raises the variability of those returns (Beck et al., 2007). Despite the negative effects of M&A activities, they lead to extensive organizational changes that alter the nature of bank lending, such as replacing lenient previous management with a new, more restrictive one. Additionally, M&A can result in changes in information asymmetry and information-processing efficiency in banking operations. These activities shift the bank’s monitoring style and lead to the adoption of higher disclosure standards, which together encourage borrowers to adopt more transparent practices and voluntary disclosure (Chen et al., 2024).
Usually, following M&A activities, banks report profits that fall below the industry average. As a result, financial markets tend to respond negatively to the announcements of M&A between banks. This decline in profits is frequently attributed to mistakes in managerial decisions made during the M&A process. Such errors lead to significant problems in credit quality, which pose the primary cause for profits reduction (Knapp et al., 2005). While the chief executive officer of the acquiring bank—with high power, a dual role as board chair, significant ownership, high pay and extensive experience—reduces the bank risk profile, their prestige power increases it (Sghaier & Hamza, 2024). The credit losses experienced post M&A prevent banks from generating profits, ultimately stopping the value-creation process that is expected to result from M&A (Shirasu, 2018). Banks with a high portion of non-performing loan engage in M&A to avoid collapse (Kaur & Bala, 2024). Acquiring distressed banks negatively impacts the performance of the acquiring bank (Dinger et al., 2024).
The most interest from income and credit loss predictions is found in quantiles analysis, as it provides strong estimates (Somers & Whittaker, 2007). Explaining the link between M&A outcomes and their predictors is too complex for linear statistical approaches (Lee et al., 2020). Post bank consolidation, financial stability behaves in a non-linear fashion, supporting an inverted-U-shape relationship (Ishu & Mallik, 2024). Bank size by itself can alter the risk profile during M&A, as large banks believe that they are too big to fail; thus, they engage in riskier lending more than smaller banks. When these banks grow even larger due to M&A activities, they engage in risky lending activities even more heavily (Jou et al., 2024).
H3.
The moderating effect of horizontal mergers and acquisitions on the credit risk–bank value relationship varies significantly across quantiles of bank value.
3. Methodology
3.1. Data and Sample Description
The data for this paper were compiled on an annual basis and were obtained from several sources. M&A data, and the FR Y-9C reports, which offer consolidated financial statements, were both retrieved from the Federal Financial Institutions Examination Council (FFIEC). Market-related data were acquired from the YCharts platform. Macroeconomic data were obtained from the International Monetary Fund (IMF).
The data focus on BHCs within the U.S. banking industry. This focus is justified by the fact that the U.S. banking sector has witnessed over 10,000 M&A transactions since 1980 (Adams, 2012), making it an ideal field for M&A research. Additionally, approximately 80% of U.S. banks are part of a BHC structure, meaning that BHCs represent the banking industry in U.S. environment (Fed Partnership, 2024).
Our sample includes 110 BHCs, spanning the period from 2000 to 2022, covering 23 years. This combination of cross-sectional (BHCs) and time span (Years) data forms a panel dataset, resulting in 2530 observations.
At the end of 2000, there were 5845 active U.S. BHCs, but by the end of 2022, this number had decreased to 3713. This paper uses two specific selection criteria to construct the sample: BHCs that remained publicly traded and consistently submitted to the FR Y-9C report throughout the analysis period. Only 110 BHCs met these criteria.
The choice of the time span was driven by several reasons. First, data collection and analysis were conducted in mid-2023, meaning that the most recent available financial data at that time were from the end of 2022. Second, the rationale for this time span was based on technical considerations associated with the quantile analysis of Machado and Santos Silva (2019). In this quantile regression, estimators are biased when the number of BHCs (n) is large relative to the number of time periods (T), with a general recommendation that . For clarification, dividing 110 BHCs by 10 years (2013–2022) results in a ratio of 11, which would provide biased estimators. To avoid such bias, the maximum available time span provided by FFIEC dataset, starting from the year 2000, was selected.
3.2. Variables Description
This paper evaluates bank value through the market-to-book ratio, a metric that provides a perspective looking forward and is strongly linked with the performance of banks (Gross, 2006). It assesses credit risk using the ratio of net charge-offs, as this measurement is less sensitive to managerial discretion (Calomiris & Nissim, 2014). Adopting the approach of Deng and Elyasiani (2008), this paper defines M&A activities using a dummy variable, which is set to one for banks engaged as bidders in M&A transactions, and only for the years in which those transactions are completed. This categorical variable is treated as the moderating variable. To assess its moderating effect, it is multiplied by the net charge-offs ratio to obtain the interaction term, as Namazi and Namazi (2016) illustrate in their conceptual analysis of the moderator.
This paper includes control variables for a range of bank-specific factors. Fu et al. (2014) find that bank size affects value positively until the synergetic gains from M&A are realized. While Pástor and Pietro (2003) observe that younger institutions are valued higher for their profit potentials, Modigliani and Miller (1958) clarify that highly leveraged corporations are expected to offer higher returns due to concentrating risk into a small portion of capital. Tampakoudis et al. (2020) find that liquid banks better exploit the economic benefits of M&A activities. Asimakopoulos and Athanasoglou (2013) observe that markets react to M&A between banks depending on the expected efficiency gains from those activities. Markowitz (1952) demonstrates how diversification enhances the expected returns at a given level of risk. Avramidis et al. (2018) find that markets incorporate future growth potential in income and market share into stock prices. Fama and French (1992) demonstrate how the expected returns of securities are related to their degree of sensitivity to market movements. Aharony and Swary (1980) observe that markets strongly react to dividend announcements. Handorf (2011) finds that the tax status of banks influences their values.
In addition to controlling for bank-specific factors, this paper controls for macroeconomic conditions. Given that the data are from one country, it is adequate to incorporate just a single macroeconomic variable for capturing the variations from year to year. Demirgüç-Kunt and Huizinga (2010) totalize the overall economic conditions in the growth rate of real gross domestic product (GDP). The descriptions of the variables used in this paper, along with their symbols, formulas and sources, are presented in Table 1.
Table 1.
Variables list.
3.3. Empirical Analysis
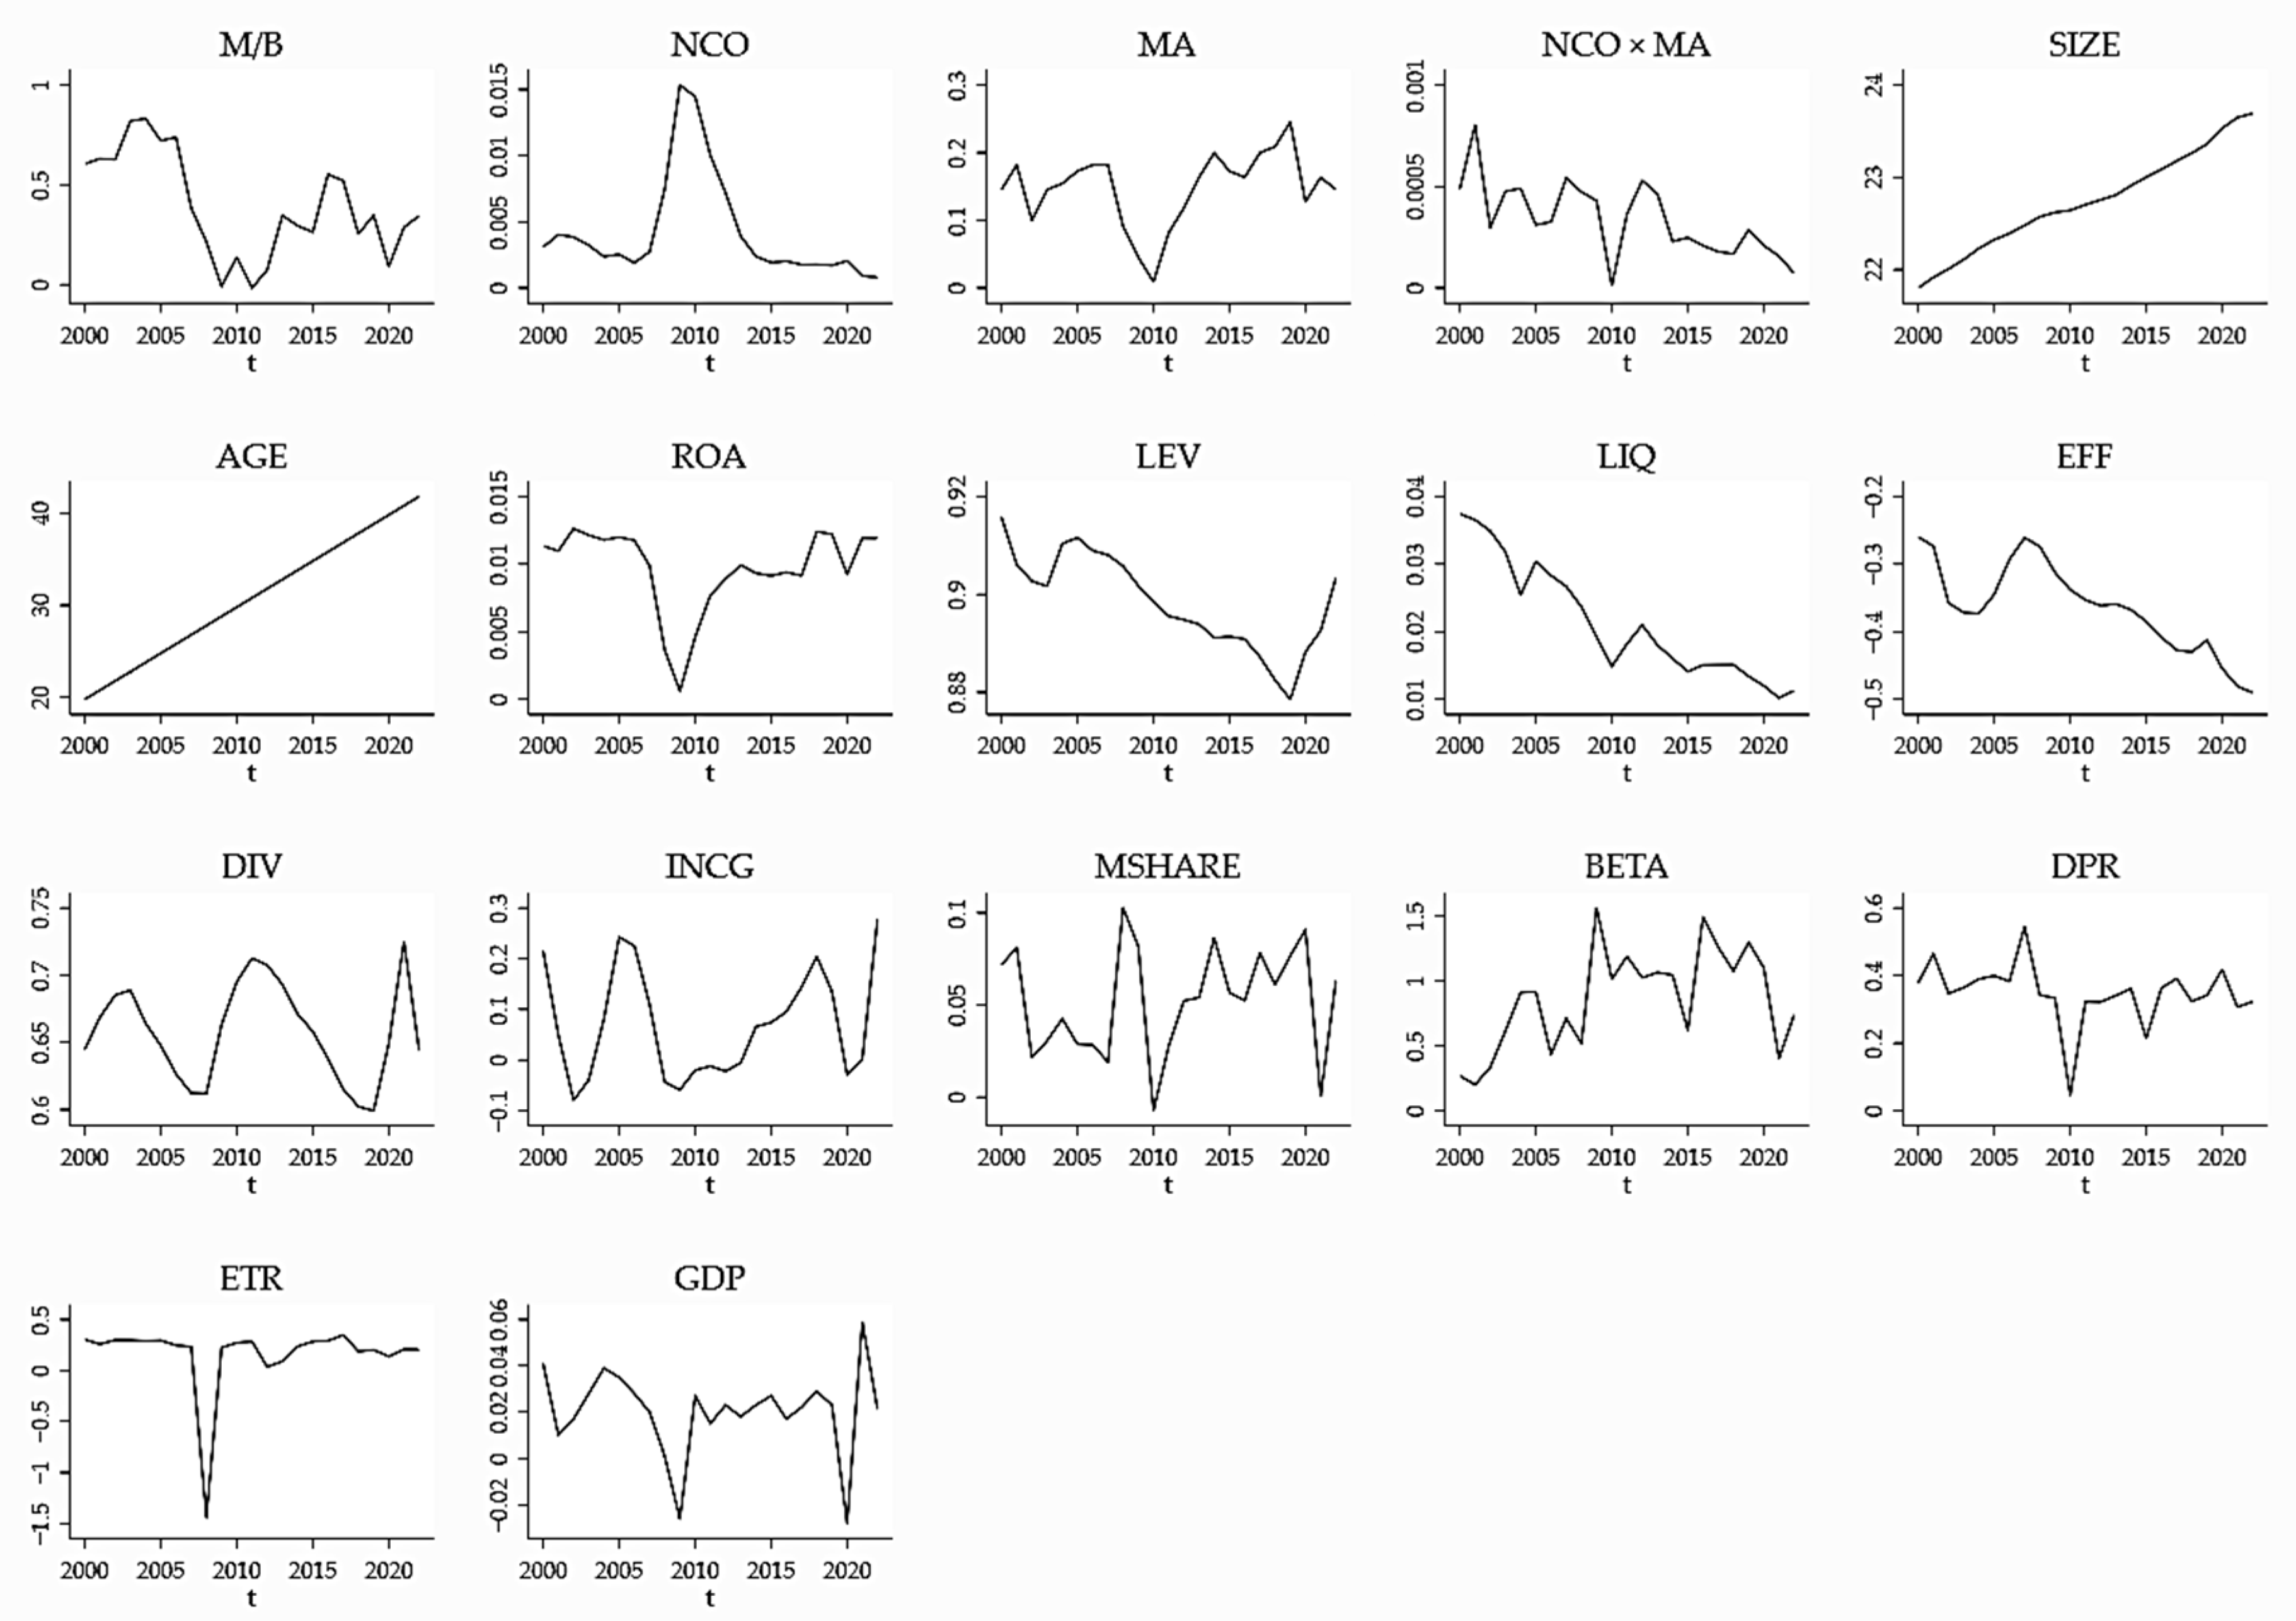
To demonstrate the statistical necessity of preferring quantile regression over classical conditional mean regression, specifically the ordinary least squares (OLS) model, this paper initially examines the residuals obtained from OLS to determine whether they adhere the Gauss theorem (Dodge, 2008), with a specific focus on the Breusch–Pagan/Cook–Weisberg test for heteroskedasticity (Cook & Weisberg, 1983), Wooldridge test for autocorrelation (Drukker, 2003), and Shapiro–Francia W’ test for normality (Royston, 1983). Additionally, the multicollinearity among variables is examined via the correlation matrix and the Variance Inflation Factor (VIF) (Belsley et al., 1980). The stationarity status of the variables is checked via the Karavias and Tzavalis (2014) (K&T) test, which is robust to non-Gaussian distributions. This stationarity test is particularly suitable when the cross-sectional dimension exceeds the time dimension, and when cross-sections are correlated. The existence of cross-sectional dependence (CD) among variables is checked via Pesaran’s CD test (Pesaran, 2021). The K&T test can accommodate for intercepts or both intercepts and linear trends; therefore, for each variable, an average line graph across all cross-sections over time is illustrated to detect linear trends (Wang et al., 2018). The K&T test allows for structural break(s); therefore, the test is performed via bootstrapping to determine the break(s), where the number of bootstrap replications is set to 200, as Efron and Tibshirani (1994) suggest this number as the minimum threshold for bootstrapping.
Koenker and Bassett (1978) introduce conditional quantile regression, which, through minimizing asymmetrically weighted absolute residuals rather than minimizing sums of squared residuals as in classical linear regression, offers estimations of a full range of conditional quantile functions beyond the conditional mean function. This approach is much more capable of providing a complete statistical analysis of the stochastic relationships between variables. Additionally, quantile regression outperforms the conditional mean function as it is robust over a wide class of non-Gaussian error distributions. By incorporating the variables of this paper into quantile regression, the model is presented in Equation (1):
where denotes the quantile distribution of the dependent variable, M/B. , , and represent the predictor, moderator, and the interaction term, respectively. comprises the matrix of controls (SIZE, AGE, ROA, LEV, LIQ, EFC, DIV, INCG, MSHARE, BETA, DPR, ETR, INF, FED). represents the sample quantile, where is a set of deciles: 0.10, 0.20, …, up to 0.90. The estimated parameters are and . While denotes the cross-sectional dimension, denotes the time dimension. is the error term.
The ninth decile regressions were estimated simultaneously to obtain the full covariance matrix of coefficients. This allowed us to test the coefficient equality across quantiles via the Wald test. In order to run simultaneous regressions, the estimation was performed via bootstrapping (Cameron & Trivedi, 2022). As Jiang and Zhang (2017), and this paper utilized the Wald test for equality of slopes testing for pairwise quantiles, and constructed a matrix of cross-pairwise quantile comparison, as in Nguyen (2020). The number of bootstrap replications was set to 200.
For quantile regression applied to longitudinal data, endogeneity is an important concern. Ignoring it will lead to an inconsistent estimation of the parameters (Koenker et al., 2017). Endogeneity often arises when there are omitted variables (Wooldridge, 2010). Incorporating individual fixed effects into the model specification mitigates the risk of omitted variable bias. This approach considers effects that are unobserved, constant over time, and specific to different individuals (Baltagi, 2021). To determine the adequacy of including these fixed effects to the model, the Wald test evaluates whether their dummy coefficients significantly differ from zero in least square dummy variable (LSDV) regression (Cameron & Trivedi, 2022).
Incorporating individual fixed effects in their dummy form into the quantile regression proposed by Koenker and Bassett (1978) is not recommended, as they cause incidental parameter bias and an inconsistent estimation of parameters. Therefore, many statistical solutions have been introduced to overcome the limitations of including fixed effects in quantile regression, such as penalizing, smoothing, and jackknifing. However, these solutions present significant implementation challenges due to their complexity (Koenker et al., 2017). Fortunately, Machado and Santos Silva (2019) introduce the Quantiles via Moments estimator (MM-QR), which combines the location and scale functions. This method identifies the same conditional quantiles as those estimated using the usual asymmetric loss function of Koenker and Bassett (1978).
The MM-QR model shows its superiority over other quantile regressions with fixed effects methods in four ways. First, it shares most robustness properties with Koenker and Bassett (1978) quantile regression, yielding the same inherently robust conditional quantile estimators. Second, it is well-suited to panel data analysis, as it allows for methods limited to conditional means regression—such as incorporating individual fixed effects—to be applied in a quantile regression framework. Third, it avoids incidental parameter bias when including fixed effects in the quantile regression model. Fourth, it is simple to implement, as it does not require additional complex techniques such as penalizing, smoothing, and jackknifing to yield consistent estimates. By incorporating the variables of this paper and the individual fixed effect into quantile regression, the MM-QR model is presented in Equation (2):
where is the distributional individual fixed effect. is a k-vector of known differentiable transformations of the components of . and are unknown parameters. All other symbols are defined as in Equation (1).
Fortunately, the MM-QR model also provides simultaneous regression via bootstrapping to obtain the entire covariance matrix of variables to test the coefficient equality across quantiles via the Wald test. The number of bootstrap replications was set to 200.
4. Empirical Results and Discussion
Table 2 summarizes the descriptive statistics for the dependent variable, independent variables, and controls. The variable M/B is expressed in logarithmic term; thus, values above zero correspond to a non-logarithmic M/B greater than one, while values below zero indicate it is less than one. Given that the average M/B is 0.39, it suggests that banks are generally valued at a premium compared to their book value. The values of standard deviation, minimum, maximum, skewness, and kurtosis for the M/B suggest a wide dispersion around the mean and the presence of outliers. The 10th percentile of the M/B is −0.09, suggesting that 10% of the bank-year observations in the panel data are valued at a discount compared to their book value. The high transition from the median to the 90th percentile indicates a substantial percentage of bank-year observations with high valuations. The average NCO is approximately zero, suggesting that banks generally incur small percentages of credit losses. However, the data reveal a dispersion around the NCO mean and highlight the presence of outliers. The upper percentile shows that at least 10% of the bank-year observations have incurred higher percentages of credit losses compared to the rest. The mean MA suggests that approximately 15% of bank-year observations involve M&A bidding activities. Given the binary nature of MA, elaborating on other descriptive statistics is not meaningful. Additionally, it makes the statistics of NCO × MA insubstantial for interpretation.
Table 2.
Descriptive statistics.
All the statistics of the controls in Table 2 reveal a highly diverse sample of banks, ranging from those with assets in hundreds of millions to those exceeding trillions of dollars, and ranging from startup to mature institutions. The sample consists of both losing and profitable banks, with reasonable to extreme levels of leverage. It features liquid and illiquid, efficient and inefficient banks, and those specialized either in interest income or fee income. Additionally, it encompasses banks with and without growth capabilities, and those that move aligned to or against the market. The sample also includes banks that pay dividends despite losses, alongside those that receive tax credits. The macroeconomic environment experiences phases of expansion and recession. Despite the diversity in the sample and the varying macroeconomic conditions, all controls exhibit skewed distributions, with a high likelihood of outliers, as indicated by the skewness, kurtosis, and percentiles statistics.
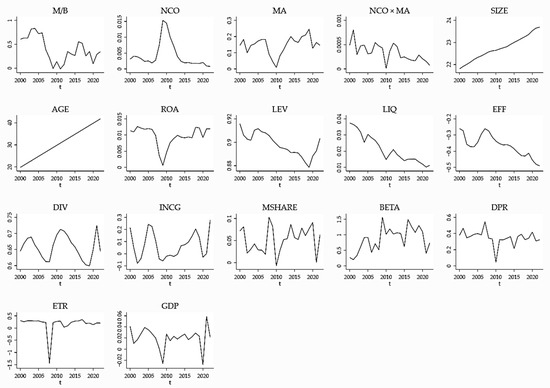
The K&T test in Table 3 demonstrates that all variables are stationary, either by controlling for CD as detailed in the same table or by including time trends in SIZE and AGE, as illustrated in Figure 1. Furthermore, Table 4 verifies that all variables are free from multicollinearity, as indicated by the absence of very strong pairwise correlations and VIF values below five. These results permit performing linear regressions as presented in Table 5.
Table 3.
Cross-sectional dependence and stationarity tests.
Figure 1.
Time trends. Source: the author.
Table 4.
Correlation matrix and VIF.
Table 5.
Linear regressions.
Table 5 presents the coefficient results of OLS regression. While NCO and MA are statistically significant, NCO × MA is insignificant. Despite these results, the residuals obtained from OLS do not adhere to the Gauss theorem. They are homoscedastic, autocorrelated, and non-normally distributed. Therefore, quantile regression is preferable over OLS regression.
Table 6 presents the quantile regression coefficients. The independent variables show limited significant coefficients. NCO is significant between p10 and p60, while MA is significant between p20 and p80. NCO × MA is only significant at p70 and p90. Furthermore, Table 7 evaluates the equality of coefficients across quantiles. Nearly half of the NCO and most of MA results are insignificant, and all NCO × MA results are insignificant.
Table 6.
Quantile regression.
Table 7.
Coefficients equality test—quantile regression.
Due to the endogeneity concerns highlighted by the LSDV results in Table 5, which show the relevance of incorporating individual fixed effects into the model, incorporating these fixed effects increased the adjusted coefficient of determination (R2) from 38.99% to 59.46%, providing a more accurate assessment of the predictors’ explanatory power on the variation in the M/B. Consequently, Table 8 re-estimates the quantile regression using the MM-QR method, which incorporates individual fixed effects.
Table 8.
Quantiles via Moments.
The results of Table 8 are partially consistent with those in Table 6. The variables NCO, MA, and NCO × MA become significant at all percentiles. The effect of NCO on the M/B is consistently negative across these percentiles. This negative impact of credit risk decreases in magnitude from the 10th percentile to the 90th percentile of bank value, suggesting a stronger detrimental effect on banks with lower valuations compared to those with higher valuations. The findings from Table 8 align with the results in Table 9, which indicate that the coefficients for NCO are not equal across different M/B percentiles. These findings strongly support H1—the effect of credit risk on bank value varies significantly across quantiles of bank value. The consistent decrease in the negative effect of credit risk, as observed ascending through bank value percentiles, can be explained through the contributions of (Fama & French, 1992, 1998). In asset-pricing models, the value premium suggests that stocks with higher valuations are less risky compared to those with lower valuations. In the banking sector, the risk–return principle exhibits an inverse shape. Investors accord higher valuations to banks with lower credit risk over those with higher credit risk (Avramov et al., 2009). This anomaly is attributed to the fact that cumulative credit losses put banks in a financial distress phase (Kanas et al., 2012). Additionally, Jensen and Meckling (1976) highlight that lower risk-taking incentives exist in highly profitable institutions. Yet, profitability stands as an important determinant in value creation for banks (Handorf, 2011).
Table 9.
Coefficients equality test—Quantiles via Moments.
The findings on MA in Table 8 are consistent with those in Table 9. Bank value is positively affected by horizontal M&A. However, the magnitude of this effect remains positive and is relatively stable across all M/B percentiles. Thus, the posed H2—the effect of horizontal mergers and acquisitions on bank value varies significantly across quantiles of bank value—cannot be supported, suggesting that the linear prediction of the success or failure of M&A is adequate as long as the Gauss theorem is not violated. The magnitude of the effect of horizontal M&A on bank value appears to be influenced by factors beyond the M/B of the acquiring banks, such as the size of acquirer. Alexandridis et al. (2017) show that the dynamics of wealth creation in M&A change based on acquirer size, with smaller banks outperforming large banks in wealth creation. This is supported by DeYoung et al. (2009), who suggest that the primary cause for large banks to engage in M&A is for building an empire, rather than wealth creation. In general, market power and operational synergies from M&A create value (Krishnan & Yakimenko, 2022); managerial biases and skewed managerial incentives demolish it (Sudarsanam, 2012). Our findings suggest that the potential advantages of horizontal M&A among banks surpass the drawbacks.
The findings of NCO × MA in Table 8 are inconsistent with those in Table 9. The moderating effect of horizontal M&A on the credit risk–bank value relationship is significant across all M/B percentiles. The interaction term shows negative signs across them all, meaning that horizontal M&A amplify the initial negative effect of credit risk on bank value across the distribution. The negative magnitude of the interaction term increases as moving from the 10th to the 90th percentile. However, Table 9 shows that variations in the interaction term’s coefficients across M/B percentiles are not sufficient to be considered statistically different from one another. Thus, the posed H3—the moderating effect of horizontal mergers and acquisitions on the credit risk–bank value relationship varies significantly across quantiles of bank value—cannot be supported. The rejection of H2 and H3 does not diminish the research contribution because H1 is accepted. The three hypotheses should be viewed together in a moderating framework. The variation in the effect of NCO on the M/B across quantiles indicates that the credit risk–bank value relationship is not uniform across different bank value levels. Therefore, even if the effects of MA and NCOMA on the M/B are stable, the inclusion of NCO necessitates analyzing these effects across the quantiles of M/B. Furthermore, the non-Gaussian nature of the error term distribution, along with evidence of heteroskedasticity, autocorrelation, and fixed effects, justifies the use of Quantiles via Moments in this study. Given the lack of significant heterogeneity in the slopes of the moderator and the interaction term, and assuming the Gauss theorem holds, examining the posed H3 in a quantile regression method is deemed more superior than linear methods due to the strong slope heterogeneity exhibited by the NCO. Yet, the findings imply that while horizontal M&A events by themselves enhance bank value, they diminish value when interacting with credit risk. The theoretical benefits of diversification and co-insurance effect, as outlined in (Lewellen, 1971; Markowitz, 1952), appear to be either absent in M&A among banks or, if present, exert a limited influence. Horizontal M&A either develop homogenized internal structures, eliminating potential diversification benefits (Wang, 2024), or they generate diversification advantages that are subsequently offset by exploiting them to increase the riskiness of the loan portfolio post-M&A, aiming to generate higher returns and boost stock prices (Knapp & Gart, 2014). However, this risky portfolio escalates credit losses, restricting profit making and impeding value creation (Shirasu, 2018). Markets evaluate banks differently than other institutions, and they favor soundness over risk (Avramov et al., 2009); thus, when M&A between banks lead to credit quality issues, markets react negatively and strongly (Knapp et al., 2005).
The robustness of our MM-QR results is validated through a series of multiple checks: variables validity, conditional quantile validity, fixed effects validity, bootstrapping, and consistency validity. First, we confirm that the variables are free of multicollinearity and unit root issues, as addressed in Table 3 and Table 4 and Figure 1, using correlation matrix and VIF (Belsley et al., 1980), Pesaran’s CD test (Pesaran, 2021), average line graphs (Wang et al., 2018), and the K&T test (Karavias & Tzavalis, 2014). Second, we illustrate that the conditional quantile regression of Koenker and Bassett (1978) outperforms conditional mean regression by effectively handling the non-Gaussian residuals (Royston, 1983), heteroskedasticity (Cook & Weisberg, 1983), and autocorrelation (Drukker, 2003) in OLS and LSDV regressions, as presented in Table 5. Third, using the Wald test (F-Statistic), we reveal in Table 5 the necessity of including individual fixed effects in the conditional quantile regression to avoid issues in endogeneity and omitted variable bias. As such, necessity cannot be directly implemented in the Koenker and Bassett (1978) model due to incidental parameter bias (Koenker et al., 2017). Therefore, we introduce the MM-QR of Machado and Santos Silva (2019), which can include individual fixed effects in the quantile regression model without such bias. Fourth, all results presented in Table 6 and Table 8 are derived via bootstrapping, ensuring robust estimates (Efron & Tibshirani, 1994). Furthermore, the partial consistency of the MM-QR results in Table 8 with those from the Koenker and Bassett (1978) quantile regression in Table 6, as well as the OLS and LSDV results in Table 5, and with similar outcomes of hypotheses testing using the Wald test in Table 7 and Table 9, further validate the robustness of our results.
Finally, Table 8 reveals several statistically significant coefficients for control variables across all bank value percentiles. Although the equality of coefficients of these controls is not tested, it can be considered that there are initial relationships that need to be further examined. While AGE has an increased negative effect, EFF has a diminished negative impact. The static negative influence of both variables is aligned with Pástor and Pietro (2003), as investors value younger institutions higher due to their growth potential, and Asimakopoulos and Athanasoglou (2013), as markets react to expected efficiency gains from M&A activities. LEV, INCG, and GDP all have an increasing positive effect. The static impact of these variables is aligned with Modigliani and Miller (1958), as highly leveraged institutions are expected to yield higher returns; Avramidis et al. (2018), as markets incorporate the growth potential into stock valuations; and Teixeira et al. (2014), as banking activity correlates with the expansionary phase of the economy.
5. Conclusions
This paper aims to evaluate the moderating effect of horizontal mergers and acquisitions (M&A) on the relationship between credit risk and bank value across different quantiles of bank value. Furthermore, it investigates how credit risk and horizontal M&A influence bank value within these same quantiles. The most interest in predicting credit risk lies within quantiles, owing to non-linear processes and deviations from the Gauss theorem. Furthermore, the complex nature of M&A limits the ability to predict their outcomes linearly. To our knowledge, the existing literature has not provided an explanation of the credit risk and bank value relationship in the context of horizontal M&A that accounts for the potential non-linear behavior and the variability across different quantiles of bank value. This research bridges this gap, adopting a distinctive approach that utilizes the revolutionary Quantiles via Moments estimator to address endogeneity concerns, ensuring the robustness of our findings. Consequently, this study contributes to the academic field by revealing the non-linear dynamics of how credit risk and bank value interrelate under the conditions of horizontal M&A.
The findings indicate a significant variation in the effect of credit risk on bank value across the entire distribution of bank value. However, the results fail to provide statistical evidence to support a significant variation in the effect of horizontal M&A on bank value, as well as in their moderating effect on the relationship between credit risk and bank value, across the entire distribution of bank value. Given the significant non-linear behavior in the credit risk–bank value relationship, evaluating it within the scope of horizontal M&A using quantile analysis enhances the precision and accuracy for decision making. This remains valid despite the linear nature of M&A’s direct and moderating effects, as well as deviations from the Gauss theorem. The effect of credit risk on bank value is negative and becomes less pronounced for higher-valued banks; meanwhile, although the direct effect of horizontal M&A on bank value is positive, their moderating effect is negative, providing valuable implications for investors, practitioners, and policymakers.
Investors should assess the risk profile and value proposition of a bank before making investment decisions in banking stocks. They can include credit risk as a dynamic asset-pricing factor that rewards more for value stocks than growth stocks. Similarly, in horizontal M&A, they should consider credit risk as a dynamic pricing determinant for deal offers that potentially reduces the bidding offer and lowers it further for low-valued targets. Additionally, investors in banking stocks should diversify their portfolio not just across different banks but also across banks positioned at different quantiles of value to mitigates risks associated with fluctuations in bank value relative to credit risk.
For practitioners, it is crucial to integrate credit risk management along with bank value proposition. If their banks are valued lower, they should adopt a more stringent strategy to mitigate credit risk. Similarly, when incorporating horizontal M&A into their strategic growth plans, they should also be more stringent in mitigating credit risk.
Policymakers should acknowledge the varying effect of credit risk on bank value across different thresholds of value. It is advisable to implement a dynamic regulatory framework for the permissible percentage of exposure to credit risk in banks based on their value proposition. They should foster healthy M&A between banks as long as they do not compromise financial stability. It is advisable to establish capital buffers for horizontal M&A in the banking sector, designed to safeguard against both foreseen and unforeseen credit risk that may emerge after M&A. These buffers should be calibrated according to credit risk and bank value parameters.
This paper has two limitations that prevent the generalization of its results. First, due to the challenge of accessing data from banking sectors outside the U.S., the sample is limited to U.S. banks; thus, our findings may not be applicable to different jurisdictions. Second, given the complexities involved in applying non-market-based valuation techniques, the sample is limited to publicly traded banks; thus, our results may not extend to privately held banks. Hence, future researchers could broaden the scope of this study by considering banks on a global scale, incorporating non-listed banks, or undertaking both approaches.
Author Contributions
Conceptualization, R.J. and A.T.; methodology, R.J. and A.T.; software, R.J. and A.T.; validation, R.J. and A.T.; formal analysis, R.J. and A.T.; investigation, R.J., A.T. and A.P.; resources, R.J. and A.T.; data curation, R.J. and A.T.; writing—original draft preparation, R.J. and A.T.; writing—review and editing, R.J., A.T. and A.P.; visualization, R.J. and A.T.; supervision, R.J.; project administration, R.J. and A.T. All authors have read and agreed to the published version of the manuscript.
Funding
This research received no external funding.
Institutional Review Board Statement
Not applicable.
Informed Consent Statement
Not applicable.
Data Availability Statement
Dataset available on request from the authors.
Conflicts of Interest
The authors declare no conflict of interest.
References
- Adams, R. M. (2012). Consolidation and merger activity in the United States banking industry from 2000 through 2010. Division of Research and Statistics, Board of Governors of the Federal Reserve System. Available online: https://www.federalreserve.gov/pubs/feds/2012/201251/201251pap.pdf (accessed on 13 June 2023).
- Aharony, J., & Swary, I. (1980). Quarterly dividend and earnings announcements and stockholders’ returns: An empirical analysis. The Journal of Finance, 35(1), 1–12. [Google Scholar] [CrossRef]
- Alexandridis, G., Antypas, N., & Travlos, N. (2017). Value creation from M&As: New evidence. Journal of Corporate Finance, 45, 632–650. [Google Scholar] [CrossRef]
- Amimakmur, S. A., Saifi, M., Damayanti, C. R., & Hutahayan, B. (2024). Assessing the moderating effect of IT innovation on the interplay among company size, financial performance, and company value. Journal of Open Innovation: Technology, Market, and Complexity, 10(3), 100318. [Google Scholar] [CrossRef]
- Arbolino, R., Boffardi, R., Kounetas, K., Marani, U., & Napolitano, O. (2024). Are there conditions that can predict when an m&a works? The case of italian listed banks. Economies, 12(3), 58. [Google Scholar] [CrossRef]
- Asimakopoulos, I., & Athanasoglou, P. P. (2013). Revisiting the merger and acquisition performance of European banks. International Review of Financial Analysis, 29, 237–249. [Google Scholar] [CrossRef]
- Avramidis, P., Cabolis, C., & Serfes, K. (2018). Bank size and market value: The role of direct monitoring and delegation costs. Journal of Banking & Finance, 93, 127–138. [Google Scholar] [CrossRef]
- Avramov, D., Chordia, T., Jostova, G., & Philipov, A. (2009). Credit ratings and the cross-section of stock returns. Journal of Financial Markets, 12(3), 469–499. [Google Scholar] [CrossRef]
- Baele, L., De Jonghe, O., & Vander Vennet, R. (2007). Does the stock market value bank diversification? Journal of Banking & Finance, 31(7), 1999–2023. [Google Scholar] [CrossRef]
- Baltagi, B. H. (2021). Introduction. In B. H. Baltagi (Ed.), Econometric analysis of panel data (pp. 1–14). Springer International Publishing. [Google Scholar] [CrossRef]
- Beck, T., Demirgüç-Kunt, A., & Levine, R. (2007). 193Bank concentration and fragility: Impact and mechanics. In The risks of financial institutions. University of Chicago Press. [Google Scholar] [CrossRef]
- Belsley, D. A., Kuh, E., & Welsch, R. E. (1980). Detecting and assessing collinearity. In Regression diagnostics (pp. 85–191). John Wiley & Sons, Inc. [Google Scholar] [CrossRef]
- Bozos, K., Koutmos, D., & Song, W. (2013). Beta risk and price synchronicity of bank acquirers’ common stock following merger announcements. Journal of International Financial Markets, Institutions and Money, 27, 47–58. [Google Scholar] [CrossRef]
- Calomiris, C. W., & Nissim, D. (2014). Crisis-related shifts in the market valuation of banking activities. Journal of Financial Intermediation, 23(3), 400–435. [Google Scholar] [CrossRef]
- Cameron, A. C., & Trivedi, P. K. (2022). Microeconometrics using stata, second edition, volume I: Cross-sectional and panel regression models (Vol. 1). Stata Press. Available online: https://www.routledge.com/Microeconometrics-Using-Stata-Second-Edition-Volumes-I-and-II/Cameron-Trivedi/p/book/9781597183598 (accessed on 7 April 2023).
- Chakraborty, B., & Das, A. K. (2024). Mergers and acquisitions in the banking sector: A systematic literature review. Vision. [Google Scholar] [CrossRef]
- Chen, J., Mishra, T., Song, W., Zhang, Q., & Zhang, Z. (2024). The impact of bank mergers on corporate tax aggressiveness. Journal of Corporate Finance, 84, 102540. [Google Scholar] [CrossRef]
- Chen, R.-R., & Kuei, C.-H. (2024). How well do banks manage their credit risk? A Data Envelopment Analysis (DEA) approach. In C.-F. Lee, & M.-T. Yu (Eds.), Advances in pacific basin business, economics and finance (Vol. 12, pp. 125–163). Emerald Publishing Limited. [Google Scholar] [CrossRef]
- Cobbinah, B. B., Yang, W., Sarpong, F. A., & Nyantakyi, G. (2024). From risk to reward: Unveiling the multidimensional impact of financial risks on the performance of Ghanaian banks. Heliyon, 10(23), e40777. [Google Scholar] [CrossRef] [PubMed]
- Cook, R. D., & Weisberg, S. (1983). Diagnostics for heteroscedasticity in regression. Biometrika, 70(1), 1–10. [Google Scholar] [CrossRef]
- Cunningham, E., Tokdar, S. T., & Clark, J. S. (2020). Chapter 2—A vignette on model-based quantile regression: Analysing excess zero response. In Y. Fan, D. Nott, M. S. Smith, & J.-L. Dortet-Bernadet (Eds.), Flexible bayesian regression modelling (pp. 27–64). Academic Press. [Google Scholar] [CrossRef]
- Demirgüç-Kunt, A., & Huizinga, H. (2010). Bank activity and funding strategies: The impact on risk and returns. Journal of Financial Economics, 98(3), 626–650. [Google Scholar] [CrossRef]
- Deng, S., & Elyasiani, E. (2008). Geographic diversification, bank holding company value, and risk. Journal of Money, Credit and Banking, 40(6), 1217–1238. [Google Scholar] [CrossRef]
- DeYoung, R., Evanoff, D. D., & Molyneux, P. (2009). Mergers and acquisitions of financial institutions: A review of the post-2000 literature. Journal of Financial Services Research, 36(2), 87–110. [Google Scholar] [CrossRef]
- Dinger, V., Schmidt, C., & Theissen, E. (2024). The real effects of distressed bank mergers. Journal of Corporate Finance, 89, 102674. [Google Scholar] [CrossRef]
- Dodge, Y. (2008). Gauss–Markov theorem. In The concise encyclopedia of statistics (pp. 217–218). Springer. [Google Scholar] [CrossRef]
- Drukker, D. M. (2003). Testing for serial correlation in linear panel-data models. The Stata Journal, 3(2), 168–177. [Google Scholar] [CrossRef]
- Efron, B., & Tibshirani, R. J. (1994). Appendix: Software for bootstrap computations. In B. Efron, & R. J. Tibshirani (Eds.), An introduction to the bootstrap (pp. 398–412). Chapman and Hall/CRC. [Google Scholar] [CrossRef]
- Fama, E. F., & French, K. R. (1992). The cross-section of expected stock returns. The Journal of Finance, 47(2), 427–465. [Google Scholar] [CrossRef]
- Fama, E. F., & French, K. R. (1998). Value versus growth: The international evidence. The Journal of Finance, 53(6), 1975–1999. [Google Scholar] [CrossRef]
- Fed Partnership. (2024). Bank holding companies. Available online: https://www.fedpartnership.gov/bank-life-cycle/manage-transition/bank-holding-companies (accessed on 30 December 2024).
- Fich, E. M., Nguyen, T., & Officer, M. (2018). Large wealth creation in mergers and acquisitions. Financial Management, 47(4), 953–991. [Google Scholar] [CrossRef]
- Fu, X., Lin, Y., & Molyneux, P. (2014). Bank efficiency and shareholder value in Asia Pacific. Journal of International Financial Markets, Institutions and Money, 33, 200–222. [Google Scholar] [CrossRef]
- Golubov, A., Yawson, A., & Zhang, H. (2015). Extraordinary acquirers. Journal of Financial Economics, 116(2), 314–330. [Google Scholar] [CrossRef]
- Gross, S. (2006). How to measure the shareholder value of banks? In Banks and shareholder value: An overview of bank valuation and empirical evidence on shareholder value for banks (pp. 9–99). DUV. [Google Scholar] [CrossRef]
- Handorf, W. C. (2011). Capital management and bank value. Journal of Banking Regulation, 12(4), 331–341. [Google Scholar] [CrossRef]
- Hankir, Y., Rauch, C., & Umber, M. P. (2011). Bank M&A: A market power story? Journal of Banking & Finance, 35(9), 2341–2354. [Google Scholar] [CrossRef]
- Hassan, M., & Giouvris, E. (2020). Financial institutions mergers: A strategy choice of wealth maximisation and economic value. Journal of Financial Economic Policy, 12(4), 495–529. [Google Scholar] [CrossRef]
- Ishu, N. S., & Mallik, N. S. (2024). Bank competition and financial stability relationship in India: Post-bank consolidation analysis. Global Business Review. [Google Scholar] [CrossRef]
- Jareño, F., González, M. d. l. O., & Escolástico, A. M. (2020). Extension of the Fama and French model: A study of the largest European financial institutions. International Economics, 164, 115–139. [Google Scholar] [CrossRef]
- Jensen, M. C., & Meckling, W. H. (1976). Theory of the firm: Managerial behavior, agency costs and ownership structure. Journal of Financial Economics, 3(4), 305–360. [Google Scholar] [CrossRef]
- Jiang, H., & Zhang, J. (2017). Bank capital buffer, franchise value, and risk heterogeneity in China. Research in International Business and Finance, 42, 1455–1466. [Google Scholar] [CrossRef]
- Jou, J., Wang, T., & Zhang, J. (2024). Are bank mergers bad for financial stability? Board of Governors of the Federal Reserve System and the United States Government. Available online: https://www.fdic.gov/system/files/2024-09/jou-paper-9324.pdf (accessed on 27 December 2024).
- Kanas, A., Vasiliou, D., & Eriotis, N. (2012). Revisiting bank profitability: A semi-parametric approach. Journal of International Financial Markets, Institutions and Money, 22(4), 990–1005. [Google Scholar] [CrossRef]
- Karavias, Y., & Tzavalis, E. (2014). Testing for unit roots in short panels allowing for a structural break. Computational Statistics & Data Analysis, 76, 391–407. [Google Scholar] [CrossRef]
- Kaur, G., & Bala, A. (2024). Merger as an only rescue/choice: Lessons from a public sector bank of India. Journal of Banking Regulation, 25(2), 95–111. [Google Scholar] [CrossRef]
- Kiosses, N., Leventis, S., Subeniotis, D., & Tampakoudis, I. (2025). The impact of policy uncertainty on shareholder wealth: Evidence from bank M&A. Journal of Financial Stability, 76, 101361. [Google Scholar] [CrossRef]
- Knapp, M., & Gart, A. (2014). Post-merger changes in bank credit risk: 1991–2006. Managerial Finance, 40(1), 51–71. [Google Scholar] [CrossRef]
- Knapp, M., Gart, A., & Becher, D. (2005). Post-merger performance of bank holding companies, 1987–1998. Financial Review, 40(4), 549–574. [Google Scholar] [CrossRef]
- Kobayashi, A., & Bremer, M. (2022). Lessons from mergers and acquisitions of regional banks in Japan: What does the stock market think? Journal of the Japanese and International Economies, 64, 101202. [Google Scholar] [CrossRef]
- Koenker, R., & Bassett, G. (1978). Regression quantiles. Econometrica, 46(1), 33–50. [Google Scholar] [CrossRef]
- Koenker, R., Chernozhukov, V., He, X., & Peng, L. (2017). Quantile regression methods for longitudinal data. In Handbook of quantile regression (pp. 363–380). Chapman and Hall/CRC. [Google Scholar] [CrossRef]
- Koutmos, D. (2019). Asset pricing factors and bank CDS spreads. Journal of International Financial Markets, Institutions and Money, 58, 19–41. [Google Scholar] [CrossRef]
- Krishnan, C. N. V., & Yakimenko, V. (2022). Market misreaction? Leverage and mergers and acquisitions. Journal of Risk and Financial Management, 15(3), 144. [Google Scholar] [CrossRef]
- Le, T. D. Q., & Nguyen, D. T. (2020). Capital structure and bank profitability in vietnam: A quantile regression approach. Journal of Risk and Financial Management, 13(8), 168. [Google Scholar] [CrossRef]
- Lee, K., Joo, S., Baik, H., Han, S., & In, J. (2020). Unbalanced data, type II error, and nonlinearity in predicting M&A failure. Journal of Business Research, 109, 271–287. [Google Scholar] [CrossRef]
- Lewellen, W. G. (1971). A pure financial rationale for the conglomerate merger. The Journal of Finance, 26(2), 521–537. [Google Scholar] [CrossRef]
- Li, M.-Y. L. (2010). Re-examining the risk–return relationship in banks using quantile regression. The Service Industries Journal, 30(11), 1871–1881. [Google Scholar] [CrossRef]
- Machado, J. A. F., & Santos Silva, J. M. C. (2019). Quantiles via moments. Journal of Econometrics, 213(1), 145–173. [Google Scholar] [CrossRef]
- Mamatzakis, E. (2015). Risk and efficiency in the Central and Eastern European banking industry under quantile analysis. Quantitative Finance, 15(3), 553–567. [Google Scholar] [CrossRef]
- Markowitz, H. (1952). Portfolio selection. The Journal of Finance, 7(1), 77–91. [Google Scholar] [CrossRef]
- Modigliani, F., & Miller, M. H. (1958). The cost of capital, corporation finance and the theory of investment. The American Economic Review, 48(3), 261–297. Available online: http://www.jstor.org/stable/1809766 (accessed on 25 March 2023).
- Montgomery, H., & Takahashi, Y. (2014). Chapter 5—The Effect of bank mergers on shareholder value and performance in Japan. In G. N. Gregoriou, & D. L. K. Chuen (Eds.), Handbook of Asian finance (pp. 77–103). Academic Press. [Google Scholar] [CrossRef]
- Na, B., & Shimizu, K. (2024). Working capital management and bank mergers. Journal of Risk and Financial Management, 17(5), 213. [Google Scholar] [CrossRef]
- Namazi, M., & Namazi, N.-R. (2016). Conceptual analysis of moderator and mediator variables in business research. Procedia Economics and Finance, 36, 540–554. [Google Scholar] [CrossRef]
- Nguyen, Q. K. (2020). Ownership structure and bank risk-taking in ASEAN countries: A quantile regression approach. Cogent Economics & Finance, 8(1), 1809789. [Google Scholar] [CrossRef]
- Park, K., & Jang, S. (2011). Mergers and acquisitions and firm growth: Investigating restaurant firms. International Journal of Hospitality Management, 30(1), 141–149. [Google Scholar] [CrossRef]
- Pástor, Ľ., & Pietro, V. (2003). Stock valuation and learning about profitability. The Journal of Finance, 58(5), 1749–1789. [Google Scholar] [CrossRef]
- Pesaran, M. H. (2021). General diagnostic tests for cross-sectional dependence in panels. Empirical Economics, 60(1), 13–50. [Google Scholar] [CrossRef]
- Pop, A., & Pop, D. (2024). Is the market tougher with riskier banks? Evidence from the pricing of bank debt securities during a financial turmoil episode. Journal of Economics and Business. [Google Scholar] [CrossRef]
- Rose, P. S. (1987). The impact of mergers in banking: Evidence from a nationwide sample of federally chartered banks. Journal of Economics and Business, 39(4), 289–312. [Google Scholar] [CrossRef]
- Royston, J. P. (1983). A simple method for evaluating the Shapiro-Francia W’ test of non-normality. Journal of the Royal Statistical Society. Series D (The Statistician), 32(3), 297–300. [Google Scholar] [CrossRef]
- Ryu, D., & Yu, J. (2021). Nonlinear effect of subordinated debt changes on bank performance. Finance Research Letters, 38, 101496. [Google Scholar] [CrossRef]
- Sghaier, A., & Hamza, T. (2024). CEO power and risk taking: Evidence from European banks mergers and acquisitions. Journal of Strategy and Management, 17(4), 655–687. [Google Scholar] [CrossRef]
- Shirasu, Y. (2018). Long-term strategic effects of mergers and acquisitions in Asia-Pacific banks. Finance Research Letters, 24, 73–80. [Google Scholar] [CrossRef]
- Simoens, M., & Vennet, R. V. (2021). Bank performance in Europe and the US: A divergence in market-to-book ratios. Finance Research Letters, 40, 101672. [Google Scholar] [CrossRef]
- Somers, M., & Whittaker, J. (2007). Quantile regression for modelling distributions of profit and loss. European Journal of Operational Research, 183(3), 1477–1487. [Google Scholar] [CrossRef]
- Souza, J. G. d. M., & Gartner, I. R. (2019). Market reaction to bank merger and acquisition events in Brazil: An analysis of the effects of market waves. Revista Contabilidade & Finanças, 30, 234–251. [Google Scholar] [CrossRef]
- Statista. (2024). Number of merger and acquisitions deals in the banking sector worldwide from 1985 to April 2024. Available online: https://www.statista.com/statistics/1082488 (accessed on 30 December 2024).
- Sudarsanam, S. (2012). Value creation and value appropriation in m&a deals. In D. Faulkner, S. Teerikangas, & R. J. Joseph (Eds.), The handbook of mergers and acquisitions (pp. 195–253). Oxford University Press. [Google Scholar] [CrossRef]
- Takahashi, F. L., & Vasconcelos, M. R. (2024). Bank efficiency and undesirable output: An analysis of non-performing loans in the Brazilian banking sector. Finance Research Letters, 59, 104651. [Google Scholar] [CrossRef]
- Tampakoudis, I., Nerantzidis, M., Subeniotis, D., Soutsas, A., & Kiosses, N. (2020). Bank mergers and acquisitions in Greece: The financial crisis and its effect on shareholder wealth. International Journal of Managerial Finance, 16(2), 273–296. [Google Scholar] [CrossRef]
- Teixeira, J. C. A., Silva, F. J. F., Fernandes, A. V., & Alves, A. C. G. (2014). Banks’ capital, regulation and the financial crisis. The North American Journal of Economics and Finance, 28, 33–58. [Google Scholar] [CrossRef]
- Wang, L. (2024). The effect of mergers and acquisitions on bank risk-taking. Journal of Financial Management, Markets and Institutions, 12(01), 2350007. [Google Scholar] [CrossRef]
- Wang, X., Wei, Y., Wang, L., & Wang, S. (2024). An extended event study methodology and its application in the HNA group’s overseas market contraction. Journal of Asian Economics, 94, 101783. [Google Scholar] [CrossRef]
- Wang, Y., Han, F., Zhu, L., Deussen, O., & Chen, B. (2018). Line graph or scatter plot? automatic selection of methods for visualizing trends in time series. IEEE Transactions on Visualization and Computer Graphics, 24(2), 1141–1154. [Google Scholar] [CrossRef]
- Wooldridge, J. M. (2010). Single-equation linear model and OLS estimation. In Econometric analysis of cross section and panel data (pp. 53–87). MIT Press. Available online: https://mitpress.mit.edu/9780262232586/econometric-analysis-of-cross-section-and-panel-data/ (accessed on 7 April 2023).

Disclaimer/Publisher’s Note: The statements, opinions and data contained in all publications are solely those of the individual author(s) and contributor(s) and not of MDPI and/or the editor(s). MDPI and/or the editor(s) disclaim responsibility for any injury to people or property resulting from any ideas, methods, instructions or products referred to in the content. |
© 2025 by the authors. Licensee MDPI, Basel, Switzerland. This article is an open access article distributed under the terms and conditions of the Creative Commons Attribution (CC BY) license (https://creativecommons.org/licenses/by/4.0/).