Abstract
Microplastics (MPs) have been detected in aquatic environments worldwide; however, freshwater systems remain underexplored. MPs’ presence has not been reported yet in the Río Bravo/Grande at the Mexico–United States border. In 2022 and 2023, water (30 L) and sediment (~500 g) samples were collected at the river along the El Paso (U.S.)–Juárez (Mexico) municipalities. Water and sediment were digested using H2O2 or NaOH to isolate (CaCl2), dye (Nile Red), quantify, and classify MPs by fluorescence microscopy. The number of microparticles detected in water and sediment ranged from 0.4 to 17 particles/L and 2.8 × 10³–1.0 × 10⁴ particles/kg, respectively. Similar concentrations of microparticles were estimated in water among sampled sites (ANOVA) in 2022 (p = 0.432, α = 0.05) and 2023 (p = 0.255, α = 0.05), but there were differences in sediments (2022, p < 0.01; 2023, p = 0.032. α = 0.05). Fibres, fragments, and films, with sizes ranging from 12.62 to 4282.25 µm, were found in the samples. Fibres were the most abundant shape in water (71.94%) and sediments (91.07%). MP concentrations varied in water and sediments in both years. The data generated by this study provide new insights into feasible methods for MP detection and its presence in the Río Bravo/Grande.
1. Introduction
The widespread use and improper disposal of single-use plastics has increased the amount of plastic litter in the environment [1]. In 2022, about 200 metric tons of plastic ended up in landfills or the environment [2,3]. As they are disposed of inappropriately, plastics reach not only terrestrial environments, but also rivers and, eventually, the ocean [4,5].
In the environment, plastics break down by weathering into smaller particles (<5 mm) known as microplastics (MPs). According to Sarkar et al. (2021; [4]), the mismanagement of plastic waste leads to the accumulation of MPs in the environment. These particles have been detected in soil [6] air, freshwater systems [7], oceans [8], and even in remote places such as the Antarctic [9], as well as in organisms [10] all over the world. MPs can be transported between environmental compartments [11] and may enter the food chain; wind may deposit MPs over plants and other surfaces (including soil); urban water runoff may introduce MPs to aquatic and other terrestrial systems; and animals, such as birds, may transport them from site to site [12]. Studies have shown that microplastics have detrimental effects on organisms such as fish [13] and rotifers [14]. Furthermore, wild organisms in the aquatic food web (from zooplankton up to marine mammals) ingest and accumulate these particles [15,16,17,18], increasing the importance of studying MPs in the environment.
Even if microplastics are ubiquitous, microplastics research has mainly focused on marine environments, as indicated in a 2018 review by Blettler and collaborators [19]; they found 440 papers related to marine environments, and 106 on freshwater systems, from which 71 of the studies refer to North America. In contrast, six studies were from Mexican aquatic systems. Up to 2022, only one study on microplastics from a Mexican freshwater system had been reported [20]; more studies on MPs in freshwater systems (Lago de Cuitzeo y Pátzcuaro, Valle de Bravo reservoir [Cutzamala River system], and Río Tijuana [binational river]) have been published since [15,21,22].
The Río Bravo/Grande, a natural border between Mexico and the United States, flows through agricultural, residential, and industrial zones, providing water for fishing, agriculture, drinking, and energy production from its headwaters in Colorado (U.S.A.) to the Gulf of Mexico (3034 km). The climate, in the Ciudad Juárez–El Paso region, is semi-arid with extreme temperature variations throughout the year (<27 to 46 °C; temperature may vary within 10 to 20 °C during the day). Annual precipitation yields around 220 to 266.7 mm. The rainy season is from June to September (summer), but extreme rain events occasionally occur, flooding the city. Runoff from different city areas is discharged in arroyos connected to the Río Bravo/Grande or directly into it. Additionally, dust and sandstorms are frequent in this region, which can contribute to microplastics’ dispersion. Dust and sandstorms are more common from March to May [23,24].
Despite the Río Bravo/Grande’s political, economic, and ecological importance (it has been proclaimed as a natural monument by the Secretaría de Medio Ambiente y Recursos Naturales “SEMARNAT”), to date there are no published scientific articles about MP detection along this river basin, even though microplastics have been found in the air in this region: up to 474.38 particles/m2/day were detected in Ciudad Juárez’s air in 2021 [25].
This work aims to detect the presence of microplastics in a river managed by two countries in the Ciudad Juarez (Mexico)–El Paso (U.S.) region, for ecotoxicological and policy regulation purposes, among others. Data from this research will provide environmentally relevant concentrations of these particles in water and sediment from the Río Bravo/Grande.
2. Materials and Methods
2.1. Sample Collection
Six sampling sites were selected at the Río Bravo/Grande along the El Paso and Juarez municipalities and surroundings: Borderland (2022, 31°53.157′ N 106°35.954′ W), Casa de Adobe (2022, 31°47.019′ N 106°31.701′ W), Parque de Las Tortugas (2023, 31°45.432′ N, 106°30.068′ W), Del Rio (2023, 31°42′42.42″ N 106°22′18.18″ W), Altozano (2023, 31°39′38.22″ N 106°19′54.78″ W), and Guadalupe (2022, 31°08.467′ N 105°43.021′ W) (Figure 1). The samples were collected during the summer–fall of 2022 and 2023, when the international floodgates that allow the water to flow to the rest of the Río Bravo/Grande were open. At each site, a 21 m long section was divided into three subsections of 7 m to define grids (nine grids total). Three grids per site were randomly selected to collect water and sediment samples in triplicate. Water was collected by concentrating 10 L of water through a 64 µm plankton net in a one-litre jar per sampled grid. Sediments were collected using a Van Veen sampler from five points inside the same three grids as for water sampling, and mixed into a composite sample [26]. For accessibility reasons, sediments from Borderland could not be sampled. Two more series of samples were obtained from Casa de Adobe in 2023 and 2024 to assess the MPs’ concentration variation in the same site between 2022 and 2024. A field blank was prepared with distilled water for each sample. The samples were transported to the laboratory on ice and stored at 4 °C until further processing. Data on river flow and depth were obtained from the International Boundary and Water Commission (IBWC) database [27,28].
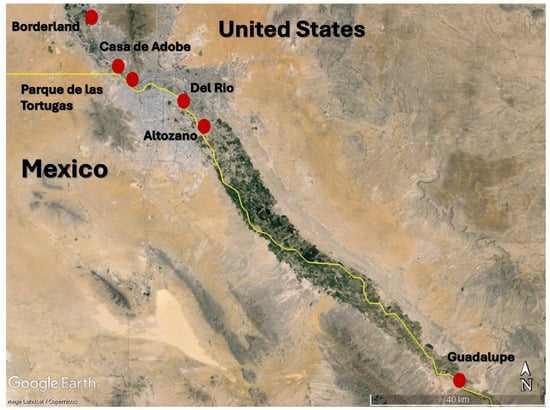
Figure 1.
Location of the six sampled sites along the Rio Bravo/Grande. The yellow line represents the Mexico-United States of America border.
2.2. Sample Processing
The samples were processed according to the methods proposed by Ferraz et al. [29] and Shruti et al. [30], with modifications for water and sediment samples, respectively. Water samples were filtered through a 0.45 µm filter (HA and HVLP; Pall Corporation, Port Washington, NY, USA, and Millipore, Burlington, MA, USA) to concentrate microplastics before digestion with 300 mL of 3 or 30% H2O2 solution (instead of KOH in the case of water samples), depending on reagent availability (CTR Scientific, reactive grade, Monterrey, Mexico), at 60 °C for 24 h, adding 50–100 mL of peroxide to avoid complete evaporation before the digestion process ended. Sediment samples were dried at 60 °C (instead of <40 °C) for 48 h in an incubator (Napco 332, National Appliance Company, Hollywood, FL, USA). Thirty grams of dried sediment was weighed (constant weight technique) and digested for 24 h with a 10% NaOH (Distribuidora Alvarado, Ciudad Juárez, Mexico) solution. After digestion, 50 mL of a high-density CaCl2 solution, prepared by dissolving 150 g of the salt (96%, CTR Scientific, Monterrey, Nuevo León, Mexico) in 100 mL of distilled water, was added to isolate microplastics from water and sediment digested samples. The previously cited works used a NaCl solution for water and ZnCl2 for sediments. Processed samples were shaken for 60 s and left resting at room temperature for 48 h. Finally, samples and blanks were filtered through a 0.45 µm filter (HA and HVLP; Pall Corporation, Port Washington, NY, USA, and Millipore, Burlington, MA, USA) to concentrate MPs.
2.3. Identification, Quantification, and Size Determination
The membranes containing microparticles isolated from water and sediment samples were dyed with 250 µL of a Nile Red solution (1 mg/mL ethanol for microscopy, Sigma Aldrich, St. Louis, MO, USA). Membranes stained with Nile Red solution were dried in Petri dishes at room temperature for 24 h. The total concentration of MPs was estimated under fluorescence microscopy (Leica DM 2000, Leica Microsystem, Wetzlar, Germany) at 5x under blue light [31] for each site. Based on their shape, each particle was counted and classified as either fibre, fragment, or film. Additionally, MPs were observed under a laser scanning confocal microscope, Zeiss LSM-700 (Zeiss, Oberkochen, Germany; microscope located at the Bioscience Building, University of Texas at El Paso), at 405 and 488 nm wavelengths to visualize the particles [32]. Particle size was determined with the Zeiss Zen 3.10 software.
2.4. Quality Assurance and Quality Control
Plastic materials were avoided when possible, using either glass or metallic materials during sampling and sample processing. Glassware such as flasks, cylinders, pipettes, and the Millipore filtration system, among other things, were used in digestion, microparticle isolation, and filtration. Every piece of glassware and material used for sample processing was rinsed three times into the filtration funnel. Samples were processed under a sheetrock shelf in an area with a minimum environmental air flow to avoid airborne contamination as much as possible. A field blank was exposed to ambient conditions during sampling to account for airborne contamination, and processed along with the water/sediment samples. All the particles in the blank were subtracted from those quantified in the samples.
2.5. Statistical Analysis
Parametric and nonparametric data were analyzed to identify statistical differences or similarities by comparing the averages of (1) total concentrations in water and sediments between sites in 2022 and 2023 and at Casa de Adobe (2022–2024), and (2) concentration by particle shape (fragments, fibres, films). The Shapiro–Wilk test was used to test normality. Normally distributed data was evaluated by ANOVA with the post hoc Tukey’s test at a 95% confidence level. In cases of non-normality, data were transformed (square root) and analyzed (ANOVA) at a 95% confidence level. Means were then compared by post hoc Tukey’s test to identify differences or similarities between variables (site, shape, and year). Residuals were tested for normality [33,34] and analyzed with the Kruskal–Wallis test when neither the transformed data nor the residuals had a normal distribution. In these cases, means comparisons were performed with Duncan’s post hoc test to identify statistical differences between variables. InfoStat software, version 2020, was used to perform all statistical analyses.
3. Results
3.1. Particle Abundance and Characteristics in Water
Microparticle concentrations ranged from 0.4 to 17 particles/L across all sites (2022–2023; Figure 2). Altozano had the highest concentration of particles (17 particles/L), whereas Del Rio had the lowest (0.40 particles/L). Three particle shapes were identified: fibres, fragments, and films. Fibres were the most abundant shape (71.94%), followed by fragments (26.84%) and films (1.22%). Films were found only in two sites: Casa de Adobe and Guadalupe. Altozano registered the most abundant concentration of fibres (14.76 particles/L), while Casa de Adobe had the highest concentration of fragments (5.40 particles/L). The sizes of fibres varied from 72.90 to 4282.25 µm. Fragments were generally smaller, with sizes varying from 12.62 to 373.11 µm. It was difficult to detect films on the samples, and only one film particle was detected (136.546 µm). The majority of the particles measured less than 630 µm.
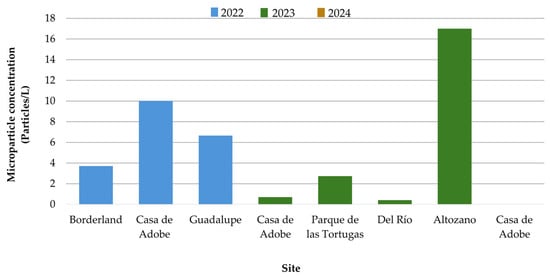
Figure 2.
Total microplarticle concentrations in water.
Water samples showed that the mean total concentration of detected particles was similar across the three sites sampled in 2022: Borderland: 1.23 ± 1.14 particles/L; Casa de Adobe: 3.33 ± 1.36 particles/L; Guadalupe: 2.2 ± 0.55 particles/L (p = 0.4321, α = 0.05; Table A1, Figure 3a). This was also observed at sites sampled in 2023 (Figure 3b): 0.23 ± 0.13 particles/L were found in Casa de Adobe, 0.91 ± 0.47 particles/L in Parque de Las Tortugas, 0.13 ± 0.03 particles/L in Del Rio, and 5.67 ± 4.09 particles/L in Altozano (p = 0.2552, α = 0.05; Table A1).
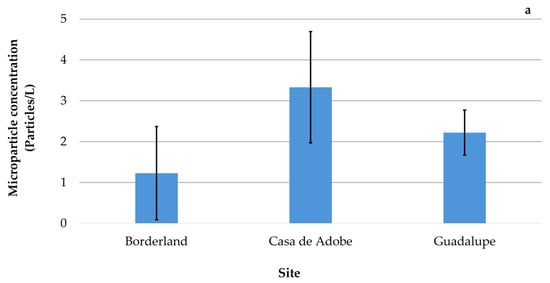
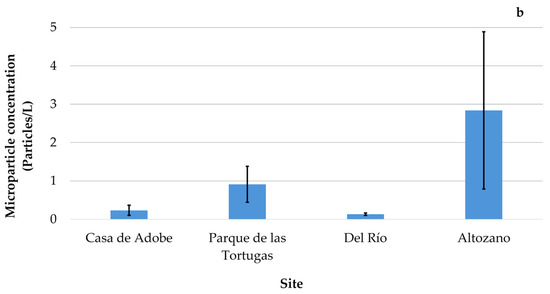
Figure 3.
Mean particle concentration detected in water: (a) 2022; (b) 2023. The bars represent the standard errors (values for Altozano are divided by 2).
The concentration of particle shapes was different within the sites sampled in 2022 (p = 0.0003, α = 0.05; Table A2, Figure 4a), and specifically in terms of film concentration between Guadalupe (0.10 ± 0.03 particles/L) and Casa de Adobe (0.20 ± 0.07 particles/L). The sites sampled in 2023 showed similar concentrations (p = 0.2935, α = 0.05; Table A3, Figure 4b).
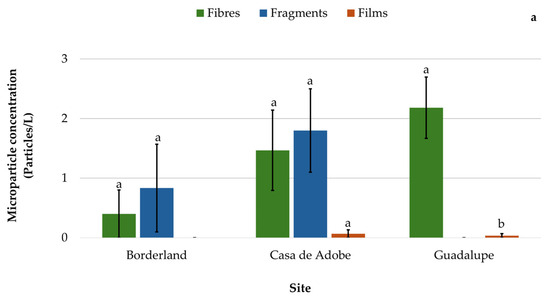
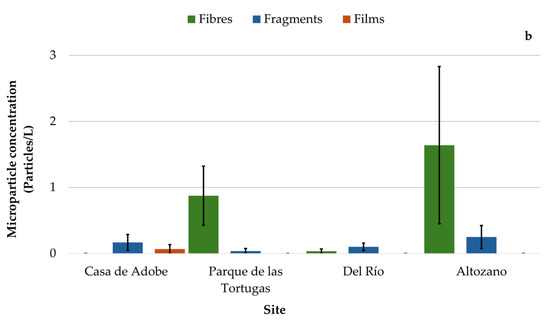
Figure 4.
Mean particle concentration by shape in water: (a) 2022; (b) 2023. The bars represent the standard errors (values for Altozano are divided by 3). Lower case letter on the error bars indicates statistical similarities or differences.
3.2. Particle Abundance and Characteristics in Sediments
In sediments, total particle concentrations at sites sampled in 2022 ranged from 2.8 × 10³–6.8 × 10³ particles/kg, while in 2023 they ranged from 3.2 × 10³–1.0 × 10⁴ particles/kg (Figure 5). Del Rio had the highest concentration mean (1.0 × 10⁴ particles/kg), while Casa de Adobe (2022) had the lowest (2.8 × 10³ particles/kg) (Figure 6a,b).
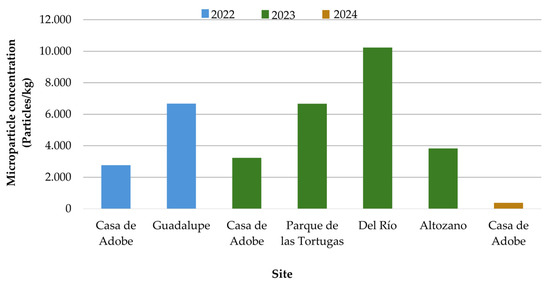
Figure 5.
Total microparticle concentrations in sediment.
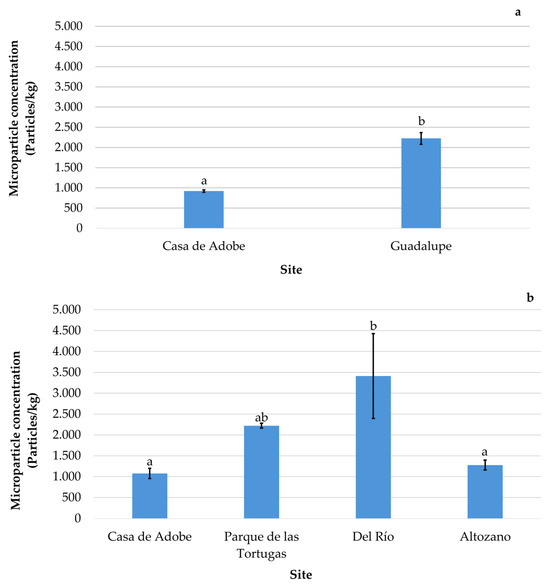
Figure 6.
Mean microparticle concentration detected in sediments: (a) 2022; (b) 2023. The bars represent the standard errors. Lower case letter on the error bars indicates statistical similarities or differences.
Two particle forms were observed: fibres and fragments. Fibres had an abundance of 91.3%, while fragments had 8.7%. Both particle shapes were found at all sampled sites, with Del Rio having the highest mean concentration of fibres (3.028 × 10³ particles/kg) and fragments (370.77 particles/kg; Figure 7a,b).
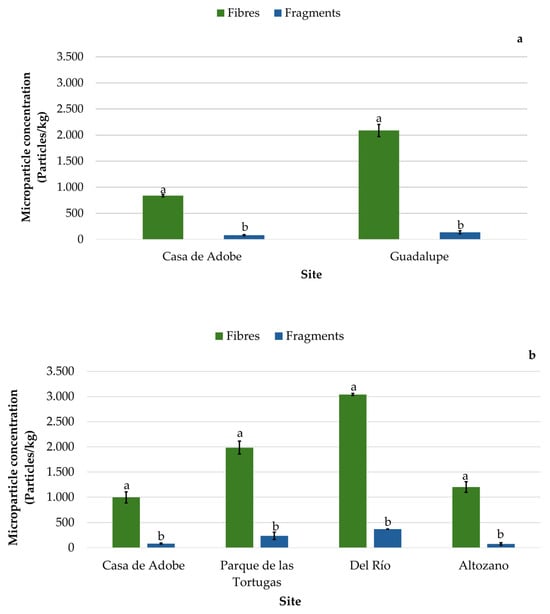
Figure 7.
Microparticle concentration by shape in sediments: (a) 2022; (b) 2023. The bars represent the standard errors. Lower case letter on the error bars indicates statistical similarities or differences.
The mean particle concentration of microparticles found in sites sampled in 2022 (Figure 6a), Casa de Adobe (9.2 × 10² ± 3 × 101 particles/kg) and Guadalupe (2.2 × 10³ ± 1.4 × 10² particles/kg), was significantly different (p = 0.0009, α = 0.05, Table A4), as was the average concentrations of particle shapes at both sites (Table A5); fibres were up to 15 times more abundant than fragments (p < 0.0000, p = 0.001. α = 0.05). The mean particle concentration in the samples from 2023 did not show a normal distribution, but there were statistical differences (p = 0.0324, α = 0.05; Table A6): the average concentration of microparticles detected in Del Rio was approximately 3 times larger (3.4 × 10³ ± 1.5 × 10³ particles/L) than that detected in Casa de Adobe (1.0 × 10³ ± 7 × 101 particles/kg) and Altozano (1.3 × 10³ ± 1.2 × 10² particles/kg), but similar to Parque de Las Tortugas (2.2 × 10³ ± 6 × 101 particles/kg) (Figure 6b). Differences were also observed between particle shapes at all sites (p values ranged from 0.0003 to 0.0358 with α = 0.05, Table A7) as fibres were up to 16 times more abundant (Figure 7a,b). The sizes of fibres varied from 16.57 to 4489 µm, while fragments showed sizes varying from 17.53 to 588.62 µm, with the majority of the particles measuring less than 552 µm.
3.3. Casa de Adobe
Casa de Adobe was the only site that had water during the three years of monitoring the river; hence, samples were collected and analyzed to determine whether there were any differences between years. Water samples from Casa de Adobe showed an abundance of 10 particles/L in 2022 and 0.7 particles/L in 2023; no particles were detected in 2024 (Figure 8). Three particle shapes were identified: fragments (55.14%), fibres (41.12%), and films (3.74%; Figure 9). The microparticle average concentration was different among samples collected in 2024 compared to those collected in 2022 (3.33 particles/L) and 2023 (0.23 particles/L; p = 0.0431, α = 0.05; Table A8): MPs were not detected in 2024. Similar concentrations of fibres and fragments were found at this site in 2022 (4.40 and 5.40 particles/L, respectively) and 2023, which showed a non-normal distribution (0 and 0.50 particles/L, respectively) (p = 0.1478 and p = 0.6719, respectively, α = 0.05. Table A9 and Table A10).
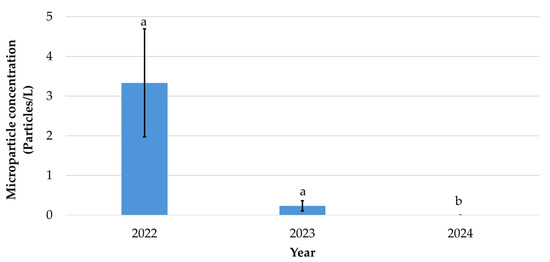
Figure 8.
Mean microparticle concentration detected in water from Casa de Adobe (2022–2024). The bars represent the standard errors. Lower case letter on the error bars indicates statistical similarities or differences.
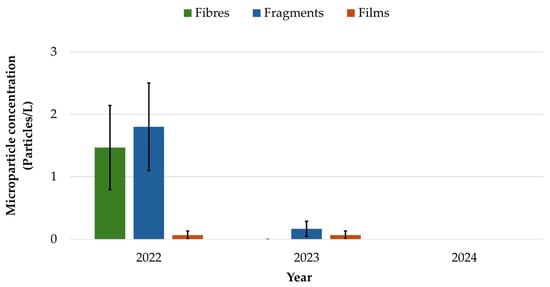
Figure 9.
Microparticle concentration by shape in water from Casa de Adobe (2022–2024). The bars represent the standard errors.
In sediments, an abundance of 2.8 × 10³ particles/kg (2022), 3.2 × 10³ particles/kg (2023), and 3.7 × 10² particles/kg (2024) was observed. Two particle forms were identified: fibres (92.33%) and fragments (7.67%). The lower average particle concentration was observed in 2024 samples (1.2 × 10² particles/kg), and larger average concentrations were observed in 2022 and 2023 samples (9.2 × 10², and 1.0 × 10³ particles/kg), respectively (p = 0.0004; Table A11, Figure 10). Fibres were also more abundant than fragments, as the average concentration was seven to eight times less abundant than fibres in samples from 2022 (p < 0.0001, α = 0.05) and 2023 (p = 0.0012; α = 0.05), as shown in Figure 11 and Table A12.
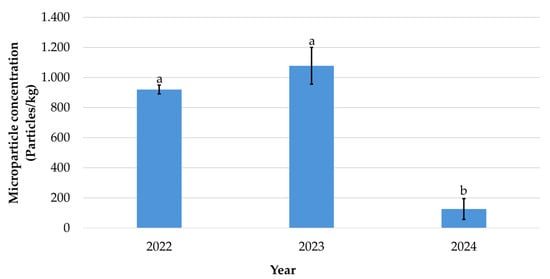
Figure 10.
Mean microparticle concentration detected in sediments from Casa de Adobe (2022–2024). The bars represent the standard errors. Lower case letter on the error bars indicates statistical similarities or differences.
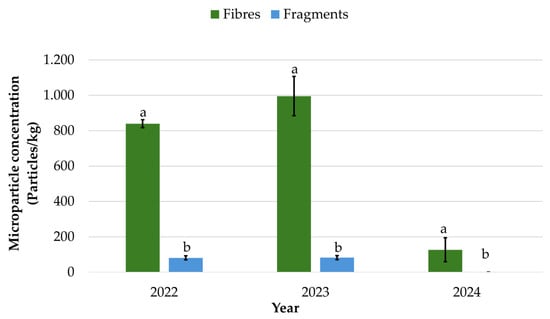
Figure 11.
Mean microparticle concentration by shape detected in sediments from Casa de Adobe (2022–2024). The bars represent the standard errors. Lower case letter on the error bars indicates statistical similarities or differences.
4. Discussion
The abundance of microparticles in water (0.4–17 particles/L) and sediments (2.8 × 10³–1.0 × 10⁴ particles/kg) detected in this study (Table A13), as well as the particle shapes (fibres, fragments, and films), could be associated with multiple factors such as those described in the literature for other rivers: plastic waste, economic activities such as agricultural and industrial practices, urbanization, untreated wastewater, wastewater treatment plants (WWTPs) discharges, atmospheric deposition [3,7], river flow rates, and sampling times (e.g., during the rainy season [35]).
To identify possible MP sources in this portion of the Río Bravo/Grande, the following factors must be considered: (1) the main activities near the Río Bravo/Grande, specifically on the Juarez–El Paso border (mainly agriculture and manufacturing industries) [36,37]; (2) the strict environmental regulations that prohibit or limited waste and wastewater discharges into the river by manufacturing industries along the U.S.A–Mexico without a permit [38,39]; (3) the river water management stipulations set by international treaties such as the 1906 treaty for the Equitable Distribution of the Waters of the Río Bravo/Grande [40]; and (4) climate [23].
It was interesting to note the similarity in average microparticle concentration in water among sites in 2022 and 2023 despite the difference in sampling times, and even though urbanization and economic activities vary along the river: Borderland, in El Paso, TX, is near an urban and industrial area, while Casa de Adobe’s surroundings include brick factories as well as residential areas; moreover, it is located 0.56 km below Northwest WWTP (El Paso, TX)’s discharge into the river, and the American Dam (water diversion to Mexico) [40]. The river flow decreases before the Parque las Tortugas site due to the “Acequia Madre” diversion, which drains water to supply farmland areas [41]; this site is surrounded by roads at both border sides. Del Rio is located in an urbanized zone, but there may be an input of treated wastewater 8.84 km upstream of this site from the Haskell WWTP; Altozano is near an industrial zone at the Mexican border, while Guadalupe sampling site represents a rural area focused on agriculture at both border sides.
Similarities in microparticles may reflect hydrodynamic sorting, where flow velocity influences the retention of specific particle sizes. As seen in Table A14, the flow and depth at Borderland (<7.8 m3/s and <0.45 m, respectively) [42] were greater than those at Casa de Adobe (0.3 m3/s and 0.3 m, respectively) [27] and Guadalupe (<0.5 m3/s and 0.29 m, respectively) [42], but 64% of the particles found at Borderland fell within the 12–150 µm range, while at Casa de Adobe, 70% fell within the 15–408 µm range, and at Guadalupe, 66% fell within the 18–628 µm range; overall, Borderland particles were smaller in size, which may facilitate their dispersion with the river current at this site [43].
Similar microparticle concentrations (0.13–5.67 particles/L on average) were detected at sites sampled in 2023. However, there is not enough data to correlate the concentration similarity with the water flow, even though Casa de Adobe and Parque de Las Tortugas had similar flow (4.15 m3/s and <5 m3/s, respectively); there was no information available about flow near the Altozano or Del Rio sites. The nearest IBWC monitoring station to Del Rio is about 4.4 km to the east, but only two measurements of flow are registered (<0.5 m3/s on 6 December 2022, and 215.54 m3/s on 19 July 2023 [27]), while the last registered flow at Altozano (17.47 m3/s) was in May of 2023, five months before our sampling time. Figure 12 presents a visual reference of the water level at three of the sampled sites. The only similarity among sites sampled in 2023 is the location of WWTPs (Northwest, Haskel, and Bustamante plants) and the runoff discharge below the International Reservoir (about 0.8 km upstream of Parque de Las Tortugas) in the surroundings of the sampling sites (0.56 to 8.34 km). These plants may release water to the river basin during the year, especially when river water is kept at upstream dams such as Elephant Butte, contributing to MPs’ release into the environment [44].
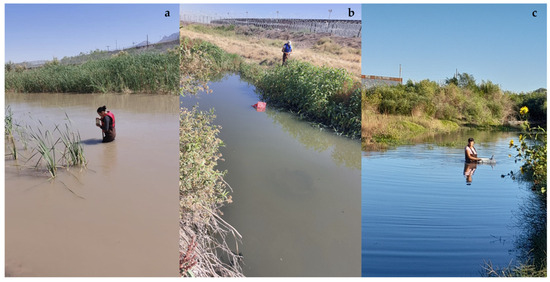
Figure 12.
Water level observed at the Río Grande/Bravo during sampling. (a) Casa de Adobe, (b) Del Rio, (c) Altozano.
Other rivers associated with urban, industrial, and agricultural zones show similar ranges of MPs in water to the ones found in this study: Ding et al. [45] detected concentrations of 3.67–10.7 particles/L in the Wei River in China (in the section flowing through Ningxia, Shaanxi, and Gansu), and in Poland [46] a study detected 1.6–2.55 particles/L in the Vistula River. However, the conditions of water flow and population size in the surroundings of the aforementioned rivers (Table A15) differ from those recorded in the Río Bravo/Grande and in the El Paso–Juárez metroplex, respectively. Other variables such as waste management, microplastics in other matrices (air and soil), and wastewater discharge into the mentioned rivers must be considered in addition to the hydrogeographic and demographic characteristics to determine MPs’ presence in surface water systems. Other factors, such as the sampling, processing, and identification methods, must be taken into consideration to explain the wide variation in the reported concentrations.
Looking at the shapes of particles found in the Río Bravo/Grande, the amount of fibres detected (71.94%) is consistent with studies in other rivers, such as (1) the Wei River, where 61.95% of the total registered microplastics were fibres [44]; (2) the Sinos River in Brazil, with 89.4% [29]; (3) the Fenghua River in China, with 9–83% of the particles [47], and (4) 96% in the Ganges River [7]. Other studies also report foams, pellets/spheres, and films [45,48]; foams and pellets/spheres were not detected in the water or in sediment samples collected at the Río Bravo/Grande.
Fibre abundance can be linked to the presence of treated and untreated wastewater in natural water bodies, since the mechanical fragmentation of clothes in washing machines has been described as a source of microfibres [44,47]. Previous reports state that there are wastewater and treated wastewater discharges into the river at the El Paso, Texas (EE.UU.) side [38,49], as well as urban runoff and unexpected occasional wastewater discharges at the city of Juárez, Chihuahua (México) side [50]. Moreover, in 2021 and 2022, the northwest wastewater treatment plant at El Paso, Texas (U.S.), released 1.25 billion gallons of wastewater into the river [51]. Even though it has been found that wastewater treatment plants such as those at Todos los Santos Bay inBaja California, Mexico remove microplastics during the treatment process, fibres are still the predominant shape in the effluent of these plants [52].
Another source of fibres in the Río Bravo/Grande at the El Paso–Juárez metroplex could be atmospheric deposition, as both cities experience frequent dust storms [23]. Although MPs in the air have not been as explored as much as in water, research has shown that they can be transported by air [53].
The presence of MP fragments and films in the environment is associated with the degradation of large pieces of plastic debris, such as plastic bags, packaging, plastic bottles, and tyre wear particles, and with agricultural practices [48,54]. Thus, urban runoff and atmospheric deposition may introduce these particles into the Río Bravo/Grande since urban runoff is discharged in the river by natural land slope and wind flows through the El Paso–Juárez metroplex throughout the year. This assumption is supported by Sun et al. [55], who concluded that the amount of microplastic fragments deposited by air in urban spaces was 1.7 to 12 times higher than those discharged in treated wastewater. Moreover, our team noticed the presence of numerous instances of plastic waste in and around the river (Figure 11) during sampling, which could be the main source of these particles.
Studies in river water and sediment show that there is a tendency for sediments to have a greater concentration of MPs than water [7,48], which supports the idea that sediments act as MP reservoirs [56]. In the present study, this tendency is supported since Del Rio had the lowest MP concentration in water (0.4 particles/L) but the highest concentration in sediments (10,234.83 particles/kg), and a similar pattern was observed in the rest of the sites (Table A13).
It is important to note that microplastics in sediments have a different dynamic than those in water, as MPs in sediments tend to accumulate and only be resuspended when there are disturbances in the sediments, such as a raining event or increased flow [43]. The Río Bravo/Grande at the El Paso–Juárez metroplex is subjected to disturbances at least once a year, when Elephant Butte water is released and diverted to México. Considering this, the differences between the concentrations in sediments from the 2022 sites (Casa de Adobe and Guadalupe) can be due to flow and depth, given that both variables were lower in Guadalupe (low sediment disturbance) and microparticle concentration was higher in comparison to Casa de Adobe. Moreover, Casa de Adobe is near the international floodgates that control the flow of water from the U.S.A. into Mexico, while Guadalupe is located at about 105 km from this point. In the case of the sites sampled in 2023 (Casa de Adobe, Parque de las Tortugas, Del Rio, and Altozano), a similar situation was observed, as Parque de las Tortugas had the lowest levels in terms of both flow and depth, but the highest microparticle concentration.
Sediments in other parts of the world have also shown considerable concentrations of microplastics. The Amazon, Solimões, and Negro Rivers (up- and downstream of Manaos, Brazil) had concentrations within the same range as the ones in this study (417–8178 particles/kg) [57]; it is interesting to note that the population of Manaos at the time of monitoring (2011) was about the same as Juárez in 2020: 2,063,689 vs. 1,561,000, respectively. Just as in water, the conditions of each river are diverse (Table A15).
The data obtained from the Río Bravo/Grande water and sediments collected at Casa de Adobe in three different years (2022–2024) indicate that average microparticle concentration may vary through time. There may be several reasons for these variations, such as rain events occurring days before sampling, resuspension from sediments due to people looking for a place to fish or fishing with a net near the sampling site during sampling, or due to flow variations (floodgates were closed during sampling in 2022 but open in 2023 and 2024).
5. Conclusions
Three shapes of microparticles were detected in the Río Bravo/Grande at the El Paso–Juárez Metroplex area. Their presence in river water and sediments may be associated with urban or agricultural runoff, wastewater entering the rivers, and atmospheric deposition. The concentrations of microparticles (water: 0.4 to 17 particles/L; sediments: 2.8 × 10³–1.0 × 10⁴ particles/kg) and the abundance of fibres (water: 71.94%; sediments 91.07%) were found to be consistent with other studies in rivers around the world. As expected, particle concentration was higher in sediments than in water. The concentrations of microparticles reported in this study may serve as baseline data for microplastics’ fate and transport studies, as well as environmentally relevant information for ecotoxicological studies (exposure concentrations and macroinvertebrates’ ingestion potential, among others) from an important water body that supports life and human development along the border of Mexico and the United States. Studies that consider hydraulics, atmospheric deposition, and water management are necessary to provide more information about the presence and dynamics of MPs in the Río Bravo/Grande, as well as to determine the actual distribution and impact of MPs along the Río Bravo/Grande basin.
Author Contributions
Conceptualization: J.V.R.-A.; methodology: S.H.-C. and J.V.R.-A.; sampling: S.H.-C. and J.V.R.-A.; processing and analysis: S.H.-C. and J.V.R.-A.; writing—original draft preparation: S.H.-C.; review and editing: J.V.R.-A.; supervision: J.V.R.-A.; project administration: J.V.R.-A. All authors have read and agreed to the published version of the manuscript.
Funding
Secretaría de Ciencia, Humanidades, Tecnología e Innovación (SECIHTI) granted a Ph.D. scholarship to Stephanie Hernández Carreón (scholarship number: 801336); Universidad Autónoma de Ciudad Juárez provided some laboratory materials and the facilities for the realization of the project. Sampling materials, other laboratory materials and reagents, and sample collection were supported by Dr. Rios-Arana. This research was partially supported by the Cellular Characterization and Biorepository Core Facilities of the Border Biomedical Research Center at the University of Texas at El Paso (UTEP), funded by the Research Centers at Minority Institutions grant 5U54MD007592 from the National Institute on Minority Health and Health Disparities, a component of the National Institutes of Health (NIH).
Institutional Review Board Statement
Not applicable.
Data Availability Statement
The raw data supporting the conclusions of this article will be made available by the authors on request.
Acknowledgments
We would like to thank the Secretaría de Ciencia, Humanidades, Tecnología e Innovación (SECIHTI) for granting the doctoral studies scholarship for SHC, Jorge Alberto Pérez León and his team for the support on fluorescence microscopy infrastructure and training, and Ríos laboratory undergraduates and students (Madel Carmen Calderón Pla; Marian Acoyani Vazquez Ontiveros, Karen Valeria Gomez Acosta, and Itzia Xiunhelly Rodríguez González) for their support during sampling. We would also like to acknowledge Armando Varela and Elizabeth Walsh for granting access to the laser scanning confocal microscope in the Bioscience Building at the University of Texas at El Paso (UTEP). We also thank the reviewers for their comments and observations that contributed to improving this article.
Conflicts of Interest
The authors declare no conflicts of interest.
Abbreviations
The following abbreviations are used in this manuscript:
| MP | Microplastic |
| MPs | Microplastics |
Appendix A

Table A1.
ANOVA for the determination of similarities or differences between mean total concentrations in water.
Table A1.
ANOVA for the determination of similarities or differences between mean total concentrations in water.
| Year | CS | d.f | MS | F | p Value | |
|---|---|---|---|---|---|---|
| Site | 6.62 | 2 | 3.31 | 0.97 | 0.4321 | |
| 2022 | Error | 20.53 | 6 | 3.42 | ||
| Total | 27.15 | 8 | ||||
| Site | 62.52 | 3 | 20.84 | 1.64 | 0.2552 | |
| 2023 | Error | 101.47 | 8 | 12.68 | ||
| Total | 163.99 | 11 |
Table A2.
ANOVA for the determination of similarities or differences between particle shapes in water (2022).
Table A2.
ANOVA for the determination of similarities or differences between particle shapes in water (2022).
| Site | CS | d.f. | MS | F | p Value |
|---|---|---|---|---|---|
| Borderland | 0.74 | 0.5148 | |||
| Shape | 1.04 | 2 | 0.52 | ||
| Error | 4.21 | 6 | 0.70 | ||
| Total | 5.25 | 8 | |||
| Casa de Adobe | |||||
| Shape | 5.08 | 2 | 2.54 | 2.67 | 0.1478 |
| Error | 5.69 | 6 | 0.95 | ||
| Total | 10.77 | 8 | |||
| Guadalupe | |||||
| Shape | 9.39 | 2 | 4.70 | 17.74 | 0.0030 |
| Error | 1.59 | 6 | 0.26 | ||
| Total | 10.98 | 8 |
Table A3.
Kruskal–Wallis analysis for the determination of similarities or differences between particle shapes in water (2023).
Table A3.
Kruskal–Wallis analysis for the determination of similarities or differences between particle shapes in water (2023).
| Variable | Classification Criteria | ||||
|---|---|---|---|---|---|
| Site | Type | Mean | d.f. | p Value | |
| Concentration | Casa de Adobe | Fibres | 0.03 | 11 | 0.2935 |
| Fragments | 0.17 | ||||
| Films | 0.07 | ||||
| Del Río | Fibres | 0.03 | |||
| Fragments | 0.10 | ||||
| Films | 0 | ||||
| Parque de las Tortugas | Fibres | 0.87 | |||
| Fragments | 0.03 | ||||
| Films | 0 | ||||
| Altozano | Fibres | 4.92 | |||
| Fragments | 0.75 | ||||
| Films | 0 | ||||
Table A4.
ANOVA for the determination of similarities or differences between mean total concentrations in sediments (2022).
Table A4.
ANOVA for the determination of similarities or differences between mean total concentrations in sediments (2022).
| CS | d.f. | MS | F | p Value | ||
|---|---|---|---|---|---|---|
| Site | 2,547,469.30 | 1 | 2,547,469.30 | 78.14 | 0.0009 | |
| 2022 | Error | 130,412.53 | 4 | 32,603.13 | ||
| Total | 2,677,881.82 | 5 |
Table A5.
Kruskal–Wallis test for the determination of similarities or differences between mean total concentrations in sediments (2023).
Table A5.
Kruskal–Wallis test for the determination of similarities or differences between mean total concentrations in sediments (2023).
| Variable | Classification Criteria | |||
|---|---|---|---|---|
| Site | Mean | d.f. | p Value | |
| Concentration | Casa de Adobe | 1077.40 | 3 | 0.0324 |
| Del Río | 3411.61 | |||
| Parque de las Tortugas | 2221.57 | |||
| Altozano | 1276.86 | |||
Table A6.
ANOVA for the determination of similarities or differences between particle shapes in sediments (2022).
Table A6.
ANOVA for the determination of similarities or differences between particle shapes in sediments (2022).
| Site | CS | d.f. | MS | F | p Value | |
|---|---|---|---|---|---|---|
| Casa de Adobe | ||||||
| Shape | 863,286.8 | 1 | 863,286.8 | 923.7 | <0.0001 | |
| Error | 3702.3 | 4 | 925.57 | |||
| Total | 866,989.1 | 5 | ||||
| Guadalupe | ||||||
| Shape | 5,718,540.58 | 1 | 5,718,540.58 | 268.41 | 0.0001 | |
| Error | 85,221.04 | 4 | 21,305.26 | |||
| Total | 5,803,761.62 | 5 | ||||
Table A7.
ANOVA for the determination of similarities or differences between particle shape in sediments (2023).
Table A7.
ANOVA for the determination of similarities or differences between particle shape in sediments (2023).
| Site | CS | d.f. | MS | F | p Value | |
|---|---|---|---|---|---|---|
| Parque de Las Tortugas | ||||||
| Shape | 10,693,964.11 | 1 | 10,693,964.11 | 9.68 | 0.0012 | |
| Error | 4,418,343.75 | 4 | 1,104,585.94 | |||
| Total | 15,112,307.86 | 5 | ||||
| Del Rio | ||||||
| Shape | 4,586,962.51 | 1 | 4,586,962.51 | 140.75 | 0.0358 | |
| Error | 130,355.41 | 4 | 32,588.85 | |||
| Total | 4,717,317.92 | 5 | ||||
| Altozano | ||||||
| Shape | 1,911,306.74 | 1 | 1,911,306.74 | 108.97 | 0.0003 | |
| Error | 70,160.25 | 4 | 17,540.06 | |||
| Total | 1,981,466.99 | 5 | ||||
| Casa de Adobe | ||||||
| Shape | 1,252,079.67 | 1 | 1,252,079.67 | 66.94 | 0.0005 | |
| Error | 74,818.07 | 4 | 18,704.52 | |||
| Total | 1,326,897.74 | 5 | ||||
Table A8.
ANOVA for the determination of similarities or differences between mean total concentrations in water from Casa de Adobe (2022–2024).
Table A8.
ANOVA for the determination of similarities or differences between mean total concentrations in water from Casa de Adobe (2022–2024).
| CS | d.f. | MS | F | p Value | |
|---|---|---|---|---|---|
| Year | 20.59 | 2 | 10.29 | 75.56 | 0.0431 |
| Error | 11.11 | 6 | 1.85 | ||
| Total | 31.70 | 8 |
Table A9.
ANOVA for the determination of similarities or differences between particle shapes in water from Casa de Adobe (2022 and 2024).
Table A9.
ANOVA for the determination of similarities or differences between particle shapes in water from Casa de Adobe (2022 and 2024).
| CS | d.f. | MS | F | p Value | |
|---|---|---|---|---|---|
| 2022 | |||||
| Shape | 5.08 | 2 | 2.54 | 2.67 | 0.1478 |
| Error | 5.69 | 6 | 0.95 | ||
| Total | 10.77 | 8 | |||
| 2024 | |||||
| Shape | 0 | 2 | 0 | ND | ND |
| Error | 0 | 6 | 0 | ND | |
| Total | 0 | 8 | 0 |
Table A10.
Kruskal–Wallis analysis for the determination of similarities or differences between particle shapes in water from Casa de Adobe (2023).
Table A10.
Kruskal–Wallis analysis for the determination of similarities or differences between particle shapes in water from Casa de Adobe (2023).
| Variable | Classification Criteria | |||
|---|---|---|---|---|
| Site | Mean | d.f. | p Value | |
| Concentration | Casa de Adobe | 0.27 | 3 | 0.6719 |
| Del Río | 0.13 | |||
| Parque de las Tortugas | 0.91 | |||
| Altozano | 5.66 |
Table A11.
ANOVA for the determination of similarities or differences between mean total concentrations in sediments from Casa de Adobe (2022–2024).
Table A11.
ANOVA for the determination of similarities or differences between mean total concentrations in sediments from Casa de Adobe (2022–2024).
| CS | d.f. | MS | F | p Value | |
|---|---|---|---|---|---|
| Year | 1,559,400.32 | 2 | 779,700.16 | 38.31 | 0.0004 |
| Error | 122,099.51 | 6 | 20,349.92 | ||
| Total | 1,681,499.83 | 8 |
Table A12.
ANOVA for the determination of similarities or differences between particle shapes in sediments from Casa de Adobe (2022–2024).
Table A12.
ANOVA for the determination of similarities or differences between particle shapes in sediments from Casa de Adobe (2022–2024).
| CS | d.f. | MS | F | p Value | |
|---|---|---|---|---|---|
| 2022 | |||||
| Shape | 863,286.8 | 1 | 863,286.8 | 932.7 | <0.0001 |
| Error | 3702.3 | 4 | 925.57 | ||
| Total | 866,989.1 | 5 | |||
| 2023 | |||||
| Shape | 1,252,079.67 | 1 | 1,252,079.67 | 66.94 | 0.0012 |
| Error | 74,818.07 | 4 | 18,704.52 | ||
| Total | 1,326,897.74 | 5 | |||
| 2024 | |||||
| Shape | 23,403.76 | 1 | 23,403.76 | 3.3 | 0.1436 |
| Error | 28,402.76 | 4 | 7100.69 | ||
| Total | 51,806.52 | 5 |
Table A13.
Data about depth and flow in the areas near the sampled sites (IBWC, 2025 [27,28]).
Table A13.
Data about depth and flow in the areas near the sampled sites (IBWC, 2025 [27,28]).
| Site | Depth (m) | Flow (m3/s) | Date | Sampling Date |
|---|---|---|---|---|
| Borderland | 0.45–0 | 7.8–dry | 2 June 2022–19 September 2022 | 9 August 2022 |
| Casa de Adobe | 0.3 | 0.3 | 21 August 2022 | 21 August 2022 |
| Guadalupe | 0.29 | <0.5 | 27 September 2022 | 29 September 2022 |
| Del Rio | 0.48–0.78 | <0.5–21.54 | 6 December 2023–19 July 2023 | 23 May 2023 |
| Casa de Adobe | 0.4 | 4.15 | 6 July 2023 | 5 July 2023 |
| Parque de las Tortugas | <0.1 | <0.5 | 6 July 2023 | 6 July 2023 |
| Altozano | 1 | 17.47 | 9 May 2023 (last report) | 27 October 2023 |
| Casa de Adobe | 0.5 | 5.04 | 29 April 2024 | 29 April 2024 |
Table A14.
Characteristics of other rivers where microplastic presence has been reported.
Table A14.
Characteristics of other rivers where microplastic presence has been reported.
| River | Water (Particles/L) | Sediments (Particles/kg) | Flow (m3/s) | Inhabitants | Characteristics | Reference |
|---|---|---|---|---|---|---|
| Bravo/Grande | 0.4–17 | 2761.20–10,234.83 | 24.1 [28] | 2,189,906 [58,59] | Urban, agricultural areas, industry | This study |
| Wei | 3.67–10.7 | 360–1320 | 195 [60] | 3,251,000 | Agriculture | [45] |
| Vistula | 1.6–2.55 | 190–580 | 1081 | 1,861,599 [61] | Less urbanized to urbanized areas, WWTP | [46] |
| Amazon, Solimões, and Negro | - | 417–8178 | 209,000 | 20,000,000 | Rural to urban areas, industry | [57] |
Table A15.
Microplastic concentration in water and sediments.
Table A15.
Microplastic concentration in water and sediments.
| Site | Water (Particles/L) | Sediments (Particles/kg) |
|---|---|---|
| Borderland | 3.7 | — |
| Casa de Adobe | ||
| 2022 | 10 | 2761.20 |
| 2023 | 0.7 | 3232.21 |
| 2024 | — | 374.73 |
| Parque de las Tortugas | 2.73 | 6664.72 |
| Del Rio | 0.4 | 10,234.83 |
| Altozano | 17 | 3830.59 |
| Guadalupe | 6.65 | 6670.80 |
References
- Amadei, A.M.; Sanyé-Mengual, E.; Sala, S. Modeling the EU plastic footprint: Exploring data sources and littering potential. Resour. Conserv. Recycl. 2022, 178, 106086. [Google Scholar] [CrossRef]
- Statista. Annual Production of Plastics Worldwide from 1950 to 2023. Available online: https://www.statista.com/statistics/282732/global-production-of-plastics-since-1950/ (accessed on 25 November 2025).
- Chamas, A.; Moon, H.; Zheng, J.; Qiu, Y.; Tabassum, T.; Jang, J.H.; Abu-Omar, M.; Scott, S.L.; Suh, S. Degradation Rates of Plastics in the Environment. ACS Sustain. Chem. Eng. 2020, 8, 3494–3511. [Google Scholar] [CrossRef]
- Sarkar, B.; Dissanayake, P.D.; Bolan, N.S.; Dar, J.Y.; Kumar, M.; Haque, M.N.; Mukhopadhyay, R.; Ramanayaka, S.; Biswas, J.K.; Tsang, D.C.W.; et al. Challenges and opportunities in sustainable management of microplastics and nanoplastics in the environment. Environ. Res. 2022, 207, 112179. [Google Scholar] [CrossRef] [PubMed]
- Pinheiro, L.M.; Ita-Nagy, D.; Hidalgo, D.G.; Flor, D.; Baquero, A.O.; Becerra, N.; Grønneberg, I.; Vázquez-Rowe, I.; Kahhat, R.; Lewis, C.; et al. Integrating technology and environmental data to predict mismanaged plastic waste in a watershed. J. Ind. Ecol. 2025, 29, 1912–1926. [Google Scholar] [CrossRef]
- Corradini, F.; Meza, P.; Eguiluz, R.; Casado, F.; Huerta-Lwanga, E.; Geissen, V. Evidence of microplastic accumulation in agricultural soils from sewage sludge disposal. Sci. Total Environ. 2019, 671, 411–420. [Google Scholar] [CrossRef]
- Napper, I.E.; Baroth, A.; Barrett, A.C.; Bhola, S.; Chowdhury, G.W.; Davies, B.F.R.; Duncan, E.M.; Kumar, S.; Nelms, S.E.; Niloy, M.N.H.; et al. The distribution and characterization of microplastics in air, surface water and sediment within a major river system. Sci. Total Environ. 2023, 901, 166640. [Google Scholar] [CrossRef]
- Zhang, W.; Zhang, S.; Wang, J.; Wang, Y.; Mu, J.; Wang, P.; Lin, X.; Ma, D. Microplastic pollution in the surface waters of the Bohai Sea, China. Environ. Pollut. 2017, 231, 541–548. [Google Scholar] [CrossRef]
- González-Pleiter, M.; Edo, C.; Velázquez, D.; Casero-Chamorro, M.C.; Leganés, F.; Quesada, A.; Fernández-Piñas, F.; Rosal, R. First detection of microplastics in the freshwater of an Antarctic Specially Protected Area. Mar. Pollut. Bull. 2020, 161, 111811. [Google Scholar] [CrossRef]
- Thrift, E.; Porter, A.; Galloway, T.S.; Coomber, F.G.; Mathews, F. Ingestion of plastics by small terrestrial mammals. Sci. Total Environ. 2022, 842, 156679. [Google Scholar] [CrossRef]
- Allen, S.; Allen, D.; Moss, K.; Le Roux, G.; Phoenix, V.R.; Sonke, J.E. Examination of the ocean as a source for atmospheric microplastics. PLoS ONE 2020, 15, e0232746. [Google Scholar] [CrossRef]
- Qiu, H.; Xu, C.; Huang, X.; Wei, X.; Pang, Z.; Du, L.; Jiang, L.; Zhang, J. Microplastic contamination in waterbirds and their habitats: Evidence from little egrets (Egretta garzetta) in tropical rice fields. Environ. Res. 2025, 285, 122376. [Google Scholar] [CrossRef] [PubMed]
- Cong, Y.; Jin, F.; Tian, M.; Wang, J.; Shi, H.; Wang, Y.; Mu, J. Ingestion, egestion and post-exposure effects of polystyrene microspheres on marine medaka (Oryzias melastigma). Chemosphere 2019, 228, 93–100. [Google Scholar] [CrossRef] [PubMed]
- Sun, Y.; Xu, W.; Gu, Q.; Chen, Y.; Zhou, Q.; Zhang, L.; Gu, L.; Huang, Y.; Lyu, K.; Yang, Z. Small-Sized Microplastics Negatively Affect Rotifers: Changes in the Key Life-History Traits and Rotifer–Phaeocystis Population Dynamics. Environ. Sci. Technol. 2019, 53, 9241–9251. [Google Scholar] [CrossRef] [PubMed]
- Jiménez-Contreras, J.; Fernández-Medina, R.I.; Fernández-Araiza, M.A. Microplastics pollution in tropical lakes: Water, zooplankton, and fish in Central Mexico. Environ. Monit. Assess. 2024, 196, 813. [Google Scholar] [CrossRef]
- Belgacem, R.; Zitouni, N.; Khazri, A.; Abidi, O.; Alzwawy, A.G.; Béjaoui, M.; Bouleefah, F.; Banni, M.; Mahmoudi, E. Distribution of environmental microplastics in different tissues of indigenous freshwater bivalves (Unio spp.): A case study from the Sejenane River in Northern Tunisia. Environ. Toxicol. Chem. 2025, vgae023. [Google Scholar] [CrossRef]
- Galafassi, S.; Campanale, C.; Massarelli, C.; Uricchio, V.F.; Volta, P. Do Freshwater Fish Eat Microplastics? A Review with A Focus on Effects on Fish Health and Predictive Traits of MPs Ingestion. Water 2021, 13, 2214. [Google Scholar] [CrossRef]
- Nelms, S.E.; Barnett, J.; Brownlow, A.; Davison, N.J.; Deaville, R.; Galloway, T.S.; Lindeque, P.K.; Santillo, D.; Godley, B.J. Microplastics in marine mammals stranded around the British coast: Ubiquitous but transitory? Sci. Rep. 2019, 9, 1075. [Google Scholar] [CrossRef]
- Blettler, M.C.M.; Abrial, E.; Khan, F.R.; Sivri, N.; Espinola, L.A. Freshwater plastic pollution: Recognizing research biases and identifying knowledge gaps. Water Res. 2018, 143, 416–424. [Google Scholar] [CrossRef]
- Fernandes, A.; Bertoldi, C.; Lara, L.; Stival, J.; Alves, N.; Cabrera, P.; Grassi, M. Microplastics in Latin America Ecosystems: A Critical Review of the Current Stage and Research Needs. J. Braz. Chem. Soc. 2022, 33, 303–326. [Google Scholar] [CrossRef]
- Piñon-Colin, T.J.; Wakida, F.T.; Rogel-Hernandez, E.; Wakida-Kusunoki, A.T.; Garcia-Flores, E.; Magaña, H. Microplastics in the sediments of the Tijuana River Basin, Mexico. Int. J. Environ. Sci. Technol. 2024, 1, 8361–8374. [Google Scholar] [CrossRef]
- Reyes-García, F.A.; Martínez-Tavera, E.; Martínez-Gallegos, S.; Illescas, J. Physicochemical and statistical analysis of water and microplastics in a drinking water reservoir in México. MRS Adv. 2025, 10, 800–808. [Google Scholar] [CrossRef]
- Csavina, J.; Field, J.; Félix, O.; Corral-Avitia, A.Y.; Sáez, A.E.; Betterton, E.A. Effect of wind speed and relative humidity on atmospheric dust concentrations in semi-arid climates. Sci. Total Environ. 2014, 487, 82–90. [Google Scholar] [CrossRef] [PubMed]
- Salas-Esparza, M.G.; Herrera-Sosa, L.C. La vegetación como sistema de control para las Islas de Calor Urbano en Ciudad Juárez, Chihuahua. Hábitat Sustentable 2017, 7, 14–23. [Google Scholar]
- Segoviano, A.G. Determinación de Microplásticos en la Atmósfera del IIT-UACJ con el Uso de Distintas Técnicas de Muestro y Análisis (Microplastic Determination in the IIT-UACJ Atmosphere Using Different Sampling and Analysis Techniques). Bachelor’s Thesis, Universidad Autónoma de Ciudad Juárez, Chihuahua, Mexico, 2021. [Google Scholar]
- Rios-Arana, J.V.; Walsh, E.J.; Gardea-Torresdey, J.L. Assessment of arsenic and heavy metal concentrations in water and sediments of the Rio Grande at El Paso–Juarez metroplex region. Environ. Int. 2004, 29, 957–971. [Google Scholar] [CrossRef]
- IBWC. Rio Grande Flow/Reservoir Conditions. 2025. Available online: https://ibwcsftpstg.blob.core.windows.net/wad/DailyReports/flowdata.htm (accessed on 20 May 2025).
- IBWC. Rio Grande at El Paso Texas. 2023. Available online: https://waterdata.ibwc.gov/AQWebportal/Data/DataSet/Summary/Location/08364000/DataSet/Discharge/Best%20Available/Interval/Yearly/Calendar/CALENDARYEAR/2023 (accessed on 8 August 2024).
- Ferraz, M.; Bauer, A.L.; Valiati, V.H.; Schulz, U.H. Microplastic Concentrations in Raw and Drinking Water in the Sinos River, Southern Brazil. Water 2020, 12, 3115. [Google Scholar] [CrossRef]
- Shruti, V.C.; Jonathan, M.P.; Rodriguez-Espinosa, P.F.; Rodríguez-González, F. Microplastics in freshwater sediments of Atoyac River basin, Puebla City, Mexico. Sci. Total Environ. 2019, 654, 154–163. [Google Scholar] [CrossRef]
- Han, Z.; Jiang, T.; Xie, L.; Zhang, R. Microplastics impact shell and pearl biomineralization of the pearl oyster Pinctada fucata. Environ. Pollut. 2022, 293, 118522. [Google Scholar] [CrossRef]
- Zhou, F.; Wang, X.; Wang, G.; Zuo, Y. A Rapid Method for Detecting Microplastics Based on Fluorescence Lifetime Imaging Technology (FLIM). Toxics 2022, 10, 118. [Google Scholar] [CrossRef]
- Crawley, M.J. The R Book, 2nd ed.; John Wiley & Sons: West Sussex, UK, 2013. [Google Scholar]
- Zuur, A.F.; Ieno, E.N.; Walker, N.; Saveliev, A.A.; Smith, G.M. Mixed Effects Models and Extensions in Ecology with R; Springer: New York, NY, USA, 2009. [Google Scholar]
- Lechthaler, S.; Waldschläger, K.; Sandhani, C.G.; Sannasiraj, S.A.; Sundar, V.; Schwarzbauer, J.; Schüttrumpf, H. Baseline Study on Microplastics in Indian Rivers under Different Anthropogenic Influences. Water 2021, 13, 1648. [Google Scholar] [CrossRef]
- Matus Ruiz, M.; Carrillo, J. Las pymes intensivas en conocimiento de Ciudad Juárez: Diversidad de trayectorias, prácticas y entendimientos sobre la I4.0 (L. Cejudo-Espinosa, Trad.). Front. Norte 2021, 33, 1–25. [Google Scholar] [CrossRef]
- City of El Paso. Economic and International Development. Industry and Jobs. 2022. Available online: https://www.elpasotexas.gov/economic-development/economic-snapshot/industry-and-jobs (accessed on 26 February 2024).
- Texas Water Code. Subtitle D. Chapter 26. Subchapter D. In Prohibition Against Pollution; Reinforcement; West Publishing: Eagan, MN, USA, 1984. Available online: https://statutes.capitol.texas.gov/?tab=1&code=WA&chapter=WA.26&artSec= (accessed on 8 August 2024).
- Norma Oficial Mexicana (Official Mexican Norm): NOM-001-SEMARNAT-2021. 2022. Available online: https://www.dof.gob.mx/nota_detalle.php?codigo=5645374&fecha=11/03/2022#gsc.tab=0 (accessed on 6 December 2025).
- IBWC. Convention Between the United States and Mexico. Equitable Distribution of the Waters of the Rio Grande. 2022. Available online: https://www.ibwc.gov/wp-content/uploads/2022/11/1906Conv.pdf (accessed on 29 February 2024).
- Ward, G.H.; Schmandt, J. The Rio Grande/Río Bravo Basin. In Sustainability of Engineered Rivers in Arid Lands, 1st ed.; Schmandt, J., Kibaroglu, A., Buono, R., Thomas, S., Eds.; Cambridge University Press: Cambridge, UK, 2021; pp. 181–219. [Google Scholar] [CrossRef]
- IBWC. Monitoring Station Water Quality Data. 2025. Available online: https://www.ibwc.gov/crp/monitoring-station-water-quality-data/ (accessed on 20 May 2025).
- Xia, F.; Yao, Q.; Zhang, J.; Wang, D. Effects of seasonal variation and resuspension on microplastics in river sediments. Environ. Pollut. 2021, 286, 117403. [Google Scholar] [CrossRef] [PubMed]
- Napper, I.E.; Thompson, R.C. Release of synthetic microplastic plastic fibres from domestic washing machines: Effects of fabric type and washing conditions. Mar. Pollut. Bull. 2016, 112, 39–45. [Google Scholar] [CrossRef] [PubMed]
- Ding, L.; Mao, R.F.; Guo, X.; Yang, X.; Zhang, Q.; Yang, C. Microplastics in surface waters and sediments of the Wei River, in the northwest of China. Sci. Total Environ. 2019, 667, 427–434. [Google Scholar] [CrossRef] [PubMed]
- Sekudewicz, I.; Dąbrowska, A.M.; Syczewski, M.D. Microplastic pollution in surface water and sediments in the urban section of the Vistula River (Poland). Sci. Total Environ. 2020, 762, 143111. [Google Scholar] [CrossRef]
- Xu, Y.; Chan, F.K.S.; Johnson, M.; Stanton, T.; He, J.; Jia, T.; Wang, J.; Wang, Z.; Yao, Y.; Yang, J.; et al. Microplastic pollution in Chinese urban rivers: The influence of urban factors. Resour. Conserv. Recycl. 2021, 173, 105686. [Google Scholar] [CrossRef]
- Alam, M.J.; Shammi, M.; Tareq, S.M. Distribution of microplastics in shoreline water and sediment of the Ganges River Basin to Meghna Estuary in Bangladesh. Ecotoxicol. Environ. Saf. 2023, 266, 115537. [Google Scholar] [CrossRef]
- Assadian, N.W.; Esparza, L.C.; Fenn, L.B.; Ali, A.S.; Miyamoto, S.; Figueroa, U.V.; Warrick, A.W. Spatial variability of heavy metals in irrigated alfalfa fields in the upper Rio Grande River basin. Agric. Water Manag. 1998, 36, 141–156. [Google Scholar] [CrossRef]
- Comision Internacional de Límites y Aguas (CILA). Formulación Del Programa De Saneamiento De La Frontera Norte A Nivel Gran Visión (Formulation of the Northern Border Sanitation Program at a Grand Vision LevelComisión; Asociados: Torreón, Mexico, 2021. (In Spanish) [Google Scholar]
- IBWC. Basin Highlights Report. 2023. Available online: https://www.ibwc.gov/wp-content/uploads/2023/07/2022-BHR.pdf (accessed on 16 February 2024).
- Ziajahromi, S.; Neale, P.A.; Telles Silveira, I.; Chua, A.; Leusch, F.D.L. An audit of microplastic abundance throughout three Australian wastewater treatment plants. Chemosphere 2021, 263, 128294. [Google Scholar] [CrossRef]
- Bullard, J.E.; Ockelford, A.; O’Brien, P.; McKenna Neuman, C. Preferential transport of microplastics by wind. Atmos. Environ. 2021, 245, 118038. [Google Scholar] [CrossRef]
- Casella, C.; Cornelli, U.; Ballaz, S.; Zanoni, G.; Merlo, G.; Ramos-Guerrero, L. Plastic Smell: A Review of the Hidden Threat of Airborne Micro and Nanoplastics to Human Health and the Environment. Toxics 2025, 13, 387. [Google Scholar] [CrossRef]
- Sun, J.; Peng, Z.; Zhu, Z.R.; Fu, W.; Dai, X.; Ni, B.J. The atmospheric microplastics deposition contributes to microplastic pollution in urban waters. Water Res. 2022, 225, 119116. [Google Scholar] [CrossRef]
- He, B.; Smith, M.; Egodawatta, P.; Ayoko, G.A.; Rintoul, L.; Goonetilleke, A. Dispersal and transport of microplastics in river sediments. Environ. Pollut. 2021, 279, 116884. [Google Scholar] [CrossRef]
- Gerolin, C.R.; Pupim, F.N.; Sawakuchi, A.O.; Grohmann, C.H.; Labuto, G.; Semensatto, D. Microplastics in sediments from Amazon rivers, Brazil. Sci. Total Environ. 2020, 749, 141604. [Google Scholar] [CrossRef]
- Instituto Nacional de Estadística y Geografía (INEGI). Número de Habitantes (Number of inhabitants). 2020. Available online: https://cuentame.inegi.org.mx/monografias/informacion/chih/poblacion/ (accessed on 24 January 2024). (In Spanish)
- United States Census Bureau. Quick Facts. El Paso County. Population Estimates. 2023. Available online: https://www.census.gov/quickfacts/fact/table/elpasocountytexas/PST045223 (accessed on 24 January 2024).
- Xu, Z.; Zuo, D. Simulation of blue and green water resources in the Wei River basin, China. Proc. Int. Assoc. Hydrol. Sci. 2014, 364, 486–491. [Google Scholar] [CrossRef]
- City Population. Warsaw Population. 2023. Available online: https://www.citypopulation.de/en/poland/warsaw/ (accessed on 3 June 2025).


Disclaimer/Publisher’s Note: The statements, opinions and data contained in all publications are solely those of the individual author(s) and contributor(s) and not of MDPI and/or the editor(s). MDPI and/or the editor(s) disclaim responsibility for any injury to people or property resulting from any ideas, methods, instructions or products referred to in the content. |
© 2026 by the authors. Licensee MDPI, Basel, Switzerland. This article is an open access article distributed under the terms and conditions of the Creative Commons Attribution (CC BY) license.