Abstract
Background: Malignant breast cancer is the most common cancer affecting women worldwide. The COVID-19 pandemic appears to have slowed the diagnostic process, leading to an enhanced use of invasive approaches such as mastectomy. The increased use of a surgical procedure pushes towards an objective analysis of patient flow with measurable quality indicators such as length of stay (LOS) in order to optimize it. Methods: In this work, different regression and classification models were implemented to analyze the total LOS as a function of a set of independent variables (age, gender, pre-op LOS, discharge ward, year of discharge, type of procedure, presence of hypertension, diabetes, cardiovascular disease, respiratory disease, secondary tumors, and surgery with complications) extracted from the discharge records of patients undergoing mastectomy at the ‘San Giovanni di Dio e Ruggi d’Aragona’ University Hospital of Salerno (Italy) in the years 2011–2021. In addition, the impact of COVID-19 was assessed by statistically comparing data from patients discharged in 2018–2019 with those discharged in 2020–2021. Results: The results obtained generally show the good performance of the regression models in characterizing the particular case studies. Among the models, the best at predicting the LOS from the set of variables described above was polynomial regression, with an R2 value above 0.689. The classification algorithms that operated on a LOS divided into 3 arbitrary classes also proved to be good tools, reaching 79% accuracy with the voting classifier. Among the independent variables, both implemented models showed that the ward of discharge, year of discharge, type of procedure and complications during surgery had the greatest impact on LOS. The final focus to assess the impact of COVID-19 showed a statically significant increase in surgical complications. Conclusion: Through this study, it was possible to validate the use of regression and classification models to characterize the total LOS of mastectomy patients. LOS proves to be an excellent indicator of performance, and through its analysis with advanced methods, such as machine learning algorithms, it is possible to understand which of the demographic and organizational variables collected have a significant impact and thus build simple predictors to support healthcare management.
1. Introduction
Breast cancer is the most frequent malignant tumor in women worldwide and in its early non-metastatic stages is curable in about 70–80% of patients [1]. In Italy, the reference country for this study, breast cancer affects about one in nine women, with about 53,000 new diagnoses each year [2]. This disease has a strong impact on women’s health, survival, and lives [3].
There are three main subtypes of breast cancer that depend on a specific hormone receptor [4]. For non-metastatic carcinoma, according to the guidelines [5,6], the main goals are eradication of the tumor and regional lymph nodes and prevention of metastasis.
Over the years, surgery has evolved in favor of increasingly conservative approaches. Breast-conserving surgery (BCS), now widespread in developed countries, is preferable to a more invasive approach called mastectomy. Mastectomy is a surgery technique in which the surgeon removes the entire breast. There are different types of mastectomies, depending on the procedure and the amount of tissue removed [7].
However, the disadvantages related to the persistence of suspicious microcalcifications on imaging or positive pathologic margins [8] or to specific conditions such as large breast tumor/size ratio, multicentric tumor, etc. [6], to date, justify the use of the invasive procedure. In particular, Morrow et al. [9] report that in the analyzed population: 13.4% underwent mastectomy on the surgeon’s recommendation, usually due to a contraindication to BCS or radiation; 8.8% of patients underwent initial mastectomy based on the patient’s direct decision; and 8.8% underwent mastectomy after 1 or more failed BCS attempts. In addition, contralateral prophylactic mastectomy (CPM) performed on patients with unilateral breast cancer is increasing in the United States (from 1.8% in 1998 to 4.5% in 2003), which has an incidence of 0.5–0.75% [10], although its use has not led to increased survival [11].
From an economic perspective, Capri et al. [12] showed that the average cost of diagnosis was €414, the average cost of treatment was €8780, the average total cost of follow-up was approximately €2351, and the average total direct medical cost was €10,970. Hospitalization accounted for 71% of the total cost (average cost €8242) and, among the variables, age was correlated with lower treatment expenditure, while comorbidities limited the cost of diagnosis.
Given the economic impact and the increasing number of diagnoses, managing the process from a health management perspective is critical. Healthcare data have proven to be important in the diagnosis of different diseases, with the support of several tools such as data mining [13,14,15,16,17] or fuzzy logic [18,19], but also in the optimization of processes [20,21,22,23,24], exploiting techniques such as Lean Six Sigma [25,26,27,28]. One parameter used in several studies as a quality indicator is length of stay (LOS) [29]. LOS is a multidimensional parameter, a function of pathology and other patient factors, but also of organizational and institutional factors [30]. Several studies have validated linear regression models in classifying and predicting LOS in different healthcare settings [31,32]. Sun et al. [33] demonstrated that longer LOS is associated with higher readmission, while modeling LOS using linear regression models showed that the presence of reconstructive surgery and renal disease were highly predictive of longer LOS. Mandelbaum et al. [34], on the other hand, showed that a longer LOS is associated with the execution of immediate breast reconstruction, while Butz et al. [35] used regression models to analyze the impact that different post-operative pain management techniques have on LOS. Finally, Tartter et al. [36] identified several risk factors, such as age, history of heart disease, hypertension, diabetes, and obesity, with logistic regression, while Manum et al. [37] reported a strong influence of year of surgery, type of procedure, diagnosis of anxiety, or depression and age.
To date, we are not aware of any work conducted in Italy that includes a large number of patients, the use of classification algorithms, and the description of the impact of COVID-19.
In this study, regression and classification models will be used to study the LOS of patients undergoing mastectomy at the University Hospital “San Giovanni di Dio e Ruggi d’Aragona” of Salerno (Italy). In particular, given the multidisciplinary nature of LOS, clinical and demographic variables of patients involved in the analysis will be included in the model. Gender, age, discharge ward, type of procedure, hypertension, diabetes, cardiovascular disease, respiratory disease, secondary tumors, surgery with complications, and pre-operative LOS will be used as independent variables in the regression and classification models in order to identify the main risk factors. In addition, the impact of COVID-19 will be investigated through the implementation of statistical analysis on the variables under study.
The following sections will present the methods and results, first of the regression models, then of the implementation of the classification algorithms after splitting the LOS into 3 arbitrary classes, and finally, of the statistical comparison of patients discharged in 2018–2019 with those discharged in 2020–2021 in order to assess the impact of COVID-19 on the variables presented above.
2. Materials and Methods
The research was conducted at the University Hospital “San Giovanni di Dio e Ruggi D’Aragona” of Salerno and, in particular, in the three departments of General Surgery, Day Surgery and Breast Unit. A study was previously conducted in these wards to assess the impact of COVID-19 on admissions by comparing 2019 and 2020 data [38]. This time, the aim of the study was to create a model to study the LOS of mastectomy patients. For this purpose, information on all patients who underwent mastectomy (DRGs: 257, 258, 259 and 260) from 2011 to 2021 in ordinary inpatient care was extracted from the hospital’s information system, the QuaniSDO. In particular, the dataset consisted of 1123 records and contained the following variables, as required by the strategic management:
- Gender (Male/Female);
- Age;
- Discharge ward:
- ○
- 0911: General Surgery;
- ○
- 0912: General Surgery;
- ○
- 0914: General Surgery;
- ○
- 0921: General Surgery;
- ○
- 0941: General Surgery;
- ○
- 0915: Breast Unit;
- ○
- 1211: Plastic Surgery;
- ○
- 2411: Infectious Disease;
- ○
- 2911: Nephrology;
- ○
- 6411: Oncology.
- Type of procedure:
- ○
- 8512: Open Biopsy of the Breast;
- ○
- 8520: Removal or Demolition of Breast Tissue;
- ○
- 8521: Local Removal of Breast Injury;
- ○
- 8522: Breast Quadrectomy;
- ○
- 8523: Subtotal Mastectomy;
- ○
- 8532: Bilateral Reductive Mammoplasty;
- ○
- 8533: Unilateral Subcutaneous Mammectomy with Simultaneous Implantation of Prosthesis;
- ○
- 8534: Other Unilateral Subcutaneous Mammectomy;
- ○
- 8535: Bilateral Subcutaneous Mammectomy with Simultaneous Implantation of Prosthesis;
- ○
- 8541: Unilateral Simple Mastectomy;
- ○
- 8542: Bilateral Simple Mastectomy;
- ○
- 8543: Unilateral Enlarged Simple Mastectomy;
- ○
- 8544: Bilateral Enlarged Simple Mastectomy;
- ○
- 8545: Unilateral Radical Mastectomy;
- ○
- 8546: Bilateral Radical Mastectomy;
- ○
- 8547: Unilateral Enlarged Radical Mastectomy;
- ○
- 8548: Bilateral Enlarged Radical Mastectomy.
- ○
- 8553: Unilateral Prosthesis Implantation;
- ○
- 8554: Bilateral Prosthesis Implantation;
- ○
- 8599: Other Breast Surgeries;
- Hypertension (Yes/No);
- Diabetes (Yes/No);
- Cardiovascular disease (Yes/No);
- Respiratory disease (Yes/No);
- Secondary tumors (Yes/No);
- Surgery with complications (Yes/No);
- Pre-operative LOS.
The data were extracted from the computer system using the DRGs listed above and the year of discharge as inclusion criteria. On the other hand, patients discharged with these DRGs but admitted to a day hospital regime and therefore characterized by a LOS of zero were excluded. From the records that respected the following criteria, the variables age, gender, admission and discharge dates, primary and secondary diagnoses, and the main procedure and its date of execution were extracted in Excel format. The dataset was anonymous and did not contain any variables that could exactly determine a specific patient. From the extracted variables, the independent variables and the dependent variable of the models were obtained.
Table 1 provides a detailed description of the available dataset.

Table 1.
Dataset description.
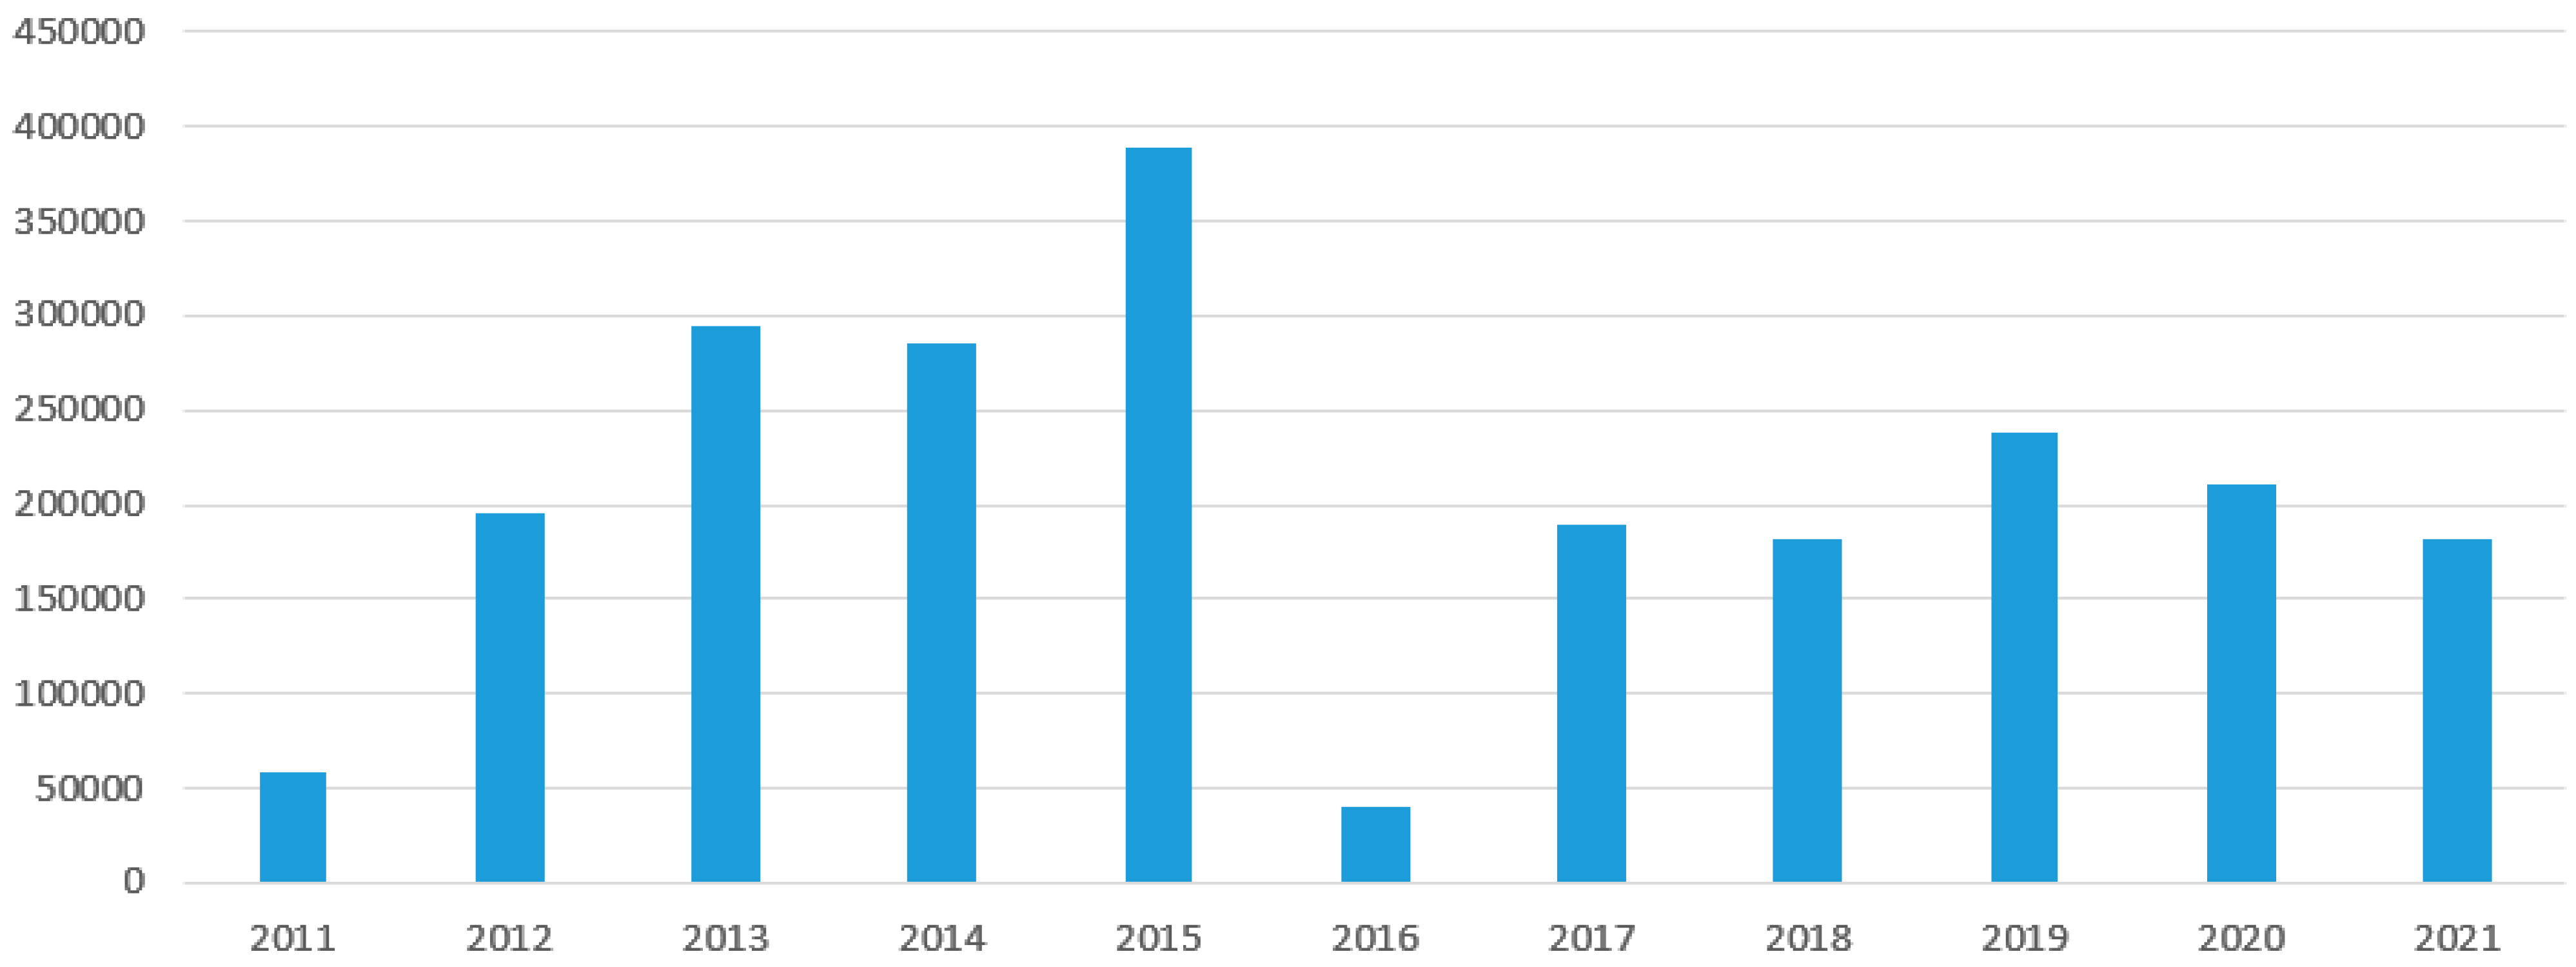
To assess the impact of COVID-19, Figure 1 shows the trend in the total number of cases treated according to the year of discharge.

Figure 1.
Discharge distributions of patients undergoing mastectomy included in the study, by year.
As the graph shows, with the exception of 2016 when a system-related reduction was observed, a sharp decline in cases was observed from 2019 onwards, which continued in 2021 when elective surgery restarted. This can be explained by the reduction in the number of people having scheduled preventive check-ups.
To further study the inpatient stay, it was decided to divide the patients into 3 groups according to the assumed value of LOS:
- Class 0: LOS ≤ 3;
- Class 1: 4 ≤ LOS ≤ 7;
- Class 2: LOS ≥ 8.
The values were assigned arbitrarily in order to obtain a homogeneous distribution.
2.1. Regression Algorithms
First, the LOS was analyzed using regression models. In particular, the multiple linear regression (MLR) and the regression version of the random forest, gradient-boosted tree, XGBoost, and polynomial regression algorithms were implemented. In order to use the MLR model, it is essential that the following six assumptions are verified:
- (1)
- The linear relationship between the independent and dependent variable;
- (2)
- Absence of multicollinearity;
- (3)
- The independence of the residuals;
- (4)
- The residuals have constant variance;
- (5)
- The residuals are normally distributed;
- (6)
- Absence of outliers.
SPSS Statistics [39] was used to verify the assumptions and then to implement the model:
where y is the dependent variables, i.e., LOS; xi are the independent variables; is the intercept; and are the coefficients. The model therefore aims to search for the best coefficients to linearly link the LOS with the independent variables by minimizing an error function that is generally obtained as the sum of the squares of the deviations.
The other regression algorithms, i.e., random forest (RF), gradient-boosted tree (GBT), XGBoost, and polynomial regression, were implemented using the KNIME Analytics Platform. RF and GBT are tree-based algorithms that harness the power of multiple decision trees to make decisions. As the name suggests, RF is a “forest” of trees. The algorithm combines the output of multiple (randomly created) decision trees to generate the final output [40,41]. The XGBoost algorithm is a gradient-boosting algorithm that involves the progressive addition of weak predictors, such as decision trees, for performance optimization. At its base, it uses the gradient descent optimization algorithm, from which it takes its name [42]. Finally, polynomial regression is based on the identification of a non-linear relationship between the independent variables xi and the dependent variable y. Specifically, the relationship identified is a polynomial relationship of degree h that allows the link between the variables to have a better characterization when it is far from linear. However, the model is always considered a form of linear regression since the relationship with the coefficients remains linear [43]. For performance evaluation, the dataset was partitioned 80% for the training set and 20% for the test set. This 20 per cent is not used for training but only to evaluate the performance of the model.
2.2. Classification Algorithms
After performing the decomposition, using a Python script on Google Colaboratory (Colab) Cloud Platform [44] 4, different classification algorithms were implemented using the scikit-learn library [45]: decision tree (DT), random forest (RF), support vector machine (SVM), and naïve bayes (NB).
A DT is a supervised machine learning algorithm that can be used for both classification and regression problems. A DT is simply a series of sequential decisions made to achieve a specific result. At the level of each node, one of the features is analyzed, and depending on its value, a specific path is followed to take the predictive process from the root to the leaves, where the output is determined. RF, as anticipated above, evolves the DT concept by building a stronger predictor [46]. SVM can be used not only as a classifier but also as a regression method, keeping at the base the same main idea of the classifier: minimizing error by finding a hyperplane in an N-dimensional space, where N depends on the number of variables, and considering a tolerance margin that is not part of the classification process [47]. There are several implementations of this algorithm in the clinical field [48]. Finally, NB is a statistical classifier based on Bayes’ theorem, although it is based on the simplifying assumption of conditional independence of classes, from which it takes the name naïve [49]. In addition to the individual algorithms, the implementation of the voting classifier (VC) was chosen. This classifier uses the prediction of the 4 previously presented classifiers to determine the correct assignment to a class via the majority policy [50].
To improve the results obtained, all algorithms were subjected to an optimization process. In particular, a set of values of the main hyperparameters was selected for each of them, as shown in Table 2.
Table 2.
Selected values of each hyperparameter.
The first stage of the process involved partitioning between train and test sets. By using the k-fold cross validator tool [51], this partitioning was not static, but cv = 10 pairs of training (80 percent) and test (20 percent) were made to make the output independent of the particular partitioning used, albeit randomly. Finally, by combining it with the GridSearchCV tool [52], it is possible to search for the best hyperparameters for each algorithm.
2.3. Statistical Analysis
In the complex operative units of general surgery, day surgery, and breast surgery included in this work, a previous study was conducted to assess the impact of COVID-19 on their hospital activities [38]. Italy was the first European country to be involved in the pandemic, and the corrective actions put in place required that outpatient surgical activities, as well as radiological examinations, be granted only for emergencies by suspending screening and elective activities. This will result in a more advanced clinical presentation of breast cancer and more frequent recourse to the mastectomy, which demonstrates the importance of this study [6].
To assess the impact of COVID-19, at the end of processing, it was decided to divide the dataset into two subgroups according to the year of discharge:
- Group 0: all patients discharged in the two-year period 2018–2019 (pre-COVID);
- Group 1: all patients discharged in the biennium 2020–2021 (COVID era).
All variables already presented and used in the models were used to compare the two groups, and statistical analysis was implemented. After checking the non-normality of the distributions with the Kolmogorov–Smirnov test, U–Mann–Whitney (MW) and chi-squared tests with a 95% confidence interval were implemented.
3. Results
First, the linear relationship between the dependent variable and each independent variable was tested by producing scatter plots. Figure 2 shows the graph for the pre-operative LOS variable.
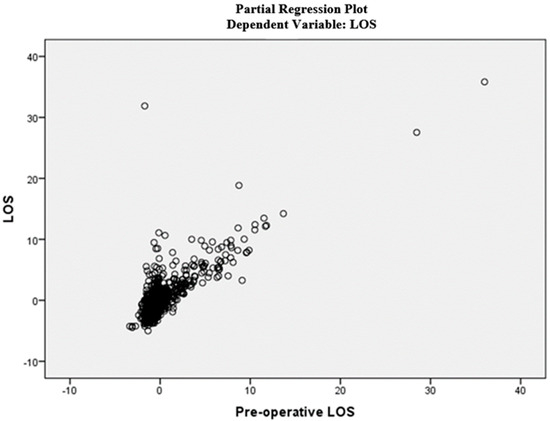
Figure 2.
Partial regression plot (pre-op LOS).
Pearson’s correlation, tolerance, and variance inflation factor (VIF) were then calculated to demonstrate the absence of multicollinearity. All variables are a function of the correlation between the i-th independent variable and the others. Table 3 shows the results of the Pearson correlation.
Table 3.
Pearson Correlation.
All values are below 0.8, as they should be [50]. Tolerance and VIF for each independent variable are shown in Table 4.
Table 4.
Collinearity statistics.
As can be seen, the VIF values are always less than 10 and the tolerance values are always above 0.2, so the second hypothesis was verified [53].
Then, the independence of the residuals was demonstrated by performing the Durbin–Watson statistical test. The Durbin–Watson statistic is a statistical test to detect autocorrelation in the residuals of a regression analysis. The result is always between 0 and 4, where the mean value represents the absence of autocorrelation in the sample. In this particular study, the result is 1.850, which is therefore within the acceptability range of [1.7; 2.3] [54]. Then, it was checked with appropriate graphs to ensure that the residuals have constant variance and are normally distributed. Finally, Cook’s distance was calculated to verify the absence of outliers. For each observation, Cook’s distance is less than 1. Thus, there are no outliers causing bias.
After ensuring that all six assumptions were verified, the MLR model was implemented with SPSS software, and Table 5 shows its performance.
Table 5.
Model summary.
R2 was 0.671, which is a very good value considering that the maximum can be 1 [55]. It indicates how well the terms (data points) fit a curve or line.
Table 6 shows the coefficients of the above equation and the results of the t-test at a 95% significance level.
Table 6.
Standardized and unstandardized coefficients with p-values.
The independent variables showed that those with the greatest impact on LOS were also hypertension, cardiovascular and respiratory diseases, the type of procedure, year of discharge, and complications during surgery, with the exception of pre-operative LOS included in LOS by definition.
Finally, the other regression algorithms were implemented with the KNIME software, resulting in the performance metric [56] shown in Table 7.
Table 7.
Evaluation metrics for the regression analysis.
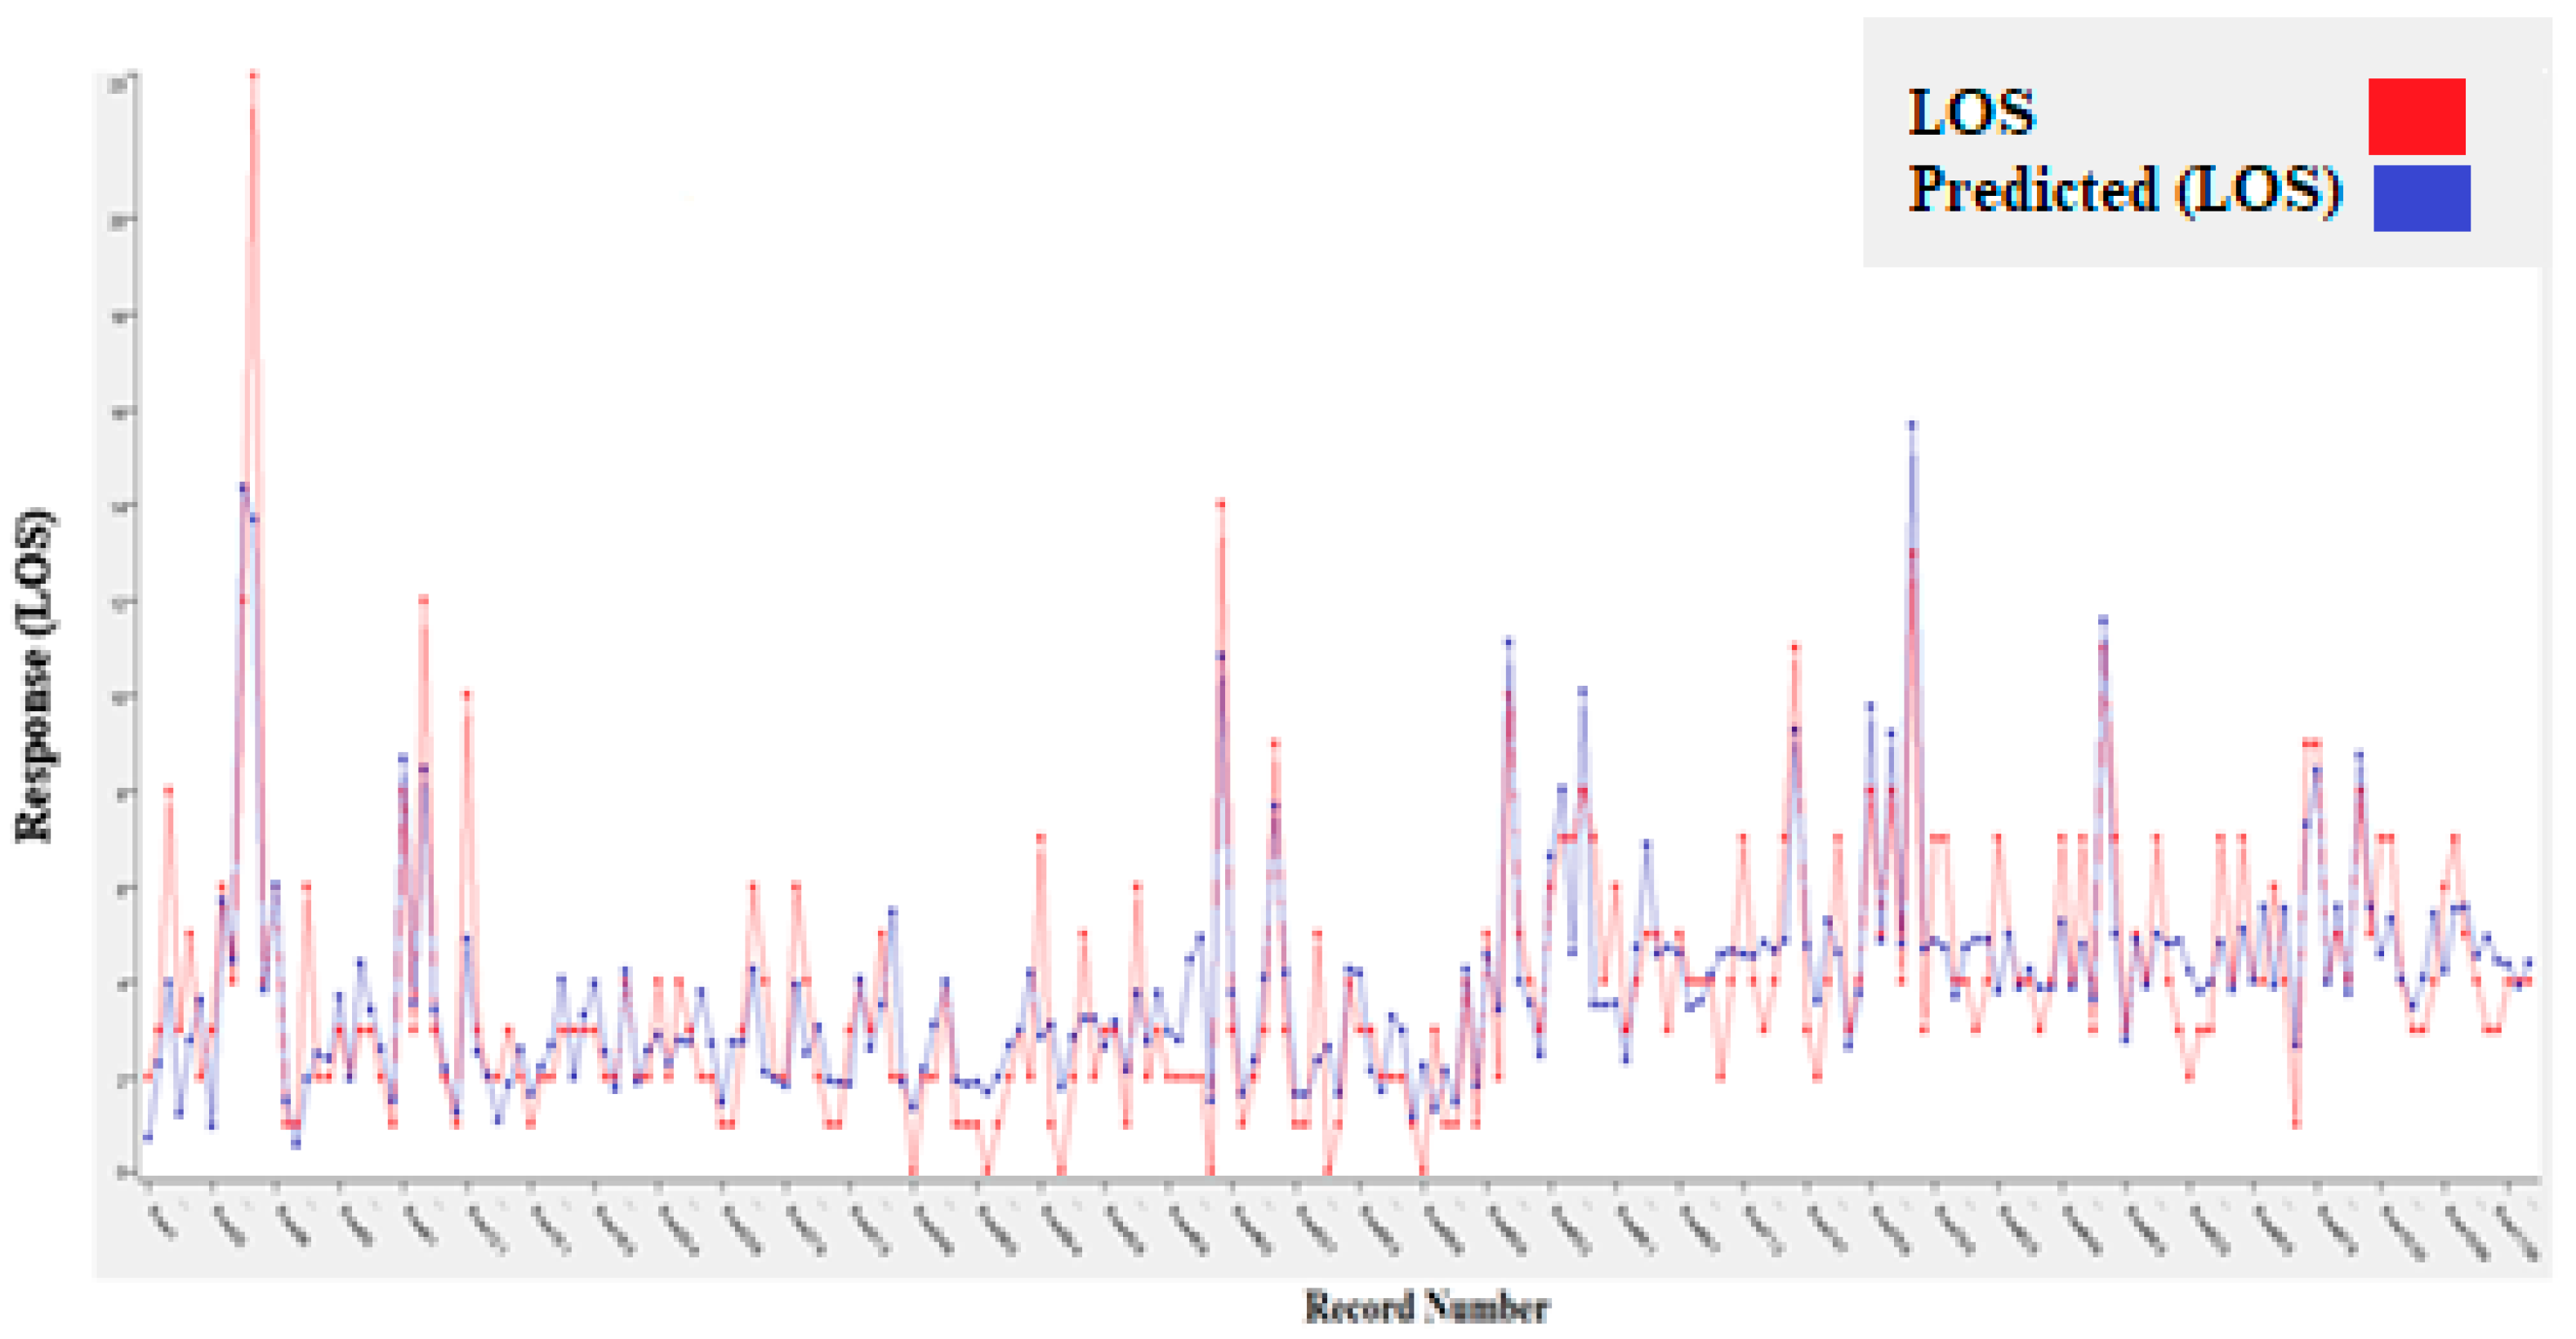
The best algorithm overall, also considering the MLR model, was the polynomial regression, with an R2 of 0.689 and a RMSE of 1.562. Figure 3 shows the diagrams of the predictions (blue) made with the relative errors for the best algorithm used.
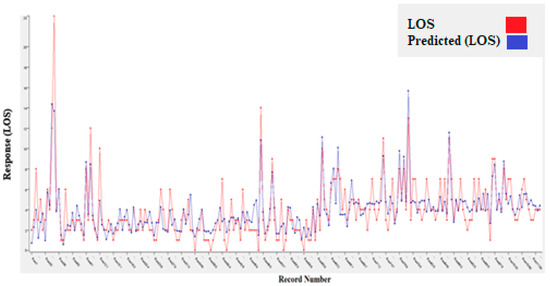
Figure 3.
Polynomial regression.
Having completed the regression study, we proceeded to analyze the LOS divided into classes. Before proceeding to present the results of the different classifiers, the optimal hyperparameters obtained as a result of the optimization operations are shown in Table 8.
Table 8.
Best parameters.
Using the parameters provided in Table 8, the performance parameters [57] highlighted in Table 9 were obtained.
Table 9.
Performance metrics of all selected algorithms.
Among the implemented algorithms, the RF had the best performance (accuracy = 78%). The worst results were obtained on the second class, which is associated with patients with intermediate LOS.
Figure 4 shows the ROC curves for RF.
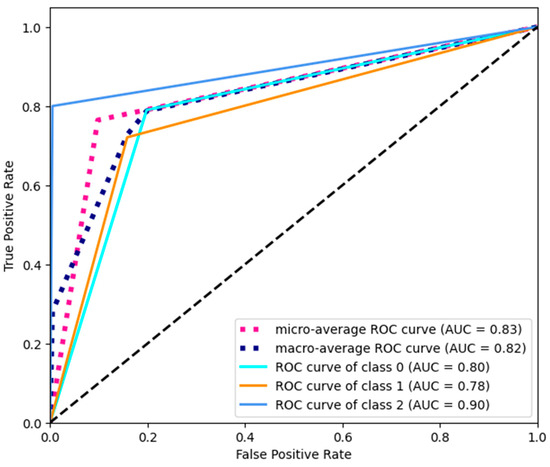
Figure 4.
ROC curves.
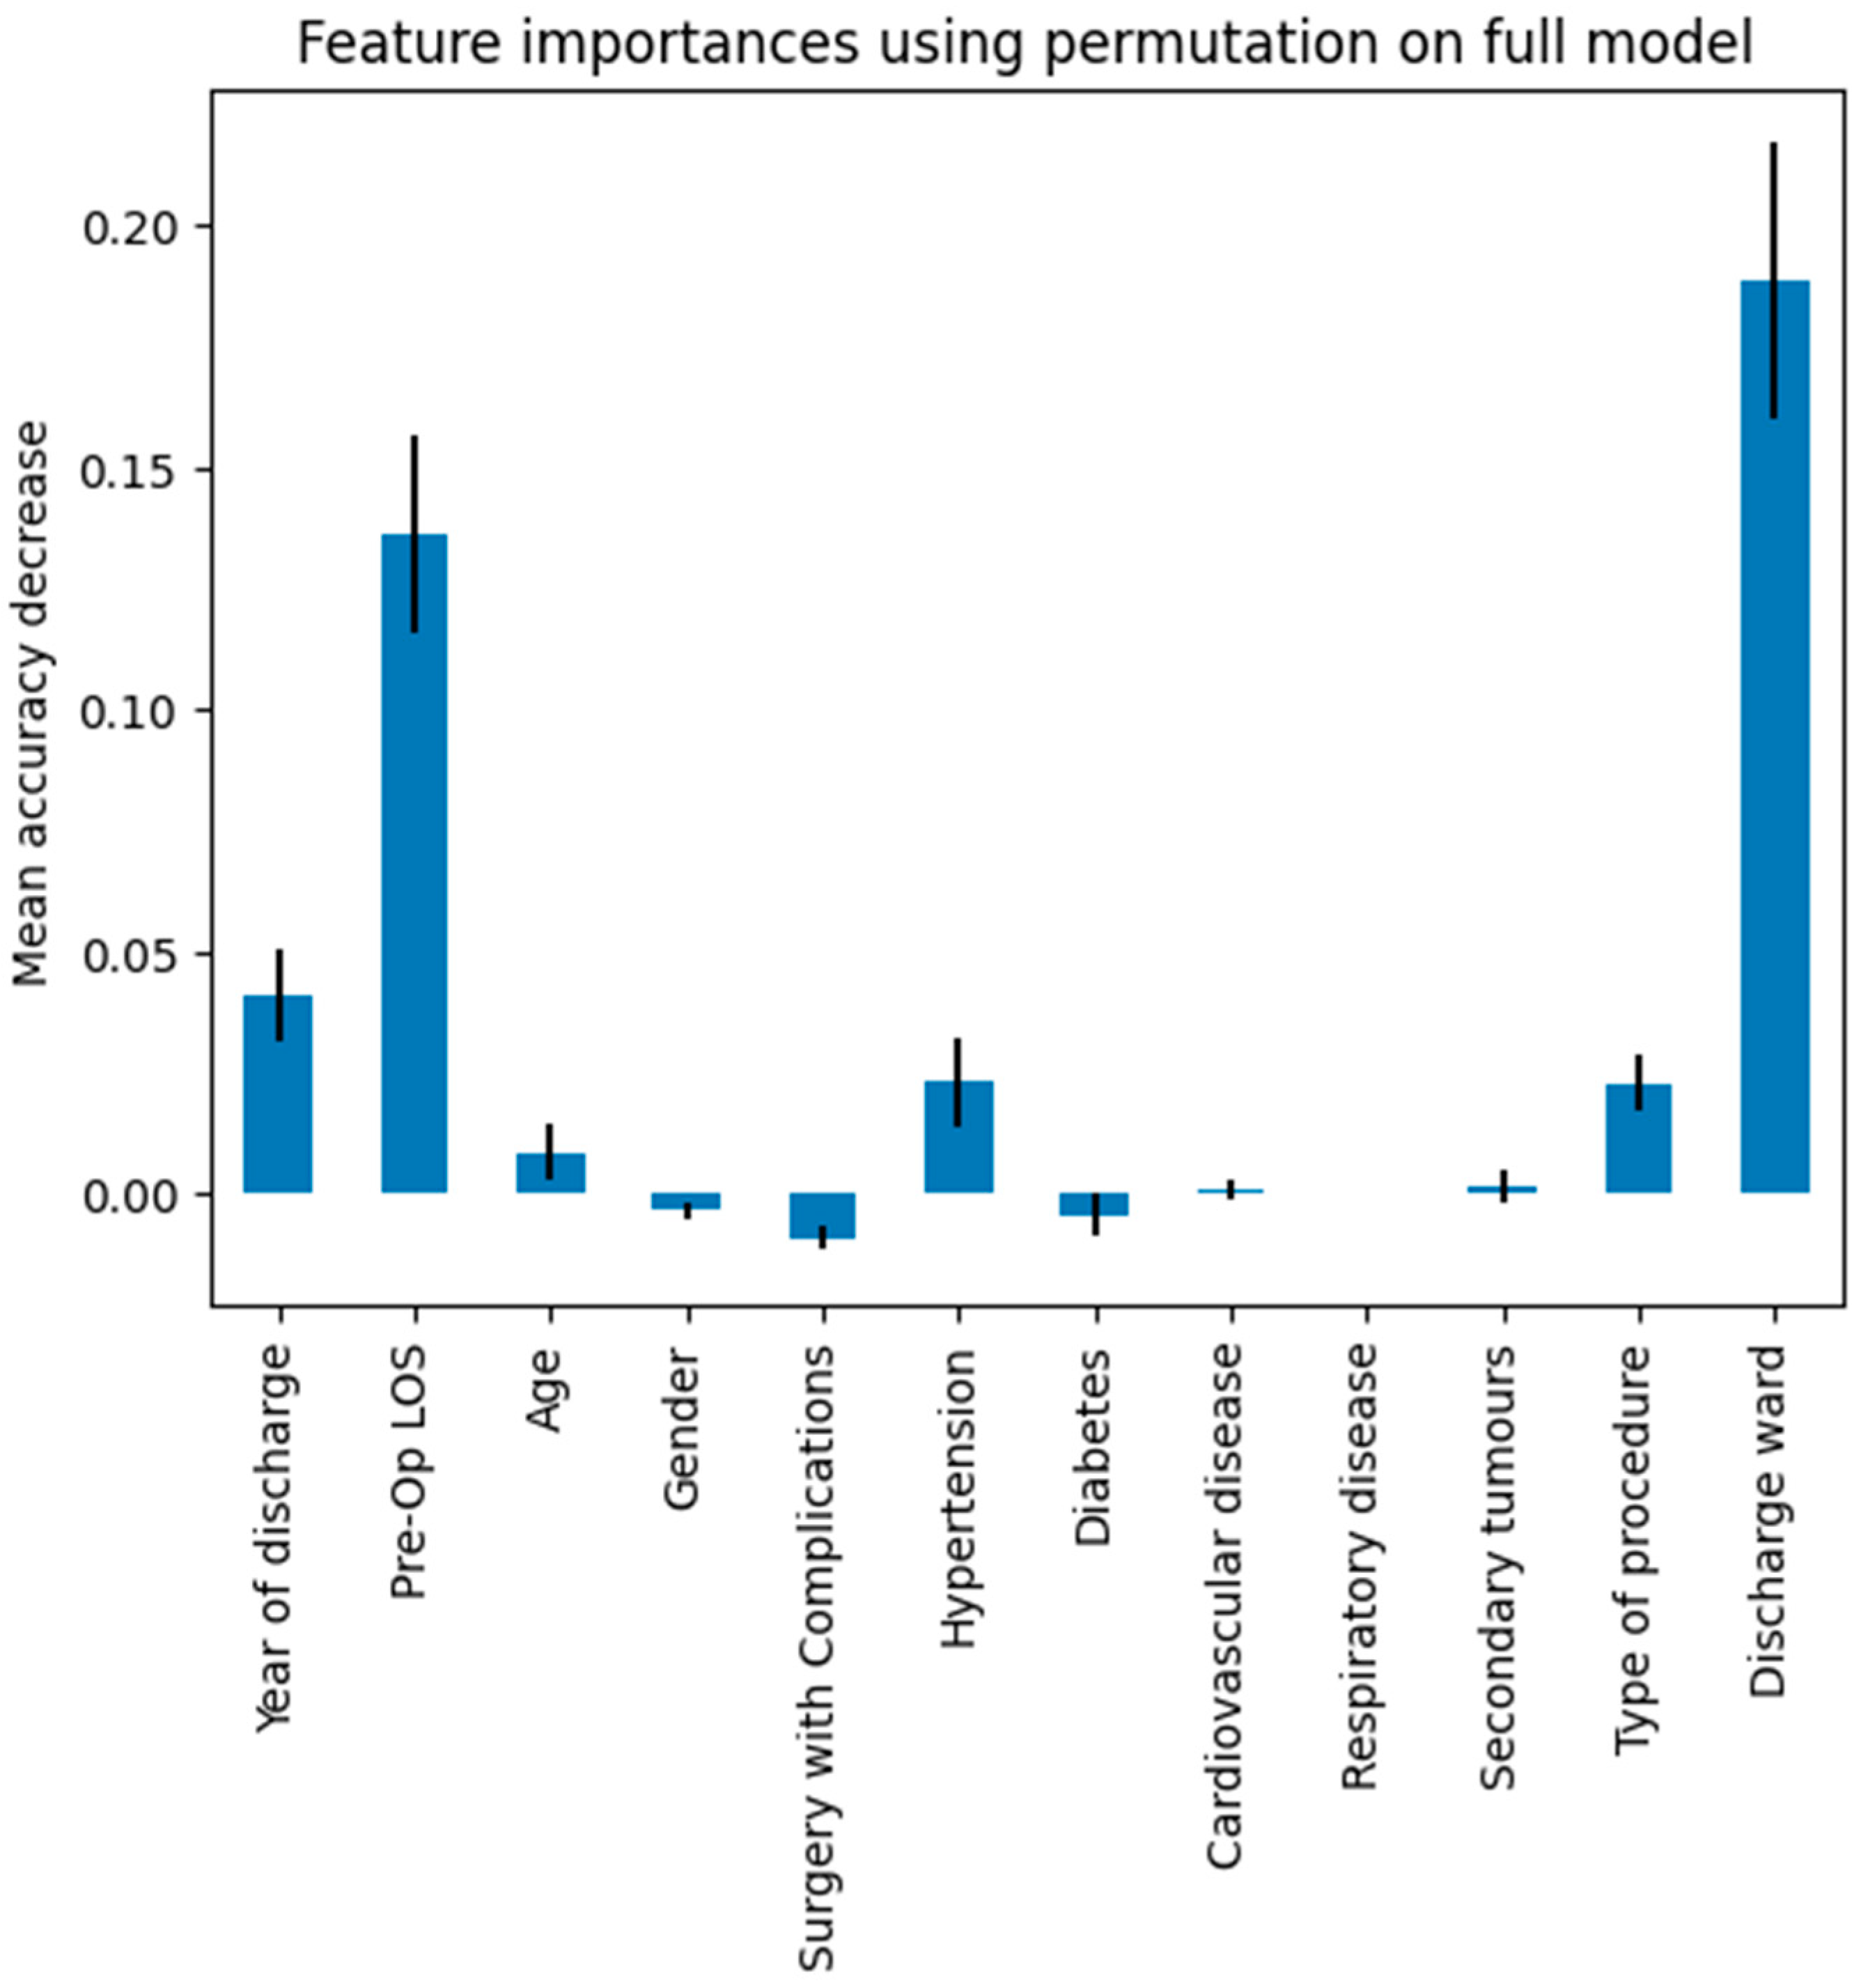
Compared to the “no benefit” black dotted line in Figure 4, the curve with a higher area was precisely that associated with class 2, that is, patients with prolonged LOS. In general, the micro-average ROC curve had a greater area of 0.83. As with the regression analysis, the impact of the independent variables was investigated. For this purpose, the permutation feature importance technique was used, which involves evaluating the performance of the algorithm using a corrupted version of one of the independent variables. Figure 5 shows the impact on accuracy of the corrupted version of each of the independent variables considered.

Figure 5.
Permutation feature importance.
As shown previously, the variables discharge ward, year of discharge, type of procedure, and surgery with complications had the greatest impact on LOS.
Finally, the VC was implemented. By combining the optimized algorithms, the best accuracy of 0.788 was obtained.
At the end of the analysis, it was decided to focus on the impact of COVID-19. To this end, the distributions of the variables selected in this study were compared for two two-year periods: 2018–2019 (pre-COVID) and 2020–2021 (mid-pandemic). Table 10 reports the results obtained.
Table 10.
COVID-19 Impact.
The most significant result is obtained for the variable surgery with complications. The distribution showed that the number of complicated cases increased significantly in the COVID-19 era.
4. Discussion
In this work, different regression and classification models were implemented to study the total LOS for patients undergoing mastectomy surgery. For this purpose, data associated with 1123 patients who underwent mastectomy for a diagnosis of malignant breast cancer from 2011 to 2021 at the University Hospital “San Giovanni di Dio e Ruggi d’Aragona” of Salerno (Italy) were used. Among the different models tested, the best was polynomial regression (PR), with an R2 of 0.689 and a RMSE of 1.562. The R2 value obtained is well above the threshold value of 0.5, demonstrating the excellent performance of the model in characterizing the real situation. The implementation of the MLR model, although with a slightly lower performance than PR, allowed us to highlight the independent variables that most influence the LOS by applying appropriate statistical tests. The results showed that there was a significant influence only with hypertension, cardiovascular and respiratory disease, type of procedure, year of discharge, and complications during surgery, whereas expected factors such as age and secondary tumors did not have a significant effect in our case study.
The classification algorithms further enriched the analysis. Of the selected algorithms, it was RF that had the best performance. In particular, as can also be seen from the ROC curves shown in Figure 4, the best performance is obtained precisely on the class that includes patients with prolonged hospitalization, which is the most critical group for healthcare management. Permutation feature importance showed that the variables with the greatest impact on the clustered LOS were discharge ward, year of discharge, type of procedure, and hypertension, partly confirming what the MLR models showed.
The use of regression models to map LOS is not new in the literature. Lee et al. [58] demonstrated that robust mixed gamma regression seems to be a suitable alternative to analyze pediatric LOS, while Austin et al. [59] examined the relative performance of seven different statistical strategies to analyze LOS in a cohort of patients undergoing CABG surgery. Combes et al. [32] tested two linear regression models in order to construct a predictor of LOS in the pediatric emergency department, while Li et al. [60] compared logistic regression and machine learning algorithms to study LOS after total knee arthroplasty. The same is also true for mastectomy, of which different examples have already been presented [33,34,35,36,37].
Regarding the variables that most influence LOS, as demonstrated in [37], year of discharge and type of procedure were already known as risk factors. Furthermore, several studies [24,61,62] show that an increase in pre-operative LOS, being included in the total LOS, is reasonably an indicator of increased hospitalization. The variable discharge ward could also be considered an expected outcome and directly related to specialization. In general surgery departments that do not deal with breast surgery, the lack of specific pathways may cause variations in LOS [63]. Complications after surgery produce an inevitable lengthening of the hospital stay. This is demonstrated by Nwaogu et al. [64], who also analyzed the economic impact of bleeding complications after mastectomy. Precisely in order to limit the economic impact, the 1-day hospitalization approach after mastectomy is being analyzed, which shows several benefits, such as ease of implementation and patient safety [65,66,67].
The analysis of the impact of COVID-19 showed that cases of surgery with complications have increased in recent years. This finding can be easily explained by considering both the blockage of elective surgery that has occurred in the COVID era and the blockage of preventive controls that, especially for women, are conducted to counteract advanced stages of cancer disease. This finding is in line with what has already been presented in the literature [3].
5. Conclusions
In this study we compared the performance of different regression and classification models used to study the total LOS of patients who underwent mastectomy at “San Giovanni di Dio e Ruggi d’Aragona” University Hospital of Salerno (Italy). The novelty introduced in this study is the implementation of regression and classification models, including non-linear models, trained over a wide time interval, and including both clinical and organizational variables.
The results show that patient flow is conditioned by variables such as the ward and year of discharge, the type of procedure, and the presence among the patient’s comorbidities of hypertension. Healthcare management to implement optimization actions can use this information. Specifically, it is possible to devise personalized pathways for patients depending on the type of procedure they have to undergo, maximize the use of specific departments by noting the link between volumes and results, or better investigate the patient’s comorbidities, with a specific focus on hypertension in the pre-hospitalization phase. In addition, the year of discharge can also be further investigated in order to better characterize the impact of COVID-19.
Although the presence of a few similar studies does not allow a detailed discussion of the results obtained—which do demonstrate the novelty brought by our work, especially in the national context—it cannot be considered without limitations. The first limitation is that it was tested on a single case study that does not allow generalization of the results obtained. Added to this is the need to take into account a limited number of comorbidities and the possible impact of additional procedures of equal complexity conducted on the same patient within the single hospitalization. In particular, risk factors know in the literature such as day of admission or tumor stage were not considered. With regard to the techniques implemented, no optimization and cross-validation was carried out for the regression algorithms, few models were tested and no innovative techniques were proposed, but we limited it to using those found in the literature.
Future developments will focus on overcoming some limitations, such as the mono-centricity of the work and the inclusion of a limited number of comorbidities, as well as validating the model by analyzing what happened during the COVID-19 pandemic and implementing additional tools.
Author Contributions
Conceptualization, G.I.; methodology, T.A.T.; validation, T.A.T.; formal analysis, T.A.T.; investigation, T.A.T.; resources, G.I.; data curation, T.A.T.; writing—original draft preparation, T.A.T.; writing—review and editing, G.I.; visualization, T.A.T.; supervision, G.I.; project administration, G.I. All authors have read and agreed to the published version of the manuscript.
Funding
This research received no external funding.
Institutional Review Board Statement
In compliance with the Declaration of Helsinki and with the Italian Legislative Decree 211/2003, Implementation of the 2001/20/CE directive, since no patients/children were involved in the study, the signed informed consent form and the ethical approval are not mandatory for these types of studies. Furthermore, in compliance with the regulations of the Italian National Institute of Health, our study is not reported among those needing assessment by the Ethical Committee of the Italian National Institute of Health.
Informed Consent Statement
Not applicable.
Data Availability Statement
The datasets generated and/or analyzed during the current study are not publicly available for privacy reasons but are available from the corresponding author on reasonable request.
Conflicts of Interest
The authors declare no conflicts of interest.
List of Abbreviations
| LOS | length of stay |
| MLR | multiple linear regression |
| DT | decision tree |
| RF | random forest |
| GBT | gradient boosted tree |
| SVM | support vector machine |
| NB | naïve Bayes |
| VC | voting classifier |
| RMSE | root mean squared error |
References
- Harbeck, N.; Penault-Llorca, F.; Cortes, J.; Gnant, M.; Houssami, N.; Poortmans, P.; Ruddy, K.; Tsang, J.; Cardoso, F. Breast cancer. Nat. Rev. Dis. Primers 2019, 5, 66. [Google Scholar] [CrossRef]
- Associazione Italiana Oncologia Medica (AIOM). I Numeri Del Cancro in Italia 2018 I Numeri Del Cancro in Italia; Associazione Italiana Oncologia Medica: Milano, Italy, 2018. [Google Scholar]
- Vanni, G.; Pellicciaro, M.; Materazzo, M.; Palombi, L.; Buonomo, O.C. Breast cancer diagnosis in coronavirus-era: Alert from italy. Front. Oncol. 2020, 10, 938. [Google Scholar] [CrossRef]
- Waks, A.G.; Winer, E.P. Breast cancer treatment: A review. Jama 2019, 321, 288–300. [Google Scholar] [CrossRef]
- Parker, S. Clinical Guidelines for the Management of Breast Cancer; NHS: London, UK, 2019. [Google Scholar]
- The American Society of Breast Surgeons. Performance and Practice Guidelines for Mastectomy; The American Society of Breast Surgeons: Columbia, MD, USA, 2015. [Google Scholar]
- American Cancer Society, “Mastectomy”. Available online: https://www.cancer.org/cancer/breast-cancer/treatment/surgery-for-breast-cancer/mastectomy.html (accessed on 1 March 2024).
- Breast Cancer. National Comprehensive Cancer Network: National Clinical Practice Guidelines in Oncology. Version 3. 2018. Available online: https://www.nccn.org/professionals/physician_gls/pdf/breast.pdf (accessed on 1 March 2024).
- Morrow, M.; Jagsi, R.; Alderman, A.K.; Griggs, J.J.; Hawley, S.T.; Hamilton, A.S.; Graff, J.J.; Katz, S.J. Surgeon recommendations and receipt of mastectomy for treatment of breast cancer. Jama 2009, 302, 1551–1556. [Google Scholar] [CrossRef]
- Tuttle, T.M.; Habermann, E.B.; Grund, E.H.; Morris, T.J.; Virnig, B.A. Increasing use of contralateral prophylactic mastectomy for breast cancer patients: A trend toward more aggressive surgical treatment. J. Clin. Oncol. 2007, 25, 5203–5209. [Google Scholar] [CrossRef]
- Lostumbo, L.; Carbine, N.E.; Wallace, J. Prophylactic mastectomy for the prevention of breast cancer. Cochrane Database Syst. Rev. 2010, 11, CD002748. [Google Scholar] [CrossRef]
- Capri, S.; Russo, A. Cost of breast cancer based on real-world data: A cancer registry study in Italy. BMC Health Serv. Res. 2017, 17, 84. [Google Scholar] [CrossRef]
- Ponsiglione, A.M.; Marino, M.R.; Raiola, E.; Russo, G.; Borrelli, A.; Improta, G. Predictive Models for Studying Emergency Department Abandonment Rates: A Bicentric Study. In Proceedings of the Biomedical and Computational Biology: Second International Symposium, BECB 2022, Virtual Event, 13–15 August 2022; Revised Selected Papers. Springer International Publishing: Cham, Switzerland, 2023. [Google Scholar]
- Improta, G.; Bottino, V.; Sciambra, A.; Russo, M.A.; Stingone, M.A.; Triassi, M. Data Analysis to Study the Prolonged ED-LOS: The Case of Evangelical Hospital “Betania”. In Proceedings of the Biomedical and Computational Biology: Second International Symposium, BECB 2022, Virtual Event, 13–15 August 2022; Revised Selected Papers. Springer International Publishing: Cham, Switzerland, 2023. [Google Scholar]
- Scala, A.; Borrelli, A.; Improta, G. Predictive analysis of lower limb fractures in the orthopedic complex operative unit using artificial intelligence: The case study of AOU Ruggi. Sci. Rep. 2022, 12, 22153. [Google Scholar] [CrossRef]
- Improta, G.; Donisi, L.; Bossone, E.; Vallefuoco, E.; Ponsiglione, A.M.; Amato, F. Discrete Event Simulation to Improve Clinical Consultations in a Rehabilitation Cardiology Unit. In Proceedings of the 2022 E-Health and Bioengineering Conference (EHB), Iasi, Romania, 17–18 November 2022; IEEE: Piscataway, NJ, USA, 2022. [Google Scholar]
- Montella, E.; Ferraro, A.; Sperlì, G.; Triassi, M.; Santini, S.; Improta, G. Predictive analysis of healthcare-associated blood stream infections in the neonatal intensive care unit using artificial intelligence: A single center study. Int. J. Environ. Res. Public Health 2022, 19, 2498. [Google Scholar] [CrossRef] [PubMed]
- Improta, G.; Mazzella, V.; Vecchione, D.; Santini, S.; Triassi, M. Fuzzy logic–based clinical decision support system for the evaluation of renal function in post-Transplant Patients. J. Eval. Clin. Pract. 2020, 26, 1224–1234. [Google Scholar] [CrossRef] [PubMed]
- Santini, S.; Pescapé, A.; Valente, A.S.; Abate, V.; Improta, G.; Triassi, M.; Ricchi, P.; Filosa, A. Using fuzzy logic for improving clinical daily-care of β-thalassemia patients. In Fuzzy Systems (FUZZ-IEEE), Proceedings of the 2017 IEEE International Conference, Naples, Italy, 9–12 July 2017; IEEE: Piscataway, NJ, USA, 2017; pp. 1–6. [Google Scholar]
- Scala, A.; Loperto, I.; Triassi, M.; Improta, G. Risk Factors Analysis of Surgical Infection Using Artificial Intelligence: A Single Center Study. Int. J. Environ. Res. Public Health 2022, 19, 10021. [Google Scholar] [CrossRef]
- Improta, G.; Luciano, M.A.; Vecchione, D.; Cesarelli, G.; Rossano, L.; Santalucia, I.; Triassi, M. Management of the Diabetic Patient in the Diagnostic Care Pathway. In Proceedings of the 8th European Medical and Biological Engineering Conference, EMBEC 2020, IFMBE Proceedings, Portorož, Slovenia, 29 November–3 December 2020; Jarm, T., Cvetkoska, A., Mahnič-Kalamiza, S., Miklavcic, D., Eds.; Springer: Cham, Switzerland, 2021; Volume 80. [Google Scholar] [CrossRef]
- Improta, G.; Scala, A.; Trunfio, T.A.; Guizzi, G. Application of Supply Chain Management at Drugs Flow in an Italian Hospital District. J. Phys. Conf. Ser. 2021, 1828, 012081. [Google Scholar] [CrossRef]
- Colella, Y.; Di Laura, D.; Borrelli, A.; Triassi, M.; Amato, F.; Improta, G. Overcrowding analysis in emergency department through indexes: A single center study. BMC Emerg. Med. 2022, 22, 181. [Google Scholar] [CrossRef]
- Scala, A.; Trunfio, T.A.; De Coppi, L.; Rossi, G.; Borrelli, A.; Triassi, M.; Improta, G. Regression Models to Study the Total LOS Related to Valvuloplasty. Int. J. Environ. Res. Public Health 2022, 19, 3117. [Google Scholar] [CrossRef]
- Rosa, A.; Trunfio, T.A.; Marolla, G.; Costantino, A.; Nardella, D.; McDermott, O. Lean Six Sigma to reduce the acute myocardial infarction mortality rate: A single center study. TQM J. 2023, 35, 25–41. [Google Scholar] [CrossRef]
- Ferraro, A.; Centobelli, P.; Cerchione, R.; Cicco, M.V.; Montella, E.; Raiola, E.; Triassi, M.; Improta, G. Implementation of lean practices to reduce healthcare associated infections. Int. J. Healthc. Technol. Manag. 2020, 18, 51. [Google Scholar] [CrossRef]
- Cesarelli, G.; Montella, E.; Scala, A.; Raiola, E.; Triassi, M.; Improta, G. DMAIC Approach for the Reduction of Healthcare-Associated Infections in the Neonatal Intensive Care Unit of the University Hospital of Naples ‘Federico II’. In Proceedings of the European Medical and Biological Engineering Conference, Portorož, Slovenia, 29 November–3 December 2020; Springer: Cham, Switzerland, 2020; pp. 414–423. [Google Scholar]
- Converso, G.; Improta, G.; Mignano, M.; Santillo, L.C. A Simulation Approach for Agile Production Logic Implementation in a Hospital Emergency Unit. In Proceedings of the Intelligent Software Methodologies, Tools and Techniques, Naples, Italy, 15–17 September 2015; Springer International Publishing: Cham, Switzerland, 2015; Volume 532, pp. 623–634. [Google Scholar]
- Brasel, K.J.; Lim, H.J.; Nirula, R.; Weigelt, J.A. Length of stay: An appropriate quality measure? Arch. Surg. 2007, 142, 461–466. [Google Scholar] [CrossRef]
- Buttigieg, S.C.; Abela, L.; Pace, A. Variables affecting hospital length of stay: A scoping review. J. Health Organ. Manag. 2018, 32, 463–493. [Google Scholar] [CrossRef]
- Armel, W.S.; Samaha, S.; Starks, D.W. The use of simulation to reduce the length of stay in an emergency department. In Proceedings of the 2003 Winter Simulation Conference, New Orleans, LA, USA, 7–10 December 2003. [Google Scholar]
- Combes, C.; Kadri, F.; Chaabane, S. Predicting hospital length of stay using regression models: Application to emergency department. In Proceedings of the 10ème Conférence Francophone de Modélisation, Optimisation et Simulation-MOSIM’14, Nancy, France, November 2014. [Google Scholar]
- Sun, S.X.; Leung, A.N.; Dillon, P.W.; Hollenbeak, C.S. Length of stay and readmissions in mastectomy patients. Breast J. 2015, 21, 526–532. [Google Scholar] [CrossRef]
- Mandelbaum, A.; Nakhla, M.; Seo, Y.J.; Dobaria, V.; Attai, D.J.; Baker, J.L.; Thompson, C.K.; DiNome, M.L.; Benharash, P.; Lee, M.K. National trends and predictors of mastectomy with immediate breast reconstruction. Am. J. Surg. 2021, 222, 773–779. [Google Scholar] [CrossRef]
- Butz, D.R.; Shenaq, D.S.; Rundell, V.L.M.; Kepler, B.; Liederbach, E.B.; Thiel, J.; Pesce, C.; Murphy, G.S.; Sisco, M.; Howard, M.A. Postoperative pain and length of stay lowered by use of exparel in immediate, implant-based breast reconstruction. Plast. Reconstr. Surg. Glob. Open 2015, 3, e391. [Google Scholar] [CrossRef]
- Tartter, P.I.; Beck, G.; Fuchs, K. Determinants of hospital stay after modified radical mastectomy. Am. J. Surg. 1994, 168, 320–324. [Google Scholar] [CrossRef] [PubMed]
- Manum, J.; Veith, J.; Wei, G.; Kwok, A.; Agarwal, J. Variables associated with length of stay in patients undergoing mastectomy and delayed-immediate breast reconstruction with tissue expander. Breast J. 2019, 25, 927–931. [Google Scholar] [CrossRef]
- Loperto, I.; Scala, A.; Borrelli, A.; Rossi, G.; Triassi, M. Analysis of the adequacy of admissions in a Complex Operative Unit of General Surgery and Day Surgery and Breast Unit. In Proceedings of the 2021 International Symposium on Biomedical Engineering and Computational Biology, Nanchang, China, 13–15 August 2021. [Google Scholar]
- IBM Corp. IBM SPSS Statistics for Windows, version 27.0; IBM Corp: Armonk, NY, USA, 2020. [Google Scholar]
- Rodriguez-Galiano, V.; Sanchez-Castillo, M.; Chica-Olmo, M.; Chica-Rivas, M. Machine learning predictive models for mineral prospectivity: An evaluation of neural networks, random forest, regression trees and support vector machines. Ore Geol. Rev. 2015, 71, 804–818. [Google Scholar] [CrossRef]
- Friedman, J.H. Greedy function approximation: A gradient boosting machine. Ann. Stat. 2001, 29, 1189–1232. [Google Scholar] [CrossRef]
- Chen, T.; Guestrin, C. Xgboost: A scalable tree boosting system. In Proceedings of the 22nd Acm Sigkdd International Conference on Knowledge Discovery and Data Mining, San Francisco, CA, USA, 13–17 August 2016. [Google Scholar]
- Ostertagová, E. Modelling using polynomial regression. Procedia Eng. 2012, 48, 500–506. [Google Scholar] [CrossRef]
- Google. Google Colaboratory. 2024. Available online: https://colab.research.google.com/ (accessed on 28 April 2024).
- Pedregosa, F.; Varoquaux, G.; Gramfort, A.; Michel, V.; Thirion, B.; Grisel, O.; Blondel, M.; Prettenhofer, P.; Weiss, R.; Dubourg, V.; et al. Scikit-learn: Machine learning in Python. J. Mach. Learn. Res. 2011, 12, 2825–2830. [Google Scholar]
- Priyanka; Kumar, D. Decision tree classifier: A detailed survey. Int. J. Inf. Decis. Sci. 2020, 12, 246–269. [Google Scholar] [CrossRef]
- Suthaharan, S. Support vector machine. In Machine Learning Models and Algorithms for Big Data Classification. Integrated Series in Information Systems; Springer: Boston, MA, USA, 2016; Volume 36. [Google Scholar]
- Alkan, A. Analysis of knee osteoarthritis by using fuzzy c-means clustering and SVM classification. Sci. Res. Essays 2011, 6, 4213–4219. [Google Scholar]
- Leung, K.M. Naive bayesian classifier. Polytech. Univ. Dep. Comput. Sci./Financ. Risk Eng. 2007, 2007, 123–156. [Google Scholar]
- Ruta, D.; Gabrys, B. Classifier selection for majority voting. Inf. Fusion 2005, 6, 63–81. [Google Scholar] [CrossRef]
- Cross Validation, Scikit-Learn Python Library. Available online: https://scikit-learn.org/stable/modules/cross_validation.html (accessed on 28 April 2024).
- GridSearchCV, Scikit-Learn Python Library. Available online: https://scikit-learn.org/stable/modules/generated/sklearn.model_selection.GridSearchCV.html (accessed on 28 April 2024).
- Senaviratna, N.A.M.R.; Cooray, T.M.J.A. Diagnosing multicollinearity of logistic regression model. Asian J. Probab. Stat. 2019, 5, 1–9. [Google Scholar] [CrossRef]
- Rutledge, D.N.; Barros, A.S. Durbin–Watson statistic as a morphological estimator of information content. Anal. Chim. Acta 2002, 454, 277–295. [Google Scholar] [CrossRef]
- Hamilton, D.F.; Ghert, M.; Simpson, A.H.R.W. Interpreting regression models in clinical outcome studies. Bone Jt. Res. 2015, 4, 152–153. [Google Scholar] [CrossRef] [PubMed]
- Tatachar, A.V. Comparative assessment of regression models based on model evaluation metrics. Int. Res. J. Eng. Technol. (IRJET) 2021, 8, 853–860. [Google Scholar]
- Seliya, N.; Khoshgoftaar, T.M.; Van Hulse, J. A study on the relationships of classifier performance metrics. In Proceedings of the 2009 21st IEEE International Conference on Tools with Artificial Intelligence, Newark, NJ, USA, 2–4 November 2009; IEEE: Piscataway, NJ, USA, 2009; pp. 59–66. [Google Scholar]
- Lee, A.H.; Gracey, M.; Wang, K.; Yau, K.K. A robustified modeling approach to analyze pediatric length of stay. Ann. Epidemiol. 2005, 15, 673–677. [Google Scholar] [CrossRef] [PubMed]
- Austin, P.C.; Rothwell, D.M.; Tu, J.V. A comparison of statistical modeling strategies for analyzing length of stay after CABG surgery. Health Serv. Outcomes Res. Methodol. 2002, 3, 107–133. [Google Scholar] [CrossRef]
- Li, H.; Jiao, J.; Zhang, S.; Tang, H.; Qu, X.; Yue, B. Construction and comparison of predictive models for length of stay after total knee arthroplasty: Regression model and machine learning analysis based on 1,826 cases in a single Singapore center. J. Knee Surg. 2022, 35, 007–014. [Google Scholar] [CrossRef]
- Bhandari, M.; Wilson, C.; Rifkind, K.; DiMaggio, C.; Ayoung-Chee, P. Prolonged length of stay in delayed cholecystectomy is not due to intraoperative or postoperative contributors. J. Surg. Res. 2017, 219, 253–258. [Google Scholar] [CrossRef]
- Trunfio, T.A.; Scala, A.; Giglio, C.; Rossi, G.; Borrelli, A.; Romano, M.; Improta, G. Multiple regression model to analyze the total LOS for patients undergoing laparoscopic appendectomy. BMC Med. Inform. Decis. Mak. 2022, 22, 141. [Google Scholar] [CrossRef] [PubMed]
- Santoso, U.; Iau, P.T.; Lim, J.; Koh, C.S.; Pang, Y.T. The mastectomy clinical pathway: What has it achieved? Ann. Acad. Med. Singap. 2002, 31, 440–445. [Google Scholar] [PubMed]
- Nwaogu, I.Y.; Bommarito, K.; Olsen, M.A.; Margenthaler, J.A. Economic impact of bleeding complications after mastectomy. J. Surg. Res. 2015, 199, 77–83. [Google Scholar] [CrossRef] [PubMed]
- Ferrante, J.; Gonzalez, E.; Pal, N.; Roetzheim, R. The use and outcomes of outpatient mastectomy in Florida. Am. J. Surg. 2000, 179, 253–259. [Google Scholar] [CrossRef] [PubMed]
- Weber, W.P.; Barry, M.; Junqueira, M.; Lee, S.; Mazzella, A.; Sclafani, L. Initial experiences with a multidisciplinary approach to decreasing the length of hospital stay for patients undergoing unilateral mastectomy. Eur. J. Surg. Oncol. (EJSO) 2011, 37, 944–949. [Google Scholar] [CrossRef]
- Wagman, L.D.; Terz, J.J.; Hill, L.R.; Beatty, J.D.; Kokal, W.A.; Riihimaki, D.U.; Hyams, D.M.; Grant, M.; Hart, A.; Kirshner, T.; et al. Evaluation of a short-stay program for patients undergoing mastectomy. J. Surg. Oncol. 1989, 41, 98–102. [Google Scholar] [CrossRef]


Disclaimer/Publisher’s Note: The statements, opinions and data contained in all publications are solely those of the individual author(s) and contributor(s) and not of MDPI and/or the editor(s). MDPI and/or the editor(s) disclaim responsibility for any injury to people or property resulting from any ideas, methods, instructions or products referred to in the content. |
© 2024 by the authors. Licensee MDPI, Basel, Switzerland. This article is an open access article distributed under the terms and conditions of the Creative Commons Attribution (CC BY) license (https://creativecommons.org/licenses/by/4.0/).