Abstract
Background: Intracranial neoplasm, often referred to as a brain tumor, is an abnormal growth or mass of tissues in the brain. The complexity of the brain and the associated diagnostic delays cause significant stress for patients. This study aims to enhance the efficiency of MRI analysis for brain tumors using deep transfer learning. Methods: We developed and evaluated the performance of five pre-trained deep learning models—ResNet50, Xception, EfficientNetV2-S, ResNet152V2, and VGG16—using a publicly available MRI scan dataset to classify images as glioma, meningioma, pituitary, or no tumor. Various classification metrics were used for evaluation. Results: Our findings indicate that these models can improve the accuracy of MRI analysis for brain tumor classification, with the Xception model achieving the highest performance with a test F1 score of 0.9817, followed by EfficientNetV2-S with a test F1 score of 0.9629. Conclusions: Implementing pre-trained deep learning models can enhance MRI accuracy for detecting brain tumors.
1. Introduction
It can be anxiety-inducing when patients must wait for a medical diagnosis, especially regarding intracranial neoplasms (or brain tumors). Brain tumors are uncontrolled and abnormal growths of cells in the brain, classified into primary tumors, which originate in brain tissue, and secondary tumors, which spread from other parts of the body to the brain tissue via the bloodstream [1]. Given the intricate nature of the brain—an enormous and complex organ that controls the nervous system and contains around 100 billion nerve cells—the uncertainty surrounding a potential brain tumor diagnosis intensifies the anxiety experienced by patients awaiting medical assessments [2]. Patients are concerned about the impact of brain tumors on their cognitive functions, treatment options, and overall quality of life, amplifying the emotional strain they face in this situation.
Among brain tumors, glioma and meningioma stand out as lethal primary tumor types, with glioma ranking as the most prevalent brain tumor in humans [3]. The World Health Organization (WHO) classifies brain tumors into four grades: grades 1 and 2 represent less severe tumors like meningioma, and grades 3 and 4 indicate more serious types such as glioma. In clinical practice, meningioma, pituitary, and glioma tumors account for approximately 15%, 15%, and 45% of cases, respectively [4]. Understanding the differences between these tumor types and their grades is important for accurate diagnosis and effective treatment.
The median medical wait time for specialists across hospital providers in the US state of Vermont is 41 days, but it varies significantly by location. The wait time range for radiologists in Vermont is between 7 and 112 days. Additionally, the average wait time for a primary physician in the United States overall is 20.6 days [5]. However, the challenges do not end there; after completing the MRI scan, patients often must wait several weeks or months for their next appointment to receive their MRI results [6]. This prolonged wait time for diagnoses causes stress and anxiety for many patients. Integrating artificial intelligence into the medical diagnosis process can reduce the wait time for a brain tumor diagnosis [7].
Convolutional neural networks (CNNs) are popular deep learning models designed for image classification tasks [8], making them particularly adept at determining intricate patterns within medical images, such as those obtained from MRI scans [9]. Many CNN models are already trained and available for image classification purposes; such models are known as pre-trained models. Training models from scratch can be time-consuming and computationally intensive, often requiring significant resources like GPUs. This can be mitigated using pre-trained models, which significantly reduces the time and resources needed for training. Transfer learning, a technique that involves utilizing knowledge from pre-trained models on large datasets, enhances the efficiency and effectiveness of the classification process by fine-tuning these models to adapt to new tasks or datasets [10]. This approach allows the model to build upon previously learned features and patterns, accelerating the learning process and improving performance on new tasks.
This research presents a comparative analysis of five widely used pre-trained deep learning models—ResNet50, Xception, EfficientNetV2-S, ResNet152V2, and VGG16—on the task of brain tumor classification using MRI images. While extensive research exists on individual models for MRI-based brain tumor classification, our study stands out by providing a direct comparison of these five specific models on a single dataset. The key contributions of this study include: (1) a systematic evaluation of these models’ performance on a publicly available MRI dataset using metrics such as accuracy, F1 score, and precision; and (2) the identification of the most effective pre-trained model for brain tumor classification. We hope that this study provides a robust framework for future research in the medical diagnostics field.
The rest of the paper is structured as follows: Section 2 describes the methodology, including the dataset and image augmentation, pre-trained model descriptions, model architecture, and model fine-tuning. Section 3 presents the results of the performance analysis of individual models and a comparison of model performance. The paper concludes with Section 4, which discusses the conclusions and future work.
2. Methodology
2.1. Dataset and Image Augmentation
The Brain Tumor MRI dataset used in this research is a publicly available dataset containing a total of 7023 MRI images: 5712 training images and 1311 testing images [11]. The data are grouped into four distinct categories: pituitary, meningioma, glioma, and no tumor. Specifically, the testing subset comprises 300 pituitary images, 306 meningioma images, 300 glioma images, and 405 no-tumor images, while the training subset includes 1457 pituitary images, 1339 meningioma images, 1321 glioma images, and 1595 no-tumor images.
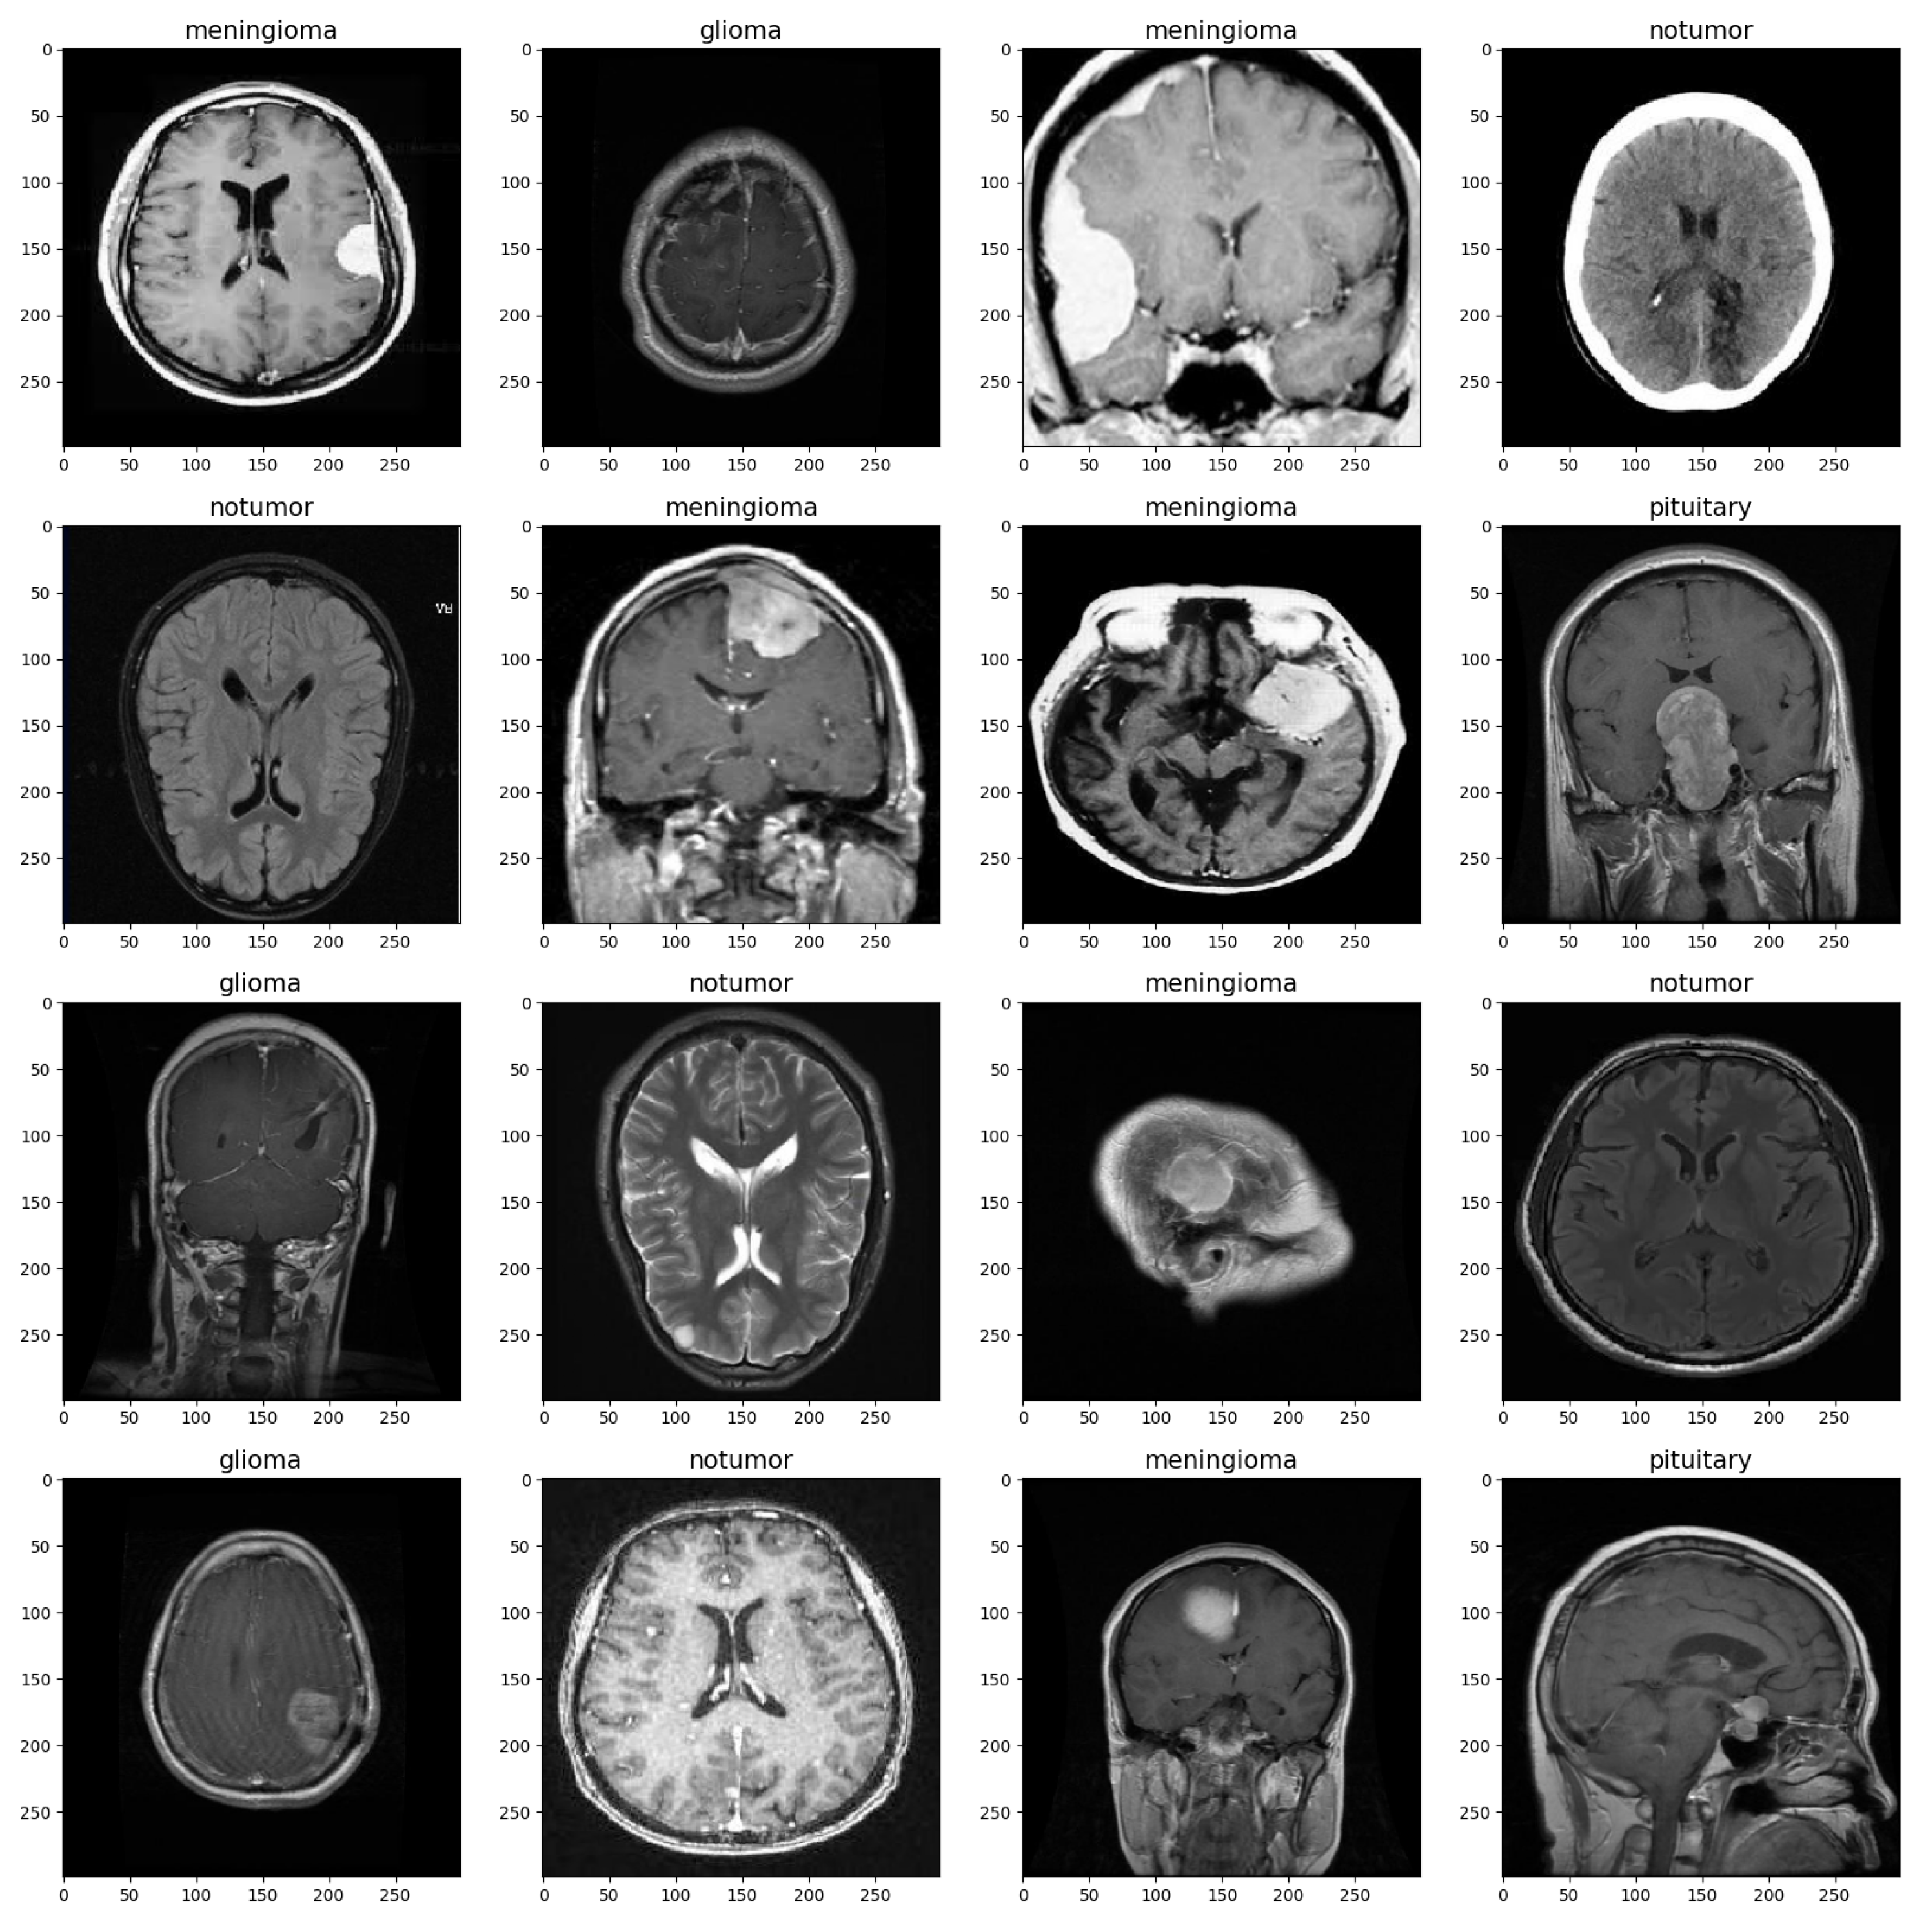
The MRI images were split into training and validation sets with a split ratio of 50%, ensuring stratification based on class labels to maintain class balance. Before being used for training, the images were preprocessed and augmented to ensure the model could handle a diverse range of images, such as those with low brightness and various orientations [12]. Table 1 shows the set values for the parameters. The images were rescaled to a value of 1/255, and brightness was set to a range from 0.8 to 1. Rotation, zoom, shift, and flip shear were adjusted as depicted in the table. These parameter settings increase the diversity of the training data and improve the model’s ability to generalize to a wide range of MRI images [13]. Figure 1 provides a visualization of the brain tumor image dataset.

Table 1.
Data Augmentation Parameters.
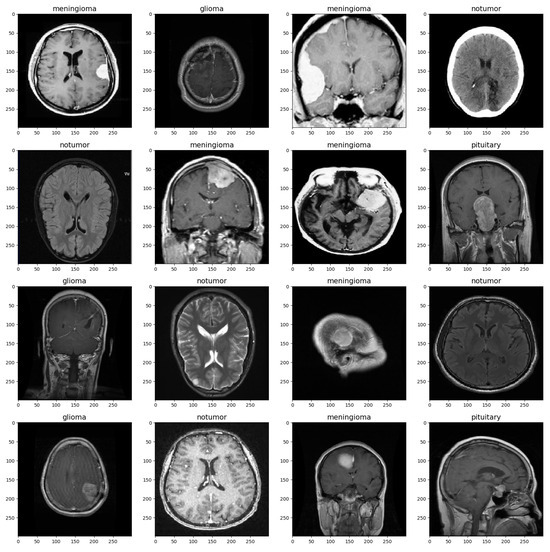
Figure 1.
Brain MRI Data Sample.
2.2. Pre-Trained Models Description
2.2.1. ResNet50
Residual Network 50 (ResNet50) is a pre-trained convolutional neural network architecture consisting of 50 layers, developed by Microsoft Research in 2015. In deep neural networks, as networks grow deeper, the gradients in the earlier layers diminish significantly, a problem known as the vanishing gradient problem. ResNet50 tackles this challenge by introducing residual connections, enabling the network to learn residual functions [14]. This architecture was chosen for its deep structure and ability to handle complex image recognition tasks [15].
2.2.2. Xception
Extreme Inception (Xception) is an extension of the inception architecture, using depth-wise separable convolutions to reduce the number of parameters while maintaining high performance. This model performs well in complex image recognition tasks due to its unique architecture, which effectively captures intricate patterns [16,17].
2.2.3. EfficientNetV2-S
Efficient Network Version 2 Small (EfficientNetV2-S) is optimized for resource-constrained environments without compromising performance. This variant, denoted as “S”, strikes a balance between model size and computational efficiency [18]. Its selection was based on the need for a model that could deliver accuracy while being computationally efficient.
2.2.4. ResNet152V2
Residual Network 152 Version 2 (ResNet152V2) is an improved version of ResNet with 152 layers. It retains the skip connections from the original ResNet architecture, making it adept at training deep networks. This model’s robustness and accuracy in handling complex image classification tasks make it a reliable choice for applications requiring high-level feature extraction [19].
2.2.5. VGG16
Visual Geometry Group 16 (VGG16) is a 16-weight-layer deep learning model developed by the Visual Geometry Group. Known for its simplicity and effectiveness, VGG16 consists of many convolutional layers followed by fully connected layers. Its ability to precisely capture complex characteristics in images makes it valuable for a variety of image classification applications [20].
2.3. Model Architecture and Fine-Tuning
The sequential model configuration serves as a foundational structure that remains consistent across all variations of the model architecture. This standardized setup includes essential components such as Flatten layers for reshaping data, Dropout layers for regularization to prevent overfitting [21], and Dense layers with activation functions for feature transformation and classification.
The Dense layer with 256 units is regularized using L2 regularization with a coefficient of 0.015, L1 activity regularization with a coefficient of 0.005, and L1 bias regularization with a coefficient of 0.005 [22]. The activation function used for this Dense layer is ReLU [23]. Additionally, BatchNormalization layers are applied to stabilize training by normalizing the input to each layer. The batch normalization layer is configured with a momentum of 0.99 and an epsilon value of 0.001 [24,25,26]. The final Dense layer, or output layer, consists of 4 units with a Softmax activation function for multi-class classification, providing the probability distribution of the input belonging to each of the four classes: pituitary, meningioma, glioma, and no tumor [27].
In the model compilation step, the Adam optimizer (Adaptive Moment Estimation) with a learning rate of 0.0001 is used to minimize the loss function during neural network training [28]. Categorical cross-entropy, a suitable loss function for multi-class classification tasks, measures the error rate between the actual and predicted labels [29]. Metrics such as recall, precision, accuracy, and F1 score are set to comprehensively assess the model, providing deep insights into its classification performance.
The model is fine-tuned using the fit method for 10 epochs with the training dataset. To prevent overfitting, the EarlyStopping callback with a patience of 2 is utilized to monitor validation loss and save the best weights throughout the training process [30]. The evaluation of the model’s performance is conducted based on training, validation, and testing datasets, where metrics such as loss, accuracy, and F1 scores are computed. The confusion matrix is used to visualize the model’s classification performance, providing a detailed breakdown of the predicted versus actual labels, including true positives, true negatives, false positives, and false negatives. Table 2 illustrates the model architecture layers.

Table 2.
Model Architecture.
3. Results
3.1. Performance Analysis of Individual Models
Table 3 summarizes the various training, validation, and testing metrics for all five models that we evaluated.

Table 3.
Training, Validation, and Testing Metrics for all models (best model in green).
3.1.1. ResNet50
During the training phase of the model with ResNet50, the model achieved a Training Accuracy of 94.73% and a Training F1 Score of 0.9347, corresponding to a Train Loss of 3.4093. Nevertheless, the Validation Accuracy was 91.60%, accompanied by a Validation Loss of 3.4513 with an F1 score of 0.9074. In the testing phase, the ResNet-50 Testing Accuracy reached 87.96%, and the Testing F1 Score reached 0.7963, with a Test Loss of 3.6171.
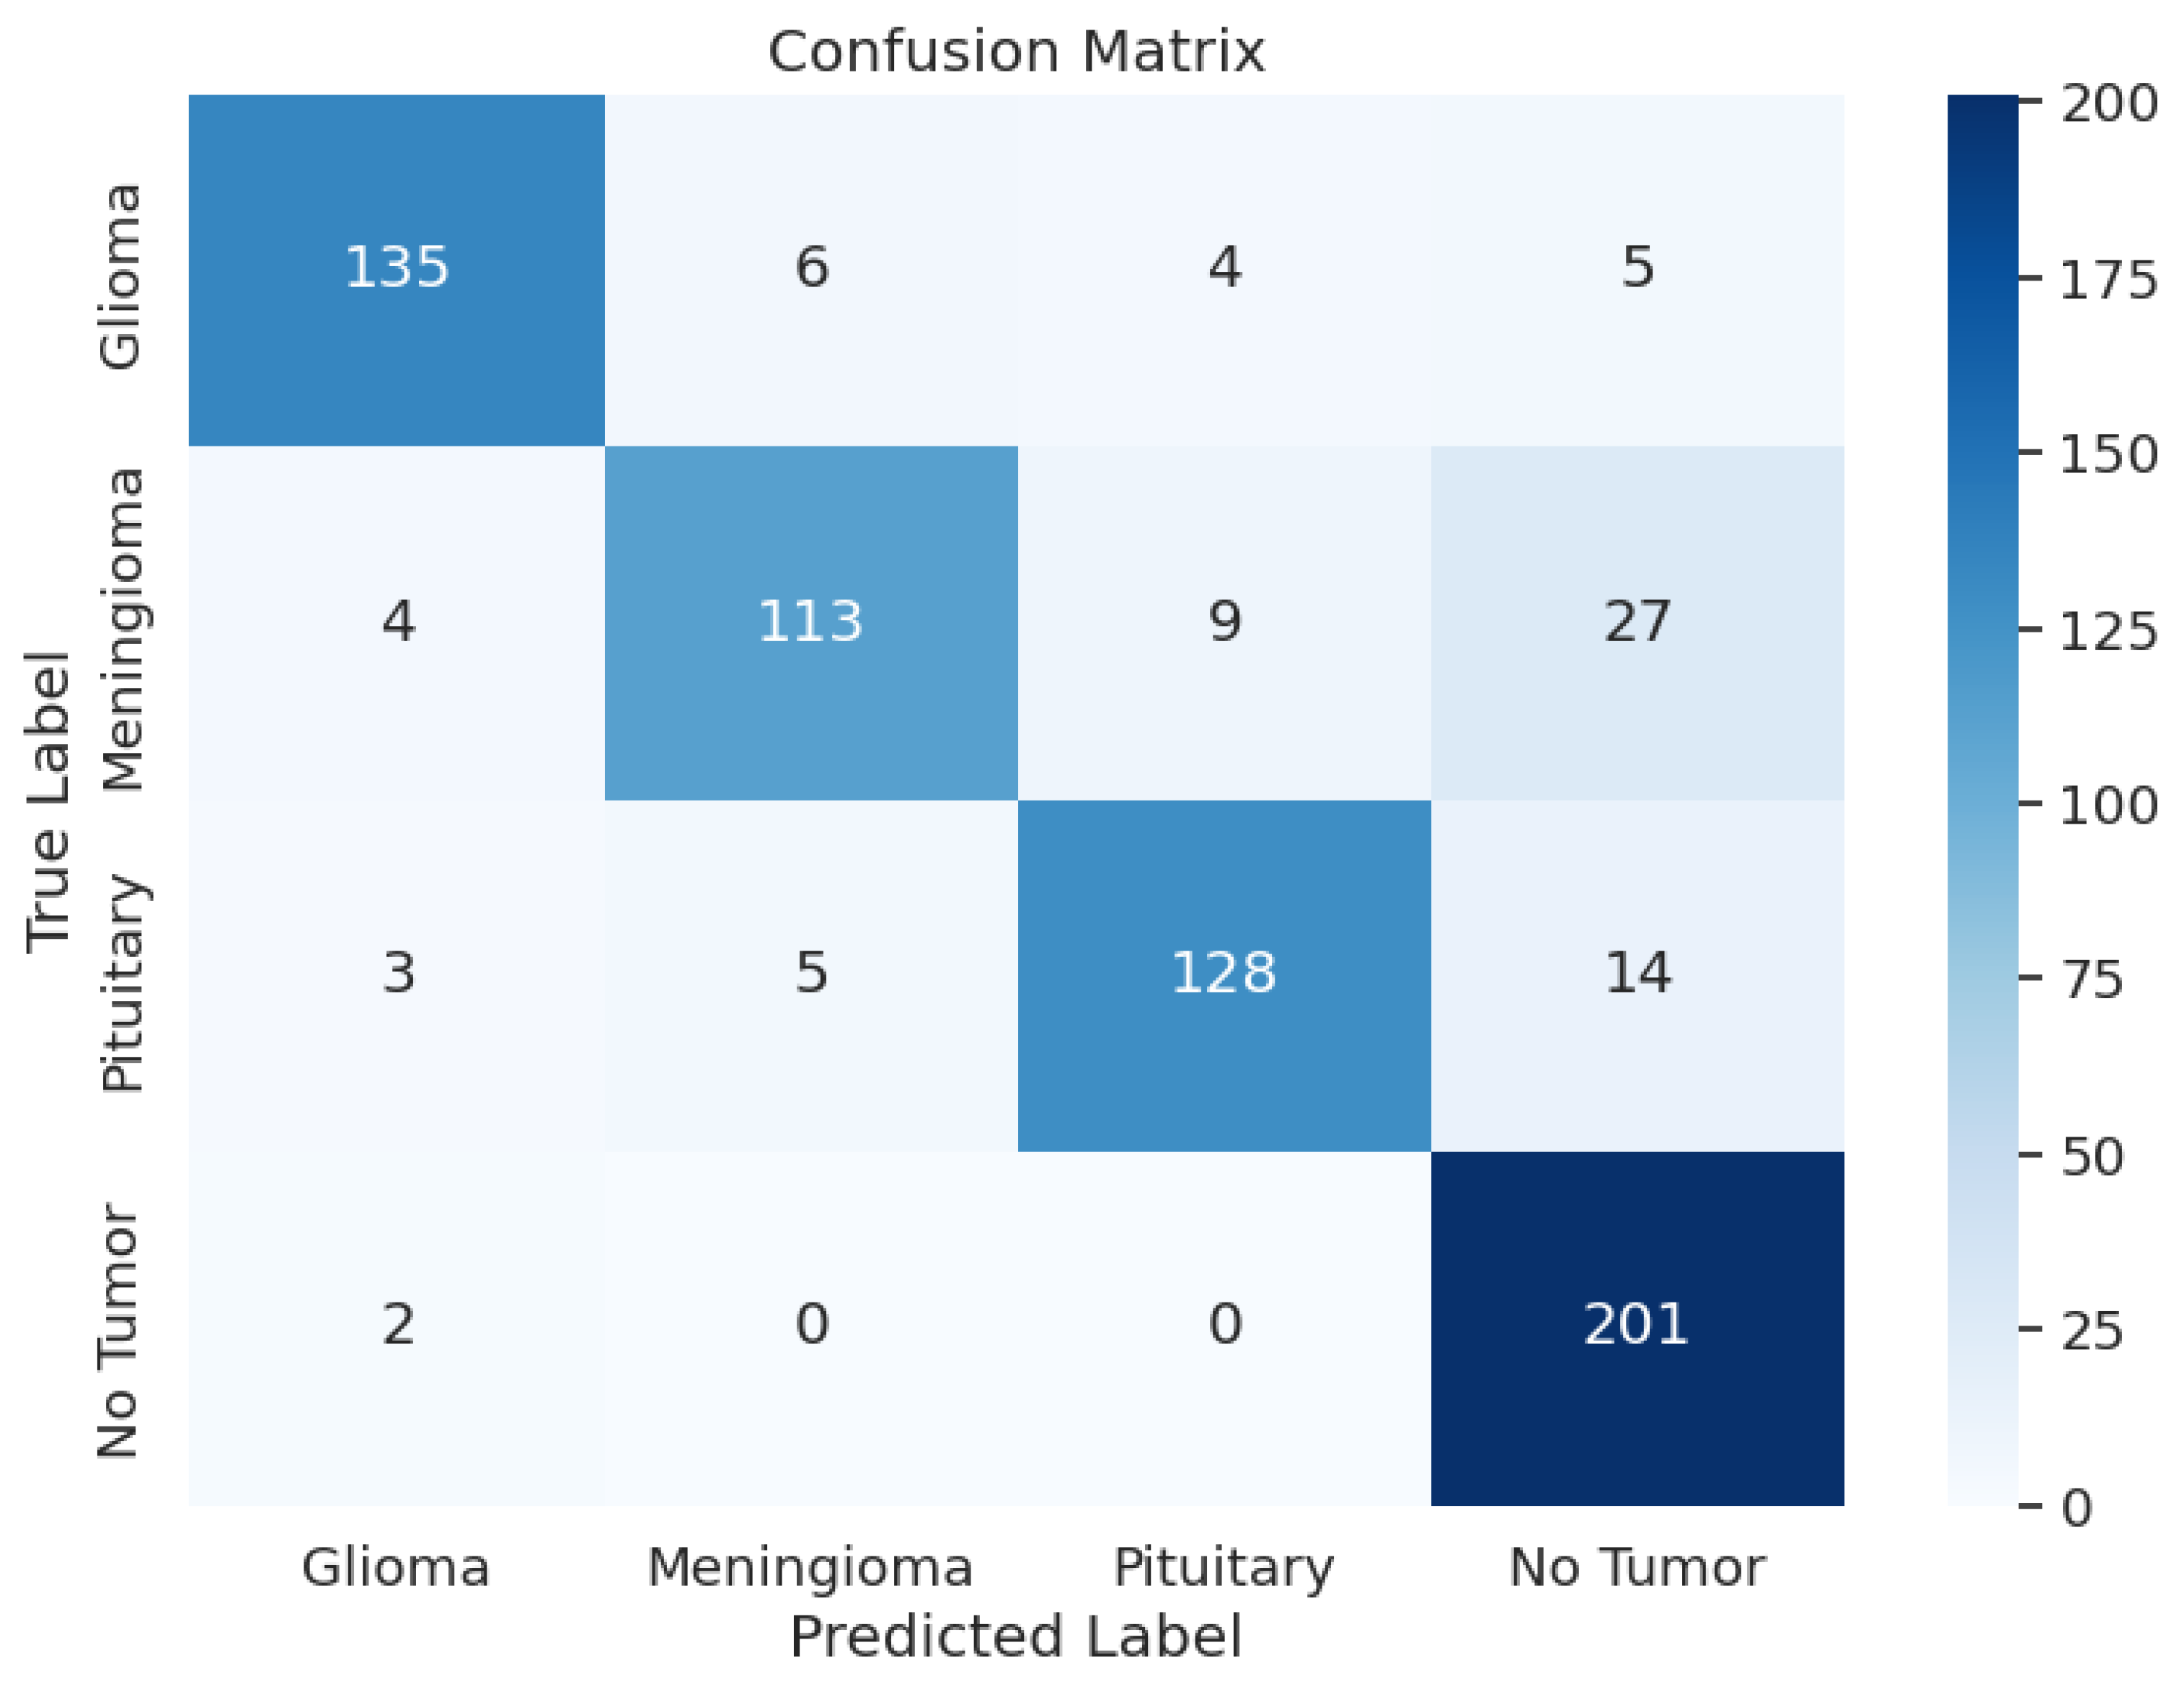
Another crucial part of the evaluation process is the analysis of the model’s classification outcomes over different tumor classes. The data shows the F1 scores between 0.82 and 0.92, precision results from 0.81 to 0.94, and recall rates from 0.74 to 0.99. Table 3 shows the model performance metrics, Table 4 shows the classification metrics, and Figure 2 shows the confusion matrix for ResNet50.

Table 4.
ResNet50 Model: Classification Metrics.
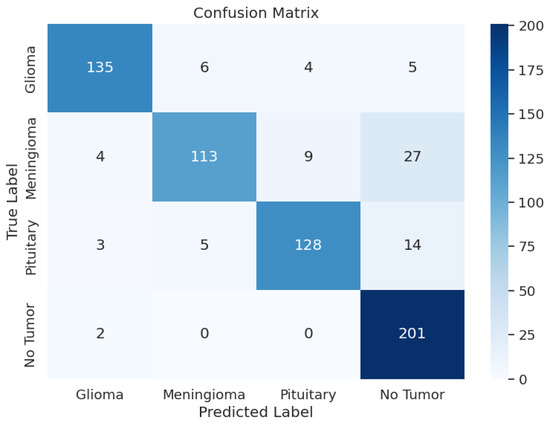
Figure 2.
ResNet50 Model: Confusion Matrix.
3.1.2. Xception
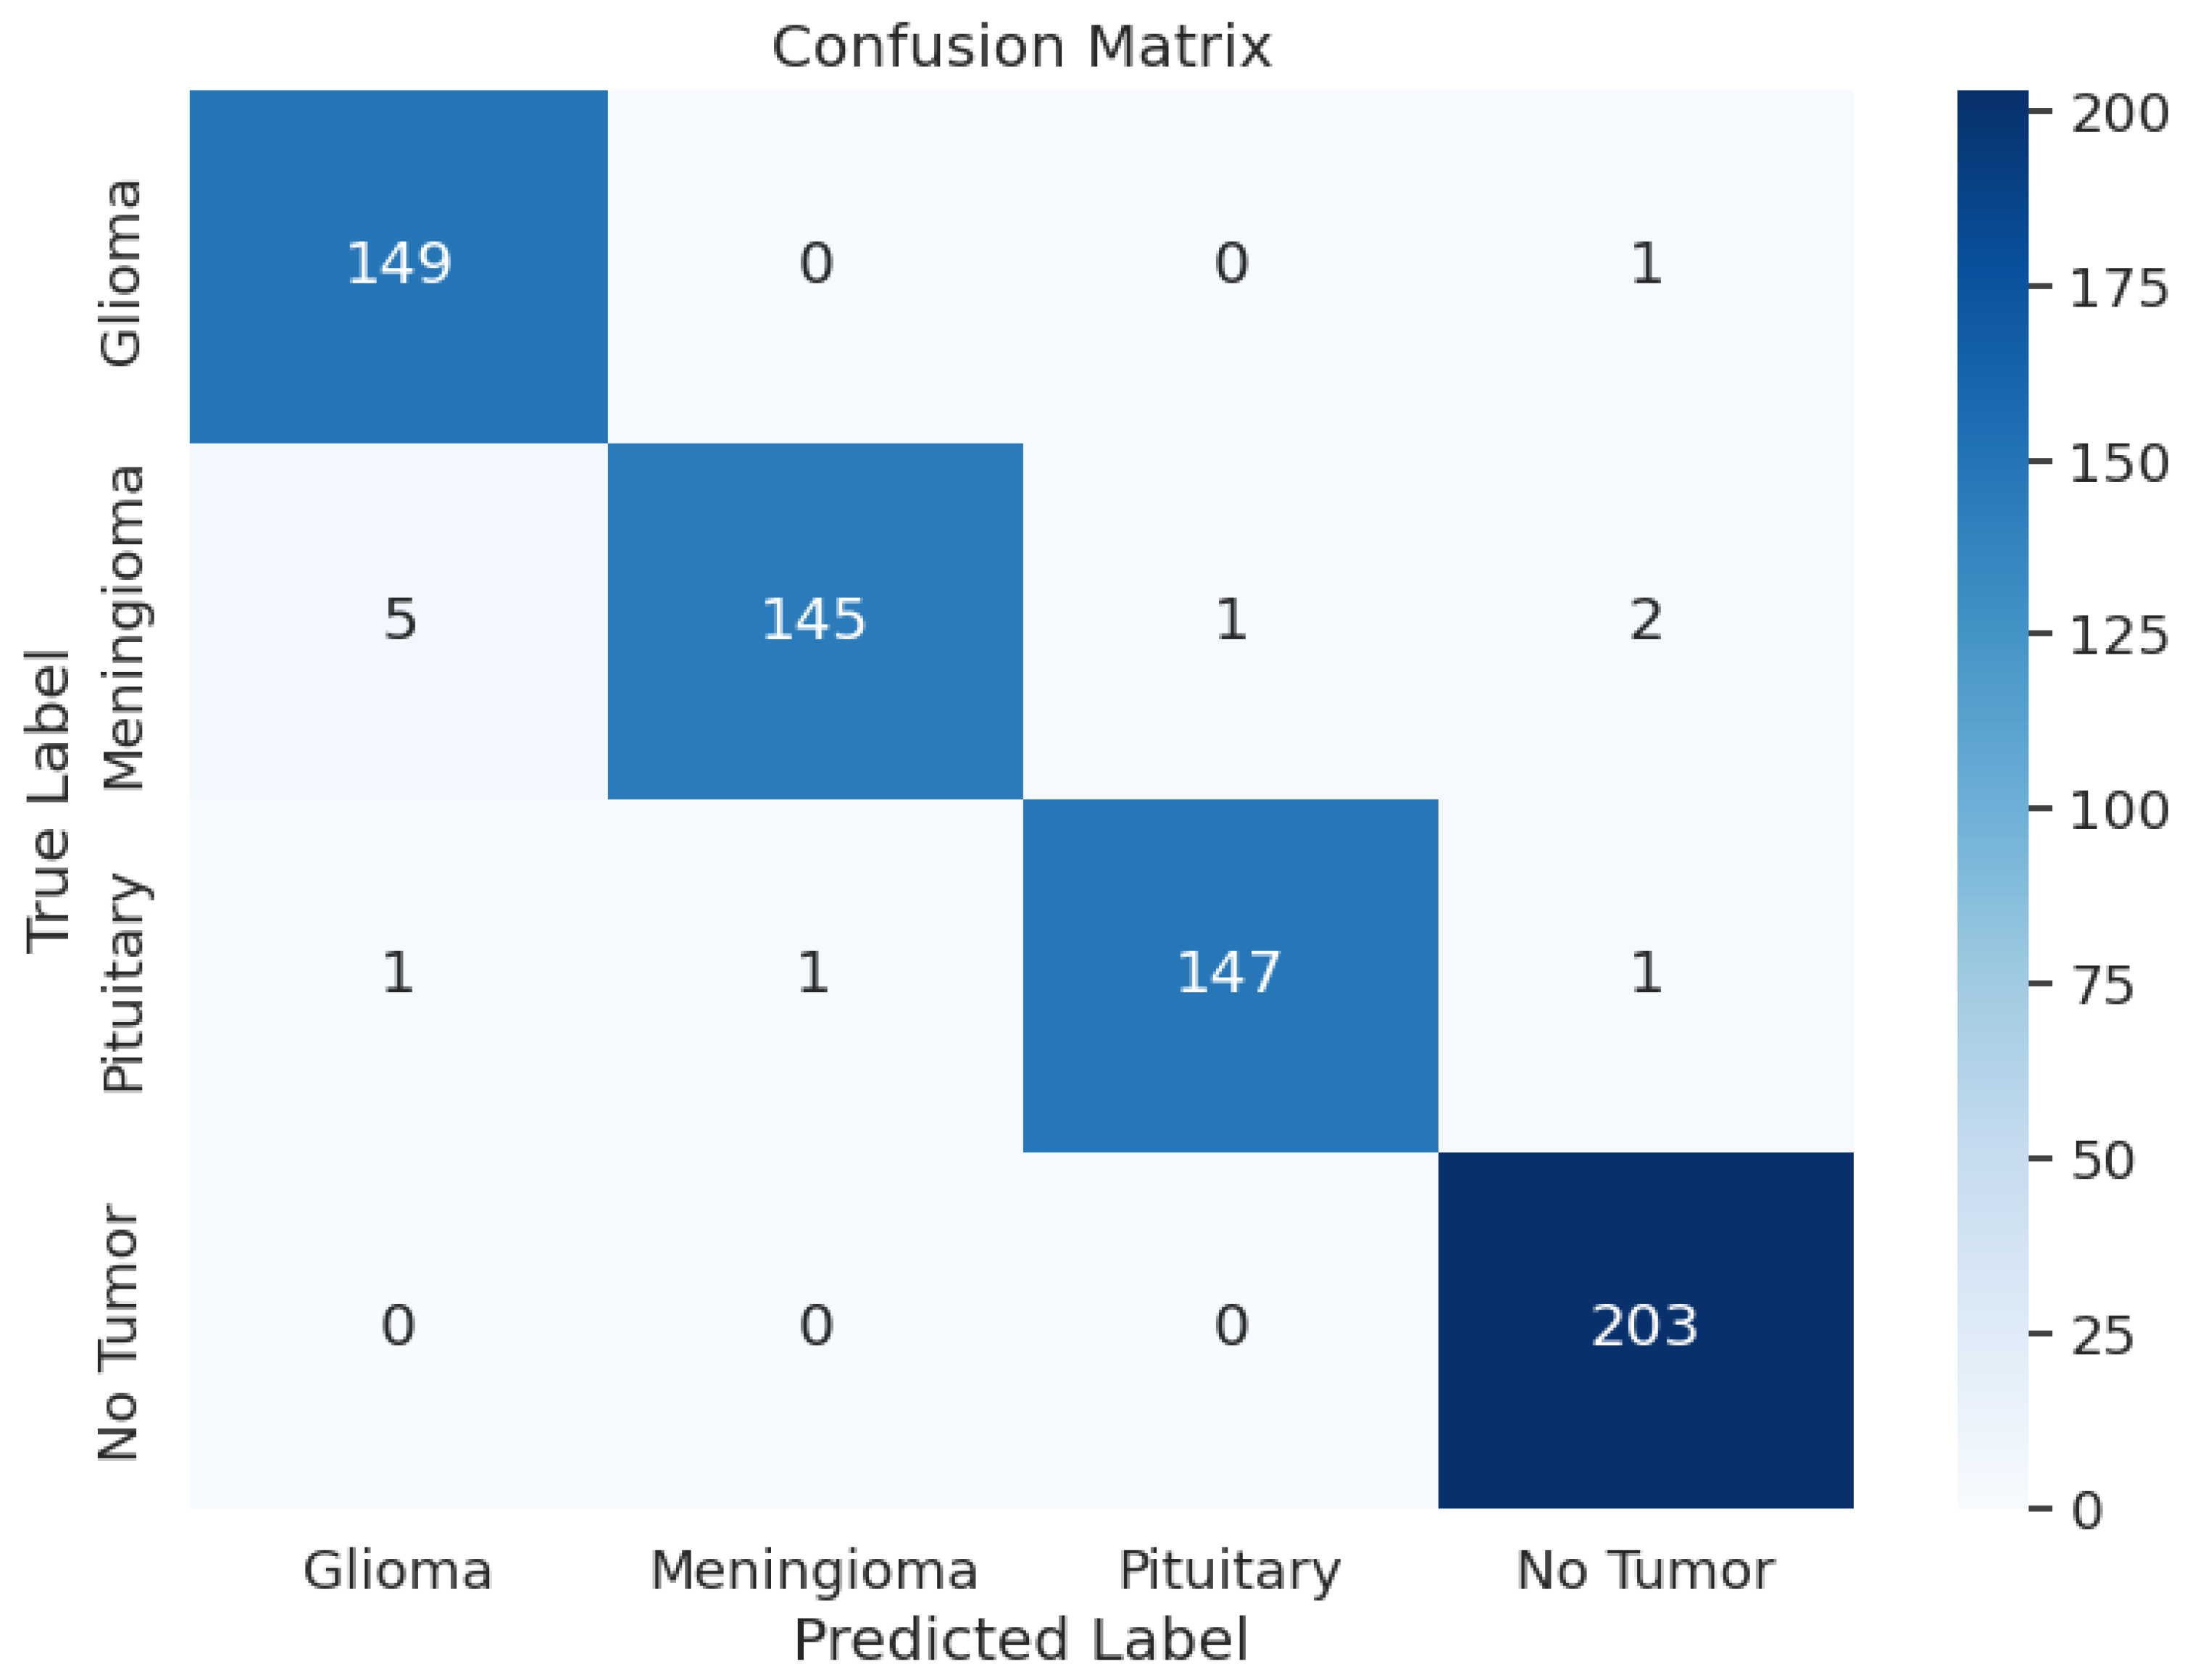
During the training phase of the model with Xception, the model achieved an excellent Training Accuracy of 99.49%, with an F1 score of 0.9949 and a training loss as low as 0.5046. Overall, the minimum F1 score found across all the classes is 0.97, and the maximum is 0.99. Additionally, Recall reached the maximum possible value of 1 for class 2, an overall average of 0.98, and an average precision of 0.98. Upon validation, the accuracy reached 99.39% and an F1 score of 0.9933 with a validation loss of 0.5079; these metrics are very close to the training metrics, which shows that the model learned exceptionally well. Upon testing, the model had a test accuracy of 98.17%, which is the highest test accuracy across the 5 pre-trained models. It also had a higher test F1 score of 0.9817, with the test loss being 0.5265. The model’s classification outcomes over different tumor types had an average of 0.98 across precision, recall, and F1-score. Table 3 shows the model performance metrics, Table 5 shows the classification metrics, and Figure 3 shows the confusion matrix for Xception.

Table 5.
Xception Model: Classification Metrics.
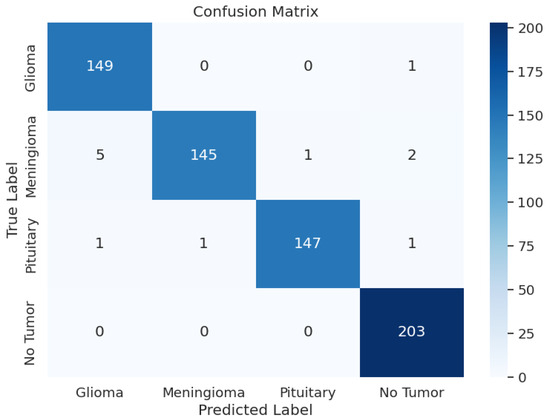
Figure 3.
Xception Model: Confusion Matrix.
3.1.3. EfficientNetV2-S
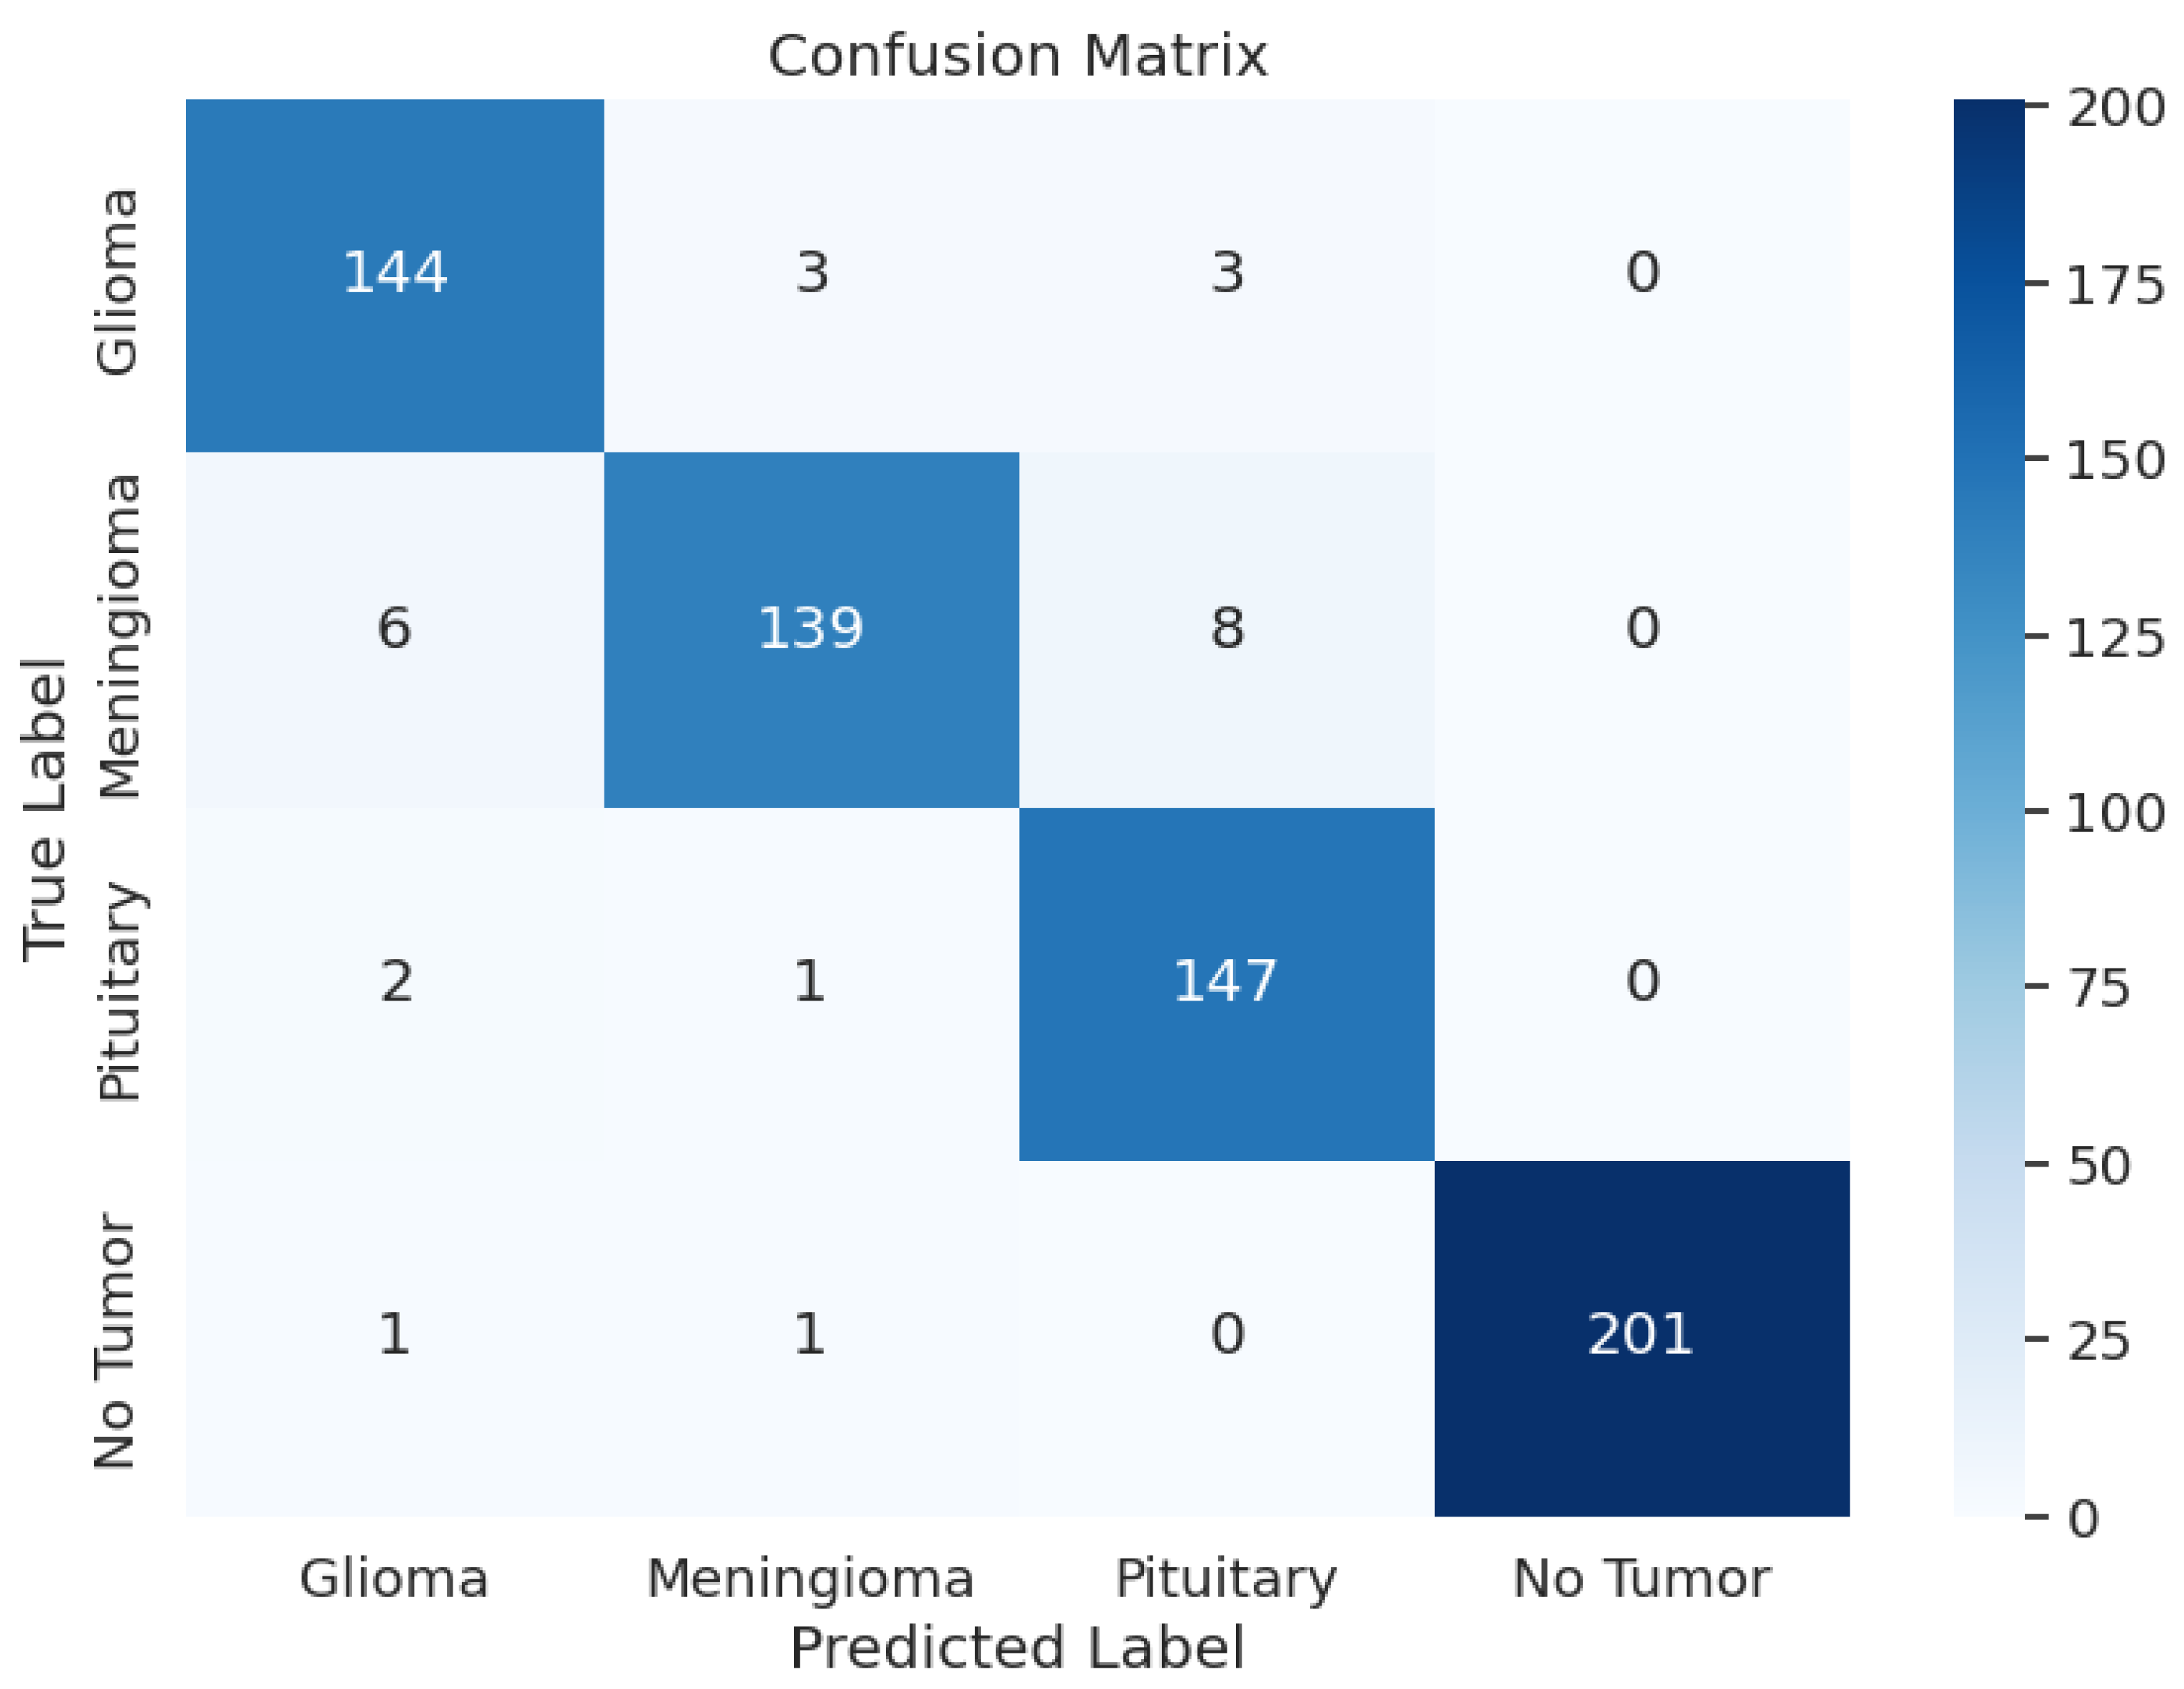
The evaluation of EfficientNetV2-S has presented the precision values from 0.94 up to 1.00 and the recall rates between 0.91 and 0.99. The F1 scores ranged from 0.94 to 1.00 in different tumor cases as a result. During training, the model achieved an accuracy of 96.69 and an F1 score of 0.9673, with a training loss as low as 3.0644. Upon testing, the test accuracy went down to 96.19% and an F1 score of 0.9629 with a test loss of 3.0673. In the validation phase, accuracy was 95.27, and the F1 score was 0.9586, with a validation loss of 3.0861. Overall, the loss was approximately the same across the training, validating, and testing phases. Overall, the model’s performance was average. Table 3 shows the model performance metrics, Table 6 shows the classification metrics, and Figure 4 shows the confusion matrix for EfficientNetV2-S.

Table 6.
EfficientNetV2-S Model: Classification Metrics.
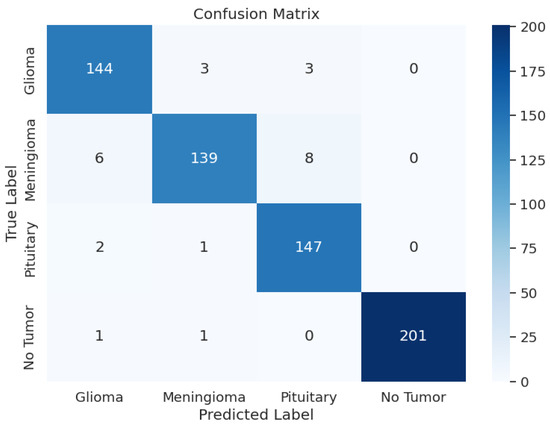
Figure 4.
EfficientNetV2-S Model: Confusion Matrix.
3.1.4. ResNet152V2
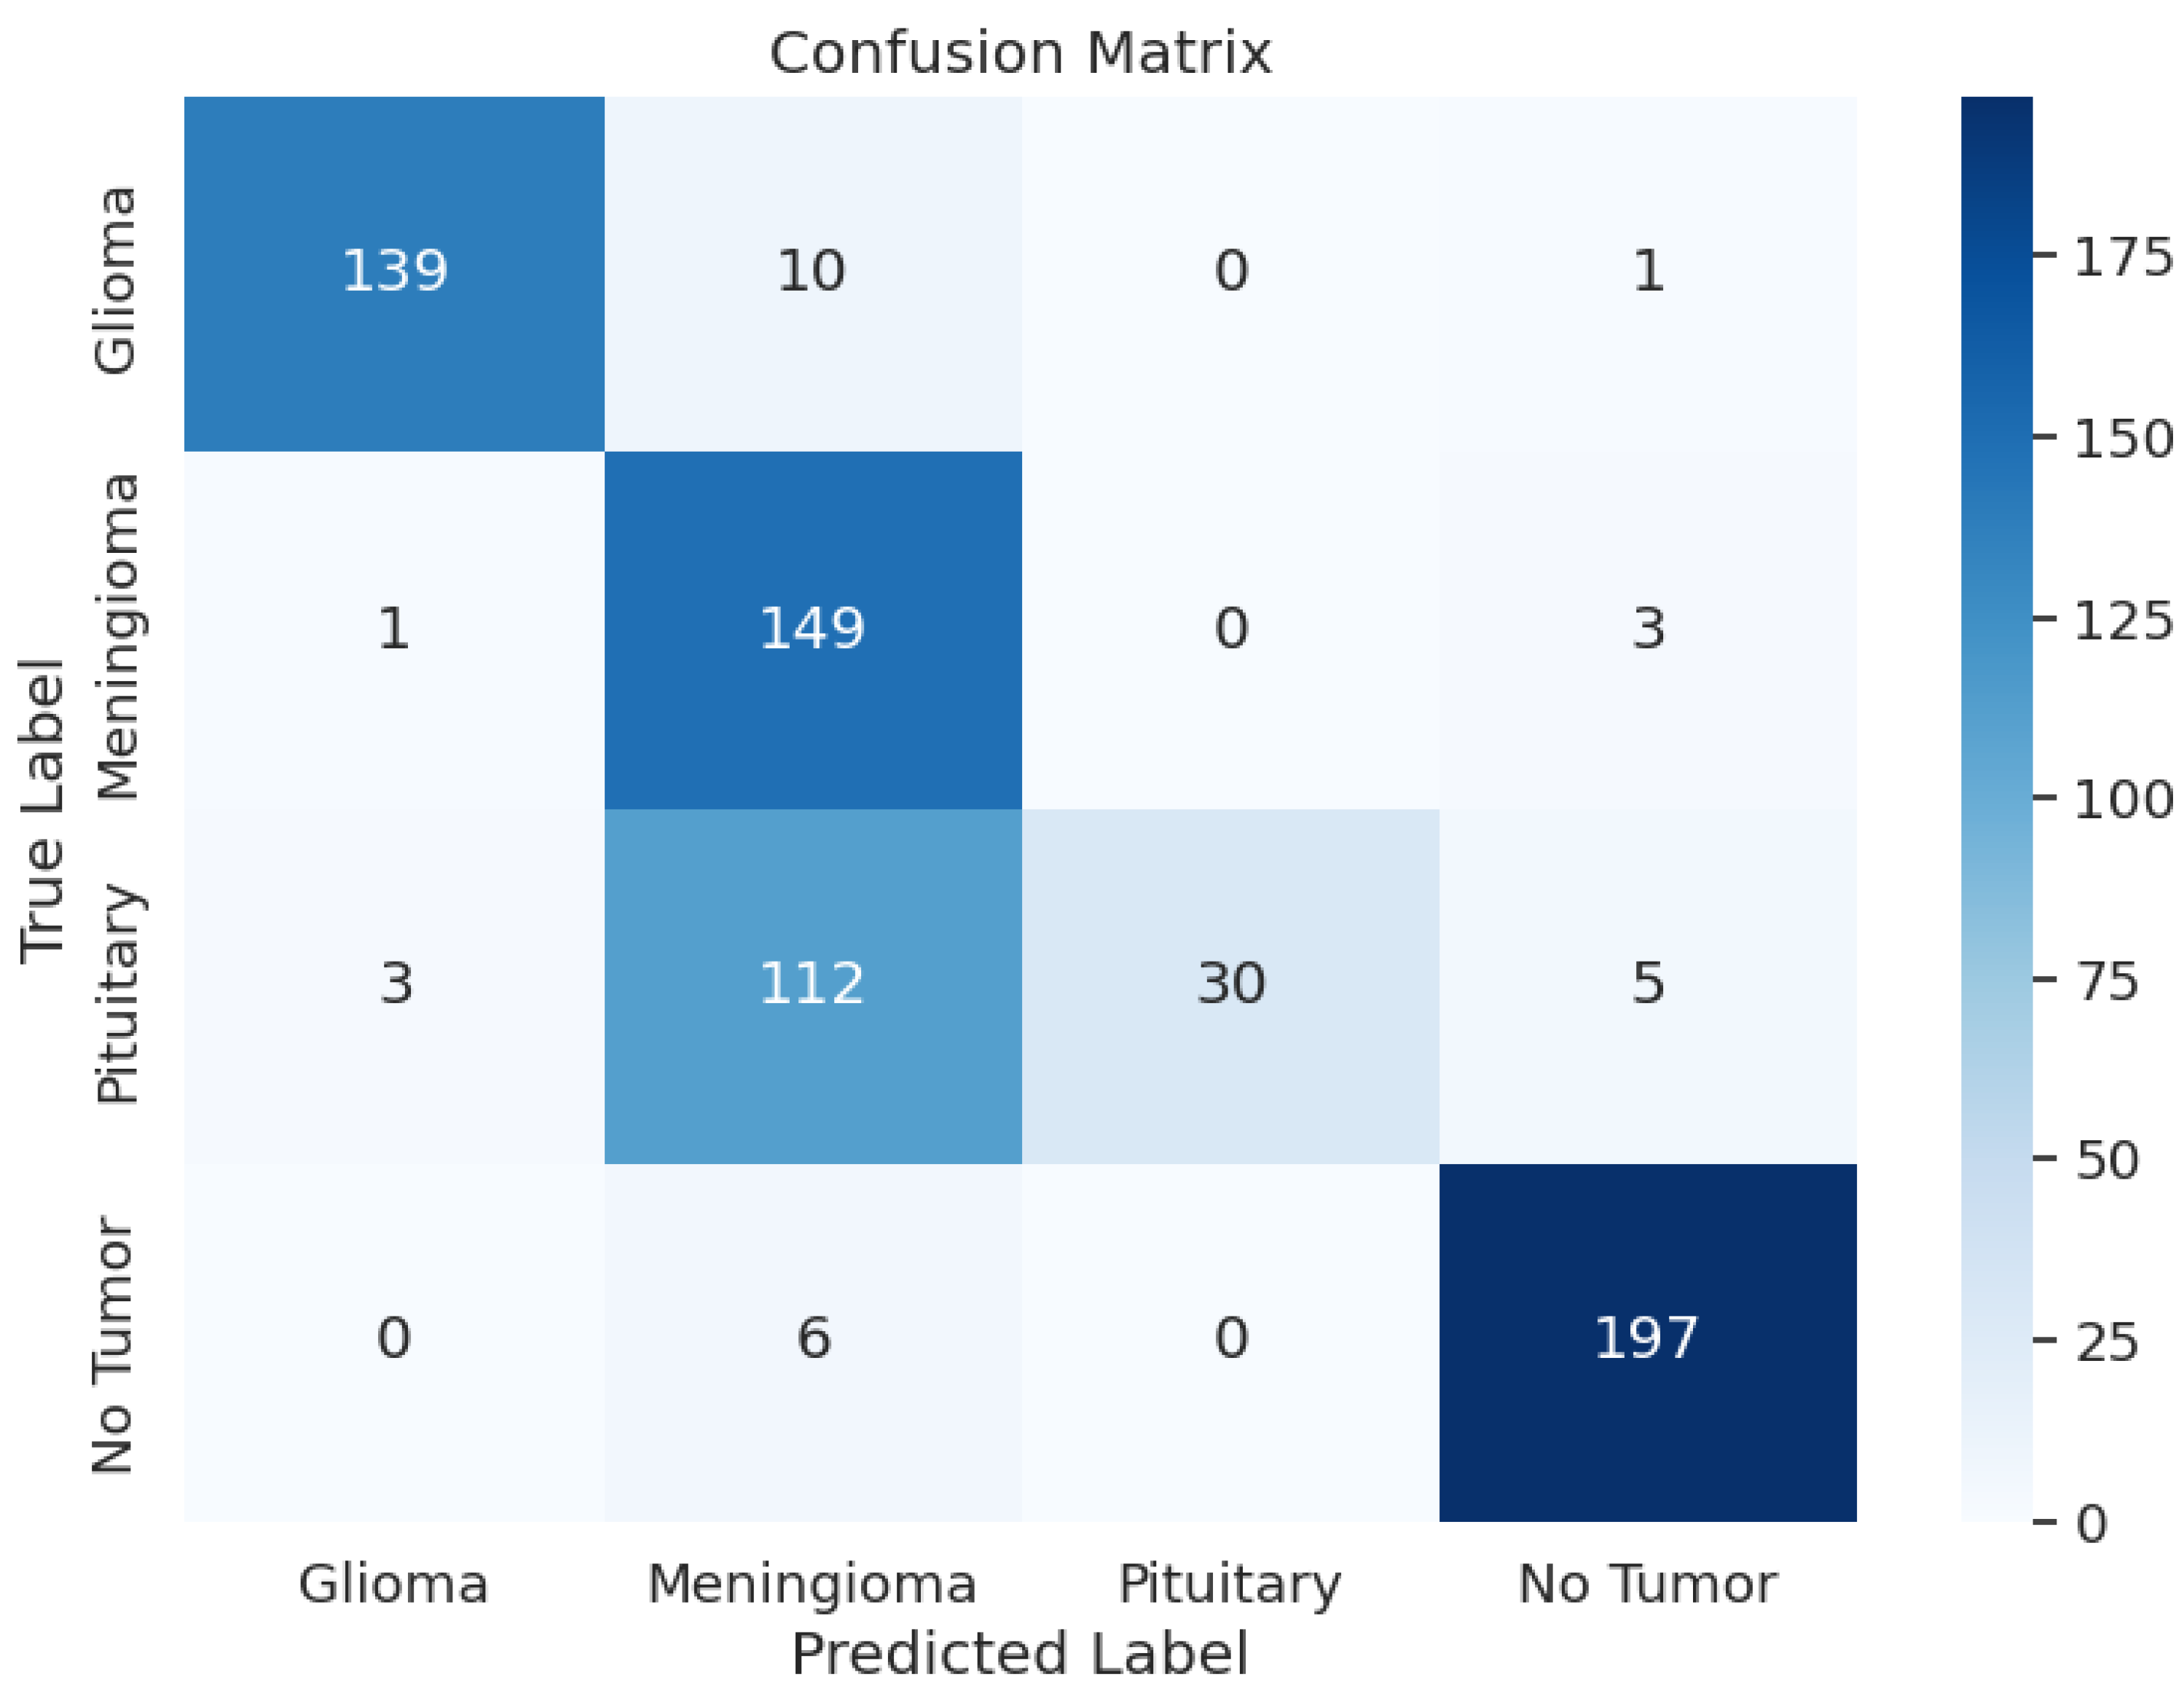
The detailed analysis of the ResNet152V2 model shows that the model demonstrated precision values ranging from 0.54 to 1.00, recall rates between 0.20 and 0.97, and F1 scores spanning from 0.33 to 0.96. The training accuracy of this model was 88.45% and a training F1 score of 0.8747 with a training loss of 2.9106. The model had a validation accuracy of 88.09%, a validation F1 score of 0.8707, and a validation loss of 2.9141, which is very similar to the validation and test loss. The F1 score for testing was 0.7998, a test loss of 2.9849, and a test accuracy of 78.51%. The overall performance of this model was not good, given the test metrics. Table 3 shows the model performance metrics, Table 7 shows the classification metrics, and Figure 5 shows the confusion matrix for ResNet152V2.

Table 7.
ResNet152V2 Model: Classification Metrics.
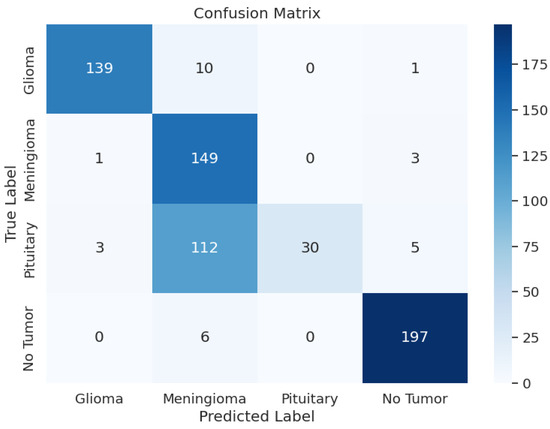
Figure 5.
ResNet152V2 Model: Confusion Matrix.
3.1.5. VGG16
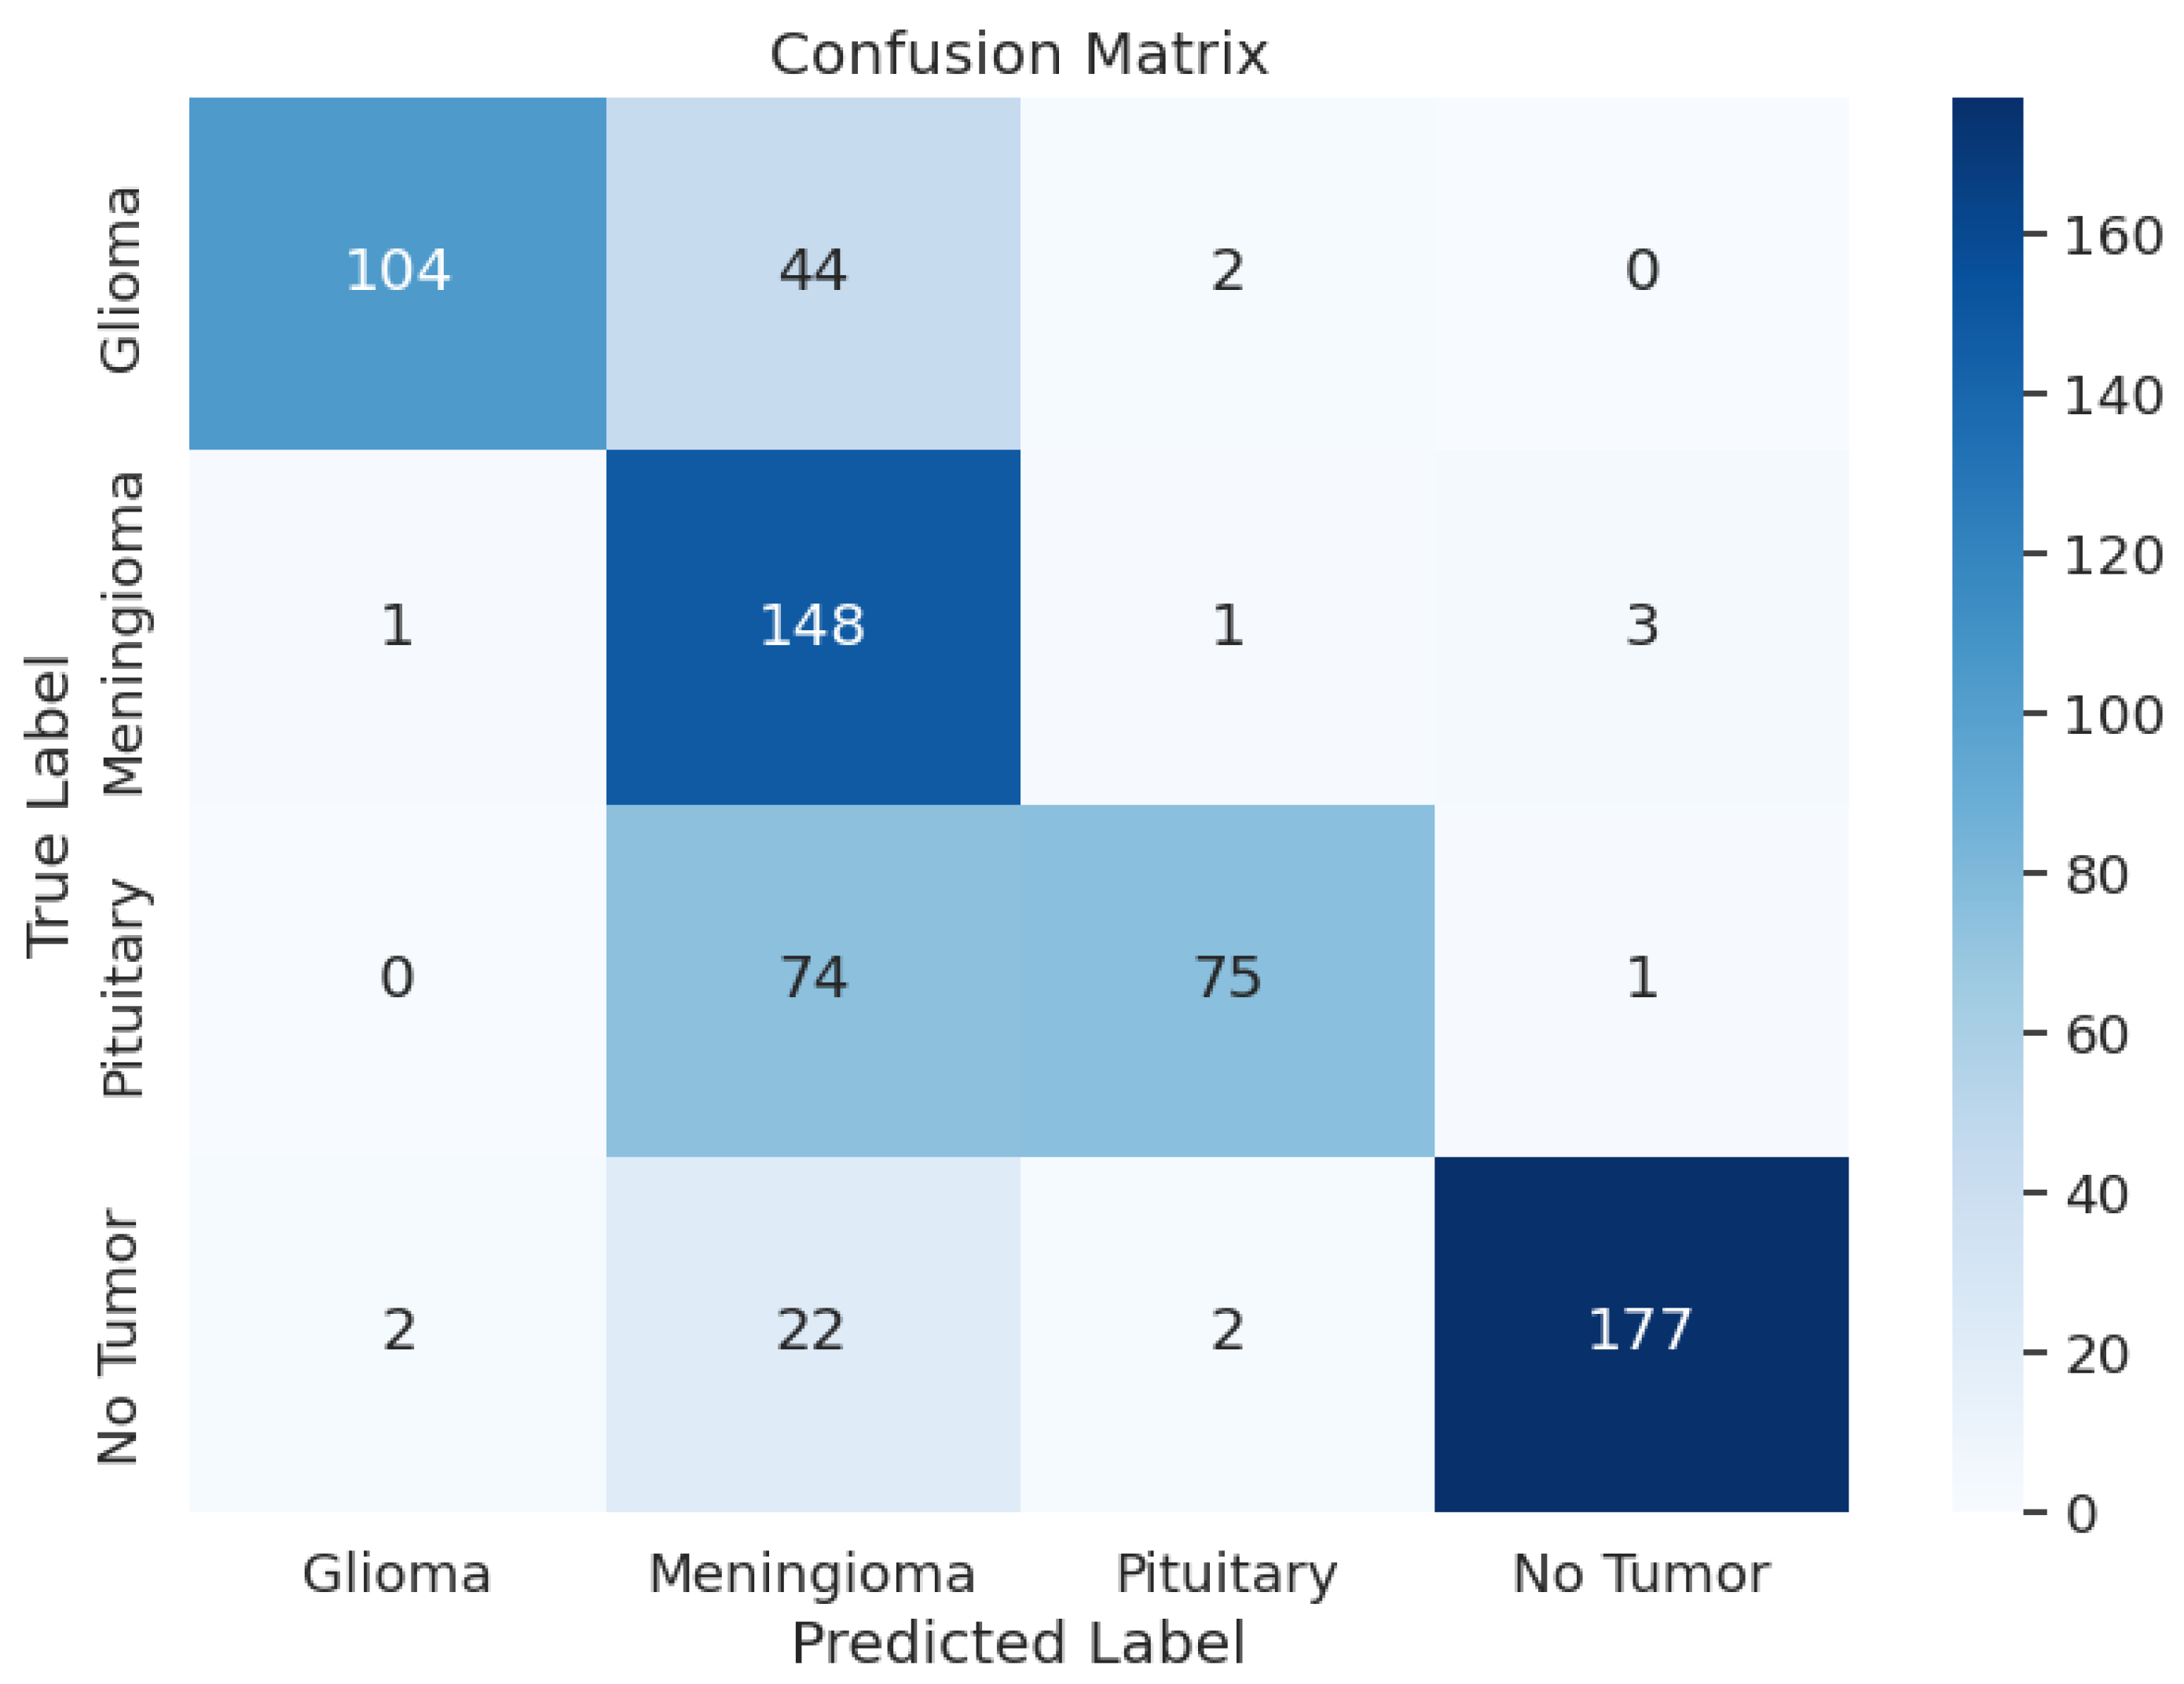
The VGG16 model exhibited varying performance metrics across different classes, with precision ranging from 0.51 to 0.98, recall from 0.50 to 0.97, and F1-scores from 0.65 to 0.92. The overall accuracy was 0.77, indicating moderate predictive capabilities. During training, the model had a loss of 0.9147, an accuracy of 87.96%, and an F1-score of 0.8850. On the validation set, the model maintained consistent performance with a loss of 0.9948, accuracy of 86.11%, and F1-score of 0.8654. In the testing phase, the model showed a loss of 1.1323, accuracy of 76.83%, and F1-score of 0.7756, providing insights into its classification abilities on new datasets. However, based on the metrics, the performance of this model was not good. During testing, it did not perform well. Table 3 shows the model performance metrics, Table 8 shows the classification metrics, and Figure 6 shows the confusion matrix for VGG16.

Table 8.
VGG16 Model: Classification Metrics.
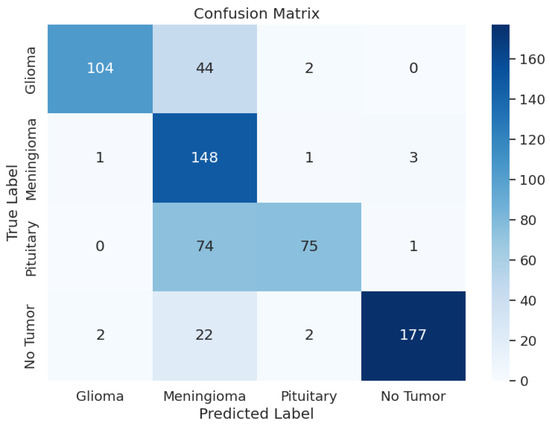
Figure 6.
VGG16 Model: Confusion Matrix.
3.2. Comparison of Model Performances
The evaluation and comparison of the pre-trained models, ResNet50, Xception, EfficientNetV2-S, ResNet152V2, and VGG16, in classifying brain tumors into glioma, meningioma, pituitary, and no tumor reveal distinct performance characteristics that are crucial for enhancing the precision and efficiency of Magnetic Resonance Imaging (MRI) analysis in medical diagnostics. These models play a pivotal role in addressing the critical need for accurate and expedited medical diagnostics in the realm of brain tumor classification. Table 3 shows the performance of all five models, and the green highlighted (Xception) values represent the model that performed best.
4. Conclusions and Future Work
This paper presented a comparative analysis of various pre-trained models for brain tumor classification using MRI images. Xception stood out with a test F1 score of 0.9817. EfficientNetV2-S showcased the second-highest test F1 score of 0.9629. ResNet152V2 achieved a test F1 score of 0.7998, followed by ResNet50 with a test F1 score of 0.7963. VGG16 demonstrated a test F1 score of 0.7756. These results highlight Xception’s superior F1 score in brain tumor classification, making it a highly effective model for MRI analysis.
We envision a software application using the Xception model that clinicians might use to classify images of a patient’s brain after an MRI scan is taken to give an immediate (but tentative) diagnosis. While a specialist should still evaluate such images for a conclusive diagnosis, integrating with a well-developed model could potentially speed up the process and reduce the wait time by weeks. This could provide a patient with some initial indication about whether or not the scans suggest evidence of a tumor rather than having to wait an indeterminate amount of time to learn anything at all.
For future work, we will explore the integration of additional pre-trained models and the application of ensemble learning techniques to further improve classification accuracy.
Author Contributions
Conceptualization, A.A.; methodology, A.A.; software, A.A.; validation, A.A. and A.A.B.; formal analysis, A.A.; investigation, A.A.; intramural resources, A.A.B. and J.A.H.; data curation, A.A.; writing—original draft preparation, A.A.; writing—review and editing, A.A., A.A.B. and J.A.H.; visualization, A.A.; supervision, A.A.B. and J.A.H.; project administration, A.A.B. and J.A.H.; intramural funding acquisition, A.A.B. All authors have read and agreed to the published version of the manuscript.
Funding
This research received no external funding.
Institutional Review Board Statement
Not applicable.
Informed Consent Statement
Not applicable.
Data Availability Statement
The data presented in the study are available in IEEE Dataport at https://dx.doi.org/10.21227/1jny-g144, accessed on 22 May 2024.
Acknowledgments
A.A. would like to extend heartfelt gratitude to Amrutaa Vibho for her help in starting him in AI research, to his sister Archana M. for her informal review of the work in progress, and to his coauthors for their mentorship, guidance, patience, and encouragement. A.A., A.A.B., and J.H. would like to thank Norwich University for the institutional resources necessary for conducting this research.
Conflicts of Interest
The authors declare no conflicts of interest.
References
- Tandel, G.S.; Biswas, M.; Kakde, O.G.; Tiwari, A.; Suri, H.S.; Turk, M.; Laird, J.; Asare, C.; Ankrah, A.A.; Khanna, N.N.; et al. A Review on a Deep Learning Perspective in Brain Cancer Classification. Cancers 2019, 11, 111. [Google Scholar] [CrossRef] [PubMed]
- van der Meer, P.B.; Dirven, L.; Hertler, C.; Boele, F.W.; Batalla, A.; Walbert, T.; Rooney, A.G.; Koekkoek, J.A. Depression and anxiety in glioma patients. Neuro-Oncol. Pract. 2023, 10, 335–343. [Google Scholar] [CrossRef] [PubMed]
- Liu, J.; Pan, Y.; Li, M.; Chen, Z.; Tang, L.; Lu, C.; Wang, J. Applications of deep learning to MRI images: A survey. Big Data Min. Anal. 2018, 1, 1–18. [Google Scholar] [CrossRef]
- Louis, D.N.; Perry, A.; Reifenberger, G.; von Deimling, A.; Figarella-Branger, D.; Cavenee, W.K.; Ohgaki, H.; Wiestler, O.D.; Kleihues, P.; Ellison, D.W. The 2016 World Health Organization Classification of Tumors of the Central Nervous System: A Summary. Acta Neuropathol. 2016, 131, 803–820. [Google Scholar] [CrossRef] [PubMed]
- Department of Financial Regulation. State of Vermont Wait Times Report|Health Services Wait Times Report Findings. State of Vermont. 2022. Available online: https://dfr.vermont.gov/about-us/councils-and-commissions/health-services-wait-times (accessed on 22 May 2024).
- Nall, R. How Long Does It Take to Get MRI Results? 2021. Available online: https://www.healthline.com/health/how-long-does-it-take-to-get-results-from-mri#1 (accessed on 22 May 2024).
- Vamsi, B.; Al Bataineh, A.; Doppala, B.P. Prediction of Micro Vascular and Macro Vascular Complications in Type-2 Diabetic Patients using Machine Learning Techniques. Int. J. Adv. Comput. Sci. Appl. 2022, 13, 19–32. [Google Scholar] [CrossRef]
- Al Bataineh, A.; Kaur, D.; Al-khassaweneh, M.; Al-sharoa, E. Automated CNN architectural design: A simple and efficient methodology for computer vision tasks. Mathematics 2023, 11, 1141. [Google Scholar] [CrossRef]
- Sarvamangala, D.R.; Kulkarni, R.V. Convolutional neural networks in medical image understanding: A survey. Evol. Intell. 2021, 15, 1–22. [Google Scholar] [CrossRef] [PubMed]
- Stančić, A.; Vyroubal, V.; Slijepčević, V. Classification Efficiency of Pre-Trained Deep CNN Models on Camera Trap Images. J. Imaging 2022, 8, 20. [Google Scholar] [CrossRef] [PubMed]
- Chaki, J.; Wozniak, M. Brain Tumor MRI Dataset. IEEE Dataport. 2023. Available online: https://ieee-dataport.org/documents/brain-tumor-mri-dataset (accessed on 22 May 2024).
- Xu, M.; Yoon, S.; Fuentes, A.; Park, D.S. A Comprehensive Survey of Image Augmentation Techniques for Deep Learning. Pattern Recognit. 2023, 137, 109347. [Google Scholar] [CrossRef]
- Alomar, K.; Aysel, H.I.; Cai, X. Data Augmentation in Classification and Segmentation: A Survey and New Strategies. J. Imaging 2023, 9, 46. [Google Scholar] [CrossRef] [PubMed]
- Tanwar, S.; Singh, J. ResNext50 based convolution neural network-long short term memory model for plant disease classification. Multimed. Tools Appl. 2023, 82, 29527–29545. [Google Scholar] [CrossRef]
- He, K.; Zhang, X.; Ren, S.; Sun, J. Deep Residual Learning for Image Recognition. In Proceedings of the IEEE Conference on Computer Vision and Pattern Recognition, Boston, MA, USA, 7–12 June 2015. [Google Scholar]
- Chollet, F. Xception: Deep Learning with Depthwise Separable Convolutions. In Proceedings of the IEEE Conference on Computer Vision and Pattern Recognition, Las Vegas, NV, USA, 27–30 June 2016. [Google Scholar]
- Fan, Y.J.; Tzeng, I.S.; Huang, Y.S.; Hsu, Y.Y.; Wei, B.C.; Hung, S.T.; Cheng, Y.L. Machine Learning: Using Xception, a Deep Convolutional Neural Network Architecture, to Implement Pectus Excavatum Diagnostic Tool from Frontal-View Chest X-rays. Biomedicines 2023, 11, 760. [Google Scholar] [CrossRef] [PubMed]
- Li, N.; Xue, J.; Wu, S.; Qin, K.; Liu, N. Research on Coal and Gangue Recognition Model Based on CAM-Hardswish with EfficientNetV2. Appl. Sci. 2023, 13, 8887. [Google Scholar] [CrossRef]
- Elshennawy, N.M.; Ibrahim, D.M. Deep-Pneumonia Framework Using Deep Learning Models Based on Chest X-ray Images. Diagnostics 2020, 10, 649. [Google Scholar] [CrossRef] [PubMed]
- Qassim, H.; Verma, A.; Feinzimer, D. Compressed residual-VGG16 CNN model for big data places image recognition. In Proceedings of the 2018 IEEE 8th Annual Computing and Communication Workshop and Conference (CCWC), Las Vegas, NV, USA, 8–10 January 2018. [Google Scholar] [CrossRef]
- Baldi, P.; Sadowski, P. The dropout learning algorithm. Artif. Intell. 2014, 210, 78–122. [Google Scholar] [CrossRef] [PubMed]
- Nuti, G.; Cross, A.I.; Rindler, P. Evidence-Based Regularization for Neural Networks. Mach. Learn. Knowl. Extr. 2022, 4, 1011–1023. [Google Scholar] [CrossRef]
- Shen, K.; Guo, J.; Xu, T.; Tang, S.; Wang, R.; Bian, J. A Study on ReLU and Softmax in Transformer. arXiv 2023, arXiv:2302.06461. [Google Scholar] [CrossRef]
- Bjorck, N.; Gomes, C.P.; Selman, B.; Weinberger, K.Q. Understanding Batch Normalization. arXiv 2018, arXiv:1806.02375. [Google Scholar]
- Yong, H.; Huang, J.; Meng, D.; Hua, X.; Zhang, L. Momentum Batch Normalization for Deep Learning with Small Batch Size. In Computer Vision—ECCV 2020, Proceedings of 16th European Conference, Glasgow, UK, 23–28 August 2020; Lecture Notes in Computer Science; Springer International Publishing: Cham, Switzerland, 2020; pp. 224–240. [Google Scholar] [CrossRef]
- Balestriero, R.; Baraniuk, R.G. Batch Normalization Explained. arXiv 2022, arXiv:2209.14778. [Google Scholar] [CrossRef]
- Deng, Y.; Song, Z.; Zhou, T. Superiority of Softmax: Unveiling the Performance Edge Over Linear Attention. arXiv 2023, arXiv:2310.11685. [Google Scholar] [CrossRef]
- Hassan, E.; Shams, M.Y.; Hikal, N.A.; Elmougy, S. The effect of choosing optimizer algorithms to improve computer vision tasks: A comparative study. Multimed. Tools Appl. 2022, 82, 16591–16633. [Google Scholar] [CrossRef] [PubMed]
- Chong, K.L.; Huang, Y.F.; Koo, C.H.; Sherif, M.; Ahmed, A.N.; El-Shafie, A. Investigation of cross-entropy-based streamflow forecasting through an efficient interpretable automated search process. Appl. Water Sci. 2022, 13, 6. [Google Scholar] [CrossRef]
- Patel, N.; Shah, H.; Mewada, K. Enhancing Financial Data Visualization for Investment Decision-Making. arXiv 2023, arXiv:2403.18822. [Google Scholar] [CrossRef]
Disclaimer/Publisher’s Note: The statements, opinions and data contained in all publications are solely those of the individual author(s) and contributor(s) and not of MDPI and/or the editor(s). MDPI and/or the editor(s) disclaim responsibility for any injury to people or property resulting from any ideas, methods, instructions or products referred to in the content. |
© 2024 by the authors. Licensee MDPI, Basel, Switzerland. This article is an open access article distributed under the terms and conditions of the Creative Commons Attribution (CC BY) license (https://creativecommons.org/licenses/by/4.0/).

