Abstract
Land-use and land-cover change (LULCC) is a crucial indicator of environmental transformation and has significant implications for biodiversity, ecosystem services, and climate change. This study investigates land-cover changes between 2017 and 2023 in three distinct mountain regions: the Bucegi Mountains, the Allgäu High Alps, and Mount Olympus. Using remote-sensing data from Sentinel 2 and Geographic Information System (GIS) tools, we analyzed temporal shifts in land-cover types across these regions. The analysis highlights the varying rates and patterns of land-cover transformation in response to environmental and anthropogenic factors. Additionally, the MOLUSCE model was employed to predict future land-cover changes for the year 2029. The findings emphasize the dynamic nature of land-cover in these mountainous areas and offer insights into the potential environmental implications of predicted changes. The Bucegi and the Olympus regions experienced minor land-use changes, while the Allgäu High Alps have the most dynamic changes. The study contributes to a deeper understanding of land-cover dynamics and the applicability of remote sensing and GIS-based predictive models in ecological monitoring.
1. Introduction
Land-use and land-cover changes (LULCCs) have been observed worldwide and represent one of the most significant drivers of social, economic, and ecological change [1]. LULCCs can have negative effects on soil, vegetation, water, and air at local and regional levels. Due to their cumulative impact, the quality of these factors is undergoing a major degradation process at the global level [2].
While there are some monitoring services to ensure protective measures in vulnerable regions, such as protected areas, there is also an indispensable need to assess LULCC, as they can directly impact the whole ecosystem [3]. Mountain areas are especially sensitive to these changes, while they also provide important habitat for rare and endemic species [4,5]. Therefore, the protection and preservation of biodiversity and natural lands in these high elevations are crucial.
Many alpine areas in the world, and especially in Europe, have historically been part of agro-sylvo-pastoral systems and exposed to intense human activities, like grazing, infrastructure, and tourism [6,7]. These activities are often found to shape land-cover, alter treeline levels, and fragment habitats; therefore, the overall ecological status of these mountain systems is in decline [8]. From a geological point of view, sedimentary rocks are more easily eroded, resulting in loosening of the soil and loss of biodiversity, especially when pressed with anthropogenic forces [9]. Climate change exacerbates these LULCC and often affects mountainous areas more intensely due to the elevation-dependent warming, especially in protected areas, because of their sensitivity and vulnerability [3,10]. The primary consequence of these climatic shifts is the upward migration of the treeline toward higher elevations, a process increasingly documented across diverse mountain regions worldwide [11].
Studies focused on overall LULCCs, biodiversity, and ecology in mountain areas are crucial to assess the current state of nature, as well as to provide measures for the future protection of these wildlife habitats and natural heritages. Recently, interest in LULCC in mountainous areas has increased globally [12,13,14]. Regarding this, LULCCs in the Himalaya region, for example, have taken place under conditions of both climate change and anthropogenic pressure [15,16]. In fact, anthropogenic activities have always been vital in shaping ecosystems. Some of the most powerful drivers are agriculture, deforestation, and urbanization; mountainous areas are no exception. For example, in Colombia, within the Andean Mountains, LULCC strongly depends on farming activity, including livestock farming [17], while in Ecuador, according to Guarderas et al. (2022) [5], there is a 40% decline in native montane forests. Similarly, on the African continent, in Ethiopia, the highlands’ forested area has shrunk from 27.5 million ha over the past 25 years to just 3.4 million ha, and this process is accentuated by shifts in the rainfall regime of the region as well [18,19].
European-scale LULCC research has mostly focused on the Alpine and Carpathian regions, where there is evidence that socio-economic decisions implemented during the last two decades of the twentieth century have contributed both to habitat loss as well as to changes in traditional agricultural practices [20]. Another example is the Tatra Mountains in the Western Carpathians, where LULCCs have been driven by the establishment of a national park, forest management practices, natural disturbances, land abandonment, and the expansion of tourism [21]. Using LULCC data, Garcia-Llamas et al. (2019) [22] assessed short-term temporal patterns of ecosystem services in the Cantabrian Mountains with regard to aspects such as timber supply and the use of areas for recreation and tourism. Recent studies on Mediterranean mountain regions suggest that LULCC is causing profound alterations in ecosystem services and increasing vulnerability, even more so than climate change [23].
However, similar trends can be found even in protected areas, such as Bucegi National Park in Romania, where erosion further enhances stress on vegetation and speeds up LULCC [24]. Conversely, areas like Mount Olympus have shown an increase in forest cover due to land abandonment and uphill treeline advance [25]. Additionally, several other factors indirectly related to human disturbance contribute to these transformations: bark beetle infestation, increasing wildfires, and, finally, climate change [26].
Geographic Information Systems (GIS) and remote sensing are often employed in LULCC assessments. In particular, Landsat-derived imagery and supervised classifications are often used to derive land-cover classes for LULCC analysis [27,28,29]. Other authors have combined supervised classification with various spectral indices in land-use temporal-change detection. For example, Khan et al. (2022) [30] used the Modified Soil-Adjusted Vegetation Index (MSAVI) for the Hindu Kush region, while Jovanović et al. (2015) [31] used the Normalized Difference Vegetation Index (NDVI) for the Zlatibor Mountains in Serbia. Though Landsat imagery is often used in long-term LULCC studies, it suffers from coarse resolution (30 m). More recent studies have employed Sentinel-2 imagery due to its higher resolution (10 m for visible and NIR bands), especially for complex landscapes with a high degree of fragmentation [32].
Modelling and simulating LULCCs are essential for understanding landscape dynamics and forecasting trends in sensitive regions like mountain, peri-urban, and rural areas. The Modules for Land-Use Change Evaluation (MOLUSCE) plugin, integrated into the open-source QGIS environment, is increasingly utilized in LULCC analysis and prediction studies due to its methodological flexibility. By integrating multi-temporal remote-sensing data with statistical methods and machine learning, MOLUSCE identifies transition patterns and evaluates anthropogenic pressures. This versatile tool supports spatial planning and sustainable management by establishing probabilistic relationships between LULCCs and driving factors [33,34].
Long-term studies are valuable for identifying overall trends, yet short-term studies provide critical insights into the dynamics and rapid responses of vulnerable systems, thereby offering stronger support for natural resource management and sustainable urban planning [35]. The aim of this study is to analyze LULCCs across three European mountain regions that have historically been shaped by intensive agro-sylvo-pastoral activities. For this purpose, we selected the Bucegi Mountains in the Carpathians, the Allgäu High Alps in the Alps, and Mount Olympus in the Olympus range. The specific objectives are as follows: to assess short-term LULCCs (2017–2023) in these regions and identify their anthropogenic and natural drivers, to compare the three sites to detect potential trends, and to project near-future changes (to 2029) based on the identified patterns, with the aim of informing management strategies.
2. Materials and Methods
2.1. Study Areas
The areas chosen for analysis belong to some of the most representative mountain massifs from different parts of Europe (Figure 1a): the Bucegi Mountains in Romania, the Allgäu High Alps in Germany, and Mount Olympus in Greece. The selection of the three study areas was based on differences in environmental characteristics and socio-economic conditions across various regions of Europe. The Bucegi Mountains, Allgäu High Alps, and Mount Olympus are found at different latitudes with varied climatic conditions, geomorphology, as well as land-use conditions, with differing management approaches and pressures exerted by human activities. Although all three regions are characterized by complex mountain environments and long-term human interaction, they differ in terms of land-use practices, conservation frameworks, and development trajectories. This combination of shared mountain characteristics and regional contrasts provides a suitable basis for a comparative analysis of short-term land-use and land-cover changes.
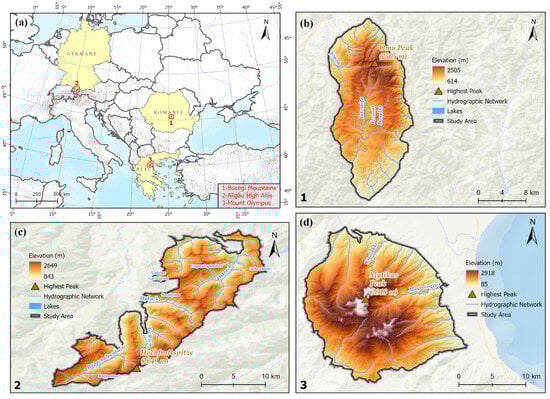
Figure 1.
(a) The study areas: (b) Bucegi Mountains, (c) Allgäu High Alps, (d) Mount Olympus.
The Bucegi Mountains (Figure 1b), part of the Southern Carpathians, are located in central Romania, having an area of 294.8 km2 and a maximum altitude of 2505 m in Omu Peak, in the northern part of the massif. The geology comprises limestone and conglomerates with sandstone intercalations, resulting in numerous landforms, such as the Babele and Sphinx, with high scenic, scientific, and economic value [36,37]. From a climatic perspective, temperatures are generally low (−2.5 °C to 3 °C), with precipitation ranging from 1100 to 1400 mm/year and a minimum snow coverage of 200 days per year. However, in recent years, decreasing precipitation, increasing temperatures, and extreme weather phenomena linked to climate change have led to a reduction in biodiversity in the region [38]. The vegetation is a mix of dwarf pine (Pinus mugo), patches, shrubs (Rhododendron), and meadows, while at higher altitudes, alpine meadows prevail, where the vegetation is sparse, consisting mainly of small herbs, lichens, and small willows, such as Salix herbacea [39].
The Allgäu High Alps (Figure 1c) have been an important nature reserve since 1992 within the Alps and are among the largest (207 km2) natural areas under protection in Germany. It is often used for education purposes and tourism, as well as controlled grazing. The mountain range is part of the Northern Limestone Alps and comprises sedimentary rocks shaped by oceanic and riverine deposits, such as limestone alpine rock (dolomite, limestone, marl), flysch, and molasse [40]. The maximum elevation in the study area reaches 2649 m at Hochfrottspitze. Most tributaries have experienced human management, like dams or river straightening, but the remaining non-disturbed areas are essential to preserving endangered species [41]. The vegetation cover on the steep hills has a significantly high ratio of alpine grasslands and meadows instead of forest due to the historical grazing of sheep and cattle, which is often the case in the Alps [26]. At lower elevations, forest cover is mixed, whereas at higher elevations, pine communities (e.g., Vaccinio-Pinetum cembrae) and carbonate-rich spruce stands are becoming more prevalent, with spruce emerging as the dominant species across the entire region [42,43].
Mount Olympus (Figure 1d), the highest mountain in Greece, reaches an elevation of 2918 m (Mytikas Peak). From a geological point of view, Mount Olympus has a complex Alpine geological and tectonic structure. The lithology consists of neritic carbonate rocks, which range from Triassic to Eocene in age, ending with a late Eocene flysch [44]. Above these formations, several geotectonic units have been deposited, including the high-pressure/low-temperature metamorphic rocks [45]. Vegetation changes in this area are mainly represented by an increasing presence of less cold-adapted species and the expansion of shrub cover. Consequently, treeline and vegetation shifts are closely associated with the spread of warm-tolerant species, highlighting the high vulnerability of alpine ecosystems to climate change [46].
2.2. Data Type
The LULCC data utilized in this study were obtained from a pre-existing dataset produced by the Copernicus programme and provided by the European Commission as part of its environmental monitoring initiatives. We used version 003 of the global Sentinel-2 land-use/land-cover data package in this analysis. It was created by a deep learning model that was trained on more than five billion manually labelled Sentinel-2 pixels from more than 20,000 locations spread throughout the world’s major biomes. Six bands of Sentinel-2 L2A surface reflectance data (visible blue, green, red, near-infrared, and two shortwave infrared bands) are used by the underlying deep learning model. The model is run on several imaging dates over the course of the year, and the results are combined to produce a final representative map for each year. The main classes from Sentinel 2, used in the analysis, were as follows: water, trees, crops, built area, bare ground, ice/snow, and rangeland [47].
2.3. Methods
In this study, GIS techniques were integrated with multi-temporal remote-sensing data to quantify spatiotemporal LULCC dynamics. This approach enabled the systematic collection, spatial analysis, and visualization of landscape transitions, providing the necessary empirical framework for the subsequent simulation stages [48].
The LULCC analysis was conducted using an annual time step (2017–2023) to capture inter-annual dynamics and identify temporary or reversible transitions that longer observation intervals might obscure. This resolution is particularly relevant for sensitive mountain and protected areas, as it allows for the detection of short-term variations linked to climatic factors (fluctuating snow and ice cover) and anthropogenic activities. Furthermore, the annual approach provides a more rigorous empirical foundation for the transition probability matrices used in the MOLUSCE simulations, which derive probabilities from the continuous temporal succession of land-cover classes. Rather than assuming rapid change, this temporal unit was selected to faithfully describe the gradual, cumulative spatio-temporal dynamics and ensure methodological consistency throughout the predictive-modelling stage.
We analyzed data using both ArcGIS 10.8 (Esri, Redlands, CA, USA) and QGIS 3.34.9 (QGIS.org, Grüt, Switzerland) and predicted future scenarios using the QGIS MOLUSCE plugin 1.1. The graphs that show the difference in changes between different regions were computed in Excel, while the ones that show LULCCs from one year to another for each region were computed using a Sankey Diagram. The general workflow of the GIS analysis is represented in Figure 2.
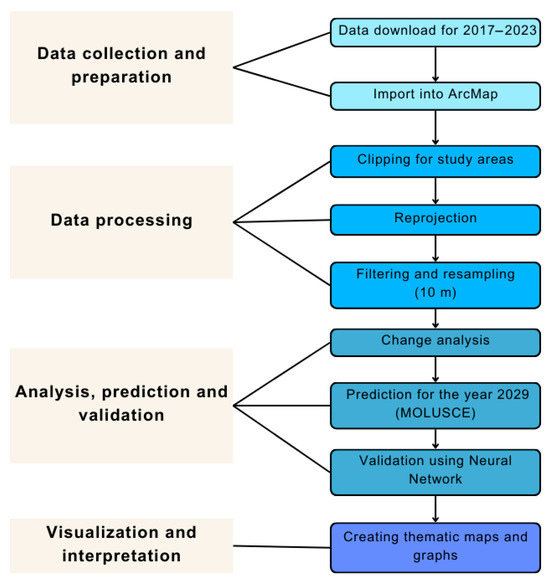
Figure 2.
Workflow of the general analysis.
After downloading the data for the 2017–2023 interval, raster images for all study areas were imported into ArcGIS for land-cover classification and temporal-change analysis. To facilitate a detailed statistical and visual analysis of the annual transitions, a vector-based workflow was adopted for the historical change detection phase. The rasters were first converted into vector format using the Raster to Polygon tool (ArcToolbox → Conversion Tools → From Raster → Raster to Polygon), resulting in a polygon layer where regions with identical raster values were transformed into distinct polygons. To simplify the dataset, the Dissolve tool (ArcToolbox → Data Management Tools → Generalization → Dissolve) was applied to merge adjacent polygons with the same attributes into single features, thereby aggregating entities according to land-cover class. For change detection, the Intersect tool was employed to identify overlapping areas between land-use layers from different years, producing new layers that highlighted land-cover modifications by combining attributes from all inputs. Change analysis was performed on consecutive years (2017–2018, 2018–2019, etc.), and the results were introduced in tables to track land-cover evolution and provide a comprehensive overview of year-to-year dynamics.
We used the MOLUSCE plugin (NextGIS) for QGIS for land-use simulations. The model integrates critical variables, such as topographic and accessibility factors, employing diverse modelling approaches, including logistic regression, Artificial Neural Networks (ANN), and nearest neighbour methods [49]. This methodological flexibility allows MOLUSCE to capture complex relationships between driving factors and LULCC dynamics, as evidenced by Perović et al. (2018) [50] in geomorphological impact assessments. Furthermore, studies by Satya et al. (2020) [51] and Muhammad et al. (2022) [52] validate the plugin’s reliability in simulating medium-term urban growth and rapid urbanization scenarios using high-resolution remote-sensing data and open-source tools.
The output consists of raster layers that provide modelled projections of land-cover evolution, validated through the analysis of errors and comparison with observed data. These will help decision-makers in resource management, land-use planning, and urban development scenarios.
To assess the performance of the LULCC simulation model, we applied a retrospective validation method by comparing the simulated land-cover maps with the observed data for the analyzed period. This validation was conducted using the statistical indicators integrated into the MOLUSCE plugin, including Overall Accuracy and the Kappa coefficient. These metrics are widely recognized as standards for assessing modelling studies based on Markov Chains and ANN. Specifically, the validation of LULCC scenarios employed the ANN multilayer perceptron approach, which is designed to model complex, non-linear relationships between land-cover transitions and their driving factors, representing a standard practice in spatial prediction studies.
The training process was monitored via the learning curve, which tracks the error evolution for both training and validation sets as a function of the number of epochs. Convergence is reached when the training error stabilizes after a rapid initial decrease, while the absence of progressive separation between training and validation curves indicates that the model does not suffer from overfitting.
To quantify the model’s predictive performance, statistical indicators including overall accuracy and the Kappa coefficient were calculated. In this study, the high Kappa values were analyzed in the context of spatial resolution, the number of land-cover classes, and the deterministic nature of the dominant transitions. Similar high-accuracy results have been documented in studies characterized by high landscape stability and gradual spatial changes [33,53]. This validation framework ensures that the model captures the high spatial consistency of the patterns analyzed, providing a reliable baseline for future simulations.
3. Results
3.1. LULCC Analysis
From 2017 to 2023, the Bucegi Mountains exhibited limited change in land-cover (Figure 3 and Figure 4, Table 1). In the period studied, the bare ground decreased from 0.70 km2 to 0.45 km2, with the largest share lost being in favour of tree and rangeland classes. The changes in the built-up area class have been low, while some sections have also turned into trees and water zones. Rangelands showed the highest coverage in 2022, reaching 86.01 km2. Additionally, several spots grew in the category of trees, with a peak value of 211 km2 in 2019, though part of the area again turned to rangeland and bare ground due to local deforestation or natural vegetation dynamics. The water class remained largely stable (ranging from 1.03 to 1.09 km2), but partial areas were gained from rangeland and bare ground, which can be interpreted as potential degradation of water resources or hydrological changes. Other land uses, such as crops, do not show significant changes at all, while the ice/snow areas are increasing.
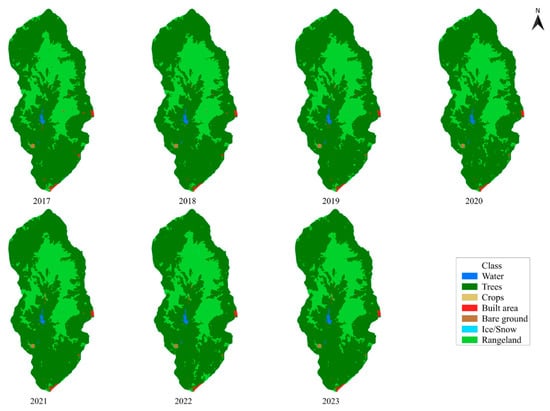
Figure 3.
Bucegi Mountains LULCC (2017–2023).
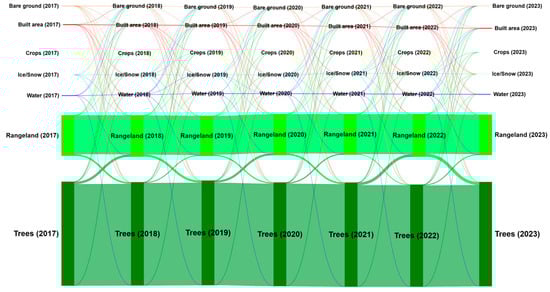
Figure 4.
Bucegi Mountains: Sankey diagram of LULCC (2017–2023).

Table 1.
Bucegi Mountains land-cover class areas (km2) by year.
In the Allgäu Alps, land-use dynamics between 2017 and 2023 highlight relevant interannual fluctuations (Figure 5 and Figure 6, Table 2), particularly for the bare ground class, which reached its maximum extent of 2.6 km2 in 2023 by encroaching on former ice and snow-covered areas. The land-use class describing built-up areas covers minimal surfaces in the same period and did not show remarkable changes, even though parts were converted into tree and rangeland classes. Conversely, the transitions of rangeland into classes describing crops and ice/snow indicate the possible expansion of agriculture alongside the fluctuation of climate conditions in the study area. In particular, between 2018 and 2019, rangeland lost 8.5 km2 to the ice/snow category. This category increased to more than 10.2 km2 in 2019, surpassing 13.6 km2 in 2021, but then lost important areas in the following years, reaching 3.4 km2 in 2023. Considering the net balance with the other categories, rangeland recovered the lost surfaces and reached 99 km2 in 2023. Several regions present an increase in the tree category, but part of the trees reverted to rangeland and bare ground classes. This phenomenon may be explained by local deforestation or the result of the natural evolution of vegetation. In 2019, trees gained extensive surfaces from rangeland and attained their maximum extent of 122 km2, but then lost area, coming to 102 km2 in 2023. The water class remains substantially stable.
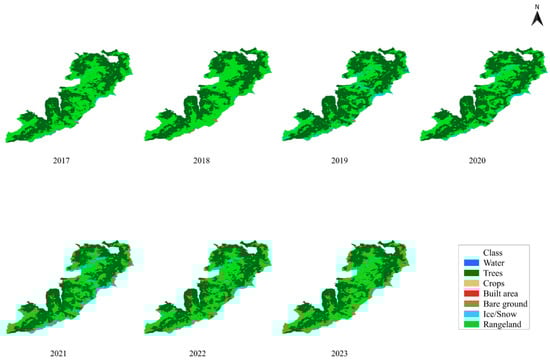
Figure 5.
Allgäu High Alps LULCC (2017–2023).
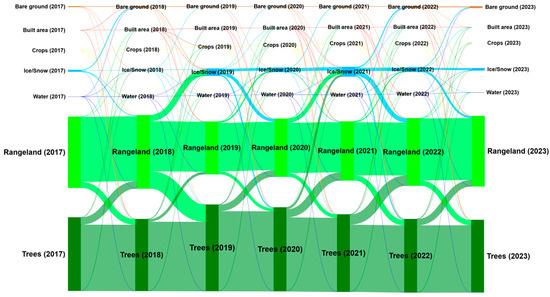
Figure 6.
Allgäu High Alps: Sankey diagram of LULCC (2017–2023).
Table 2.
Allgäu High Alps land-cover class areas (km2) by year.
For Mount Olympus, the data indicate a decrease in bare ground areas to 6.12 km2 in 2023, as these surfaces were converted into built-up areas, pastures, and snow-covered zones (Figure 7 and Figure 8, Table 3). The category of built-up land showed a minimal increase, as it developed on previously bare ground and rangeland, although small parts of it were then returned to trees and rangeland due to either restoration efforts or a change in the management of those lands. Cropland showed a constant area within the range of 0.04 to 0.09 km2 during the same time period. The most variation was seen in the class of ice/snow, which, after being reduced by 1.6 km2 in 2019 due to bare ground and rangeland, gained back slightly through 2023, amounting to 2.2 km2. Rangeland was the other highly dynamic class, which, while gaining ground over bare ground and cropland, lost some sections to ice/snow and trees and stabilized around 114 km2. The tree category is rather stable at around 250 km2, advancing on the former rangeland and water classes, while water bodies showed minimal reductions. Overall, the general trend described here points to a dynamically balanced situation among land-cover categories, with the two most variable classes represented by ice/snow and rangeland.
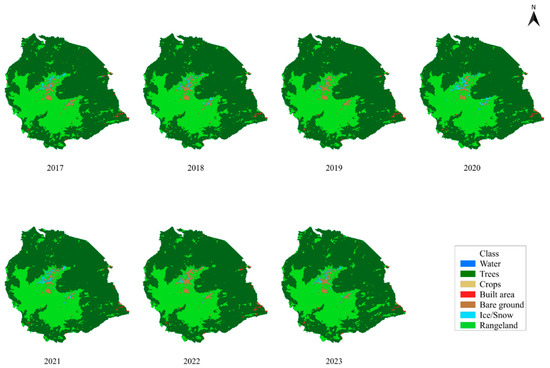
Figure 7.
Mount Olympus LULCC (2017–2023).
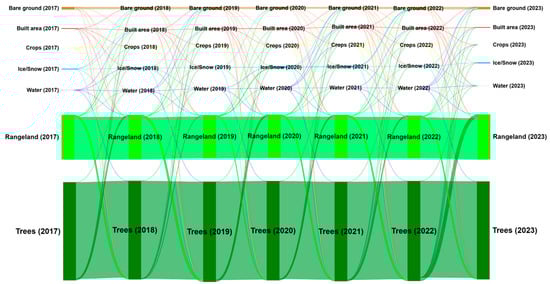
Figure 8.
Mount Olympus: Sankey diagram of LULCC (2017–2023).
Table 3.
Mount Olympus land-cover class areas (km2) by year.
3.2. Comparative Analysis Across the Regions
The comparative analysis of LULCC highlights structural differences among the three regions (Figure 9). Mount Olympus presents the smallest proportion of water-covered area, below 0.02%, constant over the entire study period (Figure 9a). The Allgäu High Alps water-covered area, affected by glacial lakes, ranges between 0.10 and 0.15% and presents a slight increasing trend. The Bucegi Mountains present the largest shares of water-covered area, 0.35–0.38%, due to the presence of reservoirs. The dynamics of ice and snow cover vary significantly across the study areas (Figure 9b). The minimum values (<0.05%) correspond to the Bucegi Mountains due to the complete absence of glaciers, while Mount Olympus reached approximately 0.5%, with a peak of 1% in 2020, followed by a gradual decline. In contrast, the Allgäu High Alps exhibit the highest values, peaking at 6.7% in 2021 before dropping sharply to 1.7%. The smallest proportion of bare ground is observed in the Bucegi Mountains (~0.2%), whereas in the Allgäu Alps it increases to over 1.2% in 2023, and on Mount Olympus it ranges between 1.4% and 1.8% (Figure 9c).
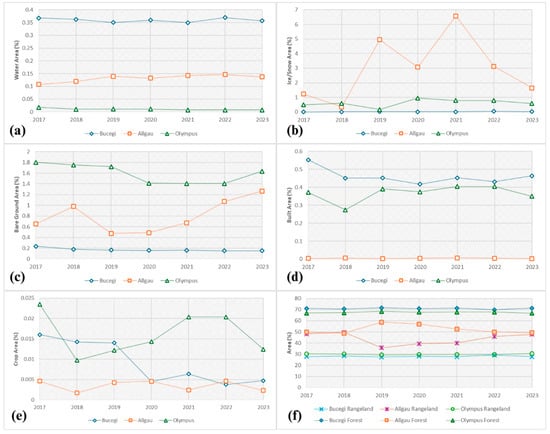
Figure 9.
Class changes in 2017–2023: (a) Water, (b) Ice/Snow, (c) Bare Ground, (d) Built Area, (e) Crop, (f) Forest and Rangeland.
Regarding built-up land, its extent remains negligible in the Allgäu Alps (<0.01%), whereas on Mount Olympus it ranges between approximately 0.28% and 0.40%, reaching a maximum of 0.36% during 2021–2022. In contrast, the Bucegi Mountains exhibit a decreasing trend (Figure 9d). Cropland area presents the smallest shares across all regions, accounting for less than 0.005% in the Allgäu Alps, decreasing from 0.015% to 0.004% in the Bucegi Mountains, and ranging between approximately 0.01% and 0.02% on Mount Olympus (Figure 9e). In both the Bucegi and Olympus, forests dominate at ~69–70%, while rangeland maintains a stable share of ~29–30%. In the Allgäu, the balance is more dynamic; starting from ~50% forest and rangeland in 2017–2018, it shifted to 59% forest and 36% rangeland in 2019, then gradually returned to the initial proportions (Figure 9f).
Between 2017 and 2023, land-use dynamics exhibited contrasting percentage and absolute variations across the three study regions (Figure 10a,b). Bare ground decreased in the Bucegi Mountains and Mount Olympus, while in the Allgäu High Alps, it expanded by ~92% compared to the initial year. Built-up areas declined across all three regions, with the sharpest drop in the Allgäu (~40%). Croplands also decreased everywhere, most notably in the Bucegi Mountains (−70%), though the total area remained below 0.1 km2. Ice-/Snow-covered surfaces showed an overall increasing trend, with the Bucegi recording the largest relative growth (+590%), while in absolute terms, the Allgäu gained the most (+0.9 km2). Water bodies slightly expanded in the Allgäu but contracted in the Bucegi and particularly in Olympus (−50%), although the absolute extent remained negligible. Forests and rangelands exhibited changes below 1.5% in relative terms, yet absolute values reveal forest loss in the Bucegi and the Allgäu and gains in Olympus. Conversely, rangelands expanded in the Bucegi Mountains while declining in the other two ranges.
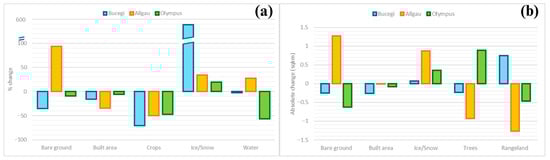
Figure 10.
Percentage (a) and absolute change (b) of classes in 2017–2023.
3.3. Prediction Analysis for Each Region
The projected land-cover for 2029 suggests distinct transformation patterns across the three study regions (Figure 11, Table 4). In the Bucegi Mountains (Figure 11a), major transformations are to be expected, with forest loss (−0.68 km2) primarily converted to rangeland (+1.2 km2). Built-up land and croplands are projected to shrink, partly transitioning into ice, possibly reflecting climate-related processes. Water-to-rangeland conversions suggest declining water availability, while the reduction in bare ground (−0.42 km2) indicates vegetation colonization of steep slopes. Forest boundaries also appear to shift westward, reflecting potential altitudinal or spatial migration.
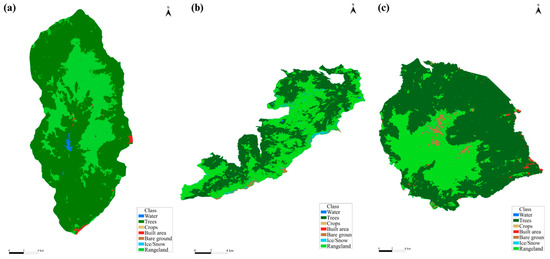
Figure 11.
Prediction of land-cover in 2029: (a) Bucegi Mountains, (b) Allgäu High Alps, (c) Mount Olympus.
Table 4.
Bucegi Mountains, Allgäu High Alps, and Mount Olympus projected LULCC area (km2) from 2023 to 2029.
In the Allgäu High Alps (Figure 11b), forests (102.2 km2 in 2023) are predicted to slightly expand (+0.65 km2), while rangelands decline. Water bodies would show minor, temporary transformations but stabilize by 2029. Built-up land would remain relatively constant, while bare ground would undergo significant reorganization, being converted to forests yet still persisting at 3.1 km2. Ice/snow cover is projected to reduce substantially, with losses to forests and bare ground, signalling ongoing glacial retreat.
For Mount Olympus (Figure 11c), forests dominate the landscape (249.6 km2 in 2023) and are predicted to expand further (+3.4 km2) by converting grasslands and croplands. Water areas would remain stable at ~0.03 km2, while bare ground would increase, pointing to agricultural abandonment or soil degradation. Built-up land is expected to grow due to urbanization and infrastructure development. By contrast, ice cover is projected to decline sharply, consistent with melting processes in this mountainous environment.
3.4. Validation of the Model
Figure 12 represents the learning curve of the neural network used in the training and validation process. The horizontal axis represents the number of epochs or iterations, and the vertical axis represents the error. The green curve indicates the error on the training set, and the red curve indicates the error on the validation set. Large fluctuations are observed in the validation case, suggesting that there is overfitting or high variability in the validation data. The marked points indicate key values during training:
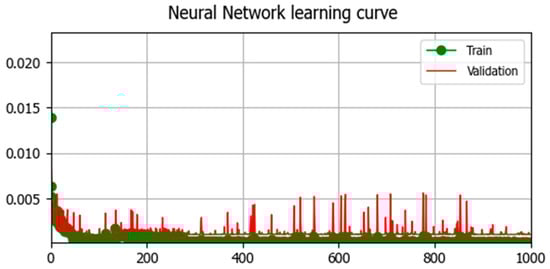
Figure 12.
Learning curve of neural network for validation.
- X-axis—represents the number of epochs (iterations) that the neural network has gone through during training.
- Y-axis—represents the error value (loss), which indicates the difference between the model predictions and the actual values.
- Green curve (Train)—the errors calculated on the training data set. This shows how the model adjusts to learn the patterns in the training data.
- Red curve (Validation)—the errors calculated on the validation dataset, which measures how well the model generalizes to new data, not used in training.
Both training and validation errors start at high values because the model initially has no knowledge of the data. As training progresses, the error rate decreases rapidly with increasing epochs, reflecting the model’s learning of data patterns. After approximately 200 epochs, the training error (green curve) stabilizes, indicating proper model adjustment to the training set. By contrast, the validation error (red curve) shows stronger variability, a common effect of complex datasets or smaller validation samples. Despite these fluctuations, the values remain low overall, suggesting that the model demonstrates good generalization capacity. Noticeable divergence between the two curves would have indicated overfitting and poor generalization.
Figure 13 presents a graphical representation of a multi-resolution stream, illustrating different levels of spatial detail and information availability. The axes represent accuracy and quantity of spatial information, while colours and symbols correspond to various accuracy scenarios. The connecting lines highlight how information varies under the different conditions.
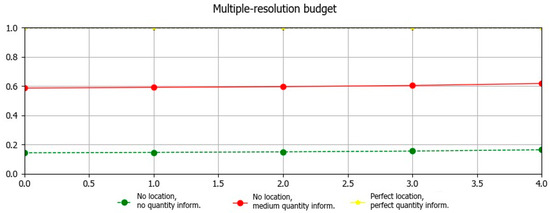
Figure 13.
Multi-resolution stream.
Figure 14 presents the statistical indicators of the validation process carried out with the MOLUSCE plugin in QGIS. The results show a correctness rate of 100% and a Kappa coefficient of 1.000 across all categories (general, histogram, and location). Such values indicate a perfect match between the tested data and the obtained results, which may either reflect exceptional model performance or, alternatively, suggest potential overfitting to the validation dataset.
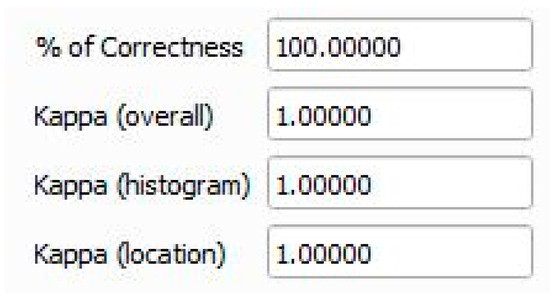
Figure 14.
Statistical indicators for validation.
The model validation results indicate a high level of agreement between the simulated and observed maps, as reflected by the robust values for Overall Accuracy and the Kappa coefficient. These findings suggest that the model successfully reproduced the dominant spatial patterns of land-cover transitions within the analyzed interval, thereby providing a solid foundation for the simulation of future scenarios.
4. Discussion
Land-cover in the analyzed regions is subject to significant transformations due to a combination of climate change, anthropogenic pressures, and natural geomorphological processes [54]. Widespread deforestation and conversion of grassland into other land types have caused severe ecological consequences, such as biodiversity loss, soil degradation, and changes in hydrological cycles [55]. These results highlight the need for spatially targeted conservation strategies that prioritize ecologically sensitive and climatically vulnerable mountain ecosystems.
From a land management and policy perspective, the observed land-use changes, particularly farmland abandonment in mountain regions, require careful consideration beyond biodiversity conservation alone [56]. Previous studies have shown that land abandonment in alpine environments leads to increased evapotranspiration, reduced runoff, and a consequent decline in hydroelectric potential; effects that are largely driven by increased leaf area following shrub and forest encroachment [57,58].
The Bucegi Mountains, in particular, show intensive LULCC with pronounced signs of ecological instability. Large-scale modifications of natural landscapes accelerate biodiversity decline but also hinder local economies and challenge the sustainability of natural resource management. Terrestrial ecosystems are still very sensitive to anthropogenic pressures, and continuous monitoring and climate change modelling are crucial for anticipating their future dynamics [59]. For example, vegetation mapping of the Bucegi Mountains (Figure 15a,b) shows upward shifts: Salix appendiculata has reached higher elevation levels than normally expected within its range, whereas the Larix and Abies species have migrated upward during the last decade. LULCCs and upward vegetation shifts in the Bucegi Mountains necessitate adaptive management within protected areas. Key strategies, including strengthening ecological connectivity, restricting high-altitude infrastructure, and implementing long-term monitoring, are vital for mitigating habitat fragmentation and enhancing ecosystem resilience to climate [60,61].
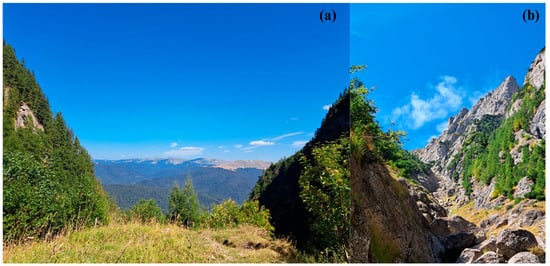
Figure 15.
Vegetation at 1709 m in Bucegi Mountains: (a) Salix appendiculata; (b) Larix and Abies. Source: Jujea-Boldesco V.F.
The Allgäu High Alps seem to be the area least disturbed by urbanization and infrastructure development among all these study sites. The area, however, recorded the most pronounced changes in tree cover, rangeland, bare ground, and ice. Reforestation efforts, among them the Mountain Forest Initiative (Bergwaldoffensive, BWO), have been active during recent decades and most probably were responsible for forest recovery in the Allgäu Alps [43]. Counterbalancing factors include stressors, like bark beetle attacks, heavy storms, and deer browsing, which together can explain the loss in tree cover from 2019 to 2023 [42]. In high-elevation southern zones, the conversion of rangelands into barren areas appears to be linked to erosion processes intensified by extreme weather events [26], suggesting that soil conservation and sustainable grazing policies remain critical. Furthermore, the high variability in ice and snow cover may also be influenced by winter tourism infrastructure and artificial snow production, indicating the need for integrated land-use planning approaches that balance tourism development and environmental conservation.
Further evidence from Mount Olympus can be seen in the shifting of the treeline upward by some 40 m during the past six decades. It lost much of its non-forested land mainly because of the increased growing-season temperatures, according to Zindros et al. (2020) [25]. The interplay between natural variability with human activities shows that while built-up areas are increasing, ice-covered regions are still shrinking, and other classes of land are in dynamic transition to new uses.
Another notable finding is the apparent increase in snow and ice cover across the three studied regions, which goes against the broader global patterns where mountainous zones are expected to register a decrease due to decreases in winter precipitation along with higher temperatures [62]. However, Notarnicola (2020) [63] argues that mid-altitude zones below 4000 m may have even higher variability and may, therefore, express these kinds of short-term anomalies. Long-term forecasts still show significant declines in snow-and-ice cover during a warmed climate.
In mountain regions, integrating land-use change analysis with ecosystem assessments offers a valuable framework for informing spatial planning and conservation policies. Such approaches help identify trade-offs between land abandonment, reforestation, traditional pastoralism, and ecosystem service provision, which are particularly pronounced in mountainous landscapes [64].
The LULCCs observed within the seven-year period remain relatively minor (up to 1.3 km2) and are, thus, not ecologically significant. Predicting toward 2029, no unified trajectory across the study areas has emerged because of the dynamics respective to each mountain environment. However, further research integrating ecological indicators, such as biodiversity patterns of flora and fauna, will be necessary to provide stronger insights into sustainable management strategies.
5. Conclusions
This study identifies complex natural dynamics across three European mountain regions: the Bucegi Mountains, the Allgäu High Alps, and Mount Olympus. LULCCs were minimal within the Bucegi Mountains from 2017 to 2023. Notable transformations include a decline in bare ground and an increase in trees; generally, the area remained stable for most land-cover categories. Changes in rangeland to crops and ice/snow imply either local climatic or human influences, and may have consequences for both environmental conditions and tourism. In contrast, the Allgäu High Alps showed significant changes in most land-cover classes, mainly within the category of ice/snow. The retreat of ice/snow and rangeland to crops indicates that this area is highly sensitive to climate change.
Changes in the dynamics of forest and rangeland areas show a balance between natural forces and human land-use practices, where there is a decline in tree cover but an increase in rangeland. The Mount Olympus region exhibited diverse land-cover dynamics, with some decrease in bare ground and an increase in both built-up areas and trees. The area of ice/snow varied greatly, and the change in rangeland into other classes might indicate vegetation changes driven by natural processes or due to interference by humans. However, the dominant land-cover still includes trees, which prove resilient amidst other cover changes.
This comparative analysis has shown different land-use patterns among the three regions. The Bucegi Mountains had the smallest change in built areas and ice cover, while the Allgäu High Alps and Mount Olympus experienced more dynamic transformations in ice and rangeland areas. Such a differentiation could point to the generally varying strength of anthropogenic and natural influences among the three regions.
Projections up to 2029 show further LULCCs. The areas of water and bare ground are predicted to increase in some regions, like the Bucegi and the Allgäu High Alps. In the case of Mount Olympus, an increase in forested areas is predicted, thus indicating natural development or recovery processes. Such tendencies reflect far-reaching environmental modifications, possibly as a result of climate change and other factors related to human life, such as urbanization and agriculture.
Despite the insights gained, this study is subject to several limitations that warrant consideration. First, the reliance on a pre-existing Copernicus land-cover dataset involves spatial resolution constraints that may limit the detection of small-scale transitions. Second, while the annual temporal scale effectively captures general trends, it may not fully account for seasonal variations or extreme events. Regarding the modelling process, the simulations conducted via the MOLUSCE plugin assume the continuity of observed transition patterns; furthermore, uncertainties related to explanatory variable selection, Artificial Neural Network (ANN) parameterization, and Markov Chain structure may influence predictive accuracy. Future research could address these limitations by integrating higher-resolution land-cover data, extending the temporal scope, and comparing multiple modelling frameworks, such as CA-ANN, Random Forest, or deep learning models, to further evaluate prediction robustness and rigorously quantify associated uncertainties.
LULCCs in mountainous areas are a complex interplay between natural and human-induced factors, having a high impact on local ecosystems and even global climate conditions. It is necessary that land management practices be instituted in a way that gives conservation a priority while meeting the requirements of development.
Author Contributions
Conceptualization, V.-F.J.-B. and M.-Ș.C.; methodology, V.-F.J.-B., A.N. and M.-Ș.C.; validation, A.D.-C. and V.-F.J.-B.; formal analysis, N.C.; investigation, M.-Ș.C.; resources, V.-F.J.-B., N.C., M.-Ș.C. and A.D.-C.; data curation, A.D.-C.; writing draft preparation, M.-Ș.C.; writing and editing, V.-F.J.-B. and M.-Ș.C.; visualization, V.-F.J.-B.; supervision, V.-F.J.-B. and A.N. All authors have read and agreed to the published version of the manuscript.
Funding
This research received no external funding.
Data Availability Statement
The original data presented in the study are openly available in global Sentinel-2 Land Use/Land Cover Data Package at: https://livingatlas.arcgis.com/landcoverexplorer/ (accessed on 5 December 2025).
Acknowledgments
We would like to thank all the professors involved in coordinating the TRANSMOUNT Programme for their continuous guidance and valuable advice whenever support was needed. The authors would like to thank Katica Kotany for her valuable feedback regarding the aesthetic design of the figures. This article was made possible through our participation in the CIVIS BIP Programme TRANSMOUNT—Transitions in Mountain Environments.
Conflicts of Interest
The authors declare no conflicts of interest.
References
- Pelorosso, R.; Leone, A.; Boccia, L. Land cover and land use change in the Italian central Apennines: A comparison of assessment methods. Appl. Geogr. 2009, 29, 35–48. [Google Scholar] [CrossRef]
- Popovici, E.A.; Bălteanu, D.; Kucsicsa, D. Assessment of changes in land-use and land-cover pattern in romania using corine land cover database. Carpathian J. Earth Environ. Sci. 2013, 8, 195–208. [Google Scholar]
- Tasser, E.; Leitinger, G.; Tappeiner, U. Climate change versus land-use change—What affects the mountain landscapes more? Land Use Policy 2017, 60, 60–72. [Google Scholar] [CrossRef]
- Dagnino, D.; Guerrina, M.; Minuto, L.; Mariotti, M.G.; Medail, F.; Casazza, S. Climate change and the future of endemic flora in the South Western Alps: Relationships between niche properties and extinction risk. Reg. Environ. Chang. 2020, 20, 121. [Google Scholar] [CrossRef]
- Guarderas, P.; Smith, F.; Dufrene, M. Land use and land cover change in a tropical mountain landscape of northern Ecuador: Altitudinal patterns and driving forces. PLoS ONE 2022, 17, e0260191. [Google Scholar] [CrossRef]
- Drăgan, M.; Mureşan, G.A.; Benedek, J. Mountain wood-pastures and forest cover loss in Romania. J. Land Use Sci. 2019, 14, 397–409. [Google Scholar] [CrossRef]
- Hedenås, H.; Christensen, P.; Svensson, J. Changes in vegetation cover and composition in the Swedish mountain region. Environ. Monit. Assess. 2016, 188, 452. [Google Scholar] [CrossRef]
- Tasser, E.; Leitinger, G.; Tappeiner, U.; Schirpke, U. Shaping the European Alps: Trends in landscape patterns, biodiversity and ecosystem services. Catena 2024, 235, 107607. [Google Scholar] [CrossRef]
- Rapuc, W.; Giguet-Covex, C.; Bouchez, J.; Sabatier, P.; Gaillardet, J.; Jacq, K.; Genuite, K.; Poulenard, J.; Messager, E.; Arnaud, F. Human-triggered magnification of erosion rates in European Alps since the Bronze Age. Nat. Commun. 2024, 15, 1246. [Google Scholar] [CrossRef]
- Qian, D.; Cao, G.; Du, Y.; Li, Q.; Guo, X. Impacts of climate change and human factors on land cover change in inland mountain protected areas: A case study of the Qilian Mountain National Nature Reserve in China. Environ. Monit. Assess. 2019, 191, 486. [Google Scholar] [CrossRef]
- He, X.; Jiang, X.; Spracklen, D.V.; Holden, J.; Liang, E.; Liu, H.; Xu, C.; Du, J.; Zhu, K.; Elsen, P.R.; et al. Global distribution and climatic controls of natural mountain treelines. Glob. Chang. Biol. 2023, 29, 7001–7011. [Google Scholar] [CrossRef]
- Li, B.V.; Jenkins, C.N.; Xu, W. Strategic protection of landslide-vulnerable mountains for biodiversity conservation under land-cover and climate change impacts. Proc. Natl. Acad. Sci. USA 2022, 119, e2113416118. [Google Scholar] [CrossRef]
- Espinoza-Guzmán, M.A.; Aragonés Borrego, D.; Sahagún-Sánchez, F.J. Evaluation of recent land-use and land-cover change in a mountain region. Trees For. People 2023, 11, 100370. [Google Scholar] [CrossRef]
- Gupta, A. Analyzing Land Use/Land Cover Dynamics in Mountain Tourism Areas: A Case Study of the Core and Buffer Zones of Sagarmatha and Khaptad National Parks, Nepal. Sustainability 2024, 16, 10670. [Google Scholar] [CrossRef]
- Chand, S.; Brar, K.K.; Kumar, A. Land Use/Cover Change Detection in High-Altitude Mountain Landscapes: A Case of Pangi Valley, Western Himalaya (India). Curr. World Environ. 2022, 17, 743. [Google Scholar] [CrossRef]
- Phartiyal, M.; Sharma, S. Comprehending drivers of land use land cover change from 1999 to 2021 in the Pithoragarh District, Kumaon Himalaya, Uttarakhand, India. J. Mt. Sci. 2024, 21, 2394–2407. [Google Scholar] [CrossRef]
- Quintero-Gallego, M.E.; Quintero-Angel, M.; Vila-Ortega, J.J. Exploring land use/land cover change and drivers in Andean mountains in Colombia: A case in rural Quindío. Sci. Total Environ. 2018, 634, 1288–1299. [Google Scholar] [CrossRef]
- Hailemariam, S.N.; Soromessa, T.; Teketay, D. Land Use and Land Cover Change in the Bale Mountain Eco-Region of Ethiopia during 1985 to 2015. Land 2016, 5, 41. [Google Scholar] [CrossRef]
- Gebrehiwot, K.; Teferi, E.; Woldu, Z.; Fekadu, M.; Desalegn, T.; Demissew, S. Dynamics and drivers of land cover change in the Afroalpine vegetation belt: Abune Yosef mountain range, Northern Ethiopia. Environ. Dev. Sustain. 2021, 23, 10679–10701. [Google Scholar] [CrossRef]
- Malek, Ž.; Scolobig, A.; Schröter, D. Understanding Land Cover Changes in the Italian Alps and Romanian Carpathians Combining Remote Sensing and Stakeholder Interviews. Land 2014, 3, 52–73. [Google Scholar] [CrossRef]
- Solár, J.; Solár, V. Land-cover change in the Tatra Mountains, with a particular focus on vegetation. Eco. Mont 2020, 12, 15–26. [Google Scholar] [CrossRef]
- García-Llamas, P.; Geijzendorffer, I.R.; García-Nieto, A.P.; Calvo, L.; Suárez-Seoane, S.; Cramer, W. Impact of land cover change on ecosystem service supply in mountain systems: A case study in the Cantabrian Mountains (NW of Spain). Reg. Environ. Change 2019, 19, 529–542. [Google Scholar] [CrossRef]
- Tuffery, L.; Davi, H.; López-García, N.; Rigolot, E.; Jean, F.; Stenger, A.; Lefèvre, F. Adaptive measures for mountain Mediterranean forest ecosystem services under climate and land cover change in the Mont-Ventoux regional nature park, France. Reg. Environ. Change 2021, 21, 12. [Google Scholar] [CrossRef]
- Vorovencii, I. Quantifying landscape pattern and assessing the land cover changes in Piatra Craiului National Park and Bucegi Natural Park, Romania, using satellite imagery and landscape metrics. Environ. Monit. Assess. 2015, 187, 692. [Google Scholar] [CrossRef]
- Zindros, A.; Radoglou, K.; Milios, E.; Kitikidou, K. Tree line shift in the Olympus Mountain (Greece) and climate change. Forests 2020, 11, 985. [Google Scholar] [CrossRef]
- Bebi, P.; Seidl, R.; Motta, R.; Fuhr, M.; Firm, D.; Krumm, F.; Conedera, M.; Ginzler, C.; Wohlgemuth, T.; Kulakowski, D. Changes of forest cover and disturbance regimes in the mountain forests of the Alps. For. Ecol. Manag. 2017, 388, 43–56. [Google Scholar] [CrossRef]
- Boori, M.S.; Vozenilek, V.; Choudhary, K. Land use/cover disturbance due to tourism in Jeseniky Mountain, Czech Republic: A remote sensing and GIS based approach. Egypt. J. Remote Sens. Space Sci. 2015, 18, 17–26. [Google Scholar] [CrossRef]
- How Jin Aik, D.; Ismail, M.H.; Muharam, F.M.; Alias, M.A. Evaluating the impacts of land use/land cover changes across topography against land surface temperature in Cameron Highlands. PLoS ONE 2021, 16, e0252111. [Google Scholar] [CrossRef]
- Belay, T.; Melese, T.; Senamaw, A. Impacts of land use and land cover change on ecosystem service values in the Afroalpine area of Guna Mountain, Northwest Ethiopia. Heliyon 2022, 8, e12246. [Google Scholar] [CrossRef]
- Khan, S.A.; Vanselow, K.A.; Sass, O.; Samimi, C. Detecting abrupt change in land cover in the eastern Hindu Kush region using Landsat time series (1988–2020). J. Mt. Sci. 2022, 19, 1699–1716. [Google Scholar] [CrossRef]
- Jovanović, D.; Govedarica, M.; Sabo, F.; Bugarinović, Ž.; Novović, O.; Beker, T.; Lauter, M. Land cover change detection by using remote sensing: A case study of Zlatibor (Serbia). Geogr. Pannonica 2015, 19, 162–173. [Google Scholar] [CrossRef]
- Rujoiu-Mare, M.R.; Olariu, B.; Mihai, B.A.; Nistor, C.; Savulescu, I. Land cover classification in Romanian Carpathians and Subcarpathians using multi-date Sentinel-2 remote sensing imagery. Eur. J. Remote Sens. 2017, 50, 496–508. [Google Scholar] [CrossRef]
- Kafy, A.A.; Hossain, M.A.; Islam, M.T. Remote sensing and GIS-based modeling of land use/land cover change for sustainable regional planning. Remote Sens. Appl. Soc. Environ. 2020, 18, 100314. [Google Scholar] [CrossRef]
- Rahman, M.T.U.; Tabassum, F.; Rasheduzzaman, M.; Saba, H.; Sarkar, L.; Ferdous, J.; Uddin, S.Z.; Zahedul Islam, A.Z.M. Temporal dynamics of land use/land cover change and its prediction using CA ANN model for southwestern coastal Bangladesh. Environ. Monit. Assess. 2017, 189, 565. [Google Scholar] [CrossRef]
- Saswata, S.; Prafull, S. Short term land use/land cover change analysis: A case study with geomatics approach. Int. J. Geomatics Geosci. 2015, 2, 2. [Google Scholar]
- Voiculescu, M.; Popescu, F.; Olaru, M. Patterns of winter tourism activity in the Bucegi Mountains—The Prahova Valley (the Southern Carpathians). Forum Geogr. 2012, 11, 182–194. [Google Scholar] [CrossRef]
- Comănescu, L.; Nedelea, A.; Dobre, R. Inventoring and Evaluation of Geomorphosites in the Bucegi Mountains. Forum Geogr. 2009, 8, 38–43. [Google Scholar]
- Sârbu, A.; Anastasiu, P.; Smarandache, D. Potential Impact of Climate Change on Alpine Habitats from Bucegi Natural Park, Romania. In Managing Protected Areas in Central and Eastern Europe Under Climate Change; Rannow, S., Neubert, M., Eds.; Springer: Dordrecht, The Netherlands, 2014; Volume 58, pp. 259–266. [Google Scholar] [CrossRef]
- Mihai, B.; Reynard, E.; Werren, G.; Savulescu, I.; Sandric, I.; Chitu, Z. Impacts of tourism on geomorphological processes in the Bucegi Mountains in Romania. Geogr. Helv. 2009, 64, 134–147. [Google Scholar] [CrossRef]
- Scholz, H. Construction and Development of the Allgäu Landscape Between Lech and Lake Constance: A southern German Geological and Landscape History; Schweizerbart’sche: Stuttgart, Germany, 1995. [Google Scholar]
- LBV (Bavarian State Association for Bird and Nature Conservation). Allgäu High Alps. Available online: https://www.lbv.de/naturschutz/standpunkte/biologische-vielfalt/eu-vogelschutzrichtlinie/vogelschutzgebiete-in-bayern/allg%C3%A4uer-hochalpen/ (accessed on 29 July 2025).
- Kortmann, M.; Kudernatsch, T.; Blaschke, M. Biodiversity along altitudinal gradients in the Bavarian Alps. LWF Aktuell 2022, 136, 18–20. [Google Scholar]
- Eisele, H.; Schreiber, R.; Stöger, A. Oberammergau Pilot Action Region: Mountain Forest Initiative (BWO); IntechOpen: London, UK, 2021. [Google Scholar] [CrossRef]
- Kilias, A. Tectonic Evolution of the Olympus-Ossa Mountains: Emplacement of the Blueschists Unit in Eastern Thessaly and Exhumation of Olympus-Ossa Carbonate Dome as a Result of Tertiary Extension (Central Greece). Miner. Wealth 1995, 96, 7–22. [Google Scholar]
- Mariolakos, I.; Manoutsoglou, Ε. The geotectonic evolution of Olympus Mt and its mythological analogue. Bull. Geol. Soc. Greece 2013, 47, 574–581. [Google Scholar] [CrossRef]
- Xystrakis, F.; Poulis, G.; Damianidis, C.; Sakellarakis, F.N.; Tsachouridis, M.; Eleftheriadou, A.; Chatzitriantafyllou, M. Floristic, chorological and life-form patterns at the highest summits of Mt Olympus, Greece. Bot. Lett. 2023, 171, 253–266. [Google Scholar] [CrossRef]
- Karra, K.; Kontgis, C.; Statman-Weil, Z.; Mazzariello, J.C.; Mathis, M.; Brumby, S.P. Global land use/land cover with Sentinel 2 and deep learning. In Proceedings of the 2021 IEEE International Geoscience and Remote Sensing Symposium (IGARSS), Brussels, Belgium, 11–16 July 2021; pp. 4704–4707. [Google Scholar] [CrossRef]
- Zhao, Y.; Abdelkareem, M.; Abdalla, F. Remote sensing and GIS techniques in Monitoring and mapping Land System Change in semi-arid environments. Environ. Earth Sci. 2024, 83, 420. [Google Scholar] [CrossRef]
- NextGIS. MOLUSCE Project Documentation. Available online: https://docs.nextgis.com/docs_ngqgis/source/molusce.html (accessed on 5 December 2025).
- Perović, V.; Jakšić, D.; Jaramaz, D.; Koković, N.; Čakmak, D.; Mitrović, M.; Pavlović, P. Spatio-temporal analysis of land use/land cover change and its effects on soil erosion (Case study in the Oplenac wine-producing area, Serbia). Environ. Monit. Assess. 2018, 190, 675. [Google Scholar] [CrossRef]
- Satya, B.A.; Shashi, M.; Deva, P. Future land use land cover scenario simulation using open source GIS for the city of Warangal, Telangana, India. Appl. Geomatics 2020, 12, 281–290. [Google Scholar] [CrossRef]
- Muhammad, R.; Zhang, W.; Abbas, Z.; Guo, F.; Gwiazdzinski, L. Spatiotemporal Change Analysis and Prediction of Future Land Use and Land Cover Changes Using QGIS MOLUSCE Plugin and Remote Sensing Big Data: A Case Study of Linyi, China. Land 2022, 11, 419. [Google Scholar] [CrossRef]
- Lukas, P.; Melesse, A.M.; Kenea, T.T. Prediction of Future Land Use/Land Cover Changes Using a Coupled CA-ANN Model in the Upper Omo–Gibe River Basin, Ethiopia. Remote Sens. 2023, 15, 1148. [Google Scholar] [CrossRef]
- Turner, B.L., II; Clark, C.W.; Kates, R.W.; Richards, J.F.; Mathews, J.T.; Meyer, W.B. Earth Transforming by Human Action: Global and Regional Changes in the Biosphere over the Past 300 Years; Cambridge University Press: Cambridge, UK, 1993. [Google Scholar]
- Foley, J.A.; DeFries, R.; Asner, G.P.; Barford, C.; Bonan, G.; Carpenter, S.R.; Chapin, F.S.; Coe, M.T.; Daily, G.C.; Gibbs, H.K.; et al. Global consequences of land use. Science 2005, 309, 570–574. [Google Scholar] [CrossRef]
- Körner, C. Mountain Ecosystems in a Changing Environment. J. Prot. Mt. Areas Res. Manag. 2014, 6, 71–77. [Google Scholar] [CrossRef]
- Inauen, N.; Körner, C.; Hiltbrunner, E. Hydrological consequences of declining land use and elevated CO2 in alpine grassland. J. Ecol. 2013, 101, 86–96. [Google Scholar] [CrossRef]
- van den Bergh, T.; Inauen, N.; Hiltbrunner, E.; Körner, C. Climate and plant cover co-determine the elevational reduction in evapotranspiration in the Swiss Alps. J. Hydrol. 2013, 500, 75–83. [Google Scholar] [CrossRef]
- Lambin, E.F.; Turner, B.L.; Geist, H.J.; Agbola, S.B.; Angelsen, A.; Bruce, J.W.; Coomes, O.T.; Dirzo, R.; Fischer, G.; Folke, C.; et al. The causes of land-use and land-cover change: Moving beyond the myths. Glob. Environ. Change 2001, 11, 261–269. [Google Scholar] [CrossRef]
- Elsen, P.; Monahan, W.B.; Dougherty, E.R.; Merenlender, A.M. Keeping pace with climate change in global terrestrial protected areas. Sci. Adv. 2020, 6, eaay0814. [Google Scholar] [CrossRef] [PubMed]
- Grêt-Regamey, A.; Weibel, B. Global assessment of mountain ecosystem services using earth observation data. Ecosyst. Serv. 2020, 46, 101213. [Google Scholar] [CrossRef]
- Monteiro, D.; Morin, S. Multi-decadal analysis of past winter temperature, precipitation and snow cover data in the European Alps from reanalyses, climate models and observational datasets. Cryosphere 2023, 17, 3617–3660. [Google Scholar] [CrossRef]
- Notarnicola, C. Hotspots of snow cover changes in global mountain regions over 2000–2018. Remote Sens. Environ. 2020, 243, 111781. [Google Scholar] [CrossRef]
- Pătru-Stupariu, I.; Hossu, C.A.; Grădinaru, S.R.; Nita, A.; Stupariu, M.-S.; Huzui-Stoiculescu, A.; Gavrilidis, A.-A. A Review of Changes in Mountain Land Use and Ecosystem Services: From Theory to Practice. Land 2020, 9, 336. [Google Scholar] [CrossRef]
Disclaimer/Publisher’s Note: The statements, opinions and data contained in all publications are solely those of the individual author(s) and contributor(s) and not of MDPI and/or the editor(s). MDPI and/or the editor(s) disclaim responsibility for any injury to people or property resulting from any ideas, methods, instructions or products referred to in the content. |
© 2026 by the authors. Licensee MDPI, Basel, Switzerland. This article is an open access article distributed under the terms and conditions of the Creative Commons Attribution (CC BY) license.