Abstract
Stenocereus fruits are appreciated for their flavor and color, and their cultivation is highly sustainable, as they grow in arid zones without the need for fertilizers or agrochemicals. However, their nutritional and bioactive composition remains underexplored. This study evaluated the physicochemical and nutritional properties, bioactive compound content, and antioxidant capacity (AOX) of Stenocereus thurberi (red, white, purple, and orange), Stenocereus martinezzi (red), and Stenocereus gummosus (red). All fruits exhibited low total soluble solids (12.6 ± 0.2–14.7 ± 0.3 °Brix), acidity (0.81 ± 0.03–1.12 ± 0.03%), and moderate dietary fiber content (3.71 ± 0.05–4.86 ± 0.09%). S. martinezzi stood out for its high levels of betalains (33.7 ± 0.65 mg/100 g_fw), vitamin E (84.7 ± 0.2 µg/100 g_fw), and vitamin C (147.6 ± 11.4 mg/100 g_fw). At the same time, potassium, magnesium, and calcium were the predominant minerals in all samples. S. gummosus showed the highest total soluble phenols (120.6 ± 2.2 mg/100 g_fw) and was also notable for its flavonoid content. Flavonoids, hydroxycinnamic, and hydroxybenzoic acids were detected in all fruits. Red fruits had the highest AOX levels, followed by white, orange, and purple varieties. In conclusion, these fruits are nutritious, low in sugars, and rich in bioactive compounds, suggesting their potential as functional foods, particularly beneficial for individuals with chronic degenerative diseases.
1. Introduction
Stenocereus fruits are wrongly known as “pitaya”; however, this common name “pitaya” is also given to fruits such as pitahaya or dragon fruit, which belong to another genus (Selenicereus spp.). The ancient Mexicans originally referred to the Stenocereus fruits by the common name “coapetilla” fruits [1]; therefore, in this work, the fruits studied will be referred to as coapetilla fruits or Stenocereus fruits. These fruits are produced by cacti belonging to the botanical genus Stenocereus, which comprises more than 24 species native to the Americas, 20 of which are endemic to Mexico [2,3]. These cacti primarily reproduce in the semi-arid regions of central and northern Mexico. The fruit is characterized by its vibrant pulp colors, such as red, purple, yellow, and white. Coapetilla fruits are marketed and consumed fresh and processed into a variety of products, including jams, fermented beverages, and traditional confectionery [4]. Due to its nutritional composition, rich in vitamins, minerals, fiber, and bioactive compounds with antioxidant capacity, it is associated with multiple health benefits [5,6].
Stenocereus fruit is considered an exotic fruit that has gained popularity not only for its flavor and striking appearance but also for its health benefits, which is why it shows commercial potential at both the national and international levels [2]. These benefits are attributed not only to its essential nutrients, such as vitamins and minerals, but also to its bioactive compounds, including betalains, carotenoids, and flavonoids, as well as its dietary fiber [7]. Among these compounds, betalains are organic pigments that contribute to the vibrant red, orange, and yellow hues of coapetilla fruits. These pigments exhibit anti-inflammatory and antioxidant properties, which are associated with the body’s ability to mitigate oxidative stress [8].
Another pigment that gives coapetilla fruits their color, especially the yellow ones, is carotenoid. They act as antioxidants and support eye health and immune system function [9]. The carotenoids present in coapetilla fruits include beta-carotene and lutein, which may help prevent cellular damage and function as antioxidants. Flavonoids are compounds with anti-inflammatory, antiviral, and neuroprotective effects. They lower the risk of heart disease, which enhances cardiovascular health.
Additionally, flavonoids may improve brain function and help prevent neurodegenerative illnesses [10,11]. As for the benefits of fiber consumption, it promotes digestive health, improving intestinal transit and feeding beneficial bacteria in the gut. It can contribute to blood sugar regulation and cholesterol reduction, and help maintain satiety, which can be helpful for weight control [12,13,14].
Despite the nutritional and functional relevance of Stenocereus fruits, scientific information on compositional differences among their species remains limited. Most available studies focus on a single variety or report only partial data regarding their physicochemical and bioactive profiles. This lack of comparative information restricts the understanding of how species variability influences their nutritional quality and antioxidant potential. Therefore, it remains unclear which Stenocereus species make the most significant contribution to dietary intake and the levels of health-promoting compounds. This study addresses this knowledge gap by performing a comprehensive comparative analysis of three Stenocereus species (S. thurberi, S. martinezzi, and S. gummosus). We hypothesize that the chemical composition and antioxidant capacity significantly differ among these species, reflecting interspecific variation in bioactive compound content. Three Stenocereus species native to Mexico (S. thurberi, S. martinezzi, and S. gummosus) were selected for detailed characterization due to their ecological relevance, traditional consumption, and potential as functional fruits. S. thurberi is widely distributed in the Sonoran Desert and produces sweet, red-purple fruits rich in betalains and polyphenols [15]. S. martinezzi is mainly found in the central and southern regions of Mexico, where its fruits are appreciated for their intense red pulp and pleasant flavor [16]. In contrast, S. gummosus is a species adapted to arid coastal areas of northwestern Mexico, characterized by its acidic fruits with high antioxidant potential. These species represent distinct ecological niches and phenotypic diversity within the Stenocereus genus, offering an excellent model to compare physicochemical properties, nutritional value, and bioactive compound profiles [17]. Their selection was based on their availability during the harvest season, contrasting pulp colors, and growing interest in their nutritional and health-promoting attributes.
Therefore, this study aims to evaluate the physical characteristics, proximate chemical composition, vitamin and mineral content, bioactive compounds, and antioxidant capacity of coapetilla fruits from three Stenocereus species (S. thurberi, S. martinezzi, and S. gummosus).
2. Materials and Methods
2.1. Chemicals and Reagents
Every chemical and reagent was of analytical quality. Jalmek Scientific (Guadalajara, Jalisco, Mexico) provided ethanol, methanol, sodium hydroxide, acetone, and chloroform. Sigma-Aldrich Chemical Co., Ltd. (St. Louis, MO, USA) supplied the Folin–Ciocalteu reagent, ABTS (2,2′-azino-bis (3-ethylbenzothiazoline-6-sulfonic acid)), TPTZ (2,4,6-tripyridyl-s-triazine), DPPH (1,1-diphenyl-2-picrylhydrazyl), Trolox (6-hydroxy-2,5,7,8-tetramethylchromane-2-carboxylic acid), and phenolic compound standards.
2.2. Plant Material
S. thurberi fruits were harvested in Miraflores, Los Cabos-Baja California Sur, Mexico (23°22′25″ N 109°48′55″ W); S. martinezzi fruits were obtained in Sanalona, Culiacan-Sinaloa, Mexico (24°47′34″ N 107°02′04″ W), and S. gummosus fruits were harvested in San Juan de Los Planes, La Paz-Baja California Sur, Mexico (23°59′18″ N 110°03′08″ W) by The Big Green Land Conception S. de R.L. de C.V., Company, Mexicali, Baja California. The company donated 2 kg of each fruit to our laboratory for experimental analysis. The fruits were harvested at a stage of ripeness suitable for consumption (pericarp opening) and without visible damage (Figure 1). They were peeled, and the pulp was homogenized using a blender (BLSTKAG-RPB-013, Kaliman, Oster, Mexico) until a fine, uniform consistency, and stored frozen at −18 °C. The fresh pulp was then analyzed for physicochemical properties, the proximate chemical composition, and betalains. However, to quantify total carotenoids, soluble phenols, vitamins, and minerals, the lyophilized pulp was used. For the freeze-drying process, the homogenized pulp was pre-frozen at −80 °C for 24 h and subsequently lyophilized using a freeze dryer (7670020, Labconco, Kansas City, MO, USA) under a chamber pressure of 0.05 mbar and a condenser temperature of −50 °C for 72 h.
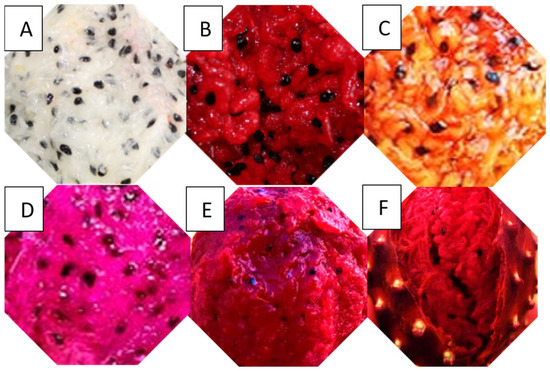
Figure 1.
Stenocereus thurberi fruits: (A) white, (B) red, (C) yellow, and (D) purple. Stenocereus martinezzi fruits (E). Stenocereus gummosus fruits (F).
2.3. Physicochemical Parameters
The physicochemical parameters of the pulp from Stenocereus fruits were determined as follows: total soluble solids (TSS) were measured using a refractometer (ATAGO PAL-1, Tokyo, Japan) previously calibrated with distilled water, in accordance with the AOAC (2005) guidelines. According to the AOAC (2005) method, a potentiometer (Hanna Instruments, 221 PH/MV, Padova, Italy) equipped with a combined glass electrode (HI1131B, Hanna Instruments, Padova, Italy) was used to measure the pH. A fruit acidity meter (ATAGO PAL-Easy ACIDF5 Master Kit, Tokyo, Japan), previously calibrated with the manufacturer’s standard citric acid solution (1.00%) immediately before use, was used to determine acidity in homogenized pulp, which was expressed as a percentage of citric acid equivalents [18].
2.4. Proximate Chemical Composition
Ash content (method 940.26), protein (method 978.04), moisture (method 934.06), and total lipids (method 950.54) were determined according to the official AOAC methods [18]. The DNS (3,5-dinitrosalicylic acid) technique was used to quantify reducing sugars (%) [19]. The enzymatic gravimetric method was used to determine soluble dietary fiber (SDF), insoluble dietary fiber (IDF), and total dietary fiber (TDF = SDF + IDF) [20]. The findings were presented as grams per 100 g of fresh weight (g/100 g_fw).
2.5. Bioactive Compounds
2.5.1. Total Betalain Content
The Castellanos-Santiago and Yahia method was used to determine the total betalain content of red, yellow, and purple fruits [21]. To extract betalains, 0.5 g of fresh pulp was combined with 10 mL of 80% (v/v) aqueous methanol. After homogenizing the mixture for 30 s in a homogenizer (Kaibrite FS-2A, Shangai, China), it was shaken for 20 min at 25 ± 2 °C in the dark using an orbital shaker (Heidoph, Reax 2, Schwabach, Germany). The sample was centrifuged (model Z32HK, Hermle, Wehingen, Germany) at 16,058 × g for 10 min at 4 °C. The residue was subjected to a second extraction using the methodology described above, and the resulting supernatant was combined with the first extract [22].
The absorbance of the betalain extracts at 538 and 483 nm was measured in a spectrophotometer (Jenway 6705, Dunmow, UK) to determine the total content of total betalains, which is the sum of betacyanins and betaxanthins. Lastly, the following formula was used to express the measured values in mg/100 g_fw [21]:
B: content of betacyanins or betaxanthins (mg/100 g_fw); A: absorbance (dimensionless; 483 nm for betaxanthin and 538 nm for betacyanins); FD: dilution factor; W stands for molecular weight (550 g/mol for betanin and 308 g/mol for indicaxanthin); V: extract volume (mL); ε: molar extinction coefficient (60,000 L/(mol·cm) for betanin and 48,000 L/(mol·cm) for indicaxanthin and beta-xanthin); Q: sample amount (g); and L: cell length (1 cm).
2.5.2. Total Carotenoid Content
The methodology of Qin et al. [23] was modified to determine the total carotenoid content of the yellow pulp fruit. First, 0.5 g of lyophilized yellow pulp samples were combined with 1 mL of a 2:1 v/v chloroform-methanol solution that contained 0.05% w/v butylhydroxytoluene. Using a Mikro 200 R (Hettich GmbH, Kirchlengern, Germany), the extracts were centrifuged at 21,380× g for 30 min at 4 °C. The process was repeated using the same extraction procedure described above until the precipitate no longer had a yellow hue, requiring three repetitions for the supernatant to become colorless. The extracts’ absorbance was measured using a microplate reader (800TS, Biotek, Winooski, VT, USA) at 448 nm. The results were expressed as milligrams of β-carotene equivalents per 100 g fresh weight (mg/100 g_fw).
2.5.3. Total Soluble Phenols (TSP)
For the extraction of total soluble phenols, 2 g of lyophilized material and 10 mL of acidified methanol (adding 2 mL of 2N HCl to each 100 mL of methanol) were used. The mixture was homogenized for 30 s in a homogenizer (Kaibrite FS-2A, Shangai, China) and shaken for 30 min in an orbital shaker (Heildoph, Reax 2, Schwabach, Germany) at 25 ± 2 °C, then centrifuged at 16,058× g for 10 min at 4 °C (model Z32HK, Hermle, Wehingen, Germany). TSP quantification was based on the Montreau method [24]. The supernatant (12 µL) was mixed with 12 µL of Folin–Ciocalteu reagent, 116 µL of 7.5% (w/v) sodium carbonate solution, and 164 µL of distilled water. The mixture was incubated in the dark at 25 ± 2 °C for 30 min. After this time, the absorbance was measured at 750 nm using a microplate reader (800TS, Biotek, Winooski, VT, USA). Milligrams of gallic acid equivalents per 100 g of fresh weight (mg/100 g_fw) were used to express the results.
2.5.4. The Phenolic Compounds
According to Nolasco-González et al. [25], liquid chromatography was used to determine the profile of phenolic chemicals. The phenolic extract (as mentioned in Section 2.5.3) was analyzed using a high-performance liquid chromatograph (HPLC) (Agilent Technologies 1260 Infinity, Waldbronn, Germany) equipped with a diode array detector and a Poroshell 120 EC-C18 reverse-phase column (4.6 × 100 mm, 2.7 µm; Agilent Technologies, Waldbronn, Germany). First, it was concentrated in a rotavapor at 35 °C (Yamato RE300, Tokyo, Japan), resuspended in 1 mL of methanol, and filtered through 0.22 µm filters. The injection of extracts was 10 µL, and the flow rate was 0.5 mL/min. The mobile phase consisted of solvent A (0.1% v/v of trifluoroacetic acid: HPLC water) and solvent B (acetonitrile), 100% A and 0% B made up the gradient program for 0–10 min; 80% A and 20% B, 10–15 min; 25% B and 75% A, 15–20 min; 35% B and 65% A, for 20–35 min; 25% A and 75% B, 35–55 min; 100% B and 0% A, 55–57 min; 35% A and 65% B, 57–62 min, 35% B and 65% A, 62–65 min, and 65–70 min for 100% A and 0% B. The DAD was configured to scan between 270 and 320 nm. Phenolic acids were monitored at 270 nm, while flavonoids were detected between 270 and 280 nm, and hydroxybenzoic and hydroxycinnamic acids within the 280–320 nm range. Phenolic compounds standards, shikimic acid, ellagic acid, including hydroxybenzoic acids, hydroxycinnamic acids, and flavonoids (Sigma-Aldrich, St. Louis, MO, USA), were used for identification and quantification. Micrograms per gram of fresh weight (μg/100 g_fw) was used to express the results.
2.5.5. Vitamin C
The method outlined by Barbosa-Gámez et al. [26] was performed to determine the vitamin C content, and the results were reported as mg/100 g_fw. The lyophilized sample (0.5 g) with 0.05 N H3PO4 (20 mL) was used for the extraction of vitamin C, and the mixture was stirred continuously for 30 min. After that, the mixture was centrifuged at 3000× g for 20 min at 4 °C. The obtained supernatant was then filtered through 0.22 μm filters. An aliquot (20 μL) was injected into an HPLC system (Agilent Technologies 1260 Infinity, Waldbronn, Germany) equipped with a ZORBAX Eclipse Plus C18 column (4.6 mm × 100 mm; Agilent Technologies, Santa Clara, CA, USA) and a diode-array detector (DAD). The flow rate of the mobile phase (phosphate buffer at pH 2.7) was 0.5 mL/min, and the chromatographic separation was carried out isocratically. At 250 nm, vitamin C was detected, and its content was determined from a calibration curve prepared with a vitamin C standard (Sigma-Aldrich, St. Louis, MO, USA). The results are reported as mg/100 g_fw.
2.5.6. Vitamin E
The process outlined by Barbosa-Gámez et al. [26] was used to extract vitamin E. The lyophilized sample (3 g), 5 mL of KOH solution (13.8 mol/L), 16 mL of ethanol, and 0.1 g of hydroxyquinone were combined. The mixture was agitated for 30 min at 50 °C in a water bath. The mixture was then left in the dark for 10 min after 16 mL of hexane was added. After that, the top phase was collected, dried by evaporation, then redissolved in 1 mL of methanol and filtered through a 0.22 μm filter. A high-performance liquid chromatograph (HPLC, Agilent Technologies 1260 Infinity, Waldbronn, Germany) fitted with a ZORBAX Eclipse Plus C18 column (4.6 mm × 100) and a diode-array detector was used for quantification. The mobile phase was methanol/water (98:2 v/v) at 0.5 mL/min, and this vitamin was detected at 290 nm. A calibration curve for the vitamin E standard (Sigma-Aldrich, St. Louis, MO, USA) was prepared, and results were expressed in mg/100 g_fw.
2.6. Antioxidant Capacity
Three methods were used to evaluate this parameter: For the 2,2-diphenyl-1-picrylhydrazyl (DPPH) experiment, the extracts (40 μL) were combined with 260 μL of DPPH solution (190 μmol/L). This DPPH solution was prepared in methanol. After the addition of the DPPH solution, the reaction mixture was incubated for 10 min at 25 ± 2 °C in the dark. After, the absorbance was measured at 517 nm [27], the ferric reducing antioxidant power (FRAP) assay, which involved mixing 230 μL of FRAP solution (10:1:1, v/v/v of 0.3 mol/L sodium acetate buffer at pH 3.6; 10 mmol/L 2,4,6-tripyridyl-s-triazine, and 20 mmol/L hexahydrate ferric chloride) with 70 μL of extracts and 5 μL of distilled water. After 30 min of stirring in the dark, the absorbance was measured at 595 nm [28]. The ABTS [2,2’-azino-bis (3-ethylbenzothiazoline-6-sulfonic acid)] assay entailed reacting 35 μL of the extracts with the ABTS+ solution (7 mmol/L, 265 μL) and shaking in the dark for 10 min at 25 ± 2 °C. At 730 nm, the absorbance was determined [29].
All absorbances were measured using a microplate reader (800TS, Biotek, Winooski, VT, USA). The results were expressed as equivalent millimoles of Trolox (6-hydroxy-2,5,7,8-tetramethylchroman-2-carboxylic acid) per 100 g of fresh weight (mmol Trolox/100 g_fw)
2.7. Mineral Composition
Minerals (sodium, potassium, calcium, magnesium, iron, copper, and manganese) were measured by combining 10 mL of concentrated HNO3 with 0.5 g of the lyophilized samples. After that, the mixture was heated to 70 °C and digested for 6 h. Following that, samples were filtered through a 0.22 μm nylon filter and diluted to 50 mL with deionized water. Next, a microwave plasma atomic emission spectrometer (MP-AES, Agilent 4200, Waldbronn, Germany) equipped with a nebulizer (160–180 kPa) was used to analyze 1 mL of each diluted sample (1:10 v/v or 1:20 v/v) in deionized water. Calibration curves for mineral standards (Sigma-Aldrich, USA) were created, and mg/100 g_fw was used to express the results [30].
2.8. Statistical Analysis
Every test was run in triplicate (n = 3). One-way analysis of variance (ANOVA) was used to analyze each variable using Statistica software version 12 (StatSoft, Tulsa, OK, USA). The least significant difference test (LSD Fisher, p < 0.05) was used to examine the mean difference.
3. Results and Discussion
3.1. Physicochemical Parameters
The physicochemical characteristics of Stenocereus thurberi, S. martinezzi, and S. gummosus fruits are displayed in Table 1, with emphasis on pH, titratable acidity (expressed as a percentage of citric acid), and total soluble solids (°Brix).

Table 1.
Physicochemical parameters of coapetilla fruits (S. thurberi, S. martinezzi, and S. gummosus).
Total soluble solids (TSS) showed significant differences among species (p < 0.05). The orange pulp of the S. thurberi species had the highest TSS content (14.7 ± 0.3) compared to pulp of other colors from the same species (12.6 ± 0.2–13.0 ± 0.2 °Brix). At the same time, significant differences were observed between S. martinezzi and S. gummosus fruits; the red S. martinezzi fruits had the lowest TSS content (12.1 ± 0.1 °Brix), suggesting a lower soluble sugar concentration. These results indicate that S. thurberi fruits, especially the orange and red varieties, are likely to be more appreciated for their sweet taste. Overall, the TSS content of these coapetilla species is higher than that reported for S. queretaroensis fruits (10.50–12.07 °Brix) by Noriega-Juárez et al. [7]. In a similar way, for S. griseus fruits with values ranging from 11.5 to 13 °Brix [31], and for S. pruinosus fruits (10.96–11.23 °Brix) [32]. However, Arriaga-Ruiz et al. [12] and Gaytán-Andrade et al. [13] have documented a wider range of 8.99–16.2 °Brix in coapetilla fruits.
Regarding acidity, no significant differences (p > 0.05) were found among the white, purple, and orange S. thurberi fruits, and the average values ranged from 1.05 ± 0.02% to 1.12 ± 0.03%. In comparison, the red S. thurberi fruits showed the lowest value (0.81 ± 0.03%), similar to those of S. martinezzi and S. gummosus fruits. These results are similar to those reported in other studies for S. queretaroensis orange, red, yellow, and purple fruits (0.1–0.88%) [12,13] and are higher than those reported by García-Cruz et al. [32] for S. pruinosus fruits (0.08–0.11%). Differences in acidity may influence sensory perception: higher acidity is generally associated with a more intense, sour taste, which can be balanced by the fruit’s sweetness, creating a more pleasant, fresh, and harmonious taste.
The pH of the S. thurberi fruits varied significantly (p < 0.05); the purple fruit had the lowest pH (3.88 ± 0.06), and the red fruit had the highest (4.91 ± 0.05). Significant differences (p < 0.05) were also found among S. martinezzi and S. gummosus fruits. These results are consistent with the titratable acidity data, showing an inverse relationship between the two parameters: fruits with lower pH exhibit higher acidity and vice versa. The pH values reported by Arriaga-Arriaga-Ruiz [12], Gaytán-Andrade [13], and García-Cruz et al. [32] for S. pruinosus fruits (3.90–5.65), as well as those previously reported for S. queretaroensis fruits (4.27–4.60) [7], agree with the findings of this study.
Overall, the data show considerable variability among species in both sweetness and acidity, with implications for consumer acceptance, culinary applications, and industrial potential.
3.2. Proximate Chemical Composition
The extensive nutritional and functional diversity of these fruits is reflected in the proximate chemical composition study, which showed significant differences (p < 0.05) across coapetilla species (Table 2).
Table 2.
Proximate chemical composition of Stenocereus fruits.
Moisture content ranged from 82.25% to 84.75%. The S. thurberi orange fruit had the highest moisture content (84.8 ± 0.8%), whereas the red and white pulps of S. thurberi exhibited the lowest values (82.6 ± 0.4% and 82.2 ± 0.3%, respectively). Overall, all varieties exhibited moisture levels above 80%, which may influence their shelf life and postharvest preservation methods. These findings align with those documented for fruits of S. queretaroensis (78.7–89.4%) [13]. The S. pruinosus red and orange fruits had moisture contents of 87.1% and 89.0%, respectively [32]. The moisture content of S. queretaroensis varied from 83.76% to 87.70% in prior research [7].
Ash content, an indicator of total mineral content, showed only slight differences, ranging from 0.39 ± 0.03 to 0.49 ± 0.02 g/100 g_fw, with no outstanding values in any particular species or color fruit. For yellow, orange, purple, and red S. queretaroensis fruits, these values were somewhat lower than those published by Gaytán-Andrade (2019) (0.46–0.90%) [13], as well as those reported for S. pruinosus red and orange fruits (0.63% and 0.61%, respectively) by García-Cruz et al. [32]. However, they were higher than those reported for S. queretaroensis fruits (0.27–0.36%) [7].
Lipid content ranged from 0.22 ± 0.03 to 0.45 ± 0.02 g/100 g_fw, consistent with values reported for S. queretaroensis fruits (0.40–0.62 g/100 g_fw) [7]. However, the red fruit of S. gummosus stood out for having the lowest lipid content (0.12 ± 0.01 g/100 g_fw). These values are slightly higher than the typical levels reported for S. queretaroensis fruits, in which lipid content generally does not exceed 0.1%. Such differences may be attributed to the variability among the analyzed species [13].
Protein content varied significantly (p < 0.05), with S. gummosus fruits exhibiting the highest value (2.4 ± 0.2 g/100 g_fw) compared to red S. thurberi fruits (1.06 ± 0.07 g/100 g_fw). Higher protein contents have been reported for S. thurberi fruits by Rodríguez-Félix et al. [9]. However, the values found in this study fall between 1.0 and 1.30% of those reported for other species, including S. pruinosus, S. stellatus, S. queretaroensis, and S. griseus fruits. These findings suggest a higher nutritional potential of S. gummosus fruits, particularly as a protein source, for populations with limited access to animal protein.
The ranges for total dietary fiber (TDF), insoluble dietary fiber (IDF), and soluble dietary fiber (SDF) were 3.94 ± 0.05–4.86 ± 0.09 g/100 g_fw, 3.4 ± 0.1–4.4 ± 0.2 g/100 g_fw, and 0.50 ± 0.05–0.54 ± 0.07 g/100 g_fw, respectively. In general, the red and orange S. thurberi fruits had the highest total dietary fiber content. On the other hand, no significant differences in the SDF content were observed between the S. thurberi and S. martinezzi fruits. The IDF content was higher in the red and orange S. thurberi fruits and red S. gummosus fruits, with no significant differences between them; in contrast, the red S. martinezzi fruits showed the lowest IDF content (3.1 ± 0.1 g/100 g_fw). The fiber content of the varieties analyzed in this study was similar to or lower than that reported for Stenocereus fruits. The S. pruinosus and S. griseus fruits (red and yellow fruits) yielded values of 0.67 and 0.53 g/100 g_fw, respectively, while S. griseus exhibited crude fiber levels ranging from 3.51 to 7.10 g/100 g_fw, higher than those found in this study. However, it should be noted that crude fiber does not reflect soluble fiber and includes only part of the insoluble fiber. Therefore, the dietary fiber content of the analyzed coapetilla fruits is generally below previously reported values but comparable to those reported for S. queretaroensis [7,12,13].
Regarding reducing sugars, significant differences (p < 0.05) were observed among species and varieties, ranging from 8.4 ± 0.2 to 17.1 ± 0.09 g/100 g_fw. The S. gummosus red fruit had the lowest content (8.4 ± 0.2 g/100 g_fw), which is consistent with its lower total soluble solids. S. thurberi fruit had the highest reducing sugar content (17.1 ± 0.9 g/100 g_fw), although this was lower than values reported for this same species by Castro-Enríquez et al. [9] and Rodríguez-Félix et al. [10]. The remaining varieties showed reducing sugar levels similar to those reported for S. pruinosus, S. stellatus, S. queretaroensis, and S. griseus, which range from 2.23 to 12.2 g/100 g_fw [8,12,13,33,34].
Taken together, these results suggest that S. gummosus has a more robust nutritional profile (higher protein and fiber content, and lower sugar content), whereas S. thurberi, particularly its red and white fruits, stands out for its higher sugar content and sweetness. In general, these coapetilla fruits stand out for their low sugar content and high protein and dietary fiber content. This information is crucial for consumers who follow a low-calorie diet or individuals with obesity and diabetes, particularly those with specific nutritional needs or medical purposes.
3.3. Bioactive Compound Content
The content of bioactive compounds, particularly betalains, carotenoids, and total soluble phenols, showed significant differences among the analyzed coapetilla species (Table 3), with implications for both nutrition and the food industry.
Table 3.
Total betalains and soluble phenol content of Stenocereus fruits.
Total betalain content (TB; betacyanins [BC] + betaxanthins [BX]) varied significantly (p ≤ 0.05) among type of fruits, the red fruits from all species showing the highest levels (29.4 ± 0.1–33.7 ± 0.6 mg/100 g_fw), followed by the orange fruits (22.5 ± 0.1 mg/100 g_fw) and purple fruits (14.9 ± 0.2 mg/100 g_fw). Betacyanins predominated in red and purple fruits, as they are associated with reddish-violet pigmentation. The highest values were recorded in S. martinezzi red fruits (32.1 ± 0.6 mg/100 g_fw), S. gummosus red fruits (32.1 ± 0.1 mg/100 g_fw), and S. thurberi red fruits (26.1 ± 0.1 mg/100 g_fw), with notably lower concentrations in the purple (11.6 ± 0.1 mg/100 g_fw) and orange fruits (6.05 ± 0.02 mg/100 g_fw). In contrast, betaxanthins, associated with yellow pigmentation, were more abundant in the S. thurberi orange fruits (16.4 ± 0.1 mg/100 g_fw). This finding suggests that these varieties, rich in betaxanthins and betalains, may represent important sources of natural pigments with primarily antioxidant properties. As expected, the white variety did not show detectable levels of betacyanins, consistent with its lack of red-purple coloration.
The results of this investigation for the red fruits were less than those found in S. stellatus fruits (16.52 mg/100 g of betaxanthins, 22.58 mg/100 g of betacyanins, and 50.38 mg/100 g of total betalains) [35]. On the other hand, reported 41.68 and 25.80 mg of total betalains in red and S. griseus orange fruits, respectively [33], and found 10.3 mg of betacyanins per 100 g of fresh pulp in red-fleshed Hylocereus spp., fruits [36]. However, the values obtained in the present study are similar to those reported for S. queretaroensis fruits [7]. It is important to remember that differences in betalain content are primarily due to the type of fruit and the species, which exhibit distinct nutritional and bioactive compound profiles.
Carotenoid content was analyzed in all coapetilla fruits, but none of the samples showed detectable levels of this pigment. This suggests that these fruits primarily contain yellow, water-soluble compounds, such as betalains.
On the other hand, total soluble phenols (TSP), expressed as gallic acid equivalents, showed considerable variability. The highest TSP content in the pulp was found in S. gummosus red fruits (120.6 ± 2.2 mg/100 g_fw), followed by S. thurberi white fruits (91.8 ± 1.8 mg/100 g_fw) and S. martinezzi red fruits (73 ± 2.5 mg/100 g_fw). These results reflect differential antioxidant potential among species, with S. gummosus fruits identified as a rich source of phenolic compounds. Compared to other Stenocereus fruits, these values are higher than those reported (42.4–51.98 mg gallic acid/100 g_fw) [35,36]. However, they are similar to the contents found in S. thurberi, which are present in red, purple, and orange fruits. In contrast, other species, such as S. griseus and S. pruinosus, showed lower phenolic contents, with reported values of 19.98, 6.34, and 32.82 mg gallic acid/100 g_fw in red and orange fruits [32].
Overall, the data suggest that S. martinezzi and S. gummosus fruits are particularly rich in betalain pigments and phenolic compounds, conferring them high nutraceutical value. Although S. thurberi showed relatively lower concentrations, it displayed a diverse and valuable profile, especially in the orange fruits due to its high betaxanthin content.
3.4. Phenolic Compound Profile
The phenolic compound profile showed significant differences (p < 0.05) among the fruits of the four evaluated species (Table 4). The chromatograms of the phenolic compounds are shown in Figure S1, whereas the equations of the calibration curves and the detection and quantification limits are shown in Table S1.
Table 4.
Profile of phenolic compounds in Stenocereus fruits.
A total of 27 phenolic compounds were identified and quantified, including 8 hydroxybenzoic acids, 9 hydroxycinnamic acids, and 8 flavonoids. In addition, shikimic acid and ellagic acid were also detected. The total phenolic compound content ranged from 26.3 ± 1.0 to 65.8 ± 2.5 mg/100 g_fw. Among these, hydroxycinnamic acids were predominant (4.5 ± 0.6–11.8 ± 0.5 mg/100 g_fw), followed by flavonoids (5.6 ± 0.2–21.4 ± 0.3 mg/100 g_fw), and hydroxybenzoic acids (2.64 ± 0.09–4.6 ± 0.2 mg/100 g_fw).
Among the hydroxybenzoic acids, salicylic acid, 4-hydroxybenzoic acid, and syringic acid were the most abundant. For hydroxycinnamic acids, the most prominent were 3,4-dihydroxyphenylacetic acid, 3,4-hydroxyphenylpropionic acid, and 2,5-dihydroxybenzoic acid. Regarding flavonoids, notable compounds included gallocatechin, epigallocatechin, myricetin, and rutin. Additionally, shikimic acid, an organic acid, stood out due to its high concentration.
The fruits of S. gummosus had the highest phenolic content overall, followed by the purple and white fruits of S. thurberi and the fruits of S. martinezzi. In a previous study on S. queretaroensis, both the white and red fruits exhibited the highest levels of phenolic compounds [7].
Because of their documented anti-inflammatory and antioxidant qualities, the phenolic compounds are deemed essential, suggesting that coapetilla fruit consumption may help combat oxidative stress and contribute to overall health improvement.
3.5. Antioxidant Capacity
DPPH, ABTS, and FRAP assays were used to assess the antioxidant capacity (AOX) of Stenocereus species; the results showed statistically significant variations amongst fruits (Table 5).
Table 5.
Antioxidant capacity (AOX) of Stenocereus fruits.
Using the DPPH method, S. martinezzi (red fruit) exhibited the highest antioxidant capacity (231.5 ± 2.4 mmol/L Trolox/100 g_fw), followed by S. thurberi orange fruits (215.7 ± 3.8 mmol/L Trolox/100 g_fw) and white fruits (191.9 ± 2.3 mmol/L Trolox/100 g_fw). In contrast, S. thurberi purple and red fruits, as well as S. gummosus red fruits, showed significantly lower values, ranging from 166.0 ± 6.1 to 172.2 ± 4.9 mmol/L Trolox/100 g_fw.
The ABTS assay produced consistent results, with S. martinezzi and S. gummosus red fruits once again standing out for their high antioxidant capacities (210 ± 2.4 and 212.7 ± 1.7 mmol/L Trolox/100 g_fw, respectively). The orange fruits of S. thurberi also exhibited potent antioxidant activity (187.6 ± 1.4 mmol/L Trolox/100 g_fw). In contrast, the red fruits showed the lowest value (142.6 ± 1.4 mmol/L Trolox/100 g_fw), highlighting the variability within a single species. These values of AOX exceeded those reported for S. pruinosus fruits (74–109 mmol/L Trolox/100 g_fw) [33].
In contrast, the FRAP assay, which assesses iron-reducing capacity, revealed a different trend: S. gummosus red fruits (714.8 ± 3.7 mmol/L Trolox/100 g_fw) and S. thurberi red fruits (713.5 ± 4.4 mmol/L Trolox/100 g_fw) had the highest values. At the same time, the orange fruits of S. thurberi showed the lowest value (459.3 ± 3.5 mmol/L Trolox/100 g_fw). Notably, this method revealed even greater differences between species and between fruit types.
These findings demonstrate that the antioxidant capacity of coapetilla fruits depends not only on the species but also on the assay used, suggesting the presence of different antioxidant mechanisms and active compounds with specific affinities for each method. The higher FRAP values observed in these fruits could be attributed to the strong reducing power of phenolic compounds capable of donating electrons to ferric ions (Fe3+), which is the fundamental principle of the FRAP assay [37]. Flavonoids (catechins, quercetins, and kaempferol derivatives) and tannins (proanthocyanins) are primarily responsible for increased antioxidant activity through hydrogen transfer mechanisms by -OH groups, metal chelating capacity (Fe+), and radical scavenging [38]. In contrast, DPPH and ABTS assays measure radical-scavenging activity, which involves both hydrogen-atom transfer (HAT) and single-electron transfer (SET) mechanisms [39]. However, these assays can be less sensitive to specific phenolic structures, particularly those with limited hydrogen-donating capacity or steric hindrance that restricts radical access to the antioxidant site [40]. Therefore, the predominance of reducing compounds, such as flavonoids, phenolic acids, and ascorbic acid, could explain the higher antioxidant capacity observed in the FRAP assay compared to the DPPH and ABTS assays.
Understanding the AOX of these coapetilla fruits is essential, as it reflects their ability to neutralize free radicals, which can damage cells and tissues and contribute to various health problems and premature aging [41].
3.6. Vitamin Content
Table 6 presents the vitamin E and C content in the different Stenocereus species: S. martinezzi, S. gummosus, and S. thurberi. The results show significant variations both between species and among fruits of the same species.
Table 6.
Vitamin C and vitamin E content of Stenocereus fruits.
Vitamin E concentrations ranged from 63.8 ± 2.5 to 84.7 ± 0.2 µg/100 g_fw across the analyzed species. The highest concentration was found in S. martinezzi (red fruits) (84.7 ± 0.2 µg/100 g_fw), while the lowest was recorded in S. thurberi (white fruits) (63.8 ± 2.5 µg/100 g_fw). The S. thurberi fruits exhibited a wide range of values, with the orange fruits standing out for their high content (81.8 ± 4.3 µg/100 g_fw), approaching the levels observed in S. martinezzi fruits. This variability demonstrates that tocopherol accumulation is influenced by species and pulp pigmentation, indicating that vitamin E content depends on these factors.
Regarding vitamin C, more pronounced differences were observed, with values ranging from 62.3 ± 0.6 to 147 ± 5 mg/100 g_fw. The red fruits of S. martinezzi and S. gummosus showed the highest content (147 ± 11 mg/100 g_fw and 147 ± 5 mg/100 g_fw). In contrast, the orange fruits of S. thurberi exhibited the lowest value (62.3 ± 0.6 mg/100 g_fw). Notably, the red fruits of S. martinezzi, S. gummosus, and S. thurberi stand out as potential sources of vitamin C, significantly surpassing those of other species. In comparison, the fruits of species such as S. pruinosus and S. griseus have been reported to contain much lower vitamin C levels (0.17–12.04%) [33,34].
3.7. Mineral Content
The Stenocereus species exhibited considerable variability in the concentration of essential minerals, macronutrients (Na, K, Ca, Mg), and micronutrients (Fe, Mn, Zn, Cu), both among species and within varieties (Table 7). In general, the most abundant minerals were potassium and magnesium, followed by sodium and calcium. While in lesser proportions and in descending order were manganese, iron, zinc, and copper. Both mineral macronutrients and micronutrients are essential, but the body requires them in varying amounts.
Table 7.
Mineral composition of Stenocereus fruits.
The highest sodium concentration was observed in S. martinezzi fruits (5.60 mg/100 g_fw), followed by S. gummosus fruits (4.15 ± 0.05 mg). Sodium is a vital mineral, but in excess, it poses a significant health risk. Overall, all coapetilla fruits had low sodium content, which is beneficial for cardiovascular health, as it contributes to a diet with low sodium intake well below the recommended daily intake (RDI ≤ 2300 mg/day), according to the Dietary Guidelines for Americans 2020–2025 [42] and does not pose a hypertensive risk. Other studies reported values (8–12 mg/100 g_fw) that double those found in this study. Specifically, for fruits of S. queretaroensis, S. griseus, S. thurberi, S. stellatus, and S. pruinosus, the values were 8, 9, 10, 11, and 12 mg/100 g, respectively [3,30,43,44].
Potassium was found at high concentrations across all species, with particularly high levels in S. thurberi (purple variety, 209.74 ± 0.01 mg/100 g_fw) and S. martinezzi (223.68 ± 0.05 mg/100 g_fw). Since potassium is essential for multiple functions in the body, including muscle, nerve, energy metabolism, and protein synthesis, these varieties stand out for their nutritional value, providing approximately 14% of the recommended daily intake (RDI = 3500–4700 mg/day) per 100 g of fruit. But in another study, S. thurberi fruits were reported to have a higher potassium content (400 mg/100 g_fw) [3], and other species, such as S. queretaroensis, S. griseus, S. stellatus, and S. pruinosus, showed higher values between 320 and 390 mg/100 g_fw [35,43,44].
Calcium concentrations per 100 g of fresh coapetilla fruits were relatively low and homogeneous; however, S. thurberi (purple fruits, 1.74 ± 0.01 mg/100 g_fw) and S. martinezzi (1.54 ± 0.06 mg/100 g_fw) presented the highest levels. This may have implications for people seeking calcium-rich complementary foods, as coapetilla fruits provide only a small portion of the recommended daily intake (RDI), which ranges from 1000 to 1200 mg per day. Therefore, coapetilla fruit consumption alone would not meet the daily calcium requirements, and additional dietary sources would be necessary to ensure adequate intake. However, other studies with other species (S. griseus, S. stellatus, S. thurberi) reported considerably higher levels, ranging from 40 to 52 mg/100 g_fw [3,35,43,44].
The purple and white fruits of S. thurberi (25.88 ± 0.04 and 21.24 ± 0.07 mg/100 g_fw, respectively) and S. martinezzi fruits (35.32 ± 0.08 mg/100 g_fw) had considerably greater magnesium contents. This mineral is essential and plays a key role in metabolic functions, intervening in more than 300 enzymatic reactions. These varieties offer a more favorable profile, supplying approximately 10% of the RDI (310–420 mg/day) per 100 g of pulp. Another study reported 28 mg/100 g_fw for the fruits of S. thurberi, slightly higher, and other species reported similar content (20–27 mg/100 g_fw) [3].
The purple fruits of S. thurberi had the highest iron content (0.79 ± 0.01 mg/100 g_fw), highlighting their potential for addressing iron deficiencies. S. martinezzi (0.53 ± 0.02 mg/100 g_fw) and S. gummosus fruits (0.46 ± 0.02 mg/100 g_fw) also stood out, making these fruits suitable sources for meeting the recommended daily intake (RDI = 8–18 mg/day). For other species, such as S. queretaroensis, S. griseus, S. stellatus, and S. pruinosus, the reported iron values ranged from 1.0 to 1.5 mg/100 g_fw [35,43,44].
S. thurberi (purple fruits) also exhibited the highest manganese concentration (0.89 ± 0.01 mg/100 g_fw), surpassing all other varieties. As manganese is an essential cofactor for enzymatic activity and is involved in the metabolism of carbohydrates, amino acids, and cholesterol, this variety may be a promising candidate for bioavailability studies, contributing a significant proportion of the RDI (1.8–2.3 mg/day).
Zinc levels were generally low; however, S. thurberi (purple fruit, 0.33 ± 0.03 mg/100 g_fw) had the highest contents. Zinc is critical for immune function, and while coapetilla fruits are not a significant source, their contribution is valuable (RDI = 8–11 mg/day). For fruits of S. thurberi, another study reported 0.40 mg/100 g_fw, and for S. griseus, 20 mg/100 g_fw [3,44].
The highest levels of copper were found in S. thurberi (white fruits, 0.12 ± 0.01 mg/100 g_fw). Although the concentrations in the others were low, the variation among varieties could be relevant for breeding programs aimed at enhancing micronutrient content to support the RDI (0.9 mg/day). Coapetilla fruits are an excellent source of copper since it is necessary in trace amounts for several biological processes, including the production of red blood cells and the operation of the immune system [45].
These results indicate that while all Stenocereus species provide essential minerals, S. martinezzi and certain varieties of S. thurberi, particularly purple-fruited varieties, stand out for their higher concentrations of potassium, magnesium, and iron. These nutrients are essential for key physiological functions, including electrolyte balance, neuromuscular activity, and red blood cell formation [46,47].
4. Conclusions
The study of Stenocereus species revealed marked diversity in physicochemical characteristics, nutritional composition, and functional compounds, highlighting their biological and agri-food importance. Fruits of S. thurberi showed variability in acidity and sugars, while S. gummosus stood out for its insoluble fiber and phenolic content. S. martinezzi and S. gummosus fruits exhibited the highest betalain levels, conferring strong antioxidant potential. Potassium was the predominant mineral in the fruits. Overall, S. martinezzi, S. thurberi, and S. gummosus fruits demonstrated high nutritional and functional value, underscoring their potential in food and health applications and the importance of conserving Mexico’s native Stenocereus diversity.
Supplementary Materials
The following supporting information can be downloaded at https://www.mdpi.com/article/10.3390/compounds5040055/s1, Figure S1: HPLC chromatogram of phenolic compounds. (A) Chromatogram of phenolic standards. (1) Shikimic acid, (2) gallic acid, (3) Hydroquinone, (4) protocatechuic acid, (5) gallocatechin (6) neochlorogenic acid, (7) 3,4-dihydroxyphenylacetic, (8) 4-hydroxybenzoic acid, (9) chlorogenic acid, (10) 4-hydroxyphenyl acetic, (11) vanillic acid, (12) epigallocatechin. (13) syringic acid, (14) 3-hydroxybenzoic acid, (15) caffeic acid, (16) catechin, (17) 4-hydroxybenzaldehyde, (18) epicatechin, (19) homovanillic acid, (20) 3-(4-hydroxyphenylpropionic acid), (21) rutin, (22) coumaric acid, (23) trans-ferulic acid, (24) ellagic acid, (25) synaptic acid, (26) benzoic acid, (27) myricetin, (28) trans-hidroxicinnamic acid, (29) salicylic acid, (30) 2,5-dihydroxybenzoic, (31) transcinamic acid, (32) quercetin, (33) luteolin, (34) naringenin, (35) kaempferol. Chromatogram of phenolic compounds from red (B), white (C), purple (D), and yellow (E) S. thurberi fruits; red S. martinezzi fruits (F); red S. gummosus fruits (G); Table S1: Detection and quantification limits of the standards for phenolic compounds detected.
Author Contributions
Conceptualization, A.D.N.-J. and E.M.-G.; methodology, A.D.N.-J., Y.N.-G., B.A.L.-R., O.A.A.-M. and D.R.M.-C.; formal analysis, A.D.N.-J., Y.N.-G., B.A.L.-R., O.A.A.-M. and D.R.M.-C.; writing—original draft preparation, A.D.N.-J. and E.M.-G.; writing—review and editing, E.M.-G.; supervision and project administration, J.A.N.-M. and E.M.-G. All authors have read and agreed to the published version of the manuscript.
Funding
The authors declare that this study received funding from The Big Green Land Conception S. de R. L. de C.V. Company with the project “Coapetilla Desert Fruits” (No. project 103/C.1).
Data Availability Statement
The original contributions presented in this study are included in the article/Supplementary Materials. Further inquiries can be directed to the corresponding authors.
Acknowledgments
The authors thank CONAHCYT-Mexico for the scholarship (No. 4033963) awarded to Alma Delia Noriega-Juárez.
Conflicts of Interest
The authors declare that this study received funding from The Big Green Land Conception S. de R. L. de C.V. The funder was not involved in the study design, collection, analysis, interpretation of data, the writing of this article or the decision to submit it for publication. Author Javier Alberto Navarro-Mendoza was employed by the company The Big Green Land Conception S. de R. L. de C.V. The remaining authors declare that the research was conducted in the absence of any commercial or financial relationships that could be construed as a potential conflict of interest.
References
- Sánchez-Mejorada, H. Mexico’s problems and programmes monitoring trade in common and endangered cacti. Cact. Succ. J. Gr. Brit. 1982, 44, 36–38. [Google Scholar]
- Quiroz-González, B.; García-Mateos, R.; Corrales-García, J.J.E.; Colinas-León, M.T. Pitaya (Stenocereus spp.): An under-utilized fruit. J. Prof. Assoc. Cactus Dev. 2018, 20, 82–100. [Google Scholar] [CrossRef]
- Hinojosa-Gómez, J.; Muy-Rangel, M.D. Caracterización fisicoquímica y compuestos bioactivos en los frutos de pitaya (Stenocereus thurberi) de cuatro colores. TIP. Rev. Espec. Cienc. Quím. Biol. 2023, 26, 1–9. [Google Scholar] [CrossRef]
- Ordoñez-García, T.E.; Díaz-Castro, F.; Castellanos-Suárez, J.A.; Sedano Castro, G.; Almeraya-Quintero, S.X. Caracterización del cultivo de pitaya Stenocereus pruinosus en la comunidad de Dolores Hidalgo, Huitziltepec, Puebla. Vitalia 2024, 5, 633–648. [Google Scholar] [CrossRef]
- Beltrán-Orozco, M.C.; Oliva-Coba, T.G.; Gallardo-Velázquez, T.; Osorio-Revilla, G. Ascorbic acid, phenolic content, and antioxidant capacity of red, cherry, yellow and white types of pitaya cactus fruit (Stenocereus stellatus Riccobono). Agrociencia 2009, 43, 153–161. [Google Scholar]
- García-Cruz, L.; Valle-Guadarrama, S.; Guerra-Ramírez, D.; Martínez-Damián, M.T.; Zuleta-Prada, H. Cultivation, quality attributes, postharvest behavior, bioactive compounds, and uses of Stenocereus: A review. Sci. Hort. 2022, 304, 111336. [Google Scholar] [CrossRef]
- Noriega-Juárez, A.D.; Nolasco-González, Y.; Vázquez-Mora, J.; García-Magaña, M.d.L.; Montalvo-González, E. Physicochemical characterization, bioactive compounds, and antioxidant capacity from Stenocereus queretaroensis: Mexican endemic fruits with high potential functionality. Horticulturae 2024, 10, 451. [Google Scholar] [CrossRef]
- Cervantes-Arista, C.; García-Jiménez, A.; Trujillo-Ramírez, D. Optimization of the extraction process of bioactive compounds from red fruits of Stenocereus stellatus: Response Surface Methodology (RSM). Food Anal. Methods 2024, 17, 1241–1253. [Google Scholar] [CrossRef]
- Rodríguez-Félix, A.; Fortiz-Hernández, J.; Tortoledo-Ortiz, O. Physico-chemical characteristics, and bioactive compounds of red fruits of sweet pitaya (Stenocereus thurberi). J. Prof. Assoc. Cactus Dev. 2019, 21, 87–100. [Google Scholar] [CrossRef]
- Castro-Enríquez, D.D.; Montaño-Leyva, B.; Del Toro-Sánchez, C.L.; Juárez-Onofre, J.E.; Carvajal-Millán, E.; López-Ahumada, G.A.; Barreras-Urbina, C.G.; Tapia-Hernández, J.A.; Rodríguez-Félix, F. Effect of ultrafiltration of pitaya extract (Stenocereus thurberi) on its phytochemical content, antioxidant capacity, and UPLC-DAD-MS profile. Molecules 2020, 25, 281. [Google Scholar] [CrossRef]
- Padilla-Camberos, E.; Sanchez-Hernandez, I.M.; Torres-Gonzalez, O.R.; Ramirez-Rodriguez, P.; Diaz, E.; Wille, H.; Flores-Fernandez, J.M. Biosynthesis of silver nanoparticles using Stenocereus queretaroensis fruit peel extract: Study of antimicrobial activity. Materials 2021, 14, 4543. [Google Scholar] [CrossRef]
- Arriaga-Ruiz, M.C.; Neri-Luna, C.; Pimienta-Barrios, E.; Sánchez-Martínez, J. El fruto del pitayo silvestre (Stenocereus queretaroensis (Weber) Buxbaum), una alternativa alimenticia, nutricional y socioeconómica en época de estiaje. Rev. Cienc. Nat. Agropec. 2015, 2, 362–367. [Google Scholar]
- Gaytán-Andrade, J.; Aguilar, C.; López-López, L.; Cobos-Puc, L.; Silvia-Belmares, S. Perspectives for food development from pitayo Stenocereus queretaroensis (Weber) Buxbaum. In Handbook of Research on Food Science and Technology; Volume 1: Food Technology and Chemistry; Chávez-González, M.L., Buenrostro-Figueroa, J.J., Aguilar, C.N., Eds.; Apple Academic Press: New York City, NY, USA, 2019; pp. 149–157. [Google Scholar]
- Canizales-Rodríguez, D.F.; Rodríguez-Félix, F.; Tapia-Hernández, J.A.; Del-Toro-Sánchez, C.L.; Ruíz-Cruz, S.; Aubourg, S.P.; Ocaño-Higuera, V.M.; Silvas-García, M.I.; Figueroa-Enríquez, C.E.; Álvarez-Moreno, M.G. Poly (Lactic Acid) fibrous film with betalains from pitaya (Stenocereus thurberi) by electrospinning for potential use as smart food packaging. Coatings 2024, 14, 1581. [Google Scholar] [CrossRef]
- Salomón-Montijo, B.; Reyes-Olivas, Á.; Sánchez-Soto, B.H. Fenología reproductiva de Stenocereus thurberi (Cactaceae) en una región de transición del norte de Sinaloa, México. Gayana Botánica 2016, 73, 381–390. Available online: https://revistas.udec.cl/index.php/gayana_botanica/article/view/4109 (accessed on 1 March 2025).
- Torres-Avendaño, J.I.; Márquez-Salazar, G.; Millán-Otero, M.G.; Díaz, J.S.; Salomón-Montijo, B. Distribución potencial y vulnerabilidad de hábitat de Stenocereus martinezii (Cactaceae) en relación con el cambio de uso de suelo en Sinaloa, México. Acta Bot. Mex. 2025, 132. [Google Scholar] [CrossRef]
- Coronado-García, M.A.; Villegas-Espinoza, J.A.; Amador-Betancourt, L.C.; Rosetti-López, S.R.; Rojas-Rodríguez, I.S. Cultural perception as a primary factor in the market for Red Sour Pitaya (Stenocereus gummosus) in the región of La Paz, Baja California Sur. J. Prof. Assoc. Cactus Dev. 2022, 24, 60–69. [Google Scholar] [CrossRef]
- AOAC. Official Methods of Analysis of AOAC International. 2000. No. C/630.240 O3/200. Available online: https://www.aoac.org/ (accessed on 15 March 2025).
- Englyst, H.N.; Cummings, J.H. Improved method for measurement of dietary fiber as non-starch polysaccharides in plant foods. J. Assoc. Off. Anal. Chem. 1988, 71, 808–814. [Google Scholar] [PubMed]
- Mañas, E.; Saura-Calixto, F. Sources of error in dietary fiber analysis. Food Chem. 1994, 50, 331–342. [Google Scholar] [CrossRef]
- Castellanos-Santiago, E.; Yahia, E.M. Identification and quantification of betalains from the fruits of 10 Mexican prickly pear cultivars by high-performance liquid chromatography and electrospray ionization mass spectrometry. J. Agric. Food Chem. 2008, 56, 5758–5764. [Google Scholar] [CrossRef] [PubMed]
- García-Cruz, L.; Salinas-Moreno, Y.; Valle-Guadarrama, S. Betalains, phenolic compounds and antioxidant activity in pitaya de mayo (Stenocereus griseus H.). Rev. Fitotec. Mex. 2012, 35, 1–5. [Google Scholar]
- Qin, J.; Yeum, K.J.; Johnson, E.J.; Krinsky, N.I.; Russell, R.M.; Tang, G. Determination of 9-cis β-carotene and γ-carotene in biological samples. J. Nutr. Biochem. 2008, 19, 612–618. [Google Scholar] [CrossRef]
- Montreau, F.R. Sur le dosage des composés phénoliques totaux dans les vins par la méthode de Folin-Ciocalteu. Connais Vigne Vin. 1972, 24, 397–404. [Google Scholar] [CrossRef]
- Nolasco-González, Y.; Chacón-López, M.A.; Ortiz-Basurto, R.I.; Aguilera-Aguirre, S.; González-Aguilar, G.A.; Rodríguez-Aguayo, C.; Navarro-Cortez, M.C.; García-Galindo, H.S.; García-Magaña, M.L.; Meza-Espinoza, L.; et al. Annona muricata leaves as a source of bioactive compounds: Extraction and quantification using ultrasound. Horticulturae 2022, 8, 560. [Google Scholar] [CrossRef]
- Barbosa-Gámez, I.; Caballero-Montoya, K.P.; Ledesma, N.; Sáyago-Ayerdi, S.G.; García-Magaña, M.L.; Bishop, E.J.; Montalvo-González, E. Changes in the nutritional quality of five Mangifera species harvested at two maturity stages. J. Sci. Food Agric. 2017, 97, 4987–4994. [Google Scholar] [CrossRef] [PubMed]
- Prior, R.L.; Wu, X.; Schaich, K. Standardized methods for the determination of antioxidant capacity and phenolics in foods and dietary supplements. J. Agric. Food Chem. 2005, 53, 4290–4302. [Google Scholar] [CrossRef]
- Benzie, I.F.F.; Strain, J.J. Ferric reducing/antioxidant power assay. Direct measure of total antioxidant activity of biological fluids and modified version for simultaneous measurement of total antioxidant power and ascorbic acid concentration. Meth. Enzymol. 1996, 299, 15–27. [Google Scholar]
- Re, R.; Pellegrini, N.; Proteggente, A.; Pannala, A.; Yang, M.; Rice-Evans, C. Antioxidant activity applying an improved ABTS radical cation decolorization assay. Free Radic. Biol. Med. 1999, 26, 1231–1237. [Google Scholar] [CrossRef]
- Liberato, C.G.; Barros, J.A.; Virgilio, A.; Machado, R.C.; Nogueira, A.R.; Nobrega, J.A.; Schiavo, D.; Agilent Technologies. Determination of Macro and Micronutrients in Plants Using the Agilent 4200 MP AES. Available online: https://www.agilent.com/cs/library/applications/4200_MP-AES-5991-7856EN-plant-nutrients.pdf (accessed on 10 April 2025).
- Armella, M.A.; Yáñez-López, L.; Soriano, J.; Ramírez, G. Phenology, postharvest physiology and marketing of pitaya (Stenocereus griseus L.) as a sustainable resource. Acta Horticulturae. 2003, 598, 251–254. [Google Scholar]
- García-Cruz, L.; Valle-Guadarrama, S.; Soto-Hernández, R.M. Separation of pitaya (Stenocereus pruinosus) betaxanthins, betacyanins, and soluble phenols through multistage aqueous two-phase systems. Food Bioprocess Technol. 2021, 14, 1791–1804. [Google Scholar] [CrossRef]
- García-Cruz, L.; Valle-Guadarrama, S.; Salinas-Moreno, Y.; Joaquín-Cruz, E. Physical, chemical, and antioxidant activity characterization of pitaya (Stenocereus pruinosus) fruits. Plant Foods Hum. Nutr. 2013, 68, 403–410. [Google Scholar] [CrossRef]
- Emaldi, U.; Nassar, J.M.; Semprun, C. Physicochemical character and food value of two Venezuelan cactus fruits. Trop. Sci. 2004, 44, 105–107. [Google Scholar]
- Pérez-Loredo, M.G.; Hernández-De Jesús, L.; Barragán-Huerta, B.E. Extraction of red pitaya (Stenocereus stellatus) bioactive compounds applying microwave, ultrasound and enzymatic pretreatments. Agrociencia 2017, 51, 135–151. [Google Scholar]
- Wu, L.C.; Hsu, H.W.; Chen, Y.C.; Chiu, C.C.; Lin, Y.I.; Ho, J.A.A. Antioxidant and antiproliferative activities of red pitaya. Food Chem. 2006, 95, 319–327. [Google Scholar] [CrossRef]
- Kotha, R.R.; Tareq, F.S.; Yildiz, E.; Luthria, D.L. Oxidative stress and antioxidants—A critical review on in vitro antioxidant assays. Antioxidants 2022, 11, 2388. [Google Scholar] [CrossRef]
- Shahidi, F.; Samarasinghe, A. How to assess antioxidant activity? Advances, limitations, and applications of in vitro, in vivo, and ex vivo approaches. Food Prod. Process Nutr. 2025, 7, 50. [Google Scholar] [CrossRef]
- Rumpf, J.; Burger, R.; Schulze, M. Statistical evaluation of DPPH, ABTS, FRAP, and Folin-Ciocalteu assays to assess the antioxidant capacity of lignins. Int. J. Biol. Macromol. 2023, 23, 123470. [Google Scholar] [CrossRef]
- Apak, R.; Özyürek, M.; Güçlü, K.; Çapanoğlu, E. Antioxidant activity/capacity measurement. 1. Classification, physicochemical principles, mechanisms, and electron transfer-based assays. J. Agric. Food Chem. 2016, 64, 997–1027. [Google Scholar] [CrossRef]
- Tumilaar, S.G.; Hardianto, A.; Dohi, H.; Kurnia, D. A Comprehensive review of free radicals, oxidative stress, and antioxidants: Overview, clinical applications, global perspectives, future directions, and mechanisms of antioxidant activity of flavonoid compounds. J. Chem. 2024, 21, 5594386. [Google Scholar] [CrossRef]
- U.S. Department of Agriculture; U.S. Department of Health and Human Services. Dietary Guidelines for Americans, 2020–2025, 9th ed.; U.S. Government Publishing Office: Washington, DC, USA, 2020. Available online: https://www.dietaryguidelines.gov (accessed on 5 June 2025).
- Arriaga-Ruiz, M.C.; Pimienta-Barrios, E.; Neri-Luna, C.; Avendaño-López, A.; Sánchez-Martínez, J.; Arellano-Rodríguez, L.J.; Padilla-García, J.M.; Acero-Ortega, J.; Jiménez-Plascencia, C.; López-Ruiz, D.; et al. La pitaya silvestre (Stenocereus queretaroensis) una alternativa alimenticia, nutricional, y socioeconómica. In Proceedings of the XII Encuentro, Participación de la Mujer en la Ciencia, León, Guanajuato, Mexico, 13–15 May 2015; pp. 13–15. Available online: https://congresos.cio.mx/12_enc_mujer_previa/archivos/extensos/sesion1/S1-BCA07.pdf (accessed on 20 March 2025).
- Soriano-Robles, R.; Arias-Margarito, L.; Rivera-Sánchez, L.; Rodriguez-Licea, G. Nutritional evaluation of multinutritional blocks made with Stenocereus griseus and S. stellatus fruits, replacing sugar cane molasses. Braz. J. Anim. Environ. Res. 2022, 5, 36–42. [Google Scholar] [CrossRef]
- Binesh, A.; Venkatachalam, K. Copper in Human Health and Disease: A Comprehensive Review. J. Biochem. Mol. Toxicol. 2024, 38, e70052. [Google Scholar] [CrossRef] [PubMed]
- Hoque, M. A review on different dietary sources of important vitamins and electrolytes. Int. J. Res. Publ. Rev. 2023, 8, 731–736. [Google Scholar] [CrossRef]
- Yadav, S.; Yadav, J.; Kumar, S.; Singh, P. Metabolism of Macro-elements (Calcium, Magnesium, Sodium, Potassium, Chloride and Phosphorus) and Associated Disorders. In Clinical Applications of Biomolecules in Disease Diagnosis; Singh, R.L., Singh, P., Pathak, N., Eds.; Springer: Singapore, 2024. [Google Scholar] [CrossRef]
Disclaimer/Publisher’s Note: The statements, opinions and data contained in all publications are solely those of the individual author(s) and contributor(s) and not of MDPI and/or the editor(s). MDPI and/or the editor(s) disclaim responsibility for any injury to people or property resulting from any ideas, methods, instructions or products referred to in the content. |
© 2025 by the authors. Licensee MDPI, Basel, Switzerland. This article is an open access article distributed under the terms and conditions of the Creative Commons Attribution (CC BY) license (https://creativecommons.org/licenses/by/4.0/).