Abstract
Background: The relationship between maternal thyroid function and psychiatric morbidity remains inconclusive, particularly regarding the association with antepartum depression (APD). This meta-analysis aimed to precisely quantify the association between the three primary maternal thyroid hormone concentrations—thyroid-stimulating hormone (TSH), free thyroxine (FT4), and free triiodothyronine (FT3)—measured in late pregnancy and in the presence of APD. Methods: We conducted a systematic review and meta-analysis of observational studies identified through comprehensive database searches (PubMed, Web of Science, Scopus). Four exploratory studies were ultimately included, enrolling a total of 689 participants. We used random-effects models to pool the mean difference (MD) in hormone concentrations between depressed and non-depressed cohorts. Subgroup analyses were performed based on the study population (general versus hypothyroid), and publication bias was assessed using Begg’s and Egger’s tests. Results: None of the pooled hormone concentrations demonstrated a statistically significant association with APD. The overall MDs were non-significant for TSH (MD = −0.07, 95% CI: [−0.32, 0.18], p = 0.59), FT4 (MD = −0.11, 95% CI: [−1.14, 0.92], p = 0.83), and FT3 (MD = 0.53, 95% CI: [−0.20, 1.25], p = 0.15). Substantial and significant heterogeneity was detected across all models (I2 ranging from 70% to 94%). This heterogeneity was largely driven by conflicting directional findings (some studies linking APD to hypothyroid trends, others to hyperthyroid trends), masking a potential non-linear or categorical effect. Statistical tests found no significant evidence of publication bias for TSH (p = 0.33), FT4 (p = 0.12), or FT3 (p = 0.33). Conclusions: The absolute mean concentrations of TSH, FT4, and FT3 in late pregnancy are not robust concurrent biomarkers for antepartum depressive symptoms. The high heterogeneity suggests that APD may be associated with categorical dysfunction (i.e., TSH levels at the extreme high or low ends of the reference range) rather than linear changes in hormone concentration. Future research should prioritize investigating categorical risks, the influence of thyroid autoimmunity, and employing gold-standard diagnostic interviews to better delineate the complex endocrinological risk factors for APD. Due to the limited number of studies, these results should be considered hypothesis-generating rather than confirmatory. PROSPERO registration: CRD420251233154.
1. Introduction
Antepartum depression, also known as prenatal depression, is a significant mental health disorder that occurs during pregnancy, with an estimated prevalence of approximately 16.4%. It may develop in any trimester; however, it is most reported during the third trimester [1,2]. This condition has important negative consequences for both maternal and fetal health [3]. It is associated with an increased risk of preeclampsia [4] and postpartum depression [5], as well as adverse birth outcomes such as preterm birth [6] and impaired fetal growth [7]. Furthermore, antepartum depression has been linked to long-term negative outcomes in the child, including delays in cognitive development [8].
Early screening is essential to ensure timely diagnosis and intervention, thereby reducing the likelihood of adverse outcomes. Identifying the relevant risk factors also allows healthcare providers to determine which pregnant women are at higher risk of developing depression and to implement preventive strategies or initiate treatment at an earlier stage [9].
The etiology of antepartum depression remains insufficiently defined. Current evidence suggests a multifactorial origin, arising from complex interactions among diverse determinants, including psychosocial stressors [10], biological influences such as pregnancy-related hormonal fluctuations [11], genetic vulnerability [12], and immune dysregulation [13].
Furthermore, some studies have examined thyroid hormone alterations as potential predictors of antepartum depression, although the findings remain inconclusive and contradictory [14,15].
During pregnancy, thyroid hormone concentrations undergo significant physiological adaptations. In the first trimester, rising levels of human chorionic gonadotropin (hCG) stimulate the thyroid-stimulating hormone (TSH) receptor, resulting in partial suppression of TSH release. In addition, estrogen-mediated upregulation of thyroxine-binding globulin (TBG) enhances thyroid hormone binding, thereby reducing circulating free hormone fractions and increasing total T4 concentrations [16,17].
However, current evidence regarding the relationship between thyroid function and antepartum depressive disorders remains inconsistent. We therefore propose a meta-analysis to examine the association between maternal thyroid function in late pregnancy and the development of antepartum depression.
2. Materials and Methods
The study was conducted according to the Cochrane Collaboration and PRISMA statement [18]. The study protocol has been registered in the PROSPERO International prospective register of systematic review with the registration number CRD420251233154. The PRISMA Checklists are presented as Supplementary Table S1.
2.1. Literature Searching
We conducted a systematic search from inception to October 2025 in PubMed, Web of Science, and Scopus to identify all relevant studies in English language with the terms (“TSH” OR “FT3” OR “FT4”) AND (“antepartum depression”).
Inclusion criteria were (1) longitudinal studies, enrolling women during pregnancy in their third trimester; (2) measurement of the depression level; (3) TSH, FT3, or FT4 measurements; (4) the article reported sufficient quantitative data (mean, standard deviation or standard error, and sample size) to calculate mean difference (MD) or standardized mean difference (SMD) for pooling.
Exclusion criteria were (1) wrong publication type: systematic reviews or meta-analysis, case reports, conference abstracts, or study protocols; (2) studies focusing solely on postpartum depression (excluding the antepartum period) or other psychiatric disorders (e.g., anxiety disorders, psychosis) without a primary focus on depression; (3) wrong exposure measure: for example, studies measuring only total thyroxine (TT4) or total triiodothyronine (TT3) without corresponding free hormone or TSH values, as total hormone concentrations are significantly affected by pregnancy physiology; (4) wrong depression measure: studies that did not use a validated depression measurement tool or did not report a clear clinical cut-off score.
Given the use of varying screening tools (EPDS, HADS, Zung) and diagnostic interviews (SCID-NP), the outcome “antepartum depression” in this meta-analysis encompasses a spectrum ranging from sub-threshold depressive symptoms to clinical major depressive disorder.
2.2. Data Extraction, Quality Assessment and Publication Bias
Two authors (L.-M.H. and R.S.D.) screened titles, abstracts, and full texts for eligibility, using Rayyan (version 1.6.1.) [19], a web-based tool designed for systematic reviews and meta-analyses, and extracted data from the included studies independently. The process involved: blinded screening (each reviewer independently categorized records as “Include”, “Exclude”, or “Maybe” with conflicts automatically flagged by Rayyan), and full-text review (screened abstracts were advanced to full-text assessment if marked “Include” or “Maybe” by either reviewer). Extracted data included study characteristics, population demographics, and methods of depression assessment. Disagreements were resolved by consensus or a third reviewer (A.T.-S.).
The risk of bias and quality assessment was performed using the Newcastle–Ottawa Scale (NOS) for the prospective study [15] or NOS for cross-sectional studies [20]. Studies getting scores ≥ 7 stars were regarded as high-quality studies. The quality assessment was performed by two reviewers (L.-M.H. and R.S.D.), and any disagreement was resolved by a third reviewer (A.T.-S.), who re-evaluated the original study.
2.3. Statistical Analysis
R (version 4.5.1-1.2204.0, R Foundation, Vienna, Austria) and RevMan (version 5.4, Cochrane Collaboration, 2020) were used. The continuous outcomes (TSH, FT4, and FT3 concentrations) were synthesized by calculating the mean difference (MD) between the depressed (case) group and the non-depressed (control) group for each study. Where hormone concentrations were reported in different units (e.g., pmol/L vs. ng/dL), these were converted to a single standard unit (pmol/L for FT4 and FT3, and mIU/L for TSH) to facilitate direct pooling of MD. Due to anticipated clinical and methodological variability across studies (differences in population, country, and APD diagnostic tools), a random-effects model using the DerSimonian–Laird method was employed for all meta-analyses. The results were presented with 95% confidence intervals (CIs). Statistical significance was defined as a two-sided p-value < 0.05.
Statistical heterogeneity among the studies was assessed using two metrics: Cochran’s Q statistic (χ2) and I2 statistics. A p-value < 0.10 was considered indicative of significant heterogeneity. I2 statistics quantify the proportion of total variation across studies that is due to true heterogeneity rather than chance. I2 values of 0% to 40% may represent negligible heterogeneity, 40% to 75% moderate heterogeneity, and 75% to 100% considerable heterogeneity. In the presence of substantial heterogeneity (I2 > 50%), potential sources were explored using subgroup analysis, stratifying studies based on key clinical characteristics, specifically the thyroid status of the included cohort (e.g., general population vs. diagnosed hypothyroidism). The significance of the difference between subgroups was tested using the χ2 test for subgroup differences.
Publication bias was assessed by visual inspection of the funnel plot for each hormone analysis (TSH, FT4, and FT3). Due to the low number of included studies (N = 4), the statistical assessment of asymmetry was performed primarily for confirmation using Begg’s rank correlation test and Egger’s regression test. A p-value for these tests ≥ 0.10 was interpreted as providing no evidence of statistically significant funnel plot asymmetry.
To address the high statistical heterogeneity and the limited number of studies (N = 4), we implemented a structured LLM-based evidence mapping pipeline. We utilized a large language model (Gemini 3 Flash) to perform contextual extraction and normalization across the included studies. The pipeline focused on: (1) extracting specific study contexts (trimester, thyroid assay types, and depression scales); (2) normalizing thyroid categories; and (3) identifying potential effect modifiers, such as socioeconomic status or clinical diagnostic rigor. This mapping was used to classify evidence as “association present”, “absent”, or “conditional” based on the study methodology rather than purely numerical means.
3. Results
3.1. Study Selection and Quality Assessment of the Included Studies
The literature search yielded an initial pool of 127 articles across three major databases (PubMed: 12 studies, Web of Sciences: 90 studies, and Scopus: 25 studies), as shown in Figure 1. After excluding 24 articles due to duplication, 90 articles due to common reasons for exclusion (wrong outcome, systematic review, or wrong publication type), and 90 articles due to eligibility assessment, we have finally included four articles in our meta-analysis. It must be emphasized that with only four included studies, the following pooled estimates are exploratory in nature. As the number of studies is N < 10, the power of the funnel plot assessment to detect publication bias is very low, and results should be interpreted with extreme caution.
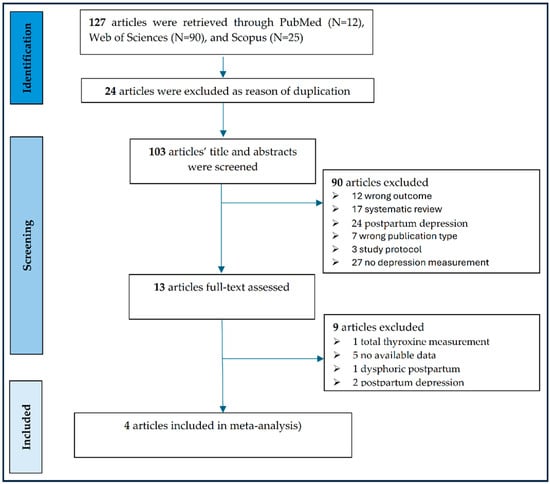
Figure 1.
PRISMA flow diagram of the studies included in the meta-analysis.
The mean age of the assessed pregnant women ranged between 26.7 and 29 years, being in their third trimester, as shown in Table 1 [15,21,22,23]. Ma et al. included only pregnant women in late pregnancy diagnosed with secondary clinical hypothyroidism [22]. The potential impact of confounding variables was minimized in every study by carefully matching controls (pregnant women without depression) with the case group (pregnant women with depression) based on age, parity, education, and socioeconomic status. Among the four included studies, marital status (single) and employment vary widely. The percentage of single mothers varies among the studies, ranging from a low 1% [22] to a high of 61% [23]. The high rates of unemployment reported in the Aishwarya et al. [21] and Wissart et al. [23] studies (up to 86–92% in India) suggest significant socioeconomic stress.

Table 1.
General population characteristics of the included studies.
3.2. Association Between Maternal Free Triiodothyronine (FT3) Levels and Antepartum Depression
A random-effects meta-analysis was performed on three studies examining the mean FT3 concentrations in pregnant women diagnosed with APD versus non-depressed control groups, as in Figure 2A. The analysis included N = 490 patients (137 with depression and 353 without depression) and yielded a total MD of 0.53 (95% CI: [−0.20, 1.25]), which did not reach statistical significance (Z = 1.43, p = 0.15). High and statistically significant heterogeneity was detected across the overall pooled estimates (τ2 = 0.38, χ2 = 32.84, df = 2, p < 0.0001, I2 = 94%).
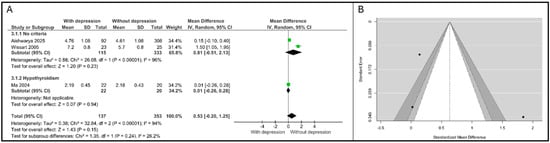
Figure 2.
Association between FT3 and depression. (A). Forest plot. (B). Funnel plot. Subgroups are defined by thyroid status: “No criteria” refers to the general pregnant population; “Hypothyroidism” refers to patients with pre-existing thyroid dysfunction [21,22,23].
Due to this substantial heterogeneity, a subgroup analysis based on participant characteristics (thyroid status) was conducted. Ma et al. [22] reported data specifically for women with confirmed hypothyroidism (N = 42). The MD was calculated as 0.01 (95% CI: [−0.26, 0.28]), indicating essentially no difference in FT3 levels between the depressed and non-depressed cohorts within this specific clinical group.
The test for subgroup differences was statistically non-significant (χ2 = 1.35, df = 1, p = 0.24), suggesting that the effect size did not differ significantly between the general population and the hypothyroidism group, despite the differences in clinical setting.
Visual inspection of the funnel plot (Figure 2B) for FT3 MD suggested a potential asymmetry. While the number of studies (N = 3) is low, limiting the reliability of formal statistical testing for bias, the effect size with the largest standard error ([23] corresponding to a standard MD of approx. 1.8 on the funnel plot) appears to be driving the overall distribution. An examination of the studentized residuals revealed that the study Wissart et al. [23] had a value larger than ±2.3940 and may be a potential outlier in the context of this model. According to Cook’s distances, none of the studies could be overly influential. Neither the rank correlation nor the regression test indicated any funnel plot asymmetry (p = 0.33 and p = 0.48, respectively).
3.3. Association Between Maternal Free Thyroxine (FT4) Levels and Antepartum Depression
A random-effects meta-analysis involving four studies was conducted to compare the mean FT4 concentrations in pregnant women with APD versus non-depressed control groups, as shown in Figure 3A. The analysis included a total of N = 641 participants (121 with APD and 520 controls).
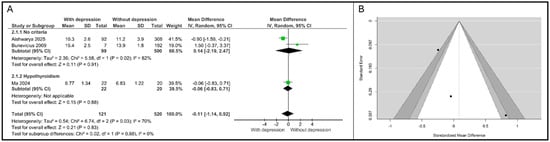
Figure 3.
Association between FT4 and depression. (A). Forest plot. (B). Funnel plot. Subgroups are defined by thyroid status: “No criteria” refers to the general pregnant population; “Hypothyroidism” refers to patients with pre-existing thyroid dysfunction [15,21,22].
The overall pooled MD for FT4 was calculated as −0.11 (95% CI: [−1.14, 0.92]). This result demonstrates that there is no statistically significant association between maternal FT4 levels and APD (Z = 0.21, p = 0.83). The negative MD indicates a non-significant trend toward lower FT4 levels in the depressed cohort compared to that in controls. Significant and substantial heterogeneity was detected in the overall analysis τ2 = 0.54, χ2 = 6.74, df = 2, p = 0.03, I2 = 70%).
The studies were stratified based on the thyroid status of the cohort: general population (“No criteria”) and women with pre-existing hypothyroidism (“Hypothyroidism”). Two studies were pooled in the no specific thyroid criteria subgroup. The overall MD was 0.14 (95% CI: [−2.19, 2.47]), confirming a non-significant association. High heterogeneity persisted within this subgroup (τ2 = 2.36, I2 = 82%), primarily driven by the conflicting results: Aishwarya et al. [21] reported a significant negative association (MD = −0.90 (95% CI: [−1.59, −0.21])), while Bunevicius et al. [15] reported a substantial yet non-significant positive difference (MD = 1.50 (95% CI: [−0.37, 3.37])). Ma et al. [22] reported a minor non-significant negative difference (MD = −0.06 (95% CI: [−0.83, 0.71])). The test for subgroup differences showed no statistical significance (χ2 = 0.02, df = 1, p = 0.88), indicating that the effect size of FT4 does not differ between the general population and the hypothyroid population.
The results from both the Begg’s rank correlation test (p = 0.33) and Egger’s regression test (p = 0.12) provided no statistical evidence to reject the null hypothesis of symmetry, suggesting that publication bias is not a significant factor in the pooled estimate for FT4 MD, as shown in Figure 3B.
3.4. Association Between Maternal Thyroid-Stimulating Hormone (TSH) Levels and Antepartum Depression
A random-effects meta-analysis was performed on four studies examining mean TSH concentrations in pregnant women diagnosed with APD versus non-depressed control groups. The analysis included a total of N = 689 participants (144 with APD and 545 controls).
The overall pooled MD for TSH was calculated as −0.07 (95% CI: [−0.32, 0.18]). This result demonstrates that there is no statistically significant association between maternal TSH levels and APD (Z = 0.53, p = 0.59). The negative MD indicates a non-significant, slight trend toward lower TSH levels in the depressed cohort compared to controls.
Significant and substantial heterogeneity was detected in the overall analysis (τ2 = 0.05, χ2 = 21.45, df = 3, p < 0.0001, I2 = 86%). The studies were stratified based on the thyroid status of the cohort: general population (“No criteria”) and women with pre-existing hypothyroidism (“Hypothyroidism”). Three studies (N = 647) were pooled in this subgroup. The overall MD was −0.10 (95% CI: [−0.44, 0.24]), which was non-significant (Z = 0.56, p = 0.58). High heterogeneity persisted within this subgroup (τ2 = 0.08, I2 = 89%). Notably, Bunevicius et al. [15] reported a substantial negative MD = −0.40 (95% CI: [−0.64, −0.16]), indicating significantly lower TSH levels in the depressed group, while Aishwarya et al. [21] showed a positive MD = 0.34 (95% CI: [0.07, 0.61]), indicating higher TSH levels in the depressed group. The single study in this group, Ma et al. [22], reported a minor non-significant positive difference MD = 0.03 (95% CI: [−0.16, 0.22]). Crucially, the test for subgroup differences showed no statistical significance (χ2 = 0.41, df = 1, p = 0.52), and the heterogeneity between subgroups was I2 = 0%, as shown in Figure 4A.
Figure 4.
Association between TSH and depression. (A). Forest plot. (B). Funnel plot. Subgroups are defined by thyroid status: “No criteria” refers to the general pregnant population; “Hypothyroidism” refers to patients with pre-existing thyroid dysfunction [15,21,22,23].
Significant and substantial heterogeneity was detected in the overall analysis (τ2 = 0.05, χ2 = 21.45, df = 3, p < 0.0001, I2 = 86%).The statistical assessment of publication bias provided no evidence of significant asymmetry: Begg’s rank correlation test yielded p = 0.33, and Egger’s regression test yielded p = 0.16. This suggests that small study effects or systematic publication bias are unlikely to be major sources of error in the pooled effect, as shown in Figure 4B.
3.5. Sensitivity Analysis by Assessment Type (Diagnostic and Screening)
The sensitivity analysis stratified the included studies into two subgroups: Diagnostic (SCID-NP) and Screening (EPDS, HADS, Zung SDS).
All available studies (N = 3) for FT3 relied on screening tools. The pooled mean difference (MD) was 0.53 (95% CI: [−0.20, 1.25]), indicating no statistically significant association (p = 0.15). Heterogeneity remained exceptionally high (I2 = 94%), primarily driven by the Wissart et al. [23] outlier, as shown in Figure 5A.
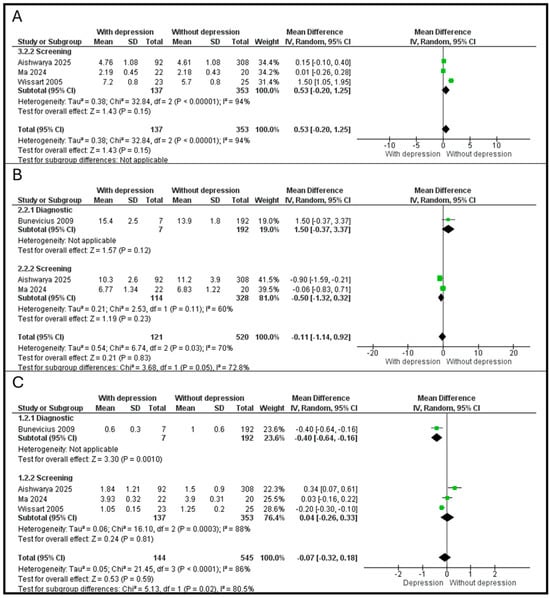
Figure 5.
(A). Association between FT3 and depression. (B). Association between FT4 and depression. (C). Association between TSH and depression [15,21,22,23].
For FT4, a single study byBunevicius et al. [15]) utilized a diagnostic interview, reporting an MD of 1.50 (95% CI: [−0.37, 3.37], p = 0.12). In the screening subgroup, combining Aishwarya et al. [21] and Ma et al. [22] yielded an MD of −0.50 (95% CI: [−1.32, 0.32], p = 0.23). A significant difference was observed between the diagnostic and screening subgroups (χ2 = 3.68, p = 0.05, I2 = 72.8%), suggesting that the method of APD assessment significantly modifies the observed relationship with FT4, as shown in Figure 5B.
For TSH, in the diagnostic subgroup, the SCID-NP-based study [15] showed a significant negative association, with depressed women having lower TSH levels (MD = −0.40, 95% CI: [−0.64, −0.16], p = 0.001). In the screening subgroup, the pooled MD for the three screening-based studies was 0.04 (95% CI: [−0.26, 0.33], p = 0.81). There was a highly significant difference between diagnostic and screening outcomes (χ2 = 5.13, p = 0.02, I2 = 80.5%), indicating that TSH’s association with APD is highly dependent on whether a clinical diagnosis or a screening tool is used, as shown in Figure 5C.
3.6. Evidence Mapping of Study Discordance
To investigate why individual studies yielded contradictory results despite similar timing in late pregnancy, we performed an LLM-assisted contextual mapping. This pipeline normalized thyroid status and identified non-biological effect modifiers that statistical pooling might overlook. The qualitative mapping (Table 2) reveals that the conflicting directional findings in the meta-analysis may be driven by specific methodological modifiers rather than random error.
Table 2.
LLM-Assisted Evidence Map and Study Contextualization.
Evidence classification (present/absent/conditional) was based on the study’s primary conclusion. The association was present in Wissart et al. [23] (significant correlation with TT4 changes) and Aishwarya et al. [21] (TSH and estradiol association). Association was absent in Ma et al. [22] (no baseline thyroid difference between depressed/non-depressed hypothyroid women). Association was conditional in Bunevicius et al. [15] (found an association only in late pregnancy but not earlier, showing higher FT4 and a trend toward lower TSH in depressed women).The LLM identified the effect modifiers, the non-hormonal variables that changes the outcome: TPOAb (Bunevicius et al. [15] found TPOAb did not correlate with depression), socioeconomic (Wissart et al. [23] identified single motherhood as a massive determinant (94% of depressed women were single)), or nutritional (Aishwarya et al. [21] identified Vitamin D and B12 deficiency as co-factors).
Our LLM-based evidence mapping suggests that maternal thyroid hormones are not linear biomarkers for depression in late pregnancy. Instead, the association is conditional: thyroid fluctuations correlate with depressive symptoms in high-stress populations (single motherhood, unemployment) when measured by screening scales, but this relationship disappears in clinically managed cohorts or when using gold-standard diagnostic interviews.
4. Discussion
The objective of this meta-analysis was to systematically synthesize the current evidence regarding the association between circulating maternal thyroid hormone concentrations—specifically TSH, FT4, and FT3—in late pregnancy and the diagnosis of antepartum depressive symptoms. Despite the robust selection process, which yielded four clinically and methodologically relevant studies, the aggregate results consistently demonstrated a lack of statistically significant association between any single thyroid hormone concentration and APD. The pooled MD for all three primary thyroid markers was non-significant: TSH (MD = −0.07, 95% CI: [−0.32, 0.18], p = 0.59), FT4 (MD = −0.11, 95% CI: [−1.14, 0.92], p = 0.83), FT3 (MD = 0.53, 95% CI: [−0.20, 1.25], p = 0.15).
These combined null findings strongly suggest that, in women who are predominantly euthyroid or under management for mild thyroid dysfunction, the absolute mean concentration of thyroid hormones in the late gestational period is not a robust concurrent biological marker for APD. While thyroid hormones play a pivotal role in brain development and mood regulation [24,25], the data indicates that major depressive pathology in this cohort is likely driven by upstream endocrine or psychosocial factors, independent of the bulk concentration of circulating hormones.
A central finding of this analysis is the persistence of substantial and significant heterogeneity across all three hormone models (I2 ranging from 70% to 94%). This extreme variance is not merely statistical noise but rather reflects fundamental clinical and methodological inconsistencies across source literature.
Specifically, the effect estimates for TSH and FT4 were marked by conflicting directional associations among key studies in the general population subgroup. For instance, the analysis of TSH was confounded by one high-quality study [15], suggesting a link between APD and low TSH (hyperthyroid trend), and another [21], suggesting a link with high TSH (hypothyroid trend). This phenomenon, where the pooled null effect masks a potential non-linear relationship, suggests that APD may be associated with dysfunction at both ends of the TSH spectrum (i.e., subclinical hypo- and hyperthyroidism), rather than a linear increase or decrease in TSH correlating with symptom severity. A simple mean difference analysis is fundamentally inadequate for testing such a U- or J-shaped relationship.
The findings from our meta-analysis, demonstrating no significant association between gestational TSH orFT4 concentrations and APD, are highly consistent with the results of the recent large systematic review and meta-analysis by Sileo et al. [26] regarding postpartum depression (PPD). The congruence of these results provides strong evidence that gestational thyroid hormone concentrations, when analyzed as continuous variables, are not robustly associated with depressive disorders at either end of the perinatal spectrum (ante- or postpartum). This null association suggests that the pathogenesis of both APD and PPD is not primarily driven by the basal level of thyroid hormones, but rather by other factors, especially psychosocial stress and vulnerability.
Furthermore, the FT3 analysis was highly sensitive to one low-quality outlier [23] (NOS score 6/9), which reported an unusually large positive effect, likely due to methodological bias (convenience sampling, non-standardized depression scale) rather than a true biological difference. This underscores the need for stringent quality filters in future meta-analyses of this topic.
Clinical research must pivot from comparing the mean concentration of thyroid hormones to analyzing categorical risk, such as calculating the odds ratio of developing APD in women who meet specific TSH or FT4 thresholds for subclinical disease, even if those thresholds are subclinical.
Given the stability of the free hormones, the underlying pathology may reside in the autoimmune status of the thyroid. Thyroid peroxidase antibody (TPOAb) positivity is independently associated with both thyroid dysfunction and postpartum mental illness [27,28]. However, more research is required to clarify the predictive value and pathophysiological implications of the associations between TPOAb positivity and postpartum depression [29]. A meta-analysis from 2023 highlighted that it is not yet possible to conclude whether thyroid function in the pregnancy-puerperal cycle is involved with the development of PPD [28]. The inflammatory and neurobiological effects of TPOAb status, irrespective of a euthyroid state maintained by TSH compensation, should be investigated as the primary mediator of APD risk [30].
The significant heterogeneity in depression diagnosis (ranging from the gold-standard SCID-NP interview in Bunevicius et al. [15] to screening scales like EPDS and Zung) remains a major barrier. Future studies must adopt standardized, diagnostic-level interviews to ensure that the outcome accurately represents clinical depression rather than merely sub-threshold depressive symptoms.
Furthermore, the clinical interpretability of the pooled “APD” construct is limited by the inclusion of both screening-derived symptoms and interview-confirmed diagnoses. The inclusion of Aishwarya et al. provides a critical lens into the impact of environmental and socioeconomic modifiers on the thyroid-mood axis [21]. While our overall meta-analysis yielded non-significant linear associations, the Aishwarya et al. [21] study reported a significant correlation between TSH and depressive symptoms (rho = 0.25, p = 0.01). Our LLM-based evidence mapping suggests that this study’s findings are strongly influenced by a high-risk profile: 34.8% of the depressed cohort had pre-existing hypothyroidism, and the group faced significant socioeconomic stress (high unemployment rates) and micronutrient deficiencies (Vitamin B12 and D).
Furthermore, Aishwarya et al. [21] identified Bisphenol A (BPA) exposure as a significant independent risk factor (OR = 2.5). This suggests that in specific populations where environmental endocrine disruptors and socioeconomic stressors are prevalent, the relationship between TSH and antepartum depression may be amplified, contributing to the high heterogeneity (I2 = 86%) observed in our pooled TSH model.
The high statistical heterogeneity (I2 ≈ 70–94%) observed in our meta-analysis is largely explained by the qualitative discordance identified through LLM-based evidence mapping. While managed hypothyroid cohorts [22] and gold-standard diagnostic assessments [15] show minimal to absent linear associations, studies in populations with high socioeconomic stressors and screening-based outcomes [21,23] report significant links. This suggests that the thyroid-mood axis is conditional, likely acting as a biological vulnerability that is unmasked only in the presence of significant external psychosocial or environmental stress.
A significant limitation of this meta-analysis is the small number of included studies (N = 4) and the high resulting statistical heterogeneity. Although formal statistical testing (Begg’s p range of 0.33 to 0.48; Egger’s p range of 0.12 to 0.48) provided robust evidence against systemic publication bias across all three hormones, the low power of these tests must be acknowledged.
Summary of null findings across the thyroid axis while the final pool of four studies offers a globally representative sample, the substantial methodological (diagnostic tool) and demographic (marital status, unemployment) heterogeneity necessitates the use of random-effects models for pooling, and potentially meta-regression, to account for these between-study differences. The percentage of single mothers varies among the studies, ranging from 1% to 61% [15,23]. Given that single status is an independent risk factor for depression [31], this variable is a potential confounder that requires subgroup analysis or meta-regression if the raw data permits. The high rates of unemployment reported in the Aishwarya et al. [21] and Wissart et al. [23] studies (up to 86–92% in India) suggest significant socioeconomic stress, which must be acknowledged as a plausible mediator or confounder in the thyroid-mood relationship [32].
The current analysis is exploratory; with only four studies, conclusions regarding publication bias must be softened, as funnel tests are notably underpowered. A major source of heterogeneity is the use of four different diagnostic tools for APD. EPDS is widely used, but primarily a screening tool [33]. SCID-NP is the gold-standard diagnostic interview, which provides the highest certainty for true APD diagnosis, though it yielded a very low prevalence in late pregnancy (3.5%) [15,34,35]. HADS and Zung Self-Rating Depression Scale are both self-rating scales commonly used for screening [36]. The inclusion of studies relying on self-rating scales (EPDS, HADS, Zung) alongside the SCID-NP study means the pooled outcome will likely be based on the association between thyroid function and depressive symptoms (rather than formal clinical diagnosis) for most of the included population.
5. Conclusions
In conclusion, this meta-analysis of the thyroid axis in late pregnancy found no evidence to support the use of mean TSH, FT4, or FT3 concentration as a concurrent biomarker for antepartum depression. The high heterogeneity points toward a need for targeted etiological research that accounts for non-linear effects, addresses the role of thyroid autoimmunity, and employs rigorous diagnostic criteria to accurately define the depressed phenotype.
Supplementary Materials
The following supporting information can be downloaded at: https://www.mdpi.com/article/10.3390/psychiatryint7020053/s1. Supplementary Table S1 (PRISMA Checklist).
Author Contributions
Conceptualization, L.-M.H., R.S.D. and A.T.-S.; methodology, L.-M.H. and A.T.-S.; validation, L.-M.H., R.S.D. and M.P.; formal analysis, A.T.-S.; investigation, L.-M.H., R.S.D., M.P., D.G.G. and M.C.P.; resources, L.-M.H.; data curation, L.-M.H., R.S.D. and A.T.-S.; writing—original draft preparation, L.-M.H., R.S.D. and A.T.-S.; writing—review and editing, D.G.G., M.C.P. and A.T.-S.; supervision, A.T.-S.; project administration, L.-M.H.; funding acquisition, L.-M.H. All authors have read and agreed to the published version of the manuscript.
Funding
The article Processing Charges were founded by the Project Strengthening doctoral programs to increase educational performance and professional skills in medicine, dentistry and pharmacy (DOCMED+, SMIS 350696).
Institutional Review Board Statement
Not applicable.
Informed Consent Statement
Not applicable.
Data Availability Statement
No new data were created or analyzed in this study.
Conflicts of Interest
The authors declare no conflicts of interest.
Abbreviations
The following abbreviations are used in this manuscript:
| APD | antepartum depression |
| TSH | thyroid-stimulating hormone |
| FT3 | free triiodothyronine |
| FT4 | free thyroxine |
References
- Silva, M.M.J.; Serrano, T.B.M.; Porcel, G.D.S.; Monteiro, B.B.; Clapis, M.J. Risk of depression during pregnancy in usual risk antenatal care. Rev. Lat. Am. Enfermagem 2023, 31, e3962. [Google Scholar] [CrossRef]
- Okagbue, H.I.; Adamu, P.I.; Bishop, S.A.; Oguntunde, P.E.; Opanuga, A.A.; Akhmetshin, E.M. Systematic review of prevalence of antepartum depression during the trimesters of pregnancy. Open Access Maced. J. Med. Sci. 2019, 7, 1555–1560. [Google Scholar] [CrossRef]
- Schaffir, J. Consequences of antepartum depression. Clin. Obstet. Gynecol. 2018, 61, 533–543. [Google Scholar] [CrossRef]
- Hu, R.; Li, Y.; Zhang, Z.; Yan, W. Antenatal depressive symptoms and the risk of preeclampsia or operative deliveries: A meta-analysis. PLoS ONE 2015, 10, e0119018. [Google Scholar] [CrossRef]
- Yu, J.; Zhang, Z.; Deng, Y.; Zhang, L.; He, C.; Wu, Y.; Xu, X.; Yang, J. Risk factors for the development of postpartum depression in individuals who screened positive for antenatal depression. BMC Psychiatry 2023, 23, 557. [Google Scholar] [CrossRef]
- Shenassa, E.D.; Widemann, L.G.; Hunt, C.D. Antepartum depression and preterm birth: Pathophysiology, epidemiology, and disparities due to structural racism. Curr. Psychiatry Rep. 2021, 23, 14. [Google Scholar] [CrossRef]
- Accortt, E.E.; Cheadle, A.C.; Dunkel Schetter, C. Prenatal depression and adverse birth outcomes: An updated systematic review. Matern. Child Health J. 2015, 19, 1306–1337. [Google Scholar] [CrossRef]
- Deave, T.; Heron, J.; Evans, J.; Emond, A. The impact of maternal depression in pregnancy on early child development. BJOG Int. J. Obstet. Gynaecol. 2008, 115, 1043–1051. [Google Scholar] [CrossRef]
- Venkatesh, K.K.; Nadel, H.; Blewett, D.; Freeman, M.P.; Kaimal, A.J.; Riley, L.E. Implementation of universal screening for depression during pregnancy: Feasibility and impact on obstetric care. Am. J. Obstet. Gynecol. 2016, 215, 517.e1–517.e8. [Google Scholar] [CrossRef]
- Van Damme, R.; Descheemaeker, M.; Van den Bergh, B.; Vanderhasselt, M.A.; Roelens, K.; Lemmens, G. The importance of the cumulation of risk factors for antepartum depression. Acta Clin. Belg. 2024, 79, 413–422. [Google Scholar] [CrossRef]
- Szpunar, M.J.; Parry, B.L. A systematic review of cortisol, thyroid-stimulating hormone, and prolactin in peripartum women with major depression. Arch. Womens Ment. Health 2018, 21, 149–161. [Google Scholar] [CrossRef]
- Lancaster, E.E.; Lapato, D.M.; Peterson, R.E. Understanding the genetics of peripartum depression: Research challenges, strategies, and opportunities. Front. Genet. 2022, 13, 1022188. [Google Scholar] [CrossRef]
- Bränn, E.; Chen, Y.; Song, H.; László, K.D.; D’Onofrio, B.M.; Hysaj, E.; Almqvist, C.; Larsson, H.; Lichtenstein, P.; Valdimarsdottir, U.A.; et al. Bidirectional association between autoimmune disease and perinatal depression: A nationwide study with sibling comparison. Mol. Psychiatry 2024, 29, 602–610. [Google Scholar] [CrossRef]
- Konstantakou, P.; Chalarakis, N.; Valsamakis, G.; Sakkas, E.G.; Vousoura, E.; Gryparis, A.; Sakkas, G.E.; Papadimitriou, G.; Zervas, I.; Mastorakos, G. Associations of thyroid hormones profile during normal pregnancy and postpartum with anxiety, depression, and obsessive/compulsive disorder scores in euthyroid women. Front. Neurosci. 2021, 15, 663348. [Google Scholar] [CrossRef]
- Bunevicius, R.; Kusminskas, L.; Mickuviene, N.; Bunevicius, A.; Pedersen, C.A.; Pop, V.J. Depressive disorder and thyroid axis functioning during pregnancy. World J. Biol. Psychiatry 2009, 10, 324–329. [Google Scholar] [CrossRef]
- Leung, A.M. Thyroid function in pregnancy. J. Trace Elem. Med. Biol. 2012, 26, 137–140. [Google Scholar] [CrossRef]
- Springer, D.; Jiskra, J.; Limanova, Z.; Zima, T.; Potlukova, E. Thyroid in pregnancy: From physiology to screening. Crit. Rev. Clin. Lab. Sci. 2017, 54, 102–116. [Google Scholar] [CrossRef]
- Moher, D.; Liberati, A.; Tetzlaff, J.; Altman, D.G.; PRISMA Group. Preferred reporting items for systematic reviews and meta-analyses: The PRISMA statement. Open Med. 2009, 3, e123–e130. [Google Scholar]
- Ouzzani, M.; Hammady, H.; Fedorowicz, Z.; Elmagarmid, A. Rayyan—A web and mobile app for systematic reviews. Syst. Rev. 2016, 5, 210. [Google Scholar] [CrossRef]
- Gierisch, J.M.; Beadles, C.; Shapiro, A.; McDuffie, J.R.; Cunningham, N.; Bradford, D.; Strauss, J.; Callahan, M.; Chen, M.; Hemminger, A.; et al. Health Disparities in Quality Indicators of Healthcare Among Adults with Mental Illness; Department of Veterans Affairs: Washington, DC, USA, 2014. [Google Scholar]
- Aishwarya, S.; Vinodhini, V.M.; Renuka, P.; Anuradha, M.; Arul Saravanan, R. The see-saw effect of neuroactive steroids and endocrine disrupting compounds on maternal mental health status. Neurotoxicology 2025, 108, 48–56. [Google Scholar] [CrossRef]
- Ma, J.; He, W.; Fan, C.; Duan, J.; Wu, J.; Zhang, C.; Peng, Y. The adverse effects of anxiety and depression on pregnant women with hypothyroidism in late pregnancy. Actas Esp. Psiquiatr. 2024, 52, 625–631. [Google Scholar] [CrossRef]
- Wissart, J.; Parshad, O.; Kulkarni, S. Prevalence of pre- and postpartum depression in Jamaican women. BMC Pregnancy Childbirth 2005, 5, 15. [Google Scholar] [CrossRef]
- Bernal, J. Thyroid hormones in brain development and function. In Endotext; Feingold, K.R., Anawalt, B., Boyce, A., Chrousos, G., De Herder, W.P., Dhatariya, K., Eds.; MDText.com: South Dartmouth, MA, USA, 2000; Updated 29 September 2025. [Google Scholar]
- Ritchie, M.; Yeap, B.B. Thyroid hormone: Influences on mood and cognition in adults. Maturitas 2015, 81, 266–275. [Google Scholar] [CrossRef]
- Sileo, F.; Osinga, J.A.J.; Visser, W.E.; Jansen, T.A.; Bramer, W.M.; Derakhshan, A.; Citterio, V.; Tiemeier, H.; Persani, L.; Korevaar, T.I.M. Association of gestational thyroid function and thyroid peroxidase antibody positivity with postpartum depression: A prospective cohort study and systematic literature review with meta-analysis. Eur. J. Endocrinol. 2023, 189, S26–S36. [Google Scholar] [CrossRef]
- Groer, M.W.; El-Badri, N.; Djeu, J.; Williams, S.N.; Kane, B.; Szekeres, K. Suppression of natural killer cell cytotoxicity in postpartum women: Time course and potential mechanisms. Biol. Res. Nurs. 2013, 16, 320–326. [Google Scholar] [CrossRef]
- Minaldi, E.; D’Andrea, S.; Castellini, C.; Martorella, A.; Francavilla, F.; Francavilla, S.; Barbonetti, A. Thyroid autoimmunity and risk of post-partum depression: A systematic review and meta-analysis of longitudinal studies. J. Endocrinol. Investig. 2020, 43, 271–277. [Google Scholar] [CrossRef]
- Le Donne, M.; Mento, C.; Settineri, S.; Antonelli, A.; Benvenga, S. Postpartum mood disorders and thyroid autoimmunity. Front. Endocrinol. 2017, 8, 91. [Google Scholar] [CrossRef]
- Nielsen, C.H.; Brix, T.H.; Leslie, R.G.; Hegedüs, L. A role for autoantibodies in enhancement of pro-inflammatory cytokine responses to a self-antigen, thyroid peroxidase. Clin. Immunol. 2009, 133, 218–227. [Google Scholar] [CrossRef]
- Dutta, I.; Sharma, D. Mothers at risk of postpartum depression and its determinants: A perspective from the urban Jharkhand, India. J. Fam. Med. Prim. Care 2025, 14, 2853–2860. [Google Scholar] [CrossRef]
- Chen, J.; Cross, W.M.; Plummer, V.; Lam, L.; Sun, M.; Qin, C.; Tang, S. The risk factors of antenatal depression: A cross-sectional survey. J. Clin. Nurs. 2019, 28, 3599–3609. [Google Scholar] [CrossRef]
- Kendall-Tackett, K.A. Screening for perinatal depression: Barriers, guidelines, and measurement scales. J. Clin. Med. 2024, 13, 6511. [Google Scholar] [CrossRef]
- Stuart, A.L.; Pasco, J.A.; Jacka, F.N.; Brennan, S.L.; Berk, M.; Williams, L.J. Comparison of self-report and structured clinical interview in the identification of depression. Compr. Psychiatry 2014, 55, 866–869. [Google Scholar] [CrossRef]
- Gorman, L.L.; O’Hara, M.W.; Figueiredo, B.; Hayes, S.; Jacquemain, F.; Kammerer, M.H.; Klier, C.M.; Rosi, S.; Seneviratne, G.; Sutter-Dallay, A.L.; et al. Adaptation of the structured clinical interview for DSM-IV disorders for assessing depression in women during pregnancy and post-partum across countries and cultures. Br. J. Psychiatry 2004, 46, s17–s23. [Google Scholar] [CrossRef]
- Saltukoğlu, G.; Tatar, A. Comparison of the classification ratios of four depression rating scales commonly used in Turkey. Psychiatry Clin. Psychopharmacol. 2017, 27, 76–83. [Google Scholar] [CrossRef][Green Version]


Disclaimer/Publisher’s Note: The statements, opinions and data contained in all publications are solely those of the individual author(s) and contributor(s) and not of MDPI and/or the editor(s). MDPI and/or the editor(s) disclaim responsibility for any injury to people or property resulting from any ideas, methods, instructions or products referred to in the content. |
© 2026 by the authors. Licensee MDPI, Basel, Switzerland. This article is an open access article distributed under the terms and conditions of the Creative Commons Attribution (CC BY) license.