Abstract
The uncontrolled urbanization of soil leads to two main effects: the increase in flood discharges due to changes in permeability capacity and the negative impact in terms of quality on water bodies. These effects can be mitigated by common engineering practices, such as Low Impact Development (LID, which generally involves stormwater treatment devices on a smaller scale rather than centralized solutions); Sustainable Urban Drainage Systems (SUDSs, a range of technologies and techniques used to drain stormwater in a more sustainable manner than conventional solutions); Best Management Practices (BMPs, suggested solutions are more focalized on pollution prevention in urban systems), and more. Among the proposed solutions, detention/retention systems and stormwater ponds can also perform excellent functions with regard to hydraulic hazards and both quantitative and qualitative control of sewer discharge, thanks to stormwater volume accumulation together with the presence of vegetation, when the basin is conceived as a natural-looking lake environment. The use of data-driven approaches could represent an effective approach for the prediction of the characteristics of the sewage tributaries, for the generation of synthetic time series of quantitative/qualitative data of sewer flows or for Real-Time Control (RTC) to reduce overflow at the Waste Water Treatment Plant (WWTP). This work shows the preliminary results obtained by applying NARX neural networks in order to estimate quality indices (the turbidity in this study) in sewer systems. The available data are discharge, temperature, gage height, specific conductivity, and precipitation, whose use as parameters for the recurrent neural network leads to values of R = 0.77–0.80 in the various combinations tested.
1. Introduction
Stormwater runoff pollution has become a key environmental issue in urban areas. Reliable estimation of stormwater pollutant discharge is important for implementing robust water quality management strategies [1].
Data-driven approaches, i.e., the study of huge amounts of data for the purpose of classification or regression problems, with the advancement of technology and the increase in computing capabilities, nowadays are one of the central topics in the world of research. Indeed, in recent years they have been applied to the modelling of natural phenomena in the field of civil engineering, environmental sciences, and hydraulic and hydrological modelling (e.g., [2,3,4]).
These models ensure a higher computational speed without the need to model the physical phenomena [5].
Rajaee et al. [6] provided a comprehensive review of AI (artificial intelligence) models for the prediction of water quality parameters in rivers; research is still very sparse regarding the prediction of sewage quality with such models.
The technical literature contains some of the first studies on issues concerning the application of data-driven approaches to problems related to the prediction of quality data in urban basins. Moeini et al. [7] compared eight Machine Learning (ML) algorithms in order to evaluate the feasibility of these approaches for estimation of Total Suspended Solids (TSS) using the national stormwater quality database (NSQD), while Alias et al. [8] studied the prediction of water quality parameters for constructed wetlands under tropical climates using Artificial Neural Networks (ANNs) and Multiple Linear Regression Analysis (MLRA).
A recurrent neural network (RNN) is a class of artificial neural networks where connections between nodes form a directed or undirected graph along a temporal sequence. This allows it to exhibit temporal dynamic behaviour. Zhang et al. [9] compared three RNN architectures, namely Elman, NARX (Nonlinear AutoRegressive models with eXogenous Inputs), and a novel architecture of neural networks, LSTM (Long Short-Term Memory), for managing sewer in-line storage control to reduce overflow at the wastewater treatment plant (WWTP). Always in the context of real-time management, El Ghazouli et al. [10] developed a model predictive control based on artificial intelligence and the EPA-SWMM model to reduce CSO (Combined Sewer Overflow) impacts on sewer systems. In the context of the latest studies cited, the control is based on the prediction of the sewer flows.
Instead, with this study we analysed the adequacy of the recursive NARX model in the prediction of quality indices for the management of the plants targeted for polluting loads. NARX neural networks are particularly effective in predicting time series of quantities relating to natural phenomena and have so far found a fair application in forecasting problems of hydrological quantities [11]. To the authors’ knowledge, in the literature, there are no studies on quality indices in sewers using NARX-based models.
For this work, continuous measurements of turbidity in sewer channels were used as a quality index of waste water. Indeed, the turbidity is strongly correlated to the concentrations of total suspended solids (TSS), total phosphorus (TP), and chemical oxygen demand (COD) [12,13]. For this aim, the observed time series of an actual drainage channel that is part of the network of sewage systems monitored by USGS (United States Geological Survey) was studied.
2. Materials and Methods
2.1. Study Area and Dataset
The time series of turbidity was measured by the measurement station of a sewer channel of an urban drainage system. The case study is the storm drain at Ludlow Drive, located in Kempsville, a borough in the City of Virginia Beach, Virginia (USA). The measurement station is a part of the USGS monitoring network (site station called USGS 0204306533) for the quantitative and qualitative measurement of the sewer flows. More precisely, the Ludlow Drive station measures and records by means of an electronic data logger with a 5-min time step the following: flow depth, discharge, specific conductance, temperature, and turbidity.
Precipitation data were not recorded for this site, so they were retrieved from the USGS Tidal stream site Thalia Creek station (USGS 0204291317), about 6 km from the main site. Data were collected by a tipping bucket rain gauge and electronic data logger with 6-min record intervals.
A brief summary of site characteristics and locations is available in Table 1, while Figure 1 shows the location of the rain gage with respect to the sewer system, and Figure 2 gives a view of the overall urban basin.

Table 1.
Summary of USGS site data retrieved for this study.
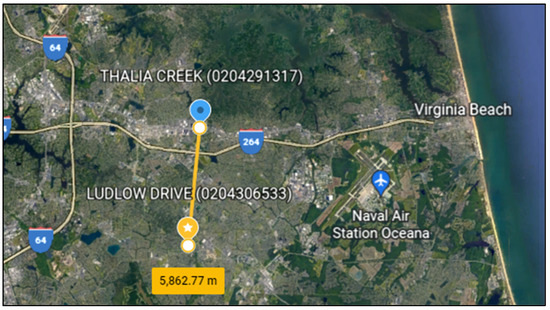
Figure 1.
Location of USGS stations with mutual distance (Google Earth view).
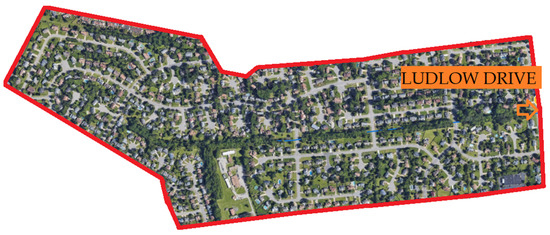
Figure 2.
Drainage area of Ludlow Drive USGS Station.
2.2. NARX Model Architectures
NARX neural networks are a particular type of recurrent dynamic ANN network commonly used for time series modeling, composed of interconnected nodes inspired by the biological neural system. Indeed, they represent artificial neurons that receive one or more inputs and elaborate them, passing through a nonlinear activation function, to produce an output. The defining equation for the NARX model is:
where x(t) and y(t) are respectively the input and output variables at time t, and f is the nonlinear function. The NARX architecture contains 3 sequential layers (Figure 3): the input layer contains the input parameters, and the hidden layer represents the computational step between the input and output layer, which gives rise to the expected value at the next time step y(t + 1). For the hidden layer, a sigmoid activation function f1 was used, and for the output layer, a linear activation function f2 with one neuron was used. Terms id (input delay) and fd (feedback delay) are the input-memory and output-memory orders.
y(t) = f [y(t − 1), …, y(t − fd), x(t − 1),…, x(t − id)]
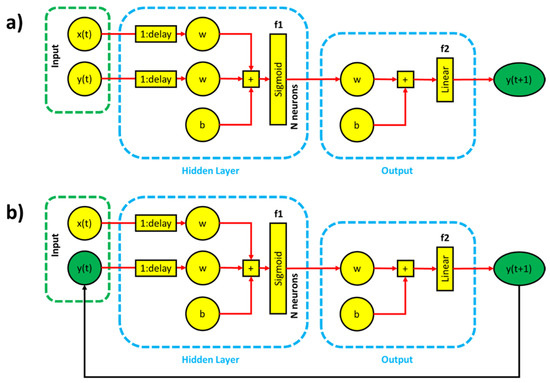
Figure 3.
NARX model architecture: series–parallel architecture (a); parallel architecture (b).
NARX neural networks are highly efficient in simulating complex stochastic phenomena: they have been used in different application types, as a predictor for the next values of a time series and the nonlinear noise filtering of input signals [14].
In technical literature, two different types of NARX neural network architecture have been proposed [15]:
- A series-parallel architecture (Figure 3a), where the network uses the actual precedent target values, which are measured values; the system tries to use them [ymeas(t − 1),…, ymeas(t − fd)], together with the input sequence [x(t − 1),…, x(t − id)] in calculating the output at the next time step [y(t)]. Such architecture is effective for forecasting one time step ahead in a time series;
- A parallel architecture (Figure 3b) is based on using the sequence of the values calculated in previous time steps of the neural network [y(t − 1),…, y(t − fd)] instead of the real measured target values [ymeas(t − 1),…, ymeas(t − fd)]; in fact, estimated outputs are fed back and included in the output’s regressor in calculating the output for the next time step [y(t)]. The parallel architecture of this network is used for predicting the output values for multiple time steps ahead.
2.3. Data Processing
2.3.1. Time Series Preprocessing: Management of Missing Values
KNIME, the Konstanz Information Miner [16], is a free and open-source data analytics, reporting, and integration platform that can be used to perform almost any kind of analysis [17].
The different time series data (discharge, turbidity, etc.) acquired from the USGS site were herein joined together after a first preprocessing, which mainly consisted of the removal of any duplicates of rows and in the addition of rows with interpolated values for missing time steps; at the end of the flow (Figure 4), a complete table of values is obtained for each time step of the recorded period.
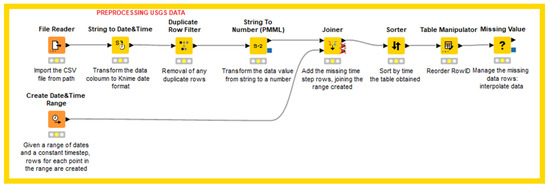
Figure 4.
KNIME node architecture used for USGS time series data preprocessing.
2.3.2. Rain Events and ADP Identifying
The rain time series was preprocessed in order to define the precipitation clusters, because it was relevant for the prediction analysis to define the time between two successive rain clusters.
The criteria proposed in the literature by means of the use of a Minimum Inter-event Time (MIT) for the separation of point precipitation records into statistically independent storms [18,19,20] are different, where MIT is defined as the minimum period without rain before the next independent rainfall event.
In this study, the approach used is based on the aforementioned MIT and on the ap-plication of a minimum threshold of the total volume of precipitation, which must be exceeded to classify the rainy event; in addition, in the algorithm developed, it is possible to set up an additional threshold on the single value of rainfall impulse (which represents the average intensity in the single time interval), below which it is not classified as rain.
To set threshold values, reasoning based, for example, on the Curve Number (CN) method can be conducted; in fact, based on a value of the CN, depending on the land use and on soil characteristics (and therefore on the ability of the same to retain water), the minimum amount of precipitation that needs to fall to form a runoff can be estimated.
Therefore, in this study, an MIT is defined when these three events occur: no rain for at least 12 h; minimum rainfall total volume equal to 2 mm; minimum rainfall impulse equal to 0.3 mm.
After identifying independent rain events, it was possible to calculate the antecedent dry period (ADP) characterizing each event, adding it to the dataset.
Calculating the ADP is considered extremely important for the prediction of quality indices of the sewer flows, as it represents one of the main parameters of the phenomenon of the build-up of solids on the catchment surface [21,22], which feeds the first flush.
3. Results and Discussion
This section shows the results obtained by applying the NARX neural network (in a series–parallel architecture) in relation to the different sets considered as input parameters, showing the related prediction performances, represented below:
- Normalized Mean Square Error, NMSE (Equation (2)), where is the mean of measured target values;
- Correlation Coefficient, R (Equation (3)).
The dataset for the NARX application was obtained after the search for independent events, as mentioned in the previous paragraphs, focusing only on the records of rainy events and interspersing them with a number of time steps equal to the delays considered in the model, so that during the training process, the prediction of the initial values of a given event is independent and not influenced by the queue of the previous event.
The delay value set is equal to two time steps, and 85% of the events are included in the training set, while the remaining 15% in the testing set. Tested combinations and relative results are summarized in Table 2. The performances shown are the average value over 10 simulations performed for each set.
Table 2.
Tested parameter combinations and relative performance indicators NMSE and R.
Figure 5 shows the time series forecasting and the measured values for two events (14-04-2021 and 02-06-2021) included in the testing set.
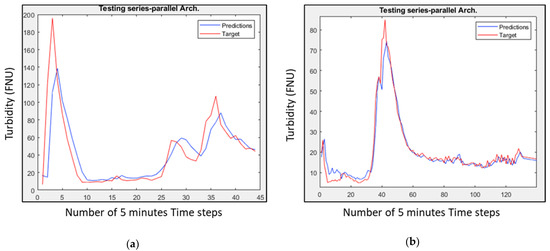
Figure 5.
NARX neural network in a series–parallel architecture: in red, measured values; in blue, forecasting values. (a) Turbidity forecast of 14-04-2021 rainy event; (b) turbidity forecast of 02-06-2021 rainy event.
Through the series–parallel architecture that NARX studied, in the context of turbidity prediction, it was not possible to appreciate significant differences in performance between the different input sets tested, which were approximately similar. Preliminary results show that NARX could be a useful and applicable tool also for quality data in sewer networks, for real-time control of a treatment plant.
For example, an interesting application could be to predict significant points of the incoming pollutogram with sufficient advance notice, so as to optimize the management of the first flush water entering the WWTP and therefore manage the polluting loads.
In-depth studies in this sense will be carried out in the future, together with a critical analysis of the input parameters in order to forecast events, this time using a NARX in a parallel architecture configuration.
Other future considerations may concern the performance of these models in relation to the size of the urban water basin and therefore to its retention capacity, which are believed to play an important role in the prediction of the studied phenomena in these models.
Author Contributions
Conceptualization, data research and analysis and writing by A.G. Supervision and writing-review by R.G., F.D.N. and F.G. All authors have read and agreed to the published version of the manuscript.
Funding
This research received no external funding.
Institutional Review Board Statement
Not applicable.
Informed Consent Statement
Not applicable.
Data Availability Statement
The data used in the study are made available on the “USGS Water Data for USA” tool (https://waterdata.usgs.gov/nwis?).
Acknowledgments
The time series herein analyzed are part of the database of the United States Geological Survey Agency.
Conflicts of Interest
The authors declare no conflict of interest.
Abbreviations
| ADP | Antecedent Dry Period |
| AI | Artificial intelligence |
| ANN | Artificial Neural Network |
| BMPs | Best Management Practices |
| CN | Curve Number |
| COD | Chemical Oxygen Demand |
| CSOs | Combined Sewer Overflows |
| FNUs | Formazin Nephelometric Units |
| LID | Low Impact Development |
| LSTM | Long Short-Term Memory |
| MIT | Minimum Inter-event Time |
| ML | Machine Learning |
| MLRA | Multiple Linear Regressions Analysis |
| NARX | Nonlinear AutoRegressive models with eXogenous Inputs |
| NMSE | Normalized Mean Square Error |
| NSQD | National Stormwater Quality Database |
| R | Correlation Coefficient |
| RNN | Recurrent Neural Network |
| RTC | Real Time Control |
| SUDSs | Sustainable Urban Drainage Systems |
| TP | Total Phosphorus |
| TSS | Total Suspended Solids |
| USGS | United States Geological Survey |
| WWTP | Waste Water Treatment Plant |
References
- Perera, T.; McGree, J.; Egodawatta, P.; Jinadasa, K.B.S.N.; Goonetilleke, A. A Bayesian approach to model the trends and variability in urban stormwater quality associated with catchment and hydrologic parameters. Water Res. 2021, 197, 117076. [Google Scholar] [CrossRef] [PubMed]
- Chanklan, R.; Kaoungku, N.; Suksut, K.; Kerdprasop, K.; Kerdprasop, N. Runoff prediction with a combined artificial neural network and support vector regression. Int. J. Mach. Learn. Comput. 2018, 8, 39–43. [Google Scholar] [CrossRef]
- Granata, F.; Gargano, R.; de Marinis, G. Support Vector Regression for Rainfall-Runoff Modeling in Urban Drainage: A Comparison with the EPA’s Storm Water Management Model. Water 2016, 8, 69. [Google Scholar] [CrossRef]
- Granata, F.; Saroli, M.; de Marinis, G.; Gargano, R. Machine learning models for spring discharge forecasting. Geofluids 2018, 2018, 8328167. [Google Scholar] [CrossRef]
- di Nunno, F.; Race, M.; Granata, F. A nonlinear autoregressive exogenous (NARX) model to predict nitrate concentration in rivers. Environ. Sci. Pollut. Res. 2021, 29, 40623–40642. [Google Scholar] [CrossRef]
- Rajaee, T.; Khani, S.; Ravansalar, M. Artificial intelligence-based single and hybrid models for prediction of water quality in rivers: A review. Chemom. Intell. Lab. Syst. 2020, 200, 103978. [Google Scholar] [CrossRef]
- Moeini, M.; Shojaeizadeh, A.; Geza, M. Supervised Machine Learning for Estimation of Total Suspended Solids in Urban Watersheds. Water 2021, 13, 147. [Google Scholar] [CrossRef]
- Alias, R.; Asmaliza, N.; Noor, M.; Sidek, L.M.; Kasa, A. Prediction of Water Quality for Free Water Surface Constructed Wetland Using ANN and MLRA. Civ. Eng. Archit. 2021, 9, 1365–1375. [Google Scholar] [CrossRef]
- Zhang, D.; Martinez, N.; Lindholm, G.; Ratnaweera, H. Manage Sewer In-Line Storage Control Using Hydraulic Model and Recurrent Neural Network. Water Resour. Manag. 2018, 32, 2079–2098. [Google Scholar] [CrossRef]
- el Ghazouli, K.; el Khatabi, J.; Soulhi, A.; Shahrour, I. Model predictive control based on artificial intelligence and EPA-SWMM model to reduce CSOs impacts in sewer systems. Water Sci. Technol. 2022, 85, 398–408. [Google Scholar] [CrossRef]
- di Nunno, F.; Granata, F.; Gargano, R.; de Marinis, G. Forecasting of Extreme Storm Tide Events Using NARX Neural Network-Based Models. Atmos 2021, 12, 512. [Google Scholar] [CrossRef]
- Hannouche, A.; Chebbo, G.; Ruban, G.; Tassin, B.; Lemaire, B.J.; Joannis, C. Relationship between turbidity and total suspended solids concentration within a combined sewer system. Water Sci. Technol. 2011, 64, 2445–2452. [Google Scholar] [CrossRef] [PubMed]
- Liu, Y.; Hou, L.; Bian, W.; Zhou, B.; Liang, D.; Li, J. Turbidity in Combined Sewer Sewage: An Identification of Stormwater Detention Tanks. Int. J. Environ. Res. Public Health 2020, 17, 3053. [Google Scholar] [CrossRef]
- Abou Rjeily, Y.; Abbas, O.; Sadek, M.; Shahrour, I.; Hage Chehade, F. Flood forecasting within urban drainage systems using NARX neural network. Water Sci. Technol. 2017, 76, 2401–2412. [Google Scholar] [CrossRef] [PubMed]
- Menezes, J.M.P.; Barreto, G.A. Long-term time series prediction with the NARX network: An empirical evaluation. Neurocomputing 2008, 71, 3335–3343. [Google Scholar] [CrossRef]
- Berthold, M.R.; Cebron, N.; Dill, F.; Gabriel, T.R.; Kötter, T.; Meinl, T.; Ohl, P.; Thiel, K.; Wiswedel, B. KNIME—The Konstanz information miner. ACM SIGKDD Explor. Newsl. 2009, 11, 26–31. [Google Scholar] [CrossRef]
- Pynam, V.; Spanadna, R.R.; Srikanth, K. An Extensive Study of Data Analysis Tools (Rapid Miner, Weka, R Tool, Knime, Orange). SSRG Int. J. Comput. Sci. Eng. 2018, 5, 4–11. [Google Scholar] [CrossRef]
- Brasil, J.B.; Guerreiro, M.S.; de Andrade, E.M.; Palácio, H.A.d.; Medeiros, P.H.A.; Filho, J.C.R. Minimum Rainfall Inter-Event Time to Separate Rainfall Events in a Low Latitude Semi-Arid Environment. Sustainability 2022, 14, 1721. [Google Scholar] [CrossRef]
- Restrepo-Posada, P.J.; Eagleson, P.S. Identification of independent rainstorms. J. Hydrol. 1982, 55, 303–319. [Google Scholar] [CrossRef]
- Pampaloni, M.; Sordo-Ward, A.; Bianucci, P.; Gabriel-Martin, I.; Caporali, E.; Garrote, L. A Stochastic Procedure for Temporal Disaggregation of Daily Rainfall Data in SuDS Design. Water 2021, 13, 403. [Google Scholar] [CrossRef]
- Alley, W.M.; Smith, P.E. Estimation of accumulation parameters for urban runoff quality modeling. Water Resour. Res. 1981, 17, 1657–1664. [Google Scholar] [CrossRef]
- Papiri, S.; Todeschini, S.; Valcher, P. Pollution in Stormwater Runoff in a Highway Toll Gate Area. In Proceedings of the 11th International Conference on Urban Drainage, Edinburgh, UK, 31 August–5 September 2008. [Google Scholar]


Publisher’s Note: MDPI stays neutral with regard to jurisdictional claims in published maps and institutional affiliations. |
© 2022 by the authors. Licensee MDPI, Basel, Switzerland. This article is an open access article distributed under the terms and conditions of the Creative Commons Attribution (CC BY) license (https://creativecommons.org/licenses/by/4.0/).