Abstract
Soil erosion poses a significant global environmental challenge, causing land degradation, deforestation, river siltation, and reduced agricultural productivity. Although the Revised Universal Soil Loss Equation (RUSLE) has been widely applied in Brazil, its use in the tropical river basins of the Amazon remains limited. This study aimed to apply a GIS-integrated RUSLE model and compare its soil loss estimates with multiple linear regression (MLR) models based on terrain attributes, aiming to identify priority areas and key geomorphometric drivers of soil erosion in a tropical Amazonian river basin. A digital elevation model based on Shuttle Radar Topography Mission (SRTM) data, land use and land cover (LULC) maps, and rainfall and soil data were applied to the GIS-integrated RUSLE model; we then defined six risk classes—slight (0–2.5 t ha−1 yr−1), slight–moderate (2.5–5), moderate (5–10), moderate–high (10–15), high (15–25), and very high (>25)—and identified priority zones as those in the top two risk classes. The Caeté River Basin (CRB) was classified into six erosion risk categories: low (81.14%), low to moderate (2.97%), moderate (11.88%), moderate to high (0.93%), high (0.03%), and very high (3.05%). The CRB predominantly exhibited a low erosion risk, with higher erosion rates linked to intense rainfall, gentle slopes covered by Arenosols, and human activities. The average annual soil loss was estimated at 2.0 t ha−1 yr−1, with a total loss of 1005.44 t ha−1 yr−1. Additionally, geomorphological and multiple linear regression (MLR) analyses identified seven key variables influencing soil erosion: the convergence index, closed depressions, the topographic wetness index, the channel network distance, and the local curvature, upslope curvature, and local downslope curvature. These variables collectively explained 26% of the variability in soil loss (R2 = 0.26), highlighting the significant role of terrain characteristics in erosion processes. These findings indicate that soil erosion control efforts should focus primarily on areas with Arenosols and regions experiencing increased anthropogenic activity, where the erosion risks are higher. The identification of priority erosion areas enables the development of targeted conservation strategies, particularly for Arenosols and regions under anthropogenic pressure, where the soil losses exceed the tolerance threshold of 10.48 t ha−1 yr−1. These findings directly support the formulation of local environmental policies aimed at mitigating soil degradation by stabilizing vulnerable soils, regulating high-impact land uses, and promoting sustainable practices in critical zones. The GIS-RUSLE framework is supported by consistent rainfall data, as verified by a double mass curve analysis (R2 ranging from 0.64 to 0.77), and offers a replicable methodology for soil conservation planning in tropical basins with similar erosion drivers. This approach offers a science-based foundation to guide soil conservation planning in tropical basins. While effective in identifying erosion-prone areas, it should be complemented in future studies by dynamic models and temporal analyses to better capture the complex erosion processes and land use change impacts in the Amazon.
1. Introduction
Soil erosion is a form of soil degradation that is a major threat to soil worldwide. It causes an annual soil loss of over 36 billion tons [1,2]. Moreover, it has a negative impact on fresh water and the oceans [2]. The estimation and mapping of soil loss are important tools for soil conservation. Soil loss by water erosion is a major cause of environmental degradation in the northern region of Brazil [3] and leads to significant negative impacts on Amazonian ecosystems, including water resources used in agricultural production, carbon stocks, cultural heritage, and biodiversity [4], as well as downstream irrigation systems and reservoir sedimentation [5,6], which in turn may lead to a variety of environmental and socioeconomic problems [7]. Land degradation due to overexploitation aggravates soil erosion [8].
Recent studies have addressed soil erosion processes in the Amazon biome, applying models such as the Revised Universal Soil Loss Equation (RUSLE) integrated with GIS. Barbosa and Fearnside [9] investigated erosion in the Apiaú region of Roraima, highlighting the fragility of Amazonian soils under anthropogenic pressure. Duarte et al. [10] used RUSLE in the Juma watershed, Southern Amazonas, demonstrating the model’s sensitivity to land use changes. Riquetti et al. [11] assessed the erosion dynamics over six decades of deforestation in the Amazon basin, revealing significant spatial patterns related to agricultural expansion. Similarly, Fonseca and Silva Filho [12] employed logistic regression for erosion susceptibility mapping in the Southern Amazon. These efforts reflect increasing concern over soil degradation in the region, but there is still a lack of detailed, spatially explicit assessments in the Eastern Amazon, particularly in the state of Pará. The present study addresses this gap by applying the RUSLE model in the Caeté River Basin, aiming to support conservation planning in a poorly studied tropical landscape.
Widely adopted strategies for soil conservation include mapping, monitoring, and prioritizing areas that are more susceptible to erosion [13,14,15]. However, identifying priority areas for the control of soil erosion is a complex task that requires qualitative assessment methods [13]. According to Ebabu et al. [7] and Wang et al. [16], the main criteria for the identification of priority areas are soil protection, land use, and land management practices. The segmentation of land surfaces based on physical geomorphometry, as proposed by Minár et al. [17], provides a robust framework for an understanding of terrain characteristics and their influence on erosion processes. Their approach emphasizes the importance of elementary land surface segmentation and digital geomorphological mapping in identifying areas prone to erosion, which aligns with the need for detailed spatial analysis in soil conservation [17,18].
Soil erosion risk mapping can provide a basis for the development of a management plan for the mitigation of erosion [19], and various studies have investigated this technique [20,21,22]. Several models can be used to assess the soil erosion risk based on factors such as anthropogenic activity [23], nutrient loss [24,25], the spatial and temporal evolution of the soil erosion risk [26], vegetation cover and slope [27], and climate changes [17]. The Revised Universal Soil Loss Equation (RUSLE) has become one of the most widely used models for the estimation of soil erosion under diverse land use and environmental conditions due to its simplicity, flexibility, and compatibility with GIS applications [28,29]. In Brazil, RUSLE has been increasingly used in tropical regions; however, few applications have focused specifically on the Amazon biome, particularly those incorporating detailed terrain variables to explain the erosion dynamics. Despite its widespread use in empirical and modeling studies under diverse environmental and land use conditions [28,29], the integration of RUSLE with topographic analysis remains limited in the Amazon region.
The RUSLE model has emerged as a predominant, adaptable, simple, and minimally data-intensive approach to predicting the spatial distribution of soil erosion [8,21,30,31]. The RUSLE model considers the factors that can lead to soil erosion. Combined with geographic information systems (GIS) technology [32], it is an efficient quantitative assessment method to estimate soil erosion in a small-scale river basin [33,34,35]. The GIS-integrated RUSLE model includes data from different geographic and climatic conditions, leading to more accurate results [36]. The river basin is the most basic socioeconomic unit, with a geomorphic system that is independent to some extent. In soil and water conservation (SWC), a river basin generally refers to a complete unit of soil erosion, which can be operated as an ecological economic system.
While several studies have applied RUSLE in Brazil to estimate the soil erosion risk, few studies have been conducted in the Amazon [11], especially those integrating geomorphometric terrain attributes with the RUSLE model. Most studies in the region have applied the traditional RUSLE model, without exploring how topographic features influence erosion patterns. This study advances the state of the art by using multiple linear regression (MLR) and provides a novel approach to understanding the interactions between terrain characteristics and erosion patterns. This integration of terrain attributes with the RUSLE model helps to fill a crucial gap in the understanding of the soil erosion dynamics in tropical basins—specifically in the Eastern Amazon region. This approach can support the more informed prioritization of erosion control areas by linking terrain metrics to the soil loss intensity.
Assessing the soil erosion risk in a river basin requires a coupled human–environment system that considers socioeconomic characteristics, vulnerability, sensitivity, and adaptive capacity. Therefore, this study aims to (i) to identify the key terrain characteristics that significantly influence erosion patterns with a multiple linear regression (MLR) approach and (ii) to estimate the soil loss using a GIS-integrated RUSLE model and map priority areas for soil conservation in the Caeté River Basin.
2. Materials and Methods
2.1. Study Area
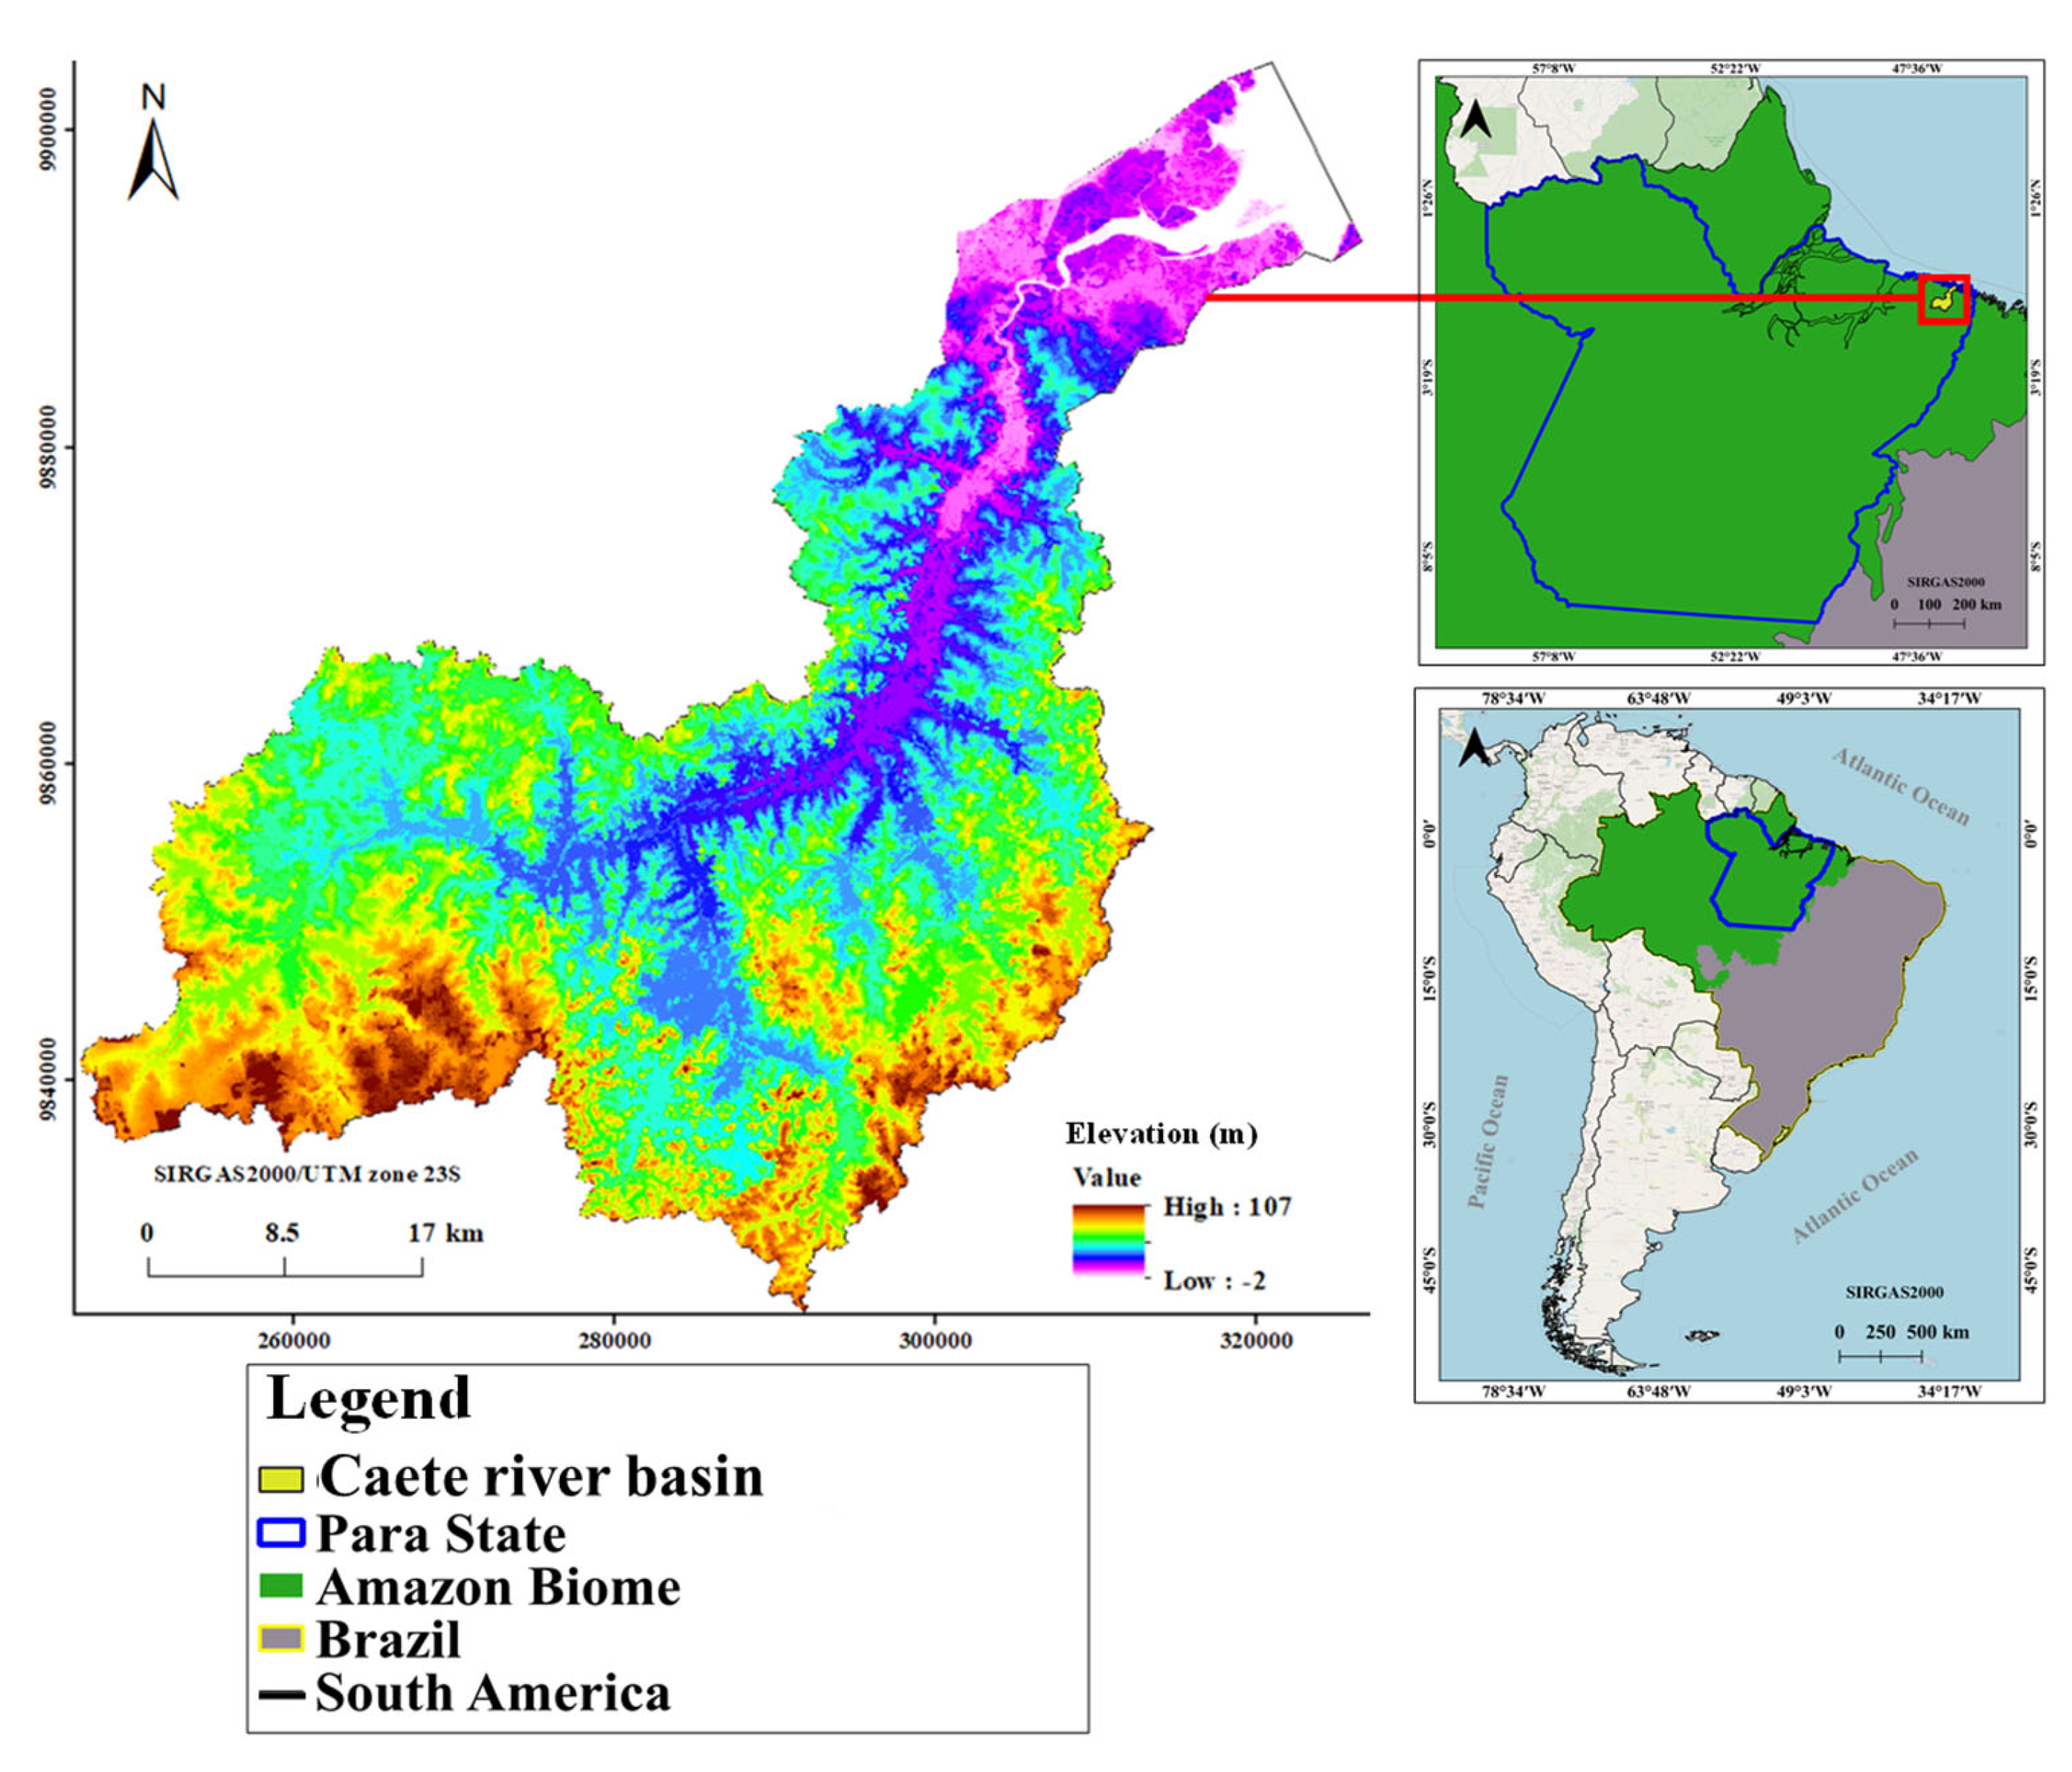
The Caeté River Basin (CRB) is located in the northern region of Brazil, in the northeastern part of Pará State, between 1°01′19.7″ S and 46°45′48.4″ W, encompassing an area of 2195 km2 (Figure 1). The soils were initially classified using the Brazilian Soil Classification System (SiBCS) and then harmonized with the World Reference Base for Soil Resources (WRB/FAO) as follows: Argissolo Vermelho-Amarelo (PVA) as Acrisols; Gleissolo Sálico (GZ) as Solonchaks; Latossolo Amarelo (LA) as Ferralsols; Neossolo Quartzarênico (RQ) as Arenosols; and Plintossolo Háplico (FX) as Plinthosols [35]. The river basin vegetation includes secondary vegetation, lowland or igapó forests, and mangroves [36]. According to the Köppen climate classification, the region has a tropical monsoon climate (Am). The CRB receives average annual rainfall of approximately 2385 mm and has a mean annual temperature of 26 °C, with a typical annual temperature range of 5 °C.

Figure 1.
Map-based localization of Caeté River Basin (CRB) in North of Brazil, Northwestern Amazon biome.
2.2. Study Data
Information on land use from 2014 was collected from the TerraClass project [37]. The soil data were converted into a raster image based on vector images of published maps in the shapefile format. The digital elevation model (DEM) was downloaded from the United States Geological Survey’s (USGS) Shuttle Radar Topography Mission (SRTM) of 1-arc-second global elevation data with a 30 × 30 m resolution. Then, the DEM was optimized to obtain a hydrologically consistent digital elevation model (HCDEM). Using the software QGIS version 3.22, mosaics of the scenes were merged to generate a single image.
Erodibility, erosivity, and land use maps were created based on pedology, precipitation, and C factor mapping (vegetation and management) data, respectively. These data layers were converted into a raster layer (GeoTIFF) to create a map algebra framework for the GIS-integrated RUSLE model. The results were obtained by applying the raster images to the GIS-integrated RUSLE model and adapting them to RUSLE (see R, K, LS, and C in Figure 2). The QGIS version 3.22 software was used to apply the data to the RUSLE model and obtain soil erosion data.
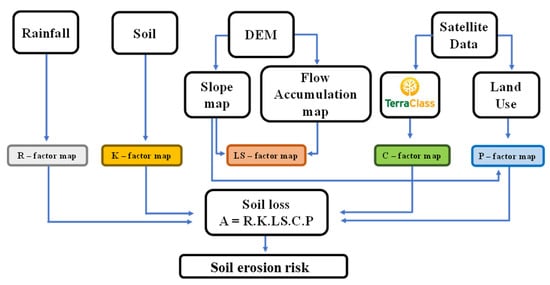
Figure 2.
Flowchart of the integrated method of this study.
2.3. Geomorphological and Multiple Linear Regression Analysis
The geomorphological and geomorphometric variables were derived from a high-resolution digital elevation model (DEM) to assess their influences on the soil erosion dynamics. These variables included the aspect, plan curvature, profile curvature, convergence index, closed depressions, topographic wetness index, channel network distance, valley depth, relative slope, topographic position index, local curvature, upslope curvature, local upslope curvature, downslope curvature, and local downslope curvature. These parameters were selected based on their established relevance in characterizing terrain morphologies and their potential to influence soil erosion processes [32,33]. The dependent variable in this analysis was the A factor, representing soil loss, as calculated by the Revised Universal Soil Loss Equation (RUSLE) [1].
To quantify the relationship between the geomorphometric variables and soil loss, a multiple linear regression (MLR) analysis was employed. The general form of the MLR model is expressed as
where A is the dependent variable (soil loss, A factor); β1, β2,…, βn are the regression coefficients for the independent variables; X1, X2,…, Xn represent the geomorphometric variables; and ϵ is the error term.
A = β0 + β1 X1 + β2 X2 + ⋯ + βn Xn + ϵ
The stepwise selection method was applied to identify the most significant variables contributing to the model’s predictive power. This iterative process added or removed variables based on their statistical significance (p < 0.05) and their contributions to the coefficient of determination (R2). The stepwise approach ensured that only variables with meaningful explanatory power were retained, reducing multicollinearity and improving model parsimony [1,31]. The final MLR model was evaluated based on its adjusted R2 value, which accounts for the number of predictors and avoids overfitting.
The use of digital elevation models (DEMs) and spatial analysis techniques, such as MLR, highlights the importance of integrating modern technologies (geoprocessing, remote sensing, and statistics) as an interdisciplinary approach, which is essential in addressing the challenges of sustainable natural resource management [31,38,39,40].
2.4. Soil Erosion Modeling by RUSLE Model
The results were obtained by generating thematic maps as GeoTIFF raster images, which depicted the USLE factors that were adapted to the RUSLE model. The average annual soil loss in the CRB was calculated using Equation (2) [41], and the data were processed as detailed in Figure 2. Soil loss estimates were evaluated against Amazon-specific tolerance thresholds (T) derived from Nunes et al. [42], an adaptation of Wischmeier and Smith [41]. The RUSLE model has been used as a cost-effective and efficient data prediction tool that can be applied to both forested and agricultural river basins [38]. These thresholds account for the following:
where A: estimated average soil loss in tons per hectares (t ha−1 yr−1); R: rainfall–runoff erosivity factor (MJ mm ha−1 h−1 yr−1); K: soil erodibility factor (t ha h ha−1 MJ−1 mm−1); L: slope length factor (dimensionless); S: slope steepness factor (dimensionless); C: cover management factor (dimensionless); P: conservation practices factor (dimensionless).
Wischmeier and Smith [41] defined the erosivity index (EI30) as the product of the kinetic energy (E) of heavy rainfall at its maximum intensity (I) during a 30 min period. The R factor results from the average of the annual E × I value over a minimum period of 20 years.
2.4.1. Rainfall Erosivity Factor (R)
We obtained the rainfall erosivity factor (R) and rainfall station coordinates from the National Institute of Meteorology (INMET), which contains 17 years of precipitation data (from 2003 to 2020) [43]. Precipitation data were collected from the cities that border the CRB: Bragança, Capitão Poço, Marabá, Paragominas, Rondon do Pará, Salinópolis, Soure, Tomé Açú, and Tucuruí. Accumulated rainfall values were obtained from neighboring weather stations and then plotted. The consistency of the rainfall data was tested using the double mass curve method. Finally, the data were compared using the coefficient of determination (R2).
The R factor was determined according to the mathematical estimation provided by Bertoni and Lombardi [28] for monthly averaged data (Equation (3)):
where EI is the monthly average of the estimated erosion index (MJ mm ha−1 h−1 yr−1); r is the average monthly precipitation (mm); and p is the average annual accumulated precipitation (mm). The R factor results from each station were organized into a grid format within a raster layer using a spline interpolation method, creating a spatial representation of the CRB.
2.4.2. Soil Erodibility Factor (K)
The soil erodibility factor (K) was derived from the national soil map of Brazil, classified according to the Brazilian Soil Classification System (SiBCS) [35], and harmonized with the World Reference Base for Soil Resources (WRB/FAO) for international comparability. The soil data layer, originally at a 1:5,000,000 scale, was converted from vector to raster format (GeoTIFF), and K factor values were assigned to each soil class based on the estimates provided by Carvalho Filho et al. [44] and Farinasso et al. [14] (Table 1).

Table 1.
Classification of soils in the study area and their estimated K factor values.
2.4.3. Topographic Factor (LS)
Based on the hydrographically conditioned digital elevation model (HCDEM), the slope factor (S) was calculated in terms of the area percentage (%). The basin slope length (L)—where the slope length is defined as the horizontal distance from where the surface flow originates to the point where deposition begins or where the flow reaches a defined channel [15]—as well as the flow directions and flow accumulation were calculated using the hydrological modules of the open-source software QGIS version 3.22 and GRASS GIS version 8.4.1 [46,47] (Equations (4)–(6)):
The L factor of the contributory drainage area was calculated according to Desmet and Govers [32] (Equation (7)):
where λ is the slope length in meters (m); m is the exponent of the slope length; β is the angle of inclination; L is the slope length factor; A(i,j) [m] is the unit contribution area at the input of a pixel (cell); D is the pixel size; and x is the correction factor of form. The slope factor (S) was calculated according to the equation proposed by McCool et al. [48,49], considering the ratio of the rill and interrill erosion. When applying the formula in the raster calculator, the angle must be converted into radians (1 sexagesimal grad = 0.01745 radians), so that it can be multiplied by the other components of the equation (Equation (8)).
This equation is used to compute the slope factor (S), which represents the influence of the terrain inclination on soil erosion.
Here, S(i,j) is the slope factor for the grid cell (i,j), indicating the contribution of the terrain slope to soil erosion, and β(i,j) is the tangent of the slope angle, representing the steepness of the surface. It is based on the following conditional expressions:
If tan β(i,j) < 0.09, the equation applies a coefficient of 10.8 for sin(β) and adds a constant value of 0.03;
If tan β(i,j) ≥ 0.09, the equation adopts a coefficient of 16.8 for sin(β) and subtracts a factor of 0.5.
Finally, the topographic factor (LS) was calculated using the equation proposed by Moore and Burch [33] (Equation (9)):
where LS is topographic factor that quantifies the influence of the slope length and steepness on the soil erosion rates. As is the catchment area (flow accumulation). θ is the slope angle (in radians), which corresponds to the terrain steepness, and 22.13 is the reference slope length (in meters), used as a standard in erosion modeling. Meanwhile, 0.0896 is the reference value for sin(θ), equivalent to a slope angle of approximately 5.14°, and m and n are empirical coefficients that represent the relative contributions of the slope length and slope steepness to soil erosion, respectively.
2.4.4. Cover Management Factor (C Factor)
Table 2 shows the cover management factors derived from the practices that occur in the river basin. It is based on the land use and occupation map obtained from the TerraClass project developed by the National Institute for Space Research (INPE) [37]. The land-use class vectors are from 2014.
Table 2.
Values of RUSLE C and P factors for different land cover types in the Caeté River Basin.
2.4.5. Conservation Support Practice Factor (P Factor)
Table 2 shows the P factor, which refers to the relationship between soil loss in agricultural soil under a given support practice and the corresponding loss caused by uphill and downhill cultivation [1]. Soil support practices (P) can also reduce erosion processes. Therefore, the soil loss values vary according to the management practices [50]. A value of 1.0 was applied to all areas, since no erosion control practices were occurring in the basin, according to the procedure adapted by Ozcan et al. [51]. No management and conservation practices were identified in the satellite images.
2.4.6. Identification of Priority Areas for Erosion Control
The identification of priority areas for erosion control was based on the spatial distribution of the annual soil loss (A factor) estimated by the GIS-integrated RUSLE model. Erosion values were reclassified into six risk categories using thresholds adapted from Beskow et al. [1]: slight (0–2.5 t ha−1 yr−1), slight to moderate (2.5–5 t ha−1 yr−1), moderate (5–10 t ha−1 yr−1), moderate to high (10–15 t ha−1 yr−1), high (15–25 t ha−1 yr−1), and very high (>25 t ha−1 yr−1).
To support soil conservation planning, areas classified under the moderate to very high erosion risk categories—representing the most critical zones in terms of soil loss—were designated as priority areas for erosion control interventions. These priority areas are more susceptible to accelerated soil degradation, frequently associated with human-induced land use changes and sandy soils and subject to agricultural expansion or mining activities across the basin [22,52].
This classification enabled the delineation of critical zones requiring urgent conservation actions. The resulting erosion risk classification provides a thematic map of the priority areas within the CRB, offering valuable input for policymakers, local authorities, and stakeholders implementing targeted soil and water conservation strategies.
3. Results
3.1. Soil Erosion Explained by Terrain Variables
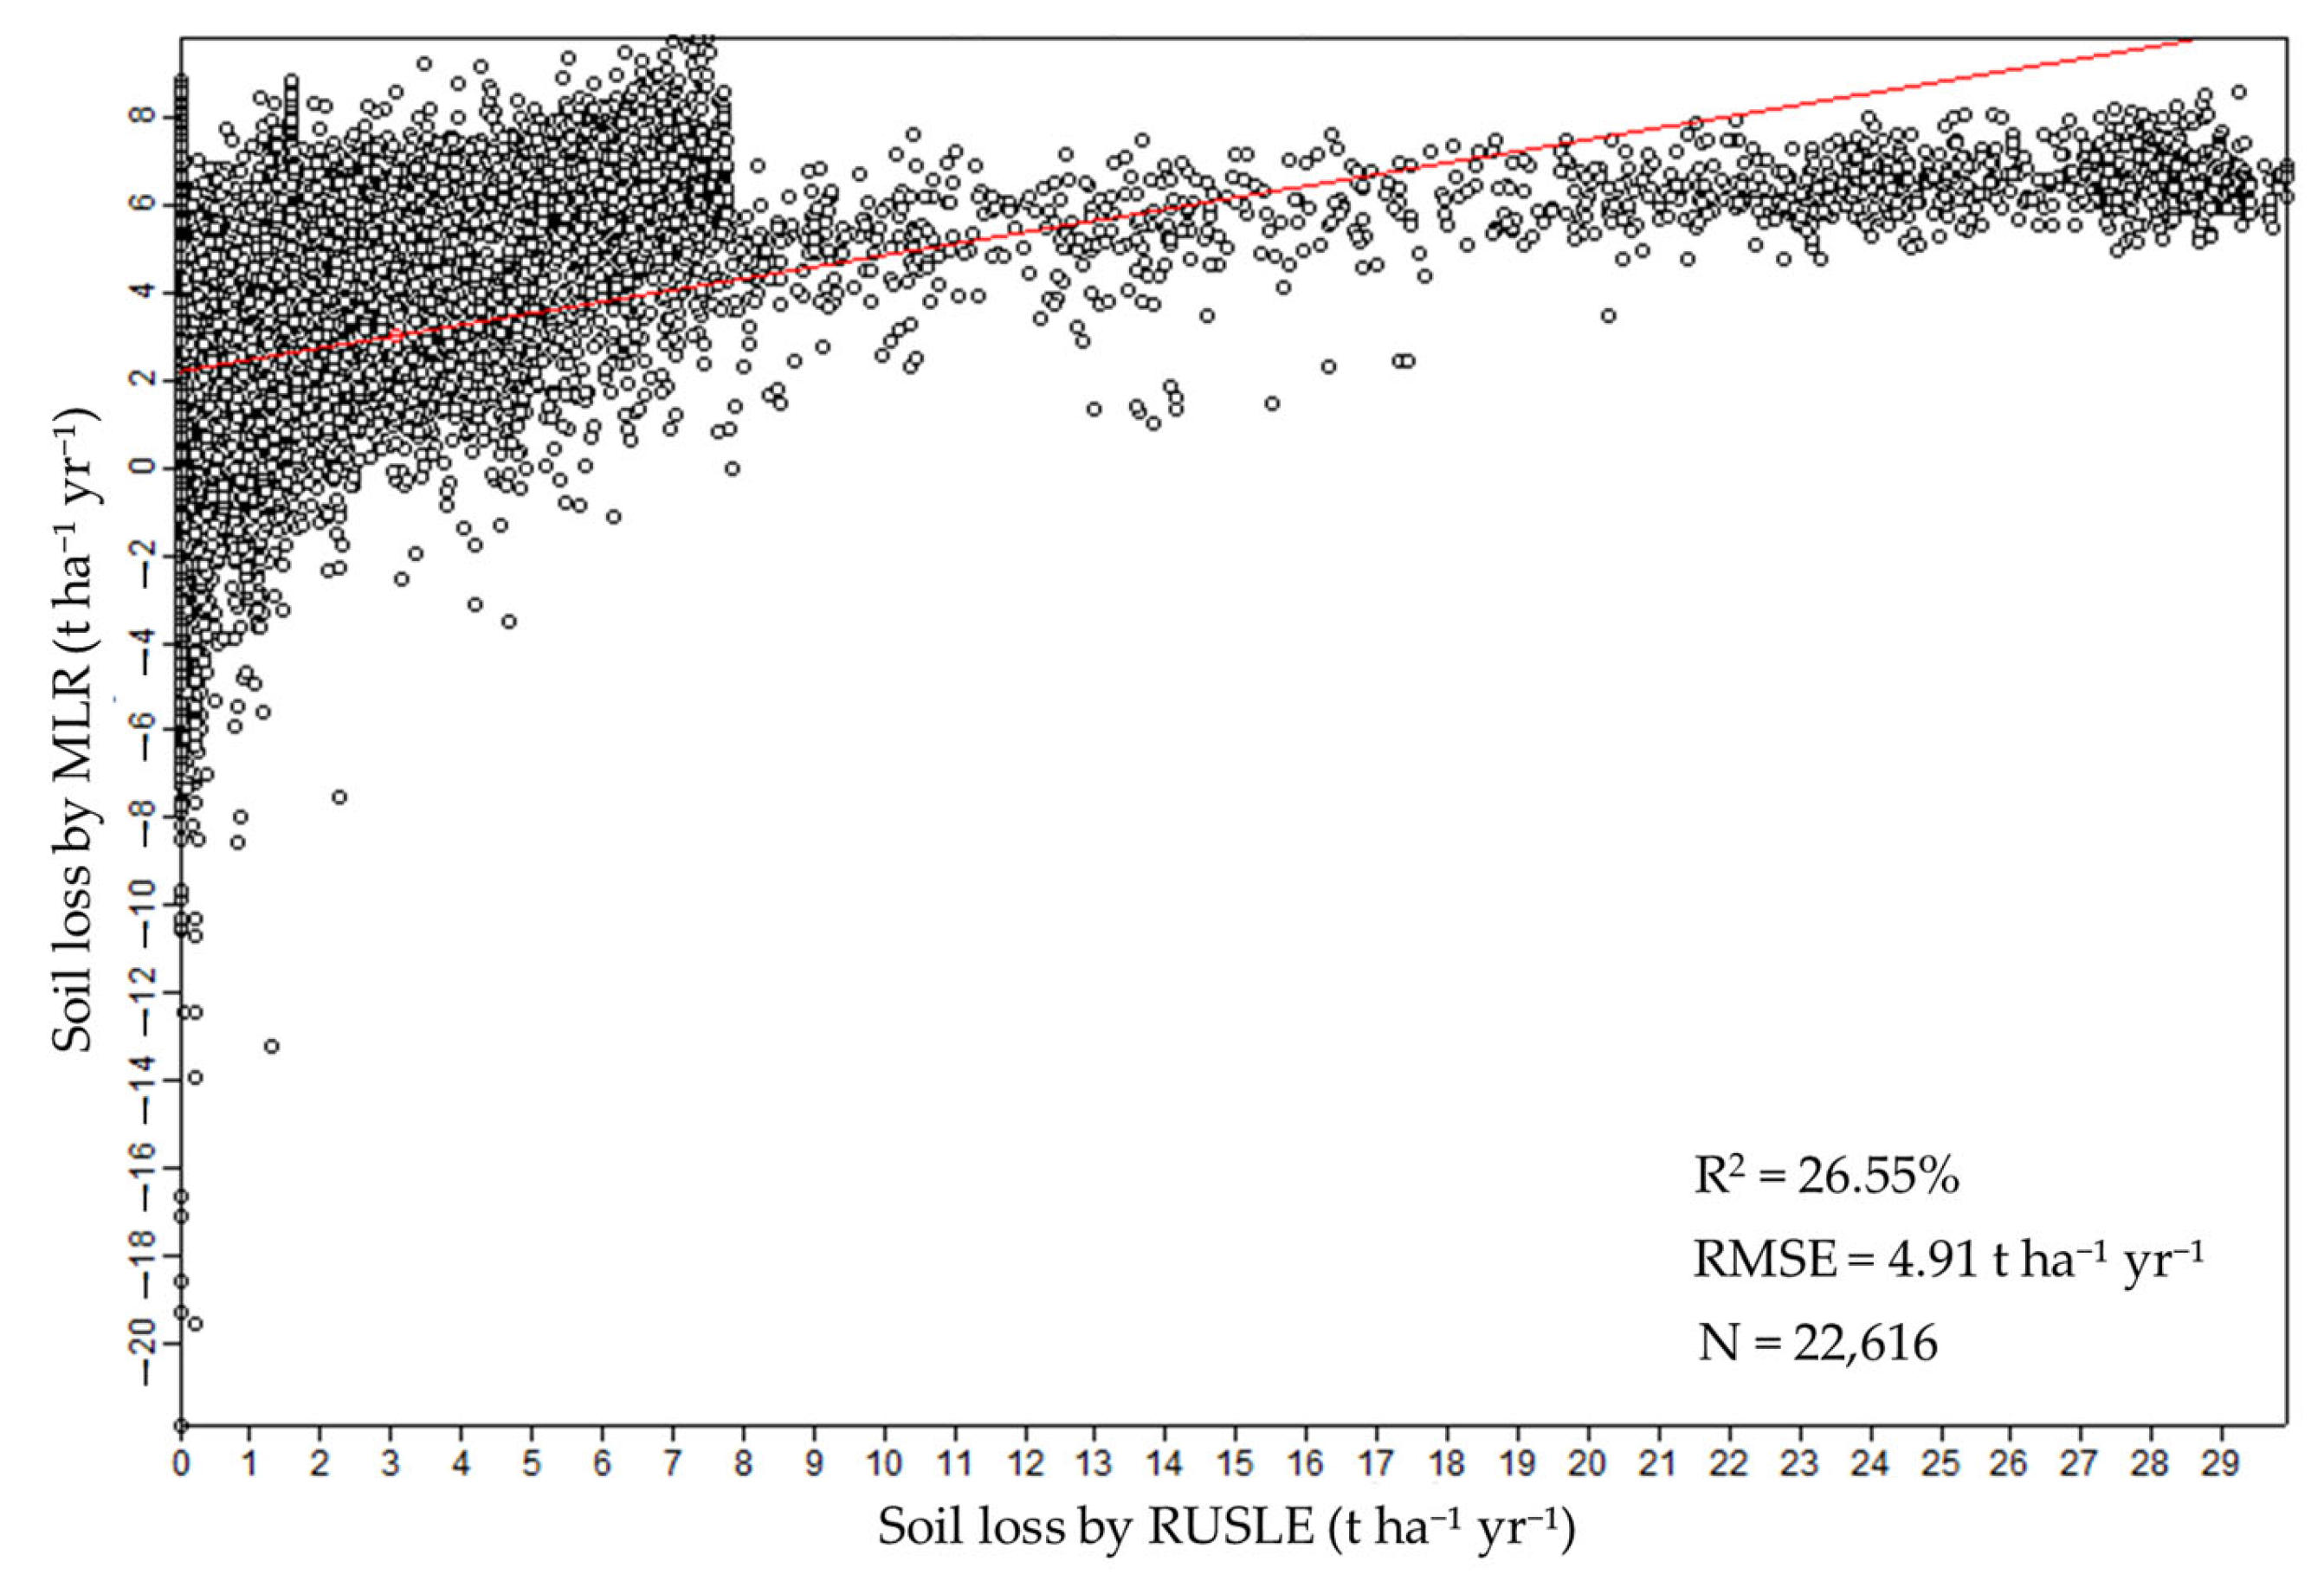
The geomorphological analysis, combined with multiple linear regression (MLR), identified seven key variables significantly influencing soil erosion in the study area: the convergence index, closed depressions, the topographic wetness index, the channel network distance, and the local curvature, upslope curvature, and local downslope curvature. These variables were selected through a stepwise regression approach, which retained only the most statistically significant predictors (p < 0.05). Collectively, these variables explained 26% of the variability in soil loss (R2 = 0.26; Figure 3), indicating that the terrain characteristics play a substantial role in erosion processes.
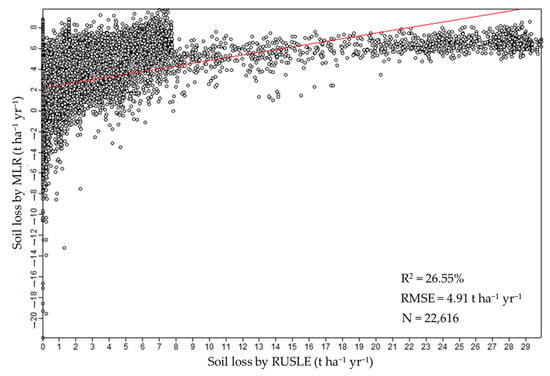
Figure 3.
Scatterplot of soil losses based on the MLR and RUSLE-estimated values. The model showed an R2 of 0.2655 and an RMSE of 2.78 t ha−1 yr−1, indicating moderate explanatory power and acceptable errors. The analysis was based on N = 22,616 data points. These values reflect the model’s ability to explain the variability in soil loss based on selected terrain variables.
The regression equation derived from the MLR model was obtained as
Soil loss = [2.8293 + 0.2296 × TWI + 0.1598 × CD − 0.0171 × CI − 0.0646 × CND − 22.8355 × UC + 2.6141 × LUC + 18.231 × DC]
The convergence index and topographic wetness index emerged as the most influential factors, reflecting the impact of water flow accumulation and soil moisture on erosion. Closed depressions and the channel network distance highlighted the role of the microtopography and proximity to drainage networks in sediment transport. Meanwhile, the curvature-related variables (local curvature, upslope curvature, and local downslope curvature) underscored the importance of the surface geometry in controlling erosion patterns. These findings align with previous studies that have emphasized the significance of topographic complexity in soil erosion dynamics [17].
3.2. Estimation of RUSLE Parameters
The RUSLE model integrates four main factors—rainfall erosivity (R), soil erodibility (K), slope length and steepness (LS), and cover management (C)—to estimate the potential soil loss. These components were analyzed individually to assess their spatial distribution and respective contributions to the erosion risk in the CRB, as presented below.
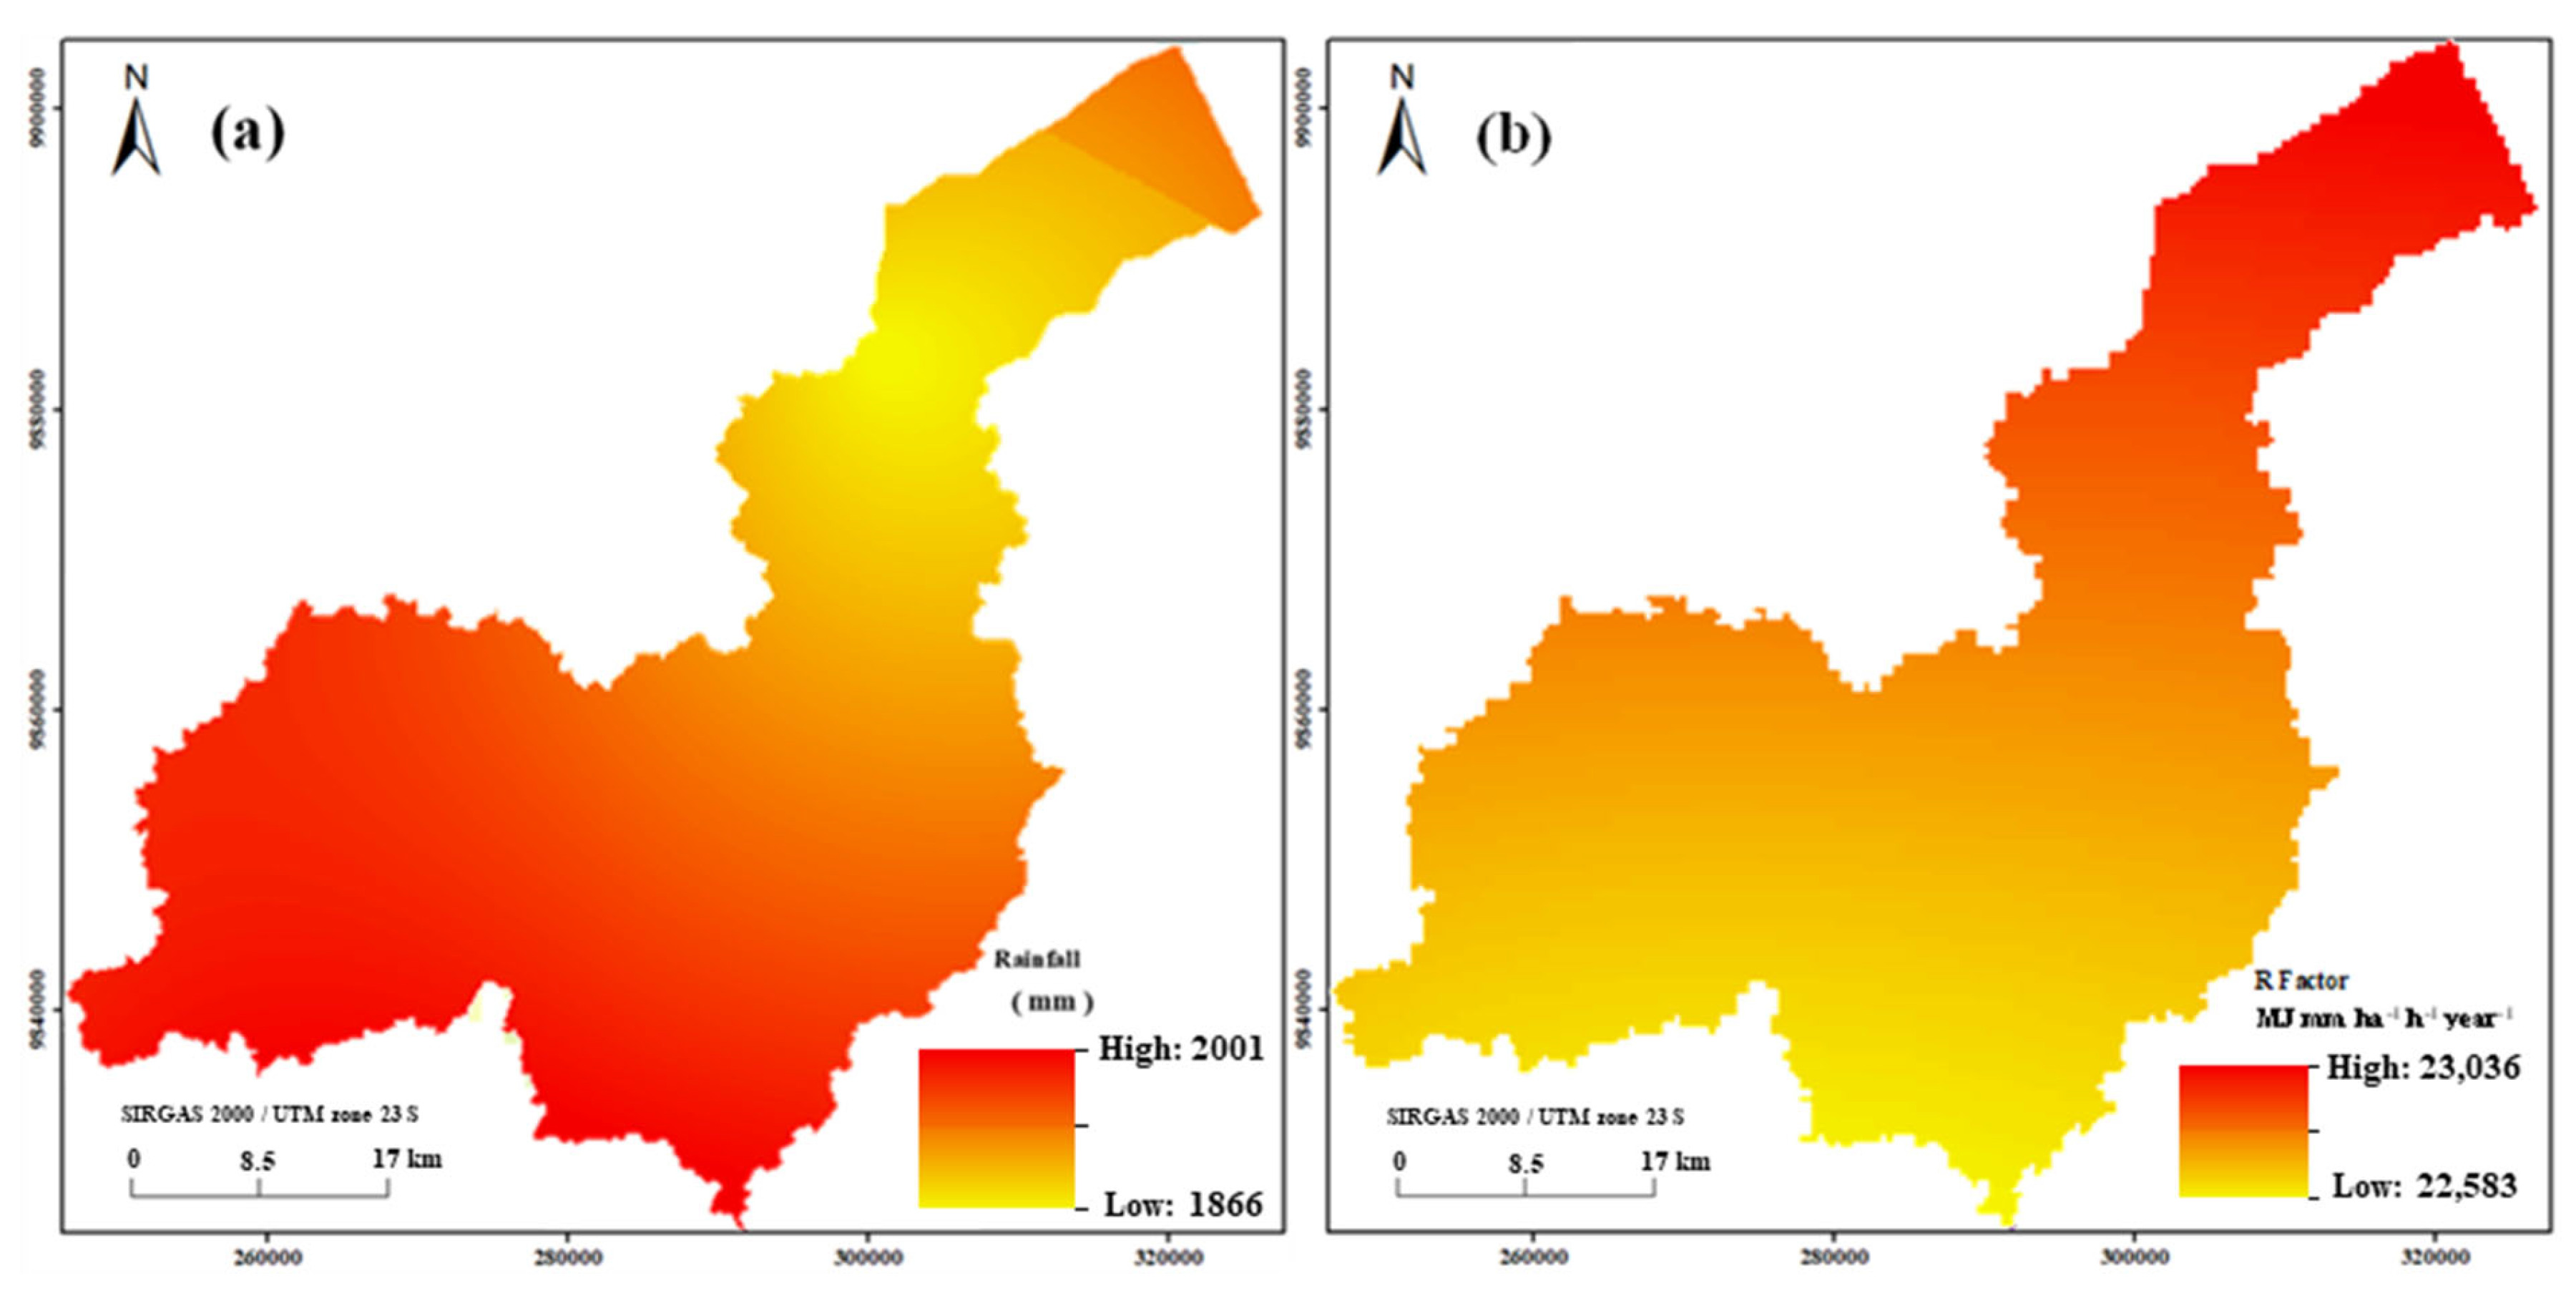
The average annual rainfall in the CRB ranges from 1866.87 to 2001.99 mm. The rainfall values are higher in the west than in the east of the basin (Figure 4a). The R factor values ranged from 22,583 to 23,036 MJ mm ha−1 h−1 yr−1. The R factor is higher in the northeastern and northwestern areas and lower in the southeastern areas of the CRB (Figure 4b). The R factor revealed that the rainfall distribution was not uniform in the study area.

Figure 4.
(a) Rainfall and (b) rainfall–runoff erosivity (R) factor maps. The color scale ranges from yellow (low R values) to red (high R values), representing the spatial variability in rainfall erosivity across the basin.
The R factor revealed that the average rainfall recorded by the weather stations between 2003 and 2020 was low. The average rainfall was 1985.98 mm in this period, which differs from the results of Alvares et al. [53], who found that it ranged from 2250.1 mm to 3000.10 mm. In this study, the average annual rainfall from each station was as follows: the Bragança station recorded 1714.20 mm; the Tomé Açú station recorded 2147.10 mm; the Soure station recorded 2458.10 mm; the Tucuruí station recorded 1861.4 mm; the Marabá station recorded 1496.00 mm; the Capitão Poço station recorded 1978.00 mm; the Paragominas station recorded 1457.10 mm; the Salinópolis station recorded 2167.90 mm; and the Rondon do Pará station recorded 1513.70 mm.
Table 1 shows that K ranged from 0.005 to 0.108 t ha h ha−1 MJ−1 mm−1, representing the following types of soil: Solonchaks, Ferralsols, Plinthosols, Acrisols, and Arenosols. Areas with Arenosols presented high K values, which were closer to 0.108 t ha h ha−1 MJ−1 mm−1. Areas with Ferralsols presented low K values, which were closer to 0.026 t ha h ha−1 MJ−1 mm−1. Figure 5a,b illustrates the spatial distribution of the soil classes and the corresponding erodibility values (K factor) across the study area. Figure 5b shows that the K factor values for each type of soil range from 0.0 to 0.11.
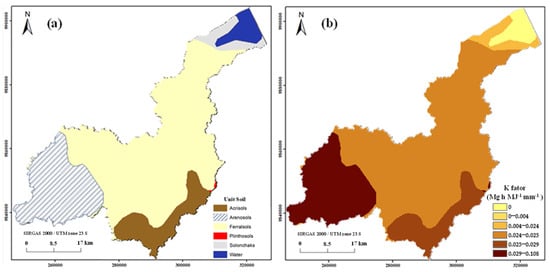
Figure 5.
(a) Soils map classified by WRB/FAO [45] (derived from SiBCS [35]) and (b) soil erodibility factor (K) maps.
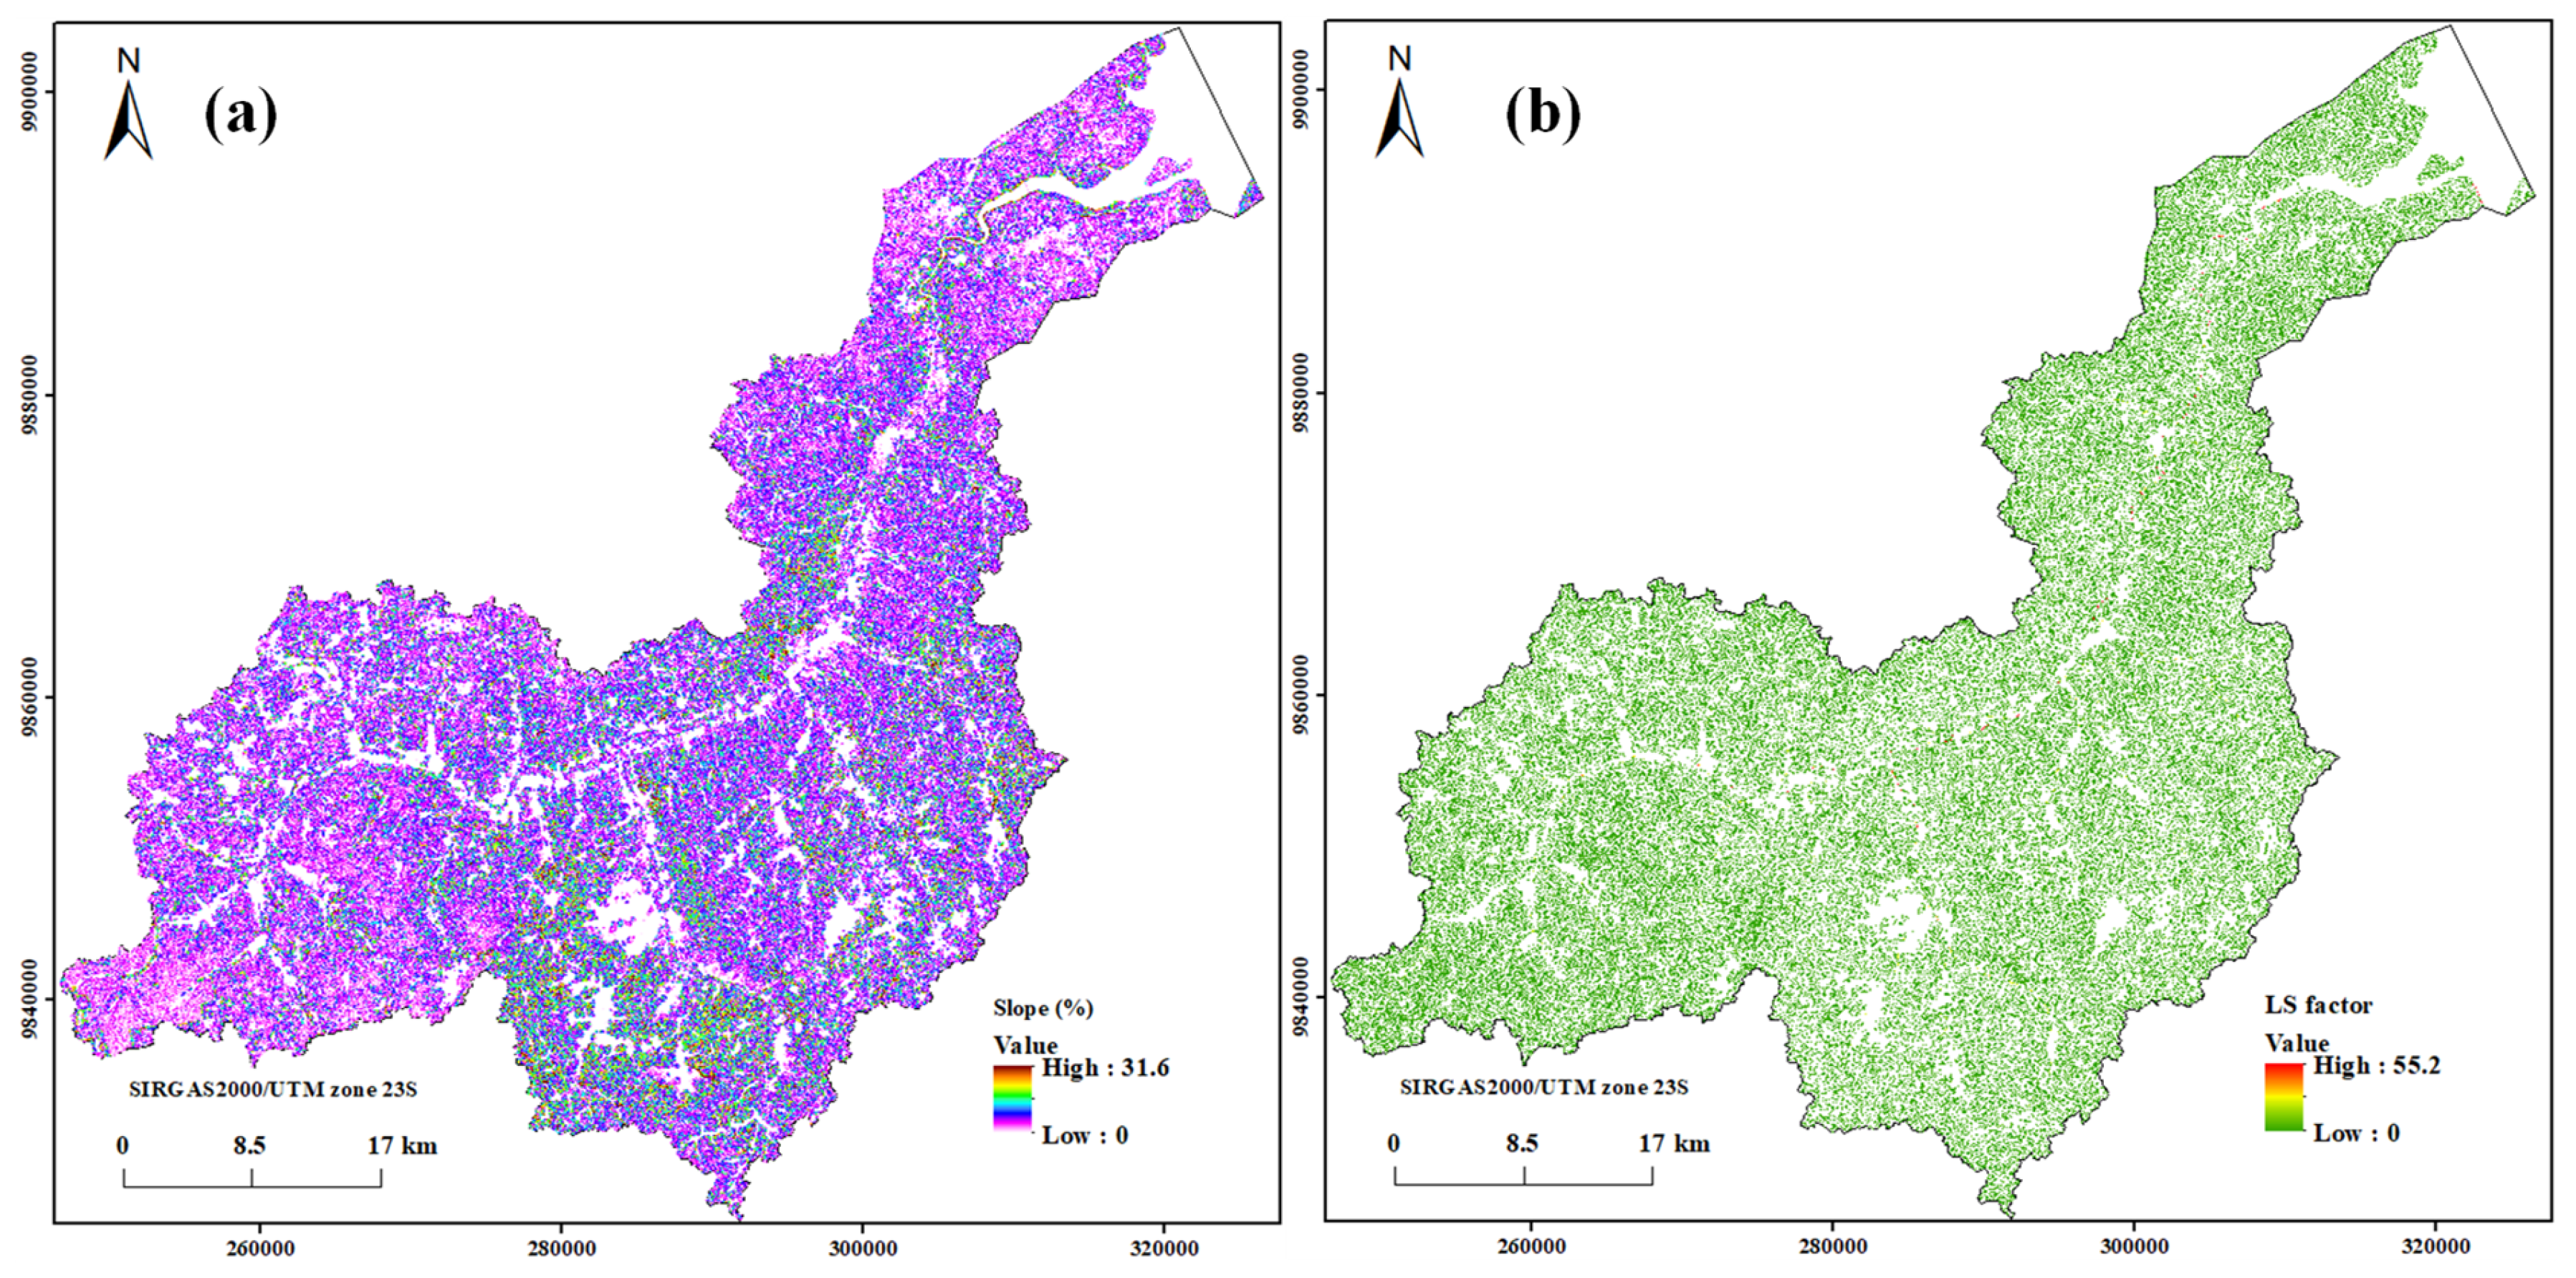
The LS factor, representing the slope length and steepness, was calculated using the flow accumulation and slope derived from the 30-m-resolution SRTM DEM, applying the formula proposed by Moore and Burch [33]. The LS values ranged from 0.0 to 55.2, increasing as both the flow accumulation and slope steepness increased. Low LS values were found in regions with smooth and flat slopes, emphasizing the importance of the slope in determining the erosion potential. Figure 6a,b show the slope and flow accumulation layers used as input for the calculation.
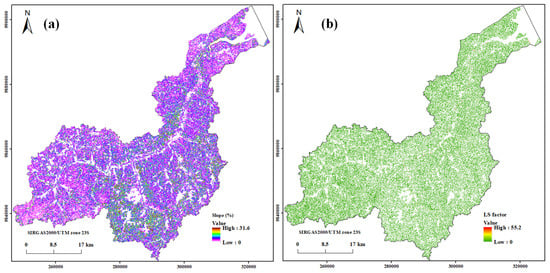
Figure 6.
(a) Slope and (b) LS factor maps.
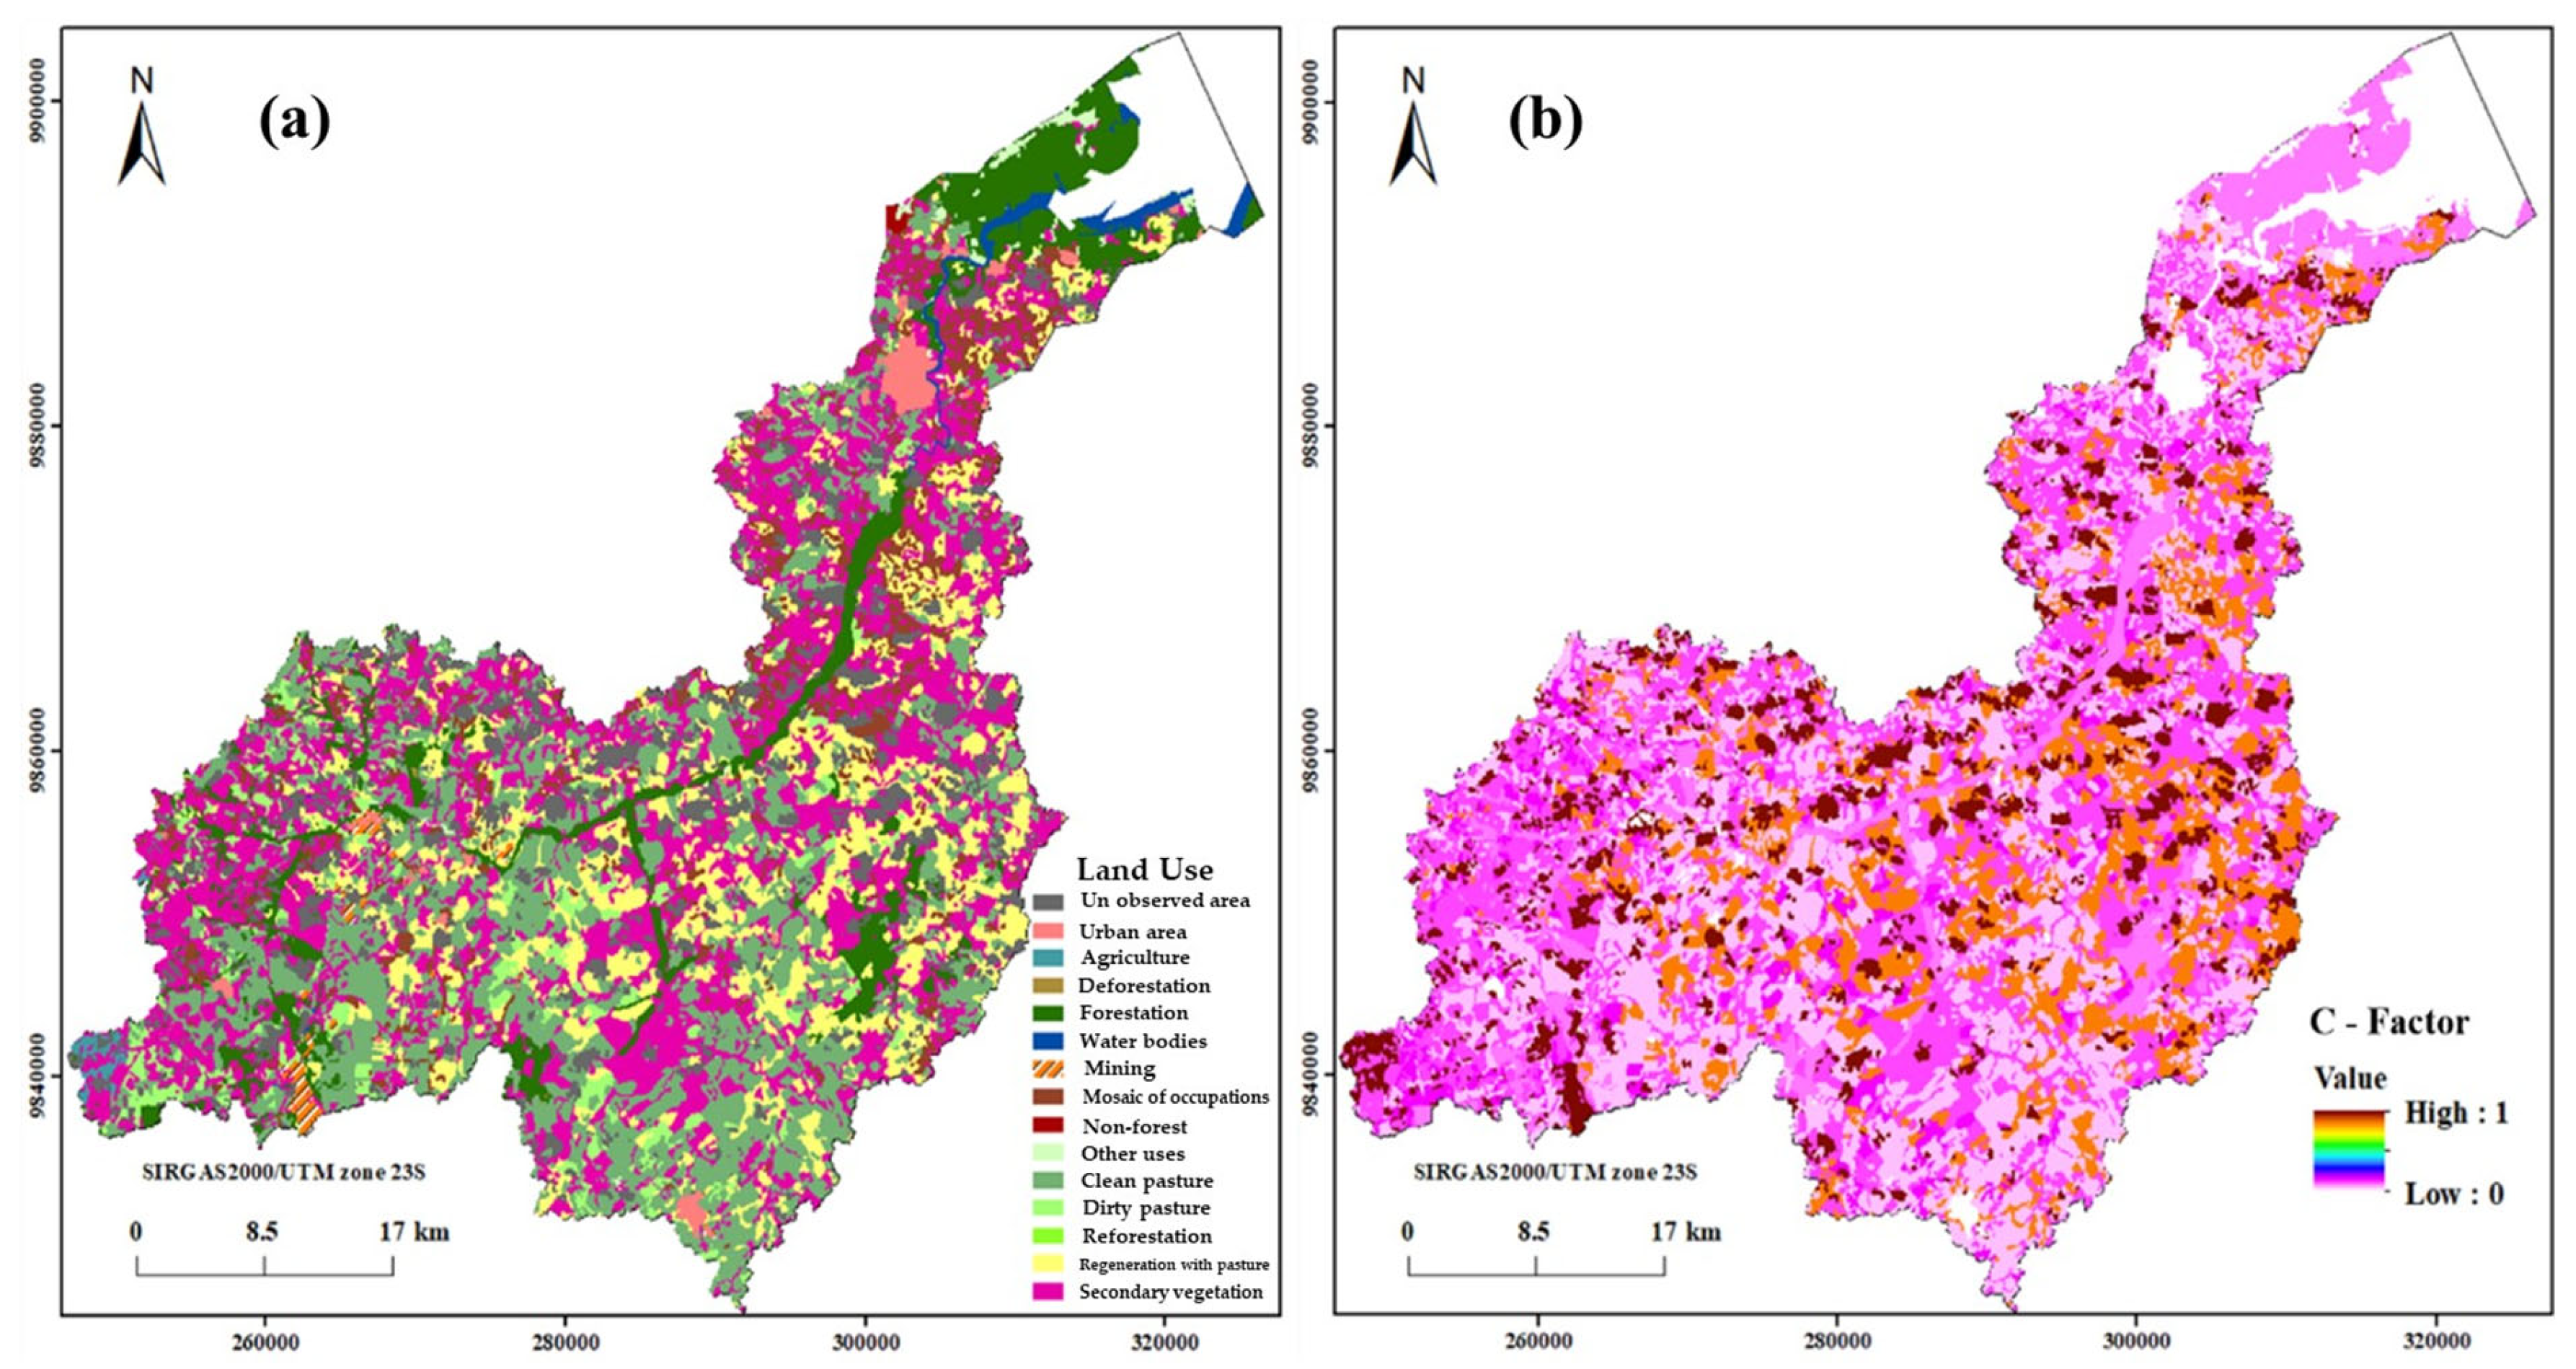
Based on data from the TerraClass project (Table 3), the thematic layers of the land use–land cover (LULC) map were generated and used to create the C factor map. The values of each LULC class were assigned in the map. According to our estimations, the C factor values ranged between 0 and 1 (Figure 7a,b).
Table 3.
Soil loss tolerance (T) thresholds for dominant soil orders in CRB.

Figure 7.
(a) Land use and (b) C factor maps.
No soil support practices were identified in the images. This is a limitation of the scale used and the lack of high-resolution data. A P factor of 1 was applied to the entire CRB.
3.3. Estimation of Mean Annual Soil Loss and Priority Areas
To contextualize these values within Amazonian soil resilience thresholds (Table 3), we compared them with the regionally adapted soil loss tolerance (T) values from Nunes et al. [42].
Table 4 shows the soil erosion rates, varying from 0 t ha−1 yr−1 (minimal) to 30.05 t ha−1 yr−1 (maximum), with an average of 2.0 t ha−1 yr−1. The RUSLE model is the most reliable method to identify priority areas according to the risk level.
Table 4.
Classification of risk class levels for soil erosion (adapted from Beskow et al. [54]) and their respective areal coverage (in % and ha), annual soil loss (in t yr−1 and %), and conservation priority.
The average annual soil loss (A), expressed in t ha−1 yr−1, was calculated for each pixel in the study area using the GIS-integrated RUSLE model. To facilitate interpretation and conservation planning, the resulting A values were reclassified into six erosion risk classes based on thresholds adapted from Beskow et al. [54] as follows: low (0–2.5 t ha−1 yr−1), low to moderate (2.5–5 t ha−1 yr−1), moderate (5–10 t ha−1 yr−1), moderate to high (10–15 t ha−1 yr−1), high (15–25 t ha−1 yr−1), and very high (>25 t ha−1 yr−1). The soil erosion risk map enabled the identification of priority areas for conservation measures according to their risk levels.
In the soil mapping unit, Ferralsols are present in 65.01% of the river basin area, so a moderate K factor predominates in the CRB. These areas are associated with regions with denser vegetation and pastures; consequently, they are at a low to moderate risk of erosion. In contrast, Arenosols occupy 19.99% of the CRB, which are areas with secondary vegetation, regenerative pastures, and clean pastures, which are the most susceptible to soil erosion. According to Cunha et al. [55], these land uses increase the risk of soil erosion. The relief of the Caeté River Basin (CRB) favors the predominance of flat landscape positions. At low altitudes, soils occur in poorly drained valley bottoms—formed by sediment deposition and river dynamics—which leads to weakly developed profiles. In contrast, on higher, flat parts of the landscape, soils are well-drained, more pedogenetically developed, and less susceptible to water erosion.
Nonetheless, the actual soil erosion risk of CRB across these landscape positions is ultimately driven by the interaction between rainfall erosivity (R) and soil erodibility (K) factors. Additionally, land use practices can exacerbate or mitigate erosion risk, as they influence soil structure and vegetation cover, further modifying the susceptibility to erosion.
However, in the southwestern region of the CRB, there is the predominance of quartzipsamments. This region presented Arenosols, with the highest K factor, which ranged from moderate to very high (Figure 5 and Figure 8). This was the only region to present high soil loss. Therefore, it may be considered a high-priority area for soil conservation programs (Figure 8).
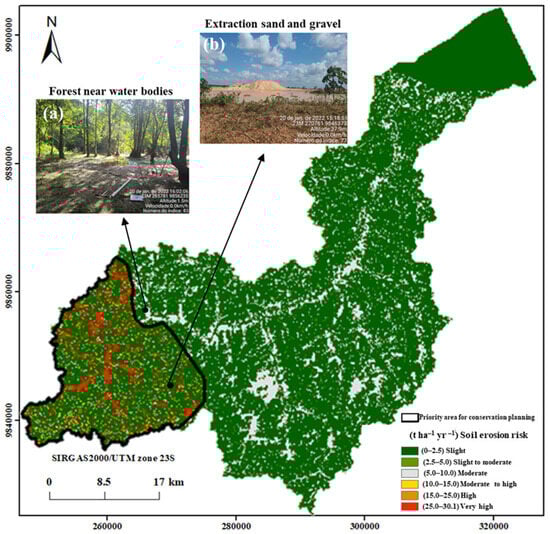
Figure 8.
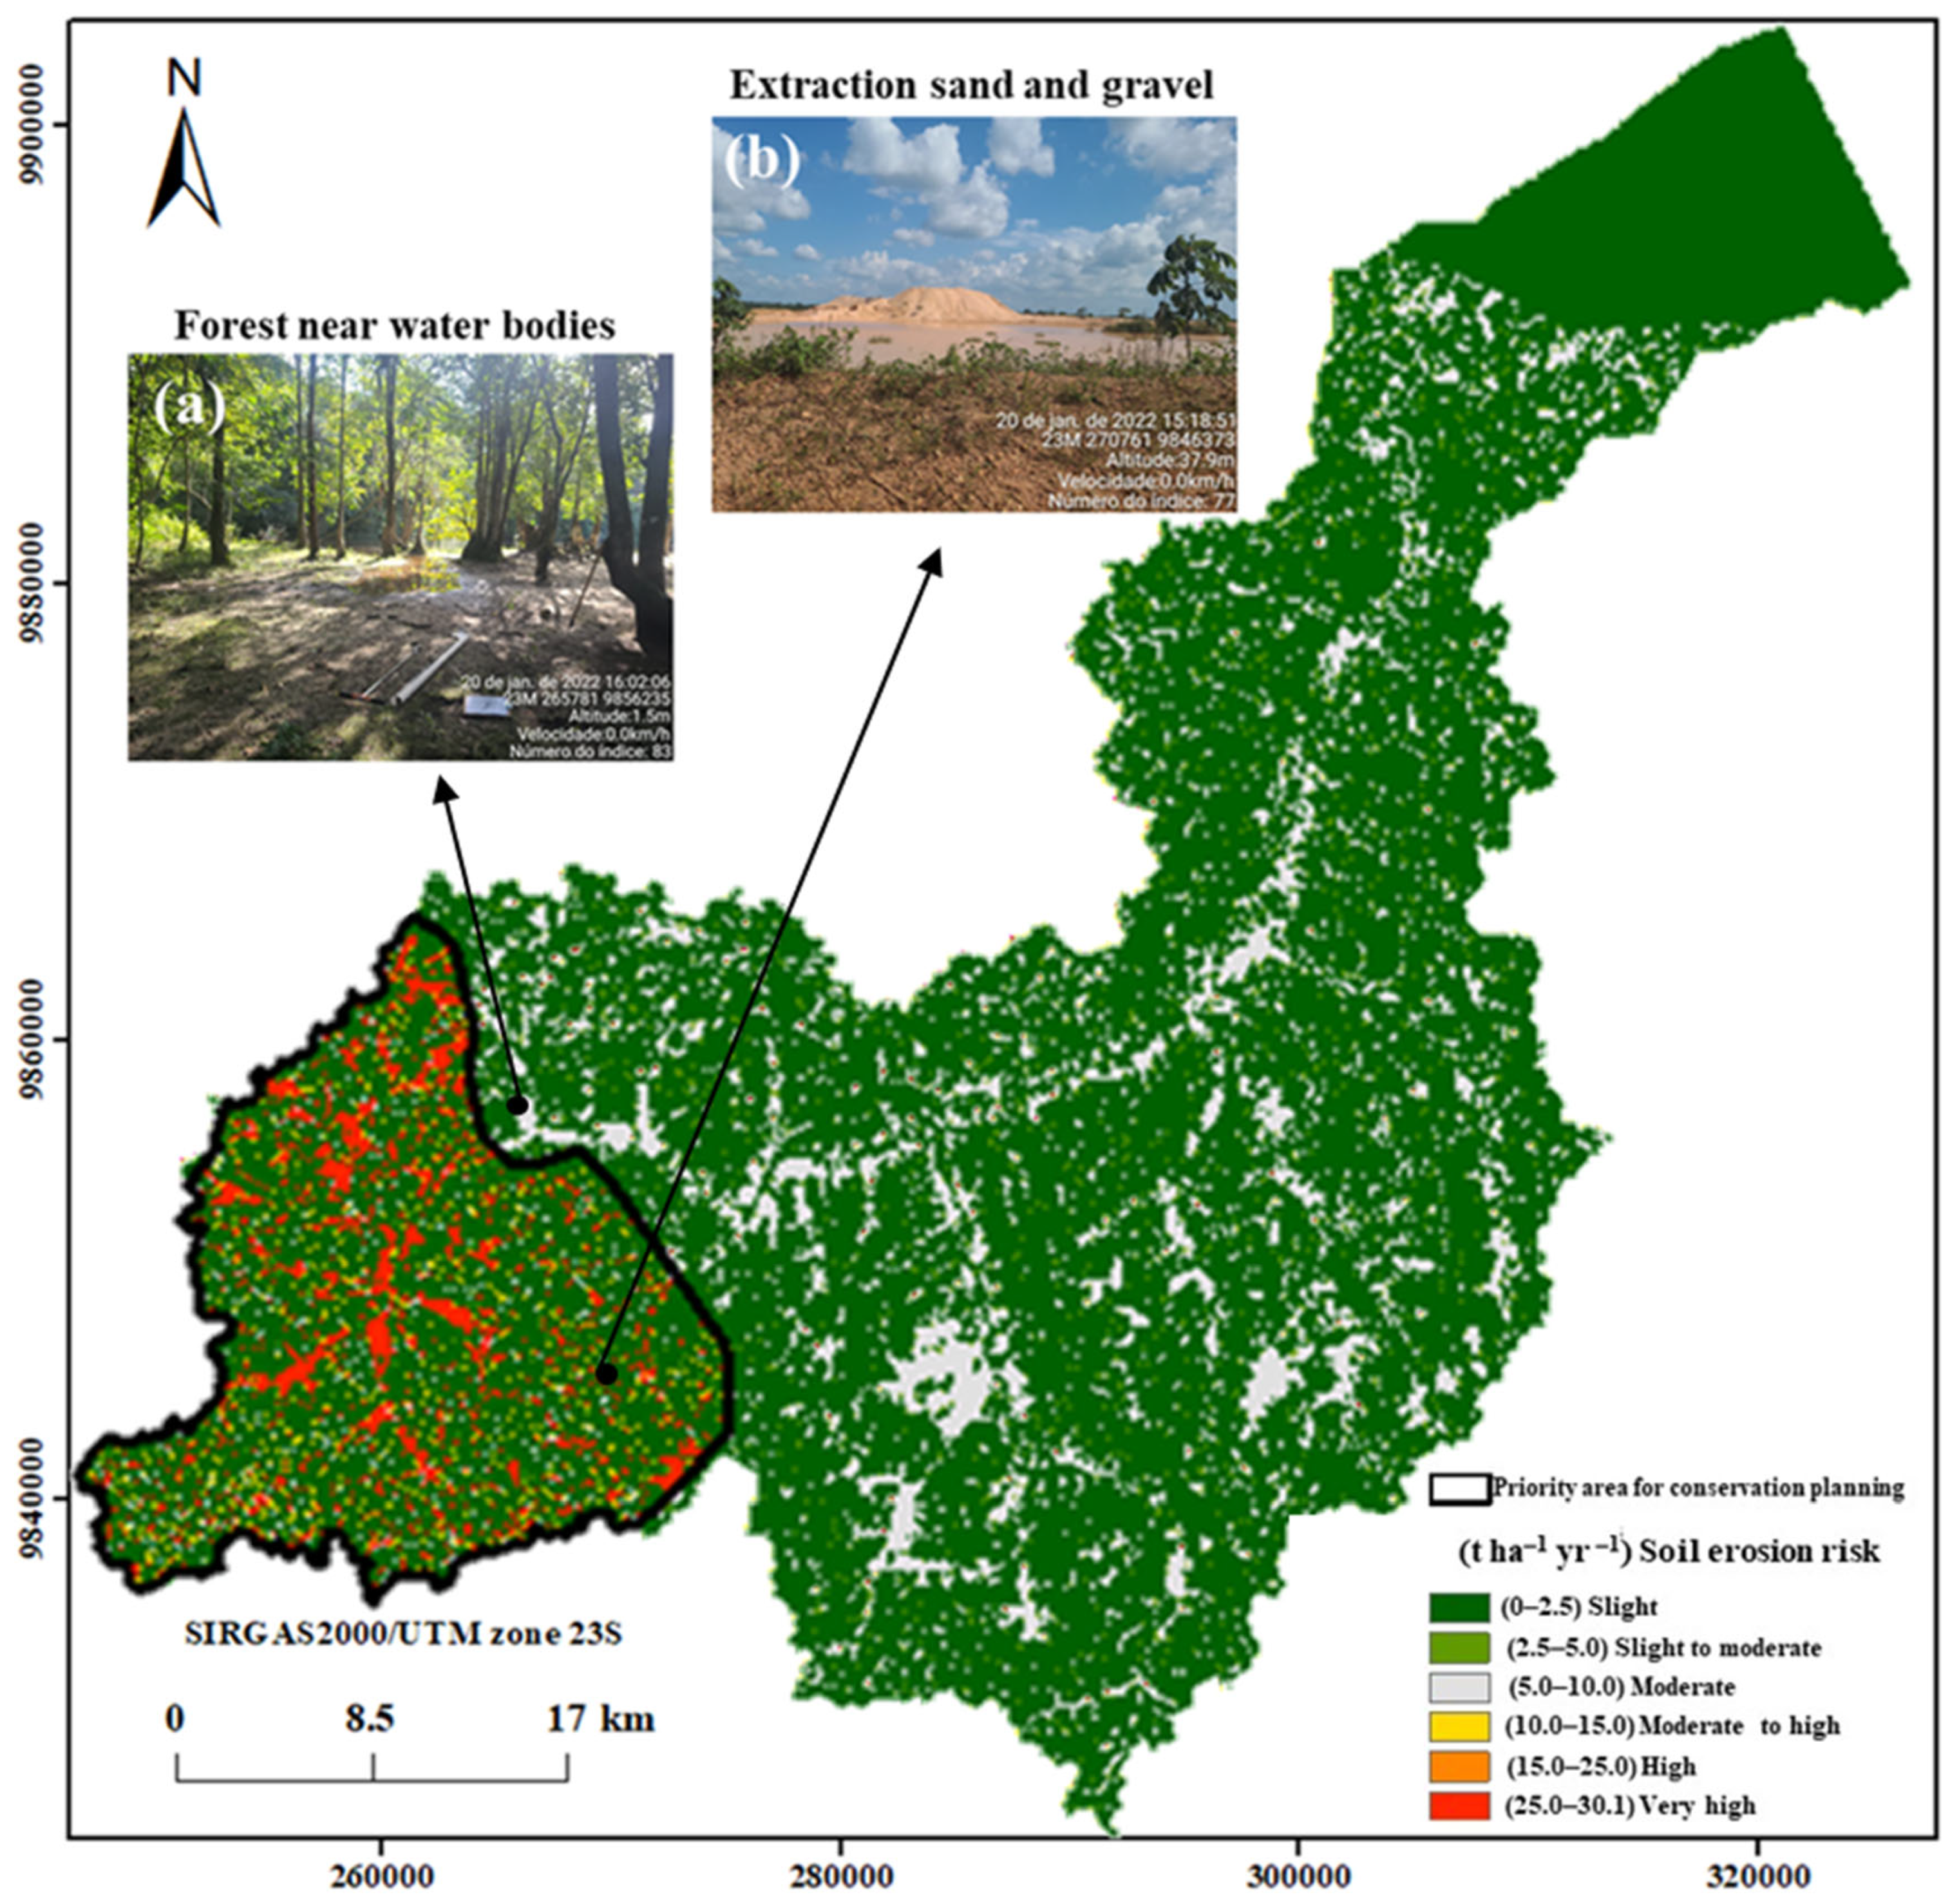
Soil erosion risk map and respective rates (t ha−1 yr−1) with their classification (slight to very high) and delimitation of priority areas for soil and water conservation, classified as low priority, medium priority, and high priority, as well as priority areas for conservation planning. (a) Shows an area of slight soil erosion risk covered by forest near water bodies. (b) Shows a region with very high soil erosion risk, occupied by Arenosols and characterized by strong soil exposure to rainfall.
The slope indices ranged from 0 to 30.33%, encompassing flat, gently undulating, undulating, and heavily undulating terrain (Figure 6a), and they were used to calculate the LS. The LS values ranged from 0 to 55.26 (Figure 6b). LS values lower than 1 correspond to reduced erosive potential. LS values equal to 1 represent a lack of LS activity. LS values greater than 1 indicate that LS is an important factor in the acceleration of the soil loss process [56].
Figure 7b shows the C factors according to the TerraClass project. The soil management practices and uses are reforestation areas, secondary vegetation, regenerative pastures, urban areas, deforestation, annual agriculture, mining, mosaic occupation, non-forest, forest, hydrography, clean pastures, dirty pastures, unspecified, and others (Figure 7a). There is a predominance of secondary vegetation (29.04% of the area), followed by clean pastures (23.52%) and regenerative pastures (14.25%) (Table 2).
The risk of soil erosion ranged from 0 to 30.05 t ha−1 yr−1 (Figure 8). The total soil loss in areas with erosion risks classified as ‘moderate to high’, ‘high’, and ‘very high’—totaling 9083.23 ha—was estimated at 432,153.05 t yr−1. These areas, mainly composed of Arenosols, were designated as conservation priority zones due to their soil losses exceeding the tolerance threshold of 10.48 t ha−1 yr−1. In contrast, the total soil loss in the areas with the lowest soil risk (low to moderate) corresponded to 553,293.86 t ha−1 yr−1 across an area of 217,488.54 ha (Table 4).
4. Discussion
4.1. Role of Geomorphological Variables in Soil Erosion
The MLR analysis revealed that seven geomorphological variables—the convergence index, closed depressions, topographic wetness index (TWI), channel network distance, local curvature, upslope curvature, and local downslope curvature—collectively explained 26% of the variability in soil loss (R2 = 0.26). While this value may seem moderate, it is consistent with studies in similar tropical environments, where soil erosion is influenced by a complex interplay of factors, including the rainfall intensity, land use, and soil properties [1,31].
This equation highlights the relative importance of each variable in predicting soil loss. For instance, the positive coefficient of the TWI (0.2296) underscores the role of soil moisture and water accumulation in enhancing erosion. This finding is consistent with the foundational work of Desmet and Govers [32] and Moore and Burch [33], who established the relationship between topography and erosion processes. Recent studies have further validated the significance of the TWI in tropical basins, where a high rainfall intensity exacerbates soil moisture-driven erosion [31,40]. Similarly, closed depressions (CD) showed a positive relationship (0.1598), indicating that areas with concave features are more susceptible to sediment retention and subsequent erosion, as observed in studies focusing on the microtopography and sediment dynamics [57,58].
In contrast, the convergence index (CI) and channel network distance (CND) exhibited negative coefficients (−0.0171 and −0.0646, respectively). This suggests that areas with divergent flows or those farther from channels experience reduced erosion, aligning with the principles of the drainage pattern’s influence on sediment transport established by Renard et al. [38]. Recent advancements in geospatial analysis have further refined our understanding of these relationships, particularly in regions with complex topographies [59,60].
The curvature-related variables (UC, LUC, and DC) displayed complex relationships, reflecting the influence of the surface geometry on the flow velocity and sediment deposition. For example, the negative coefficient of the upslope curvature (UC) (−22.8355) suggests that convex areas may experience reduced erosion due to faster runoff, a phenomenon previously documented by McCool et al. [48]. Conversely, the positive coefficients of the local upslope curvature (LUC) (2.6141) and downslope curvature (DC) (18.231) highlight the importance of localized curvature in controlling erosion patterns. These findings are supported by contemporary studies that emphasize the role of terrain complexity in erosion dynamics, particularly in tropical environments [1,21].
This study presents a novel application of the GIS-integrated RUSLE model in combination with geomorphometric analysis and multiple linear regression (MLR) to identify erosion-prone areas in a tropical river basin located in the Brazilian Amazon. Unlike previous studies that applied RUSLE in other Brazilian regions with different soil and land use conditions [1,54,55], our research focuses on a basin dominated by Arenosols, which exhibit high erodibility, and on regions under strong anthropogenic pressure, including mining and sand extraction. Furthermore, this is the first study to assess the erosion risk in the CRB, a data-scarce area of significant environmental vulnerability. By integrating topographic indicators (e.g., convergence index, TWI) and validating the erosion risk map with field observations, our study advances the current knowledge of erosion modeling in tropical humid environments, providing actionable insights for conservation planning. Therefore, it contributes both methodologically and regionally to the understanding of soil erosion dynamics in underrepresented Amazonian landscapes.
While the MLR model explained 26% of the variability in soil loss, the remaining variance may be attributed to factors not included in the analysis, such as land management practices, vegetation cover, and soil organic matter content [30,39]. Future studies could incorporate these variables, along with advanced modeling techniques, to improve the predictive power of erosion models at the basin scale in the Amazon biome.
4.2. Soil Erosion Risk in the CRB
Our findings show that the majority of the river basin (81.4%) has a low risk of soil erosion, while 2.9% is at a low to moderate risk, 11.88% at a moderate risk, and so on (Table 3; Figure 8). Consistent with previous research, such as that of Lense et al. [22], our results indicate that deforestation and land use changes have contributed to significant erosion in parts of the basin.
When comparing our results to previous studies, such as Alvares et al. [53], who reported annual precipitation ranging from 2250.1 mm to 3000.1 mm, and Lense et al. [22], who analyzed soil loss in the Xingu River watershed, we observed similarity in the erosion patterns, with high-erosion-risk areas associated with land use changes, such as deforestation. However, our data reveal greater variability in the distribution of erosion, which can be explained by factors specific to our study area.
Furthermore, the analysis of Arenosols and Ferralsols corroborates the findings of Mellado et al. [24], who highlight the high vulnerability of sandy soils to water erosion due to their high K factors and lower structural resistance. This reaffirms the need for specific soil management strategies in these areas to minimize erosion.
The identification of priority areas for conservation, especially in the southwestern region of the CRB, where erosion is exacerbated by anthropogenic activities, underscores the urgency of implementing soil conservation measures. Programs that integrate the RUSLE model with GIS and remote sensing can serve as effective tools for the modeling of soil loss and planning of management interventions. However, there are many practical implications for soil conservation that can aid in reducing soil erosion (e.g., practices such as no-till farming, cover cropping, and mechanical barriers can be implemented to reduce soil erosivity), as evidenced by Steinmetz et al. [18], who suggested successful conservation techniques in regions with similar soils. Assouline and Ben-Hur [61] reported that the R and S factors are considered secondary factors in the erodibility dynamics, and the sediment concentration versus cumulative rainfall is slope-dependent. The slope effect is more pronounced during heavier rainfall.
In addition, soil assessment considers its uses and other factors, such as land use, land ownership, and vegetation. Weiler et al. [62] stated that obtaining subsidies for the planning and development of environmental management practices relies on the susceptibility to soil erosion, considering the spatial and dynamic characteristics of the river basin.
Areas with low soil loss, primarily located in regions with low rainfall and dominated by Ferrasols, are depicted in Figure 4a and Figure 5a. It is important to note that Ferrasols and Arenosols typically exhibit smooth slopes at higher and lower elevations, respectively.
This study defines the soil erosion risk as critical when it reaches moderate to high or very high levels. These areas account for only 4% of the total CRB area but contribute to 44% of the total annual soil loss (Table 3). Consequently, they should be prioritized for conservation efforts due to their high soil erosion risks.
When comparing the modeled soil loss values with the tolerance limits (T values) proposed by Nunes et al. [42] (Table 3), it is evident that some areas—particularly those with Arenosols and subject to anthropogenic disturbances—exceeded the threshold of 10.48 t ha−1 yr−1. These exceedances were concentrated in the southwestern portion of the CRB, where erosion processes are intensified by mining, sand extraction, and fragile soil structures. Such areas, although spatially limited, contributed disproportionately to the total soil loss and were thus designated as high-priority zones for conservation planning. The identification of these exceedances reinforces the relevance of using T values as a reference to define critical areas for intervention in Amazonian landscapes. Although this area represents a small fraction of the river basin, the combination of natural factors (sandy soils and high rainfall) and anthropogenic factors (mining and sand extraction) results in significantly higher erosion rates compared to other parts of the basin. This explains why the soil loss in this region exceeds that observed in larger but less impacted areas.
Overall, the integration of GIS-based RUSLE modeling with geomorphometric indicators and field validation distinguishes this study from previous research conducted in other Brazilian basins. While studies such as Beskow et al. [54], Cunha et al. [55], and Colman et al. [63] focused on different geomorphological settings and did not incorporate terrain-based predictors or validation procedures, the present study offers a comprehensive approach by including topographic, pedological, and anthropogenic variables. Moreover, this is the first documented assessment of the soil erosion risk in the CRB, an environmentally sensitive and data-scarce region of the Eastern Amazon. The methodological framework adopted here contributes not only to regional erosion risk mapping but also provides a replicable model for similar tropical basins facing intense land use pressure and lacking detailed conservation planning tools.
Our findings align with previous research. Beskow et al. [54] reported an A factor of 5.0 t ha−1 yr−1, while Colman et al. [63], Lense et al. [3], and Cunha et al. [55] reported lower values of 1.7 t ha−1 yr−1, 0.9 t ha−1 yr−1, and 0.5 t ha−1 yr−1, respectively. Additionally, studies by Uddin et al. [59] and Zhang et al. [52] have also identified priority areas for conservation in other basins. These studies collectively support the importance of our findings in addressing soil erosion and conservation planning.
The rapid formation of furrows and ravines in the land, indicative of severe water erosion, explains the alarming rate of soil loss in the CRB (Figure 8). Moreover, forest changes are a critical factor influencing the erosion risk within tropical basins. As illustrated in Figure 7a and Figure 8, land use transitions from forest to secondary forest and subsequently to pasture or regenerative pasture are prevalent. In the latter case, a cyclical pattern emerges as fallow trees attempt to regenerate before reverting to pasture, as described by Silva et al. [64].
In a study in Altamira, Pará, Silva et al. [64] concluded that secondary forests are considered by families as “resource reserves” that enable them to expand their agricultural activities. It shows that assessments for soil and water conservation must consider the community in the long term. It might be necessary to develop awareness programs to educate the local population about soil erosion and its consequences. This study, as the first one on the soil erosion risk in the CRB, may contribute to the development of river basin management strategies in the CRB, as it identifies priority areas with a high or very high risk of soil erosion.
4.3. Model Uncertainties and Input Data Validation
In addition to the structural limitations of the RUSLE model, uncertainties related to the input data also influence model outcomes. To evaluate the consistency of the precipitation data, a double mass curve (DMC) analysis was performed.
Prior to this, an outlier test was conducted to ensure data reliability. The DMC analysis showed good consistency among the rainfall stations in the study area, with coefficients of determination (R2) ranging from 0.6434 to 0.7718. According to the adopted criteria, values of R2 > 0.68 indicate acceptable model efficiency (Table 5).
Table 5.
Mean annual rainfall and coefficients of determination for each station.
These results suggest that the precipitation data used to calculate the R factor are consistent and representative of the climatic patterns in the CRB, thus supporting the validity of the erosion modeling results.
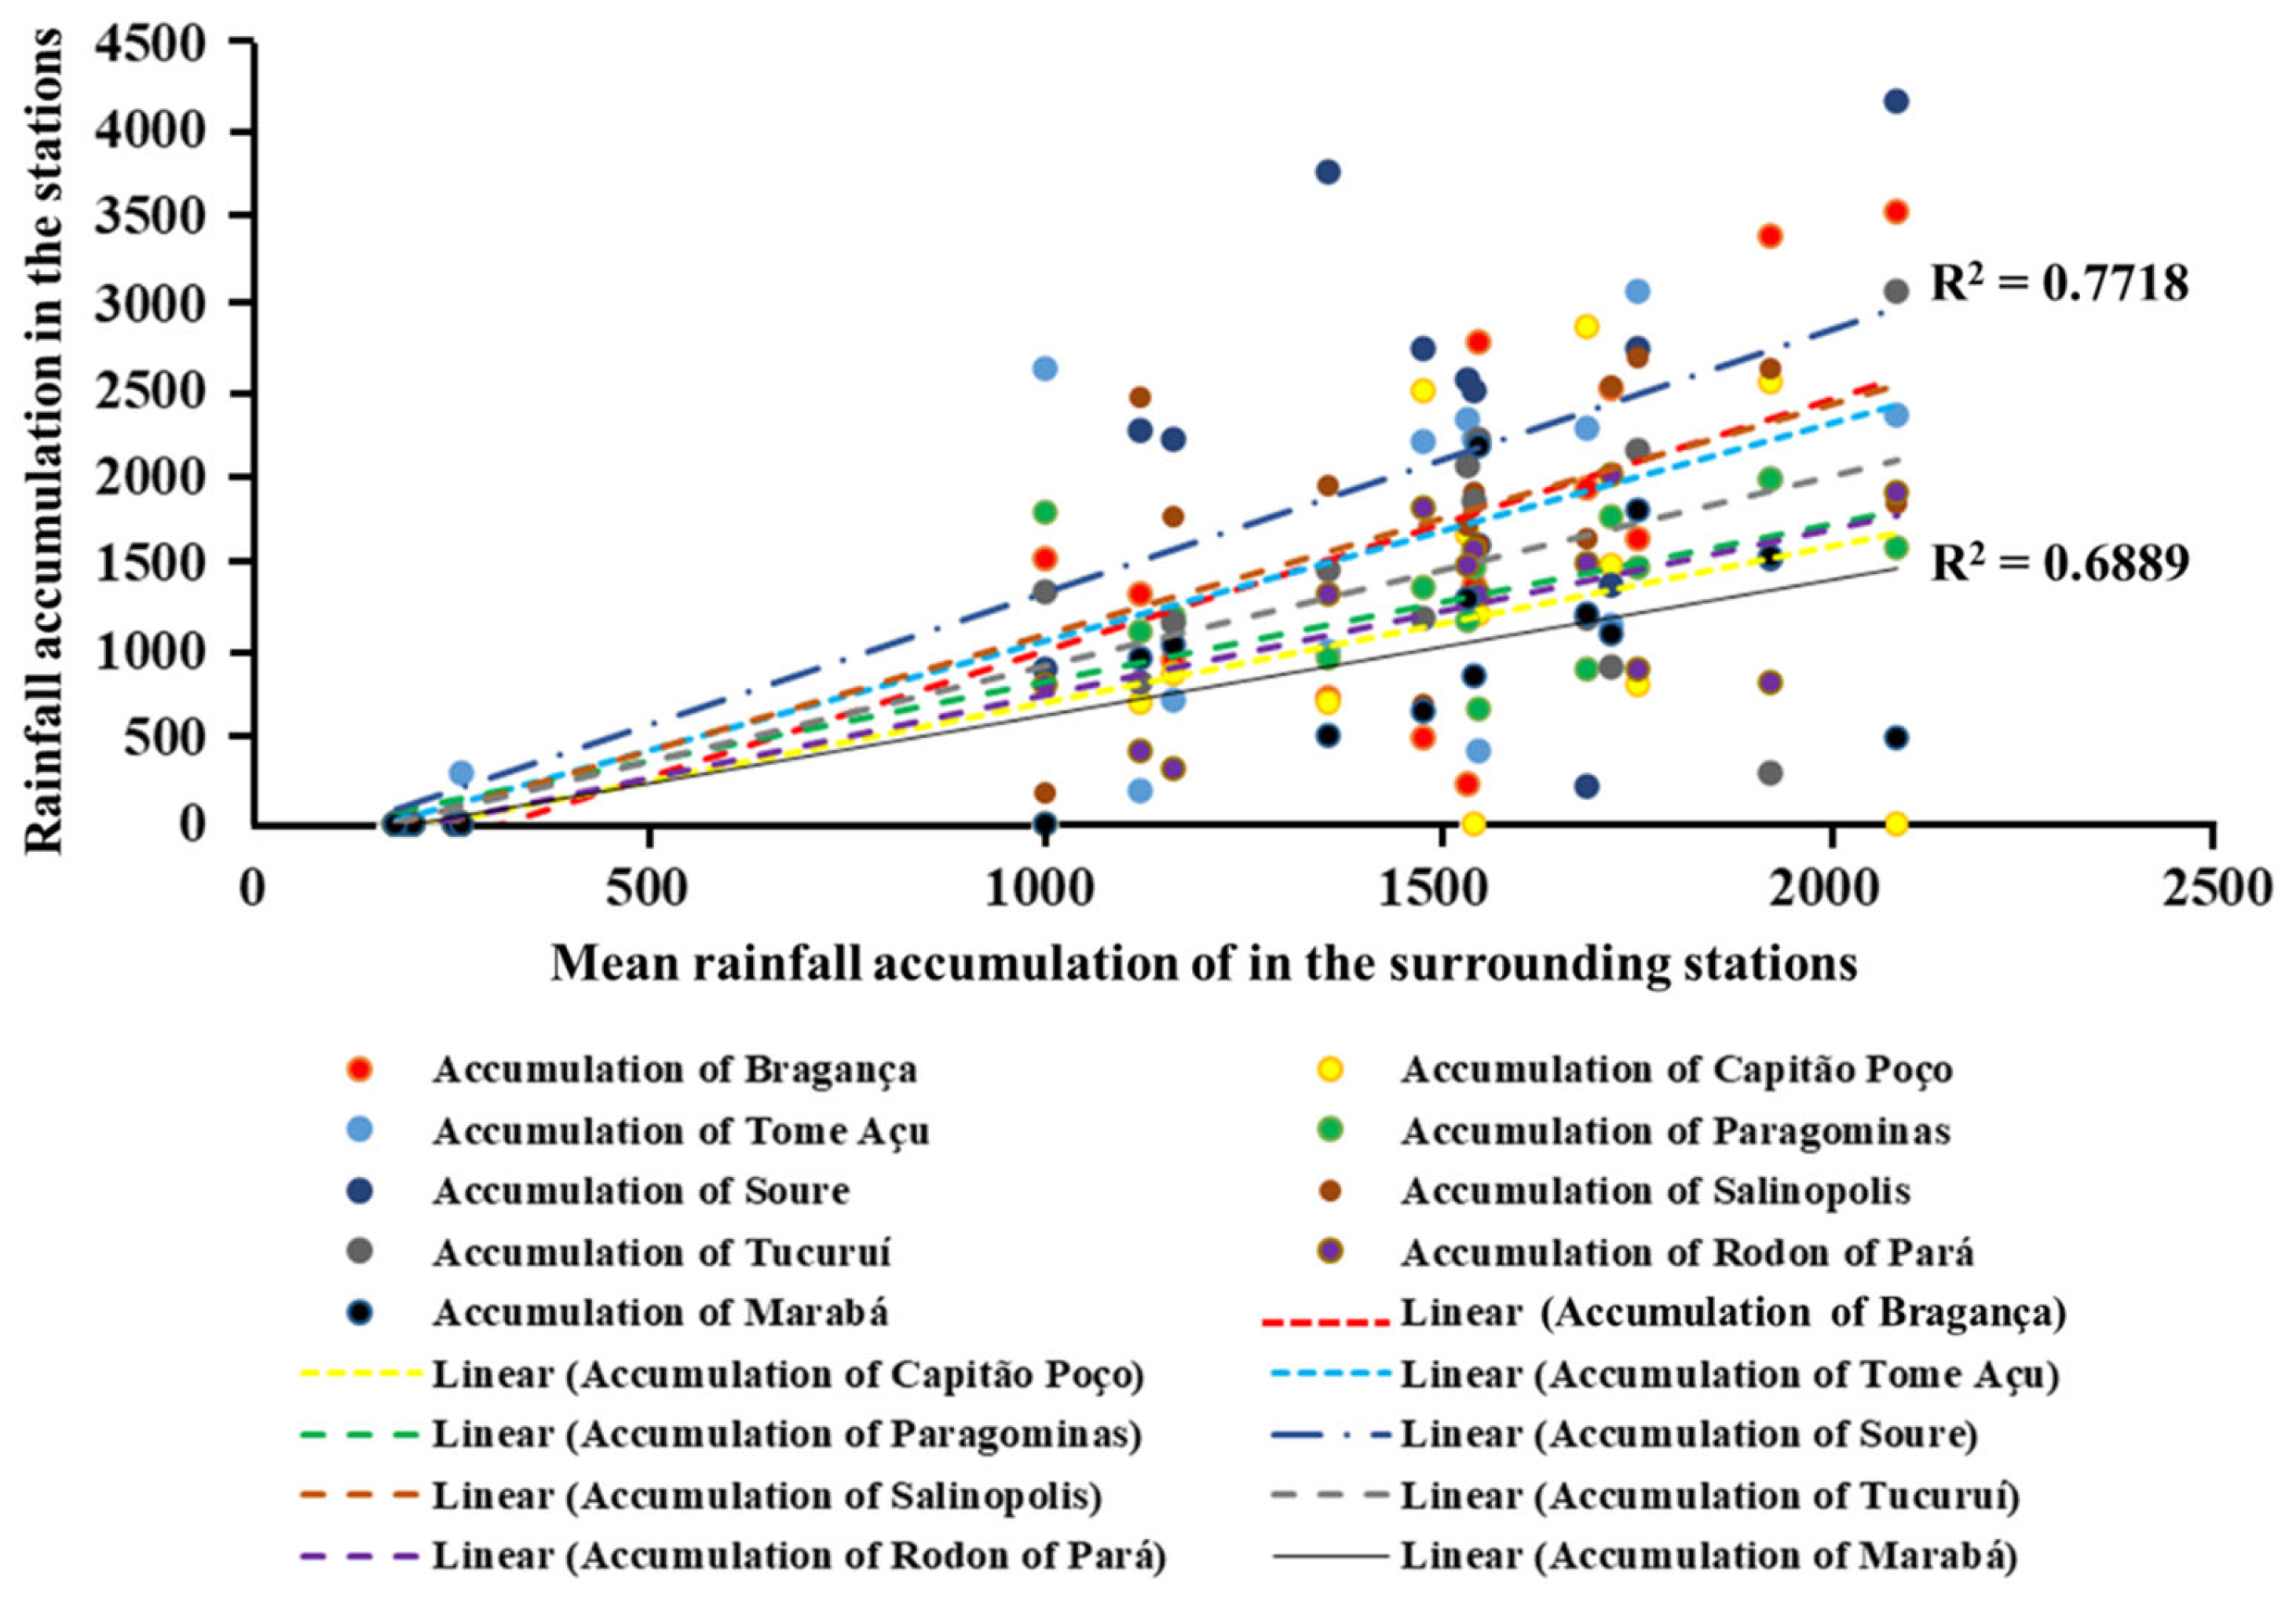
Figure 9 shows the double mass curve for the rainfall stations, illustrating the relationship between the cumulative rainfall at individual stations and the cumulative mean rainfall of surrounding stations. The analysis revealed a medium association (R2 > 0.64 to 0.68) and a strong association (R2 > 0.70 to 0.77) between the cumulative rainfall at specific stations and the mean rainfall of neighboring stations, indicating consistent spatial rainfall patterns across the study area.
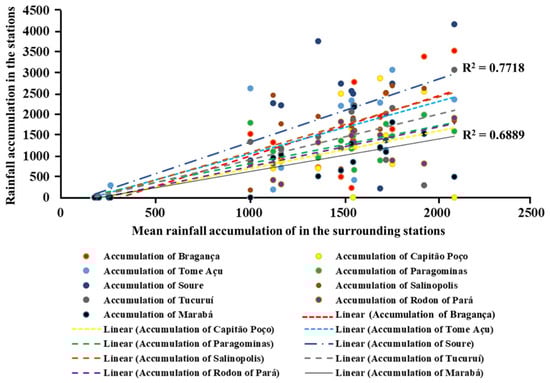
Figure 9.
Double mass curves of rainfall stations, reflecting the accumulation of rainfall in a given station vs. the accumulation of mean rainfall in the surrounding stations. It shows a medium association (R2 > 0.64 up 0.68) and a strong association (R2 > 0.70 up 0.77) between the accumulation of a given station and the accumulation of mean rainfall in the surrounding stations.
The rainfall distribution in the river basin is represented by the variation in the annual precipitation values and differences in space–time variability between weather stations and the accumulation of rainfall in a given station vs. the accumulation of mean rainfall in the surrounding stations (Figure 8). It was not possible to evaluate the efficiency of the RUSLE model based on the station data, because it was difficult to predict the rainfall erosivity. There is a lack of rainfall distribution data in this region. However, the assessment of R can be used to score potential regions with a high risk of soil erosion by water.
Figure 8 shows the soil erosion risk in flat regions with sandy soils, high rainfall with high gravel, sand extraction activity, and mining activity in the southwest of the CRB. Saha et al. [65] reported that the texture of the soil is predominantly loamy and has moderate resistance against soil erosion. In the southwestern region of the basin, the estimated soil loss (A) reached the highest values, surpassing the values in all other areas, despite the limited spatial extent of this region.
Taking this into account, the authors of this study carried out field visits to several locations across all soil erosion risk classes to provide an expert assessment of each (low, low to moderate, moderate, moderate to high, high, and very high). The predictions generated through the multiple linear regression (MLR) model, based on geomorphological variables, were consistent with the erosion risk classes estimated by the GIS-integrated RUSLE model. Field visits confirmed this compatibility across all risk classes. However, the RUSLE model was not efficient in areas with gullies and mining. Gullies were identified in smooth slope areas, which are critical areas affected by erosion. This is due to the presence of quartzipsamments in the soil and sometimes to lithic contact lower than 50 cm in depth. In addition, sand and pebbles were extracted from certain areas during the field visit (Figure 8b). This approach presented strong potential to aid the RUSLE model in mapping the soil erosion risk. Nevertheless, it is necessary to combine the RUSLE model with detailed soil maps.
To validate this study, similar studies carried out in nearby areas under similar conditions were used as a comparison [22,54,55,63] (Table 6). These studies are comparable and are indirect evidence of the validity of the findings of this study.
Table 6.
Comparison of soil loss estimations in the Caeté River Basin.
4.4. Limitations and Future Research
While the RUSLE model has demonstrated utility in estimating the average annual soil loss, it is not without significant limitations. A primary constraint is its inability to account for complex geomorphic processes, such as gully erosion, rill erosion, landslides, and riverbank erosion, which are prevalent in regions with intense rainfall and anthropogenic disturbances like mining and deforestation. These processes often dominate the sediment yield in tropical environments, particularly in areas with steep slopes and highly erodible soils (e.g., Arenosols). Furthermore, the model’s reliance on low-resolution input data and uniform assumptions—such as the use of a constant P factor (P = 1) across the study area—fails to capture the spatial heterogeneity of erosion drivers, leading to potential inaccuracies in the soil loss predictions.
The multiple linear regression (MLR) analysis revealed that seven geomorphological variables significantly influenced soil loss (p < 0.05), but, together, they explained only 26% of its variability (R2 = 0.26). This relatively low explanatory power underscores RUSLE’s limitations in capturing the full complexity of erosion processes—notably land management practices, vegetation cover, soil organic matter, and other anthropogenic factors, which are absent from our model.
Although RUSLE has been widely applied in Brazilian basins within GIS environments (e.g., [66]), its empirical basis constrains its ability to simulate dynamic phenomena such as gully formation, sediment deposition, and seasonal variability. Future work should therefore integrate higher-resolution inputs (e.g., LiDAR-derived DEMs, drone surveys, time-series land use data, and detailed pedological maps) and adopt process-based models (e.g., SWAT, WEPP) to better represent hydrological feedback and extreme events.
Additionally, investigating the interactions between natural and human drivers—deforestation, agricultural expansion, and mining—will require detailed spatiotemporal datasets and long-term field monitoring (e.g., sediment yield, gully evolution, and Césio-137 for sediment tracing) to validate and refine the predictions. Finally, coupling RUSLE with machine learning or hybrid frameworks (e.g., random forests, neural networks) offers a promising path to enhance the accuracy by leveraging spatially explicit data on soils, rainfall variability, and land use dynamics.
5. Conclusions
The multiple linear regression analysis revealed that geomorphological variables explain a significant portion of the soil erosion variability, highlighting the complexity of the erosive processes in the Caeté River Basin. The topographic wetness index (TWI) and local and downslope curvature are important variables that influence erosion patterns, underscoring the role of the topography in sediment transport. While most of the basin exhibits a low erosion risk, critical areas, which account for only 4% of the region, contribute to 44% of the total soil loss. Although the detailed mapping of sandy soils (Arenosols), deforestation, and land use changes were considered in the study, further analysis is needed to establish their exact roles as primary drivers of erosion. These findings emphasize the need for effective conservation policies to address areas with the highest erosion risks. While this study did not directly quantify the effects of deforestation or land use change, the spatial coincidence between high erosion rates and anthropogenically modified areas suggests a possible relationship that merits further investigation.
The GIS-integrated RUSLE model proved to be effective in mapping the erosion risk patterns and in delineating priority areas for soil and water conservation within the Caeté River Basin. However, the model’s empirical nature limits its ability to capture more dynamic and complex processes such as gully formation, sediment deposition, and seasonal variability. Therefore, future studies should explore more comprehensive approaches, such as SWAT or WEPP, incorporating temporal datasets, land use trajectories, and anthropogenic pressure indices.
This research reinforces the utility of integrating RUSLE with GIS and remote sensing tools to support sustainable land management planning in tropical basins. The findings emphasize the importance of targeted soil conservation policies and the engagement of local communities through awareness programs to mitigate erosion and promote the long-term sustainability of the Caeté River Basin.
Author Contributions
Conceptualization, A.d.S.S. and J.F.d.S.J.; methodology, A.d.S.S. and J.F.d.S.J.; software, J.F.d.S.J. and R.J.A.S.; validation, A.d.S.S., A.M.d.R.F.J. and G.S.T.F.; formal analysis, A.d.S.S., L.d.S.S., R.J.A.S. and E.C.A.; investigation, A.d.S.S., E.F.d.S. and J.F.d.S.J.; resources, A.d.S.S., T.G.F.d.S., J.L.M.P.d.L., G.S.T.F. and A.M.d.R.F.J.; data curation, E.C.A., E.F.d.S. and R.J.A.S.; writing—original draft preparation, A.d.S.S. and J.F.d.S.J.; writing—review and editing, R.J.A.S., E.C.A., J.L.M.P.d.L., A.M.d.R.F.J. and G.S.T.F.; visualization, J.L.M.P.d.L., T.G.F.d.S., L.d.S.S. and G.S.T.F.; supervision, J.F.d.S.J. and L.d.S.S.; project administration, J.F.d.S.J.; funding acquisition, J.F.d.S.J., J.L.M.P.d.L. and A.M.d.R.F.J. All authors have read and agreed to the published version of the manuscript.
Funding
This research was funded by the Foundation for Science and Technology, I.P., under the projects UIDB/04292/2020, UIDP/04292/2020, granted to MARE, and LA/P/0069/2020, granted to the Associate Laboratory ARNET and National Council for Scientific and Technological Development (UNIVERSAL; public call CNPq/MCTI/FNDCT-18/2021 [Project grant no. 406838/2021-6]).
Data Availability Statement
Data will be made available on request.
Acknowledgments
The authors would like to thank the Geotechnologies and Pedometrics Research Group (GEOP, UFRA; https://geopufra.com/en/) accessed on 21 April 2025and the support. A.M.d.R.F.J. thanks the São Paulo Research Foundation (FAPESP) for the fellowships granted under process 2023/05323-4.
Conflicts of Interest
The authors declare no conflicts of interest.
References
- Borrelli, P.; Robinson, D.A.; Panagos, P.; Ballabio, C. Land use and climate change impacts on global soil erosion by water (2015–2070). Proc. Natl. Acad. Sci. USA 2020, 117, 21994–22001. [Google Scholar] [CrossRef] [PubMed]
- Borrelli, P.; Robinson, D.A.; Fleischer, L.R.; Lugato, E.; Ballabio, C.; Alewell, C.; Meusburger, K.; Modugno, S.; Schütt, B.; Ferro, V.; et al. An assessment of the global impact of 21st century land use change on soil erosion. Nat. Commun. 2017, 8, 2013. [Google Scholar] [CrossRef] [PubMed]
- Lense, G.H.E.; Parreiras, T.C.; Spalevic, V.; Avanzi, J.C.; Mincato, R.L. Soil losses in the State of Rondônia, Brazil. Ciênc. Rural 2021, 52, e20200460. [Google Scholar] [CrossRef]
- Mendonça, P.G.; Silva Júnior, J.F.S.; Oliveira, I.R.; Teixeira, D.D.B.; Moitinho, M.R.; Martins Filho, M.V.; Marques Júnior, J.; Pereira, G.T. Spatial uncertainty of nutrient loss by erosion in sugarcane harvesting scenarios. Rev. Bras. Ciênc. Solo 2015, 39, 1181–1189. [Google Scholar] [CrossRef]
- Bhatti, M.T.; Ashraf, M.; Anwar, A.A. Soil erosion and sediment load management strategies for sustainable irrigation in arid regions. Sustainability 2021, 13, 3547. [Google Scholar] [CrossRef]
- Saito, Y.K.; Viana, L.J.F.; Ferreira, I.O.; Gomes, E.A. Sedimentation in reservoirs. Case study: The reservoir of the São Bartolomeu stream, Viçosa, Minas Gerais, Brazil. Earth Sci. Res. J. 2021, 25, 193–200. [Google Scholar] [CrossRef]
- Ebabu, K.; Tsunekawa, A.; Haregeweyn, N.; Tsubo, M.; Adgo, E.; Fenta, A.A.; Meshesha, D.T.; Berihun, M.L.; Sultan, D.; Vanmaercke, M.; et al. Global analysis of cover management and support practice factors that control soil erosion and conservation. Int. Soil Water Conserv. Res. 2022, 10, 161–176. [Google Scholar] [CrossRef]
- Ayele, N.A.; Naqvi, H.R.; Alemayehu, D. Rainfall induced soil erosion assessment, prioritization and conservation treatment using RUSLE and SYI models in highland watershed of Ethiopia. Geocarto Int. 2020, 9, 2524–2540. [Google Scholar] [CrossRef]
- Barbosa, R.I.; Fearnside, P.M. Erosão do solo na Amazônia: Estudo de caso na região do Apiaú, Roraima, Brasil. Acta Amaz. 2000, 30, 589–600. [Google Scholar] [CrossRef]
- Duarte, A.C.; Souza, L.R.; Vasconcelos, F.G.; Sales, D.C. Soil erosion assessment using RUSLE model and GIS in Juma Watershed, Southern Amazonas State. Floresta E Ambiente 2021, 28, e20210010. [Google Scholar] [CrossRef]
- Riquetti, N.B.; Beskow, S.; Guo, L.; Mello, C.R. Soil erosion assessment in the Amazon basin in the last 60 years of deforestation. Sci. Total Environ. 2023, 895, 164836. [Google Scholar] [CrossRef]
- Fonseca, E.L.; Silva Filho, E.P. Binary Logistic Regression applied to erosion susceptibility mapping in the Southern Amazon. Model. Earth Syst. Environ. 2023, 9, 1381–1393. [Google Scholar] [CrossRef]
- Aslam, B.; Maqsoom, A.; Alaloul, W.S.; Musarat, M.A.; Jabbar, T.; Ahmed, Z. Soil erosion susceptibility mapping using a GIS-based multi-criteria decision approach: Case of district Chitral, Pakistan. Ain Shams Eng. J. 2021, 12, 1637–1649. [Google Scholar] [CrossRef]
- Farinasso, M.; Carvalho Júnior, O.A.; Guimarães, R.F.; Gomes, R.A.T.; Ramos, V.M. Avaliação qualitativa do potencial de erosão laminar em grandes áreas por meio da EUPS utilizando novas metodologias em SIG para os cálculos dos seus fatores na região do Alto Parnaíba-Pi-MA. Rev. Bras. Geomorfol. 2006, 7, 73–85. [Google Scholar] [CrossRef]
- Foster, G.R.; Neibling, W.H.; Davis, S.S.; Alberts, E.E. Modeling particle segregation during deposition by Overland flow. In Proceedings of the Hydrologic Transport Modeling Symposium, New Orleans, LA, USA, 10–11 December 1980; American Society of Agricultural Engineers Publication: St Joseph, MI, USA; Volume 4–80, pp. 184–195. [Google Scholar]
- Wang, J.; Lu, P.; Valente, D.; Petrosillo, I.; Babu, S.; Xu, S.; Li, C.; Huang, D.; Liu, M. Analysis of soil erosion characteristics in small watershed of the loess tableland Plateau of China. Ecol. Indic. 2022, 137, 108765. [Google Scholar] [CrossRef]
- Minár, J.; Drăguț, L.; Evans, I.S.; Feciskanin, R.; Gallay, M.; Jenčo, M.; Popov, A. Physical geomorphometry for elementary land surface segmentation and digital geomorphological mapping. Earth-Sci. Rev. 2024, 248, 104631. [Google Scholar] [CrossRef]
- Steinmetz, A.L.; Cassalho, F.; Caldeira, T.L.; Oliveira, V.A.; Beskow, S.; Timm, L.C. Assessment of soil loss vulnerability in data-scarce watersheds in southern Brazil. Ciênc. Agrotecnol. 2018, 42, 575–587. [Google Scholar] [CrossRef]
- Panagopoulos, Y.; Dimitriou, E.; Skoulikidis, N. Vulnerability of a northeast Mediterranean island to soil loss. Can grazing management mitigate erosion? Water 2019, 11, 1491. [Google Scholar] [CrossRef]
- Oliveira, V.A.; Mello, C.R.; Durães, M.F.; Silva, A.M. Soil erosion vulnerability in the Verde River Basin, Southern Minas Gerais. Ciênc. Agrotecnol. 2014, 38, 262–269. [Google Scholar] [CrossRef]
- Getnet, T.; Mulu, A. Assessment of soil erosion rate and hotspot areas using RUSLE and multi-criteria evaluation technique at Jedeb watershed, Upper Blue Nile, Amhara Region, Ethiopia. Environ. Chall. 2021, 4, 100174. [Google Scholar] [CrossRef]
- Lense, G.H.E.; Avanzi, J.C.; Parreiras, T.C.; Mincato, R.L. Effects of deforestation on water erosion rates in the Amazon region. Rev. Bras. Ciênc. Agrár. 2020, 15, 1–7. [Google Scholar] [CrossRef]
- Chatterjee, S.; Krishna, S.A.; Sharma, A.P. Geospatial assessment of soil erosion vulnerability at watershed level in some sections of the Upper Subarnarekha river basin, Jharkhand, India. Environ. Earth Sci. 2014, 71, 357–374. [Google Scholar] [CrossRef]
- Mellado, D.E.G.; Mello, C.R.; Curi, N. Environmental degradation risk by water erosion in a water producer Colombian Andes basin. Ciênc. Agrotecnol. 2021, 45, e010021. [Google Scholar] [CrossRef]
- Chen, S.; Zha, X.; Bai, Y.; Wang, L. Evaluation of soil erosion vulnerability on the basis of exposure, sensitivity, and adaptive capacity: A case study in the Zhuxi watershed, Changting, Fujian Province, Southern China. Catena 2019, 177, 57–69. [Google Scholar] [CrossRef]
- Sun, C.; Hou, H.; Chen, W. Effects of vegetation cover and slope on soil erosion in the Eastern Chinese Loess Plateau under different rainfall regimes. PeerJ 2021, 9, e11226. [Google Scholar] [CrossRef]
- Augustine, A.; Hudson, P.F. A review of soil erosion models with special reference to the needs of humid tropical mountainous environments. Eur. J. Sustain. Dev. 2014, 3, 299–310. [Google Scholar] [CrossRef]
- Bertoni, J.; Lombardi Neto, F. Conservação do Solo; Ícone: São Paulo, Brasil, 1999. [Google Scholar]
- Desalegn, A.; Tezera, A.; Tesfay, F. Developing GIS-based soil erosion map using RUSLE of Andit Tid Watershed, Central Highlands of Ethiopia. J. Sci. Res. Rep. 2018, 1, 1–13. [Google Scholar] [CrossRef]
- Morgan, R.P.C. Soil Erosion and Conservation, 3rd ed.; Blackwell Publishing Company: Oxford, UK, 2005. [Google Scholar]
- Kebede, Y.S.; Endalamaw, N.T.; Sinshaw, B.G.; Atinkut, H.B. Modeling soil erosion using RUSLE and GIS at watershed level in the upper beles, Ethiopia. Environ. Chall. 2021, 2, 100009. [Google Scholar] [CrossRef]
- Desmet, P.J.J.; Govers, G. A GIS procedure for automatically calculating the USLE LS factor on topographically complex landscape units. J. Soil Water Conserv. 1996, 51, 427–433. [Google Scholar] [CrossRef]
- Moore, L.D.; Burch, G.J. Physical basis of the length-slope factor in the universal soil loss equation. Soil Sci. Soc. Am. J. 1985, 50, 1294–1298. [Google Scholar] [CrossRef]
- Bensekhria, A.; Bouhata, R. Assessment and mapping soil water erosion using E approach and GIS tools: Case of Oued el-Hai Watershed, Aurès West, Northeastern of Algeria. ISPRS Int. J. Geo-Inf. 2022, 11, 84. [Google Scholar] [CrossRef]
- Santos, H.G. d, S.; Jacomine, P.K.T.; LHCd, A.; VAd, O.; Lumbreras, J.F.; Coelho, M.R.; Araujo Filho JCd, O.J.; Cunha, T.J.F. Sistema Brasileiro de Classificação de Solos, 5th ed.; Embrapa: Brasília, Brazil, 2018; p. 530. Available online: geoinfo.cnps.embrapa.br/layers/geonode%3Abrasil_solos_5m_20201104 (accessed on 10 January 2025).
- Santos, P.L.; Rodrigues, T.E.; Oliveira Júnior, R.C.; Silva, J.M.L.; Valente, M.A.; Silva, P.R.O.; Cardoso Júnior, E.Q. Zoneamento Agroecológico do Município de Augusto Corrêa, Estado do Pará; Embrapa Amazônia Oriental: Belém, Brazil, 1999; Documentos, 26; p. 55. [Google Scholar]
- Almeida, C.A.; Coutinho, A.C.; Esquerdo, J.C.D.M.; Adami, M.; Venturieri, A.; Diniz, C.G.; Dessay, N.; Durieux, L.; Gomes, A.R. High spatial resolution land use and land cover mapping of the Brazilian Legal Amazon in 2008 using Landsat-5/TM and MODIS data. Acta Amaz. 2016, 46, 291–302. [Google Scholar] [CrossRef]
- Renard, K.G.; Foster, R.G.; Weesies, G.A.; McCool, D.K.; Yoder, D.C. Predicting Soil Erosion by Water: A Guide to Conservation Planning with the Revised Universal Soil Loss Equation (RUSLE); U.S. Government Printing Office: Washington, DC, USA, 1997; p. 703.
- Pandey, A.; Chowdary, V.M.; Mal, B.C. Identification of critical erosion prone areas in the small agricultural watershed using USLE, GIS, and remote sensing. Water Resour. Manag. 2007, 21, 729–746. [Google Scholar] [CrossRef]
- Stefanidis, S.; Alexandridis, V.; Ghosal, K. Assessment of water-induced soil erosion as a threat to Natura 2000 protected areas in Crete Island, Greece. Sustainability 2022, 14, 2738. [Google Scholar] [CrossRef]
- Wischmeier, W.H.; Smith, D.D. Rainfall energy and its relationship to soil loss. Eos Trans. Am. Geophys. Union 1958, 39, 285–291. [Google Scholar] [CrossRef]
- Nunes, J.G.; Campos, M.C.C.; Oliveira, F.P.; Nunes, J.C.; Macedo, J.A.B. Soil loss tolerance in southern Amazon. Ambiência 2012, 8, 859–868. [Google Scholar] [CrossRef]
- Silva, A.M. Rainfall erosivity map for Brazil. Catena 2004, 57, 251–259. [Google Scholar] [CrossRef]
- Carvalho Filho, A.D.; Lumbreras, J.F.; Wittern, K.P.; Lemos, A.L.; dos Santos, R.D.; Calderano Filho, B.; de Oliveira, R.P.; Aglio, M.L.D.; de Souza, J.S.; Chaffin, C.E.; et al. Levantamento de Reconhecimento de Baixa Intensidade dos Solos do Estado do Rio de Janeiro; Embrapa Solos: Rio de Janeiro, Brasil, 2003. [Google Scholar]
- Schad, P.; van Huysteen, C.; Michéli, E. World Reference Base for Soil Resources 2014: International Soil Classification System for Naming Soils and Creating Legends for Soil Maps; FAO: Rome, Italy, 2014. [Google Scholar]
- QGIS Development Team. QGIS Geographic Information System; Open Source Geospatial Foundation: Beaverton, OR, USA, 2023; Available online: https://qgis.org (accessed on 8 January 2025).
- GRASS Development Team. Geographic Resources Analysis Support System (GRASS GIS) Software; Open Source Geospatial Foundation: Beaverton, OR, USA, 2023; Available online: https://grass.osgeo.org (accessed on 8 January 2025).
- McCool, D.K.; Brown, L.C.; Foster, G.R.; Mutchler, C.K.; Meyer, L.D. Revised slope steepness factor for the universal soil loss equation. Trans. ASAE 1987, 30, 1387–1396. [Google Scholar] [CrossRef]
- McCool, D.K.; Foster, G.R.; Mutchler, C.K.; Meyer, L.D. Revised slope length factor for the universal soil loss equation. Trans. ASAE 1989, 32, 1571–1576. [Google Scholar] [CrossRef]
- Ruhoff, A.L.; Souza, B.S.P.; Giotto, E.; Pereira, R.S. Avaliação dos processos erosivos através da equação universal de perdas de solos, implementada com algoritmos em LEGAL. Geomática 2006, 1, 12–22. [Google Scholar]
- Ozcan, A.U.; Erpul, G.; Basaran, M.; Erdogan, H.E. Use of USLE/GIS technology integrated with geostatistics to assess soil erosion risk in different land uses of Indagi Mountain Pass—Cankırı, Turkey. Environ. Geol. 2008, 53, 1731–1741. [Google Scholar] [CrossRef]
- Zhang, H.; Zhang, J.; Zhang, S.; Yu, C.; Sun, R.; Wang, D.; Zhu, C.; Zhang, J. Identification of priority areas for soil and water conservation planning based on multi-criteria decision analysis using Choquet Integral. Int. J. Environ. Res. Public Health 2020, 17, 1331. [Google Scholar] [CrossRef]
- Alvares, C.A.; Stape, J.L.; Sentelhas, P.C.; Goncalves, J.L.M.; Sparovek, G. Köppen’s climate classification map for Brazil. Meteorol. Z. 2014, 22, 711–728. [Google Scholar] [CrossRef]
- Beskow, S.; Mello, C.R.; Norton, L.D.; Curi, N.; Viola, M.R.; Avanzi, J.C. Soil erosion prediction in the Grande River Basin, Brazil using distributed modeling. Catena 2009, 79, 49–59. [Google Scholar] [CrossRef]
- Cunha, E.R.; Bacani, V.M.; Panachuk, E. Modeling soil erosion using RUSLE and GIS in a watershed occupied by rural settlement in the Brazilian Cerrado. Nat. Hazards 2017, 85, 851–868. [Google Scholar] [CrossRef]
- Silva, A.M.; Ranzini, M.; Guandique, M.E.G.; Arcova, F.C.S.; Cicco, V. Estudo integrado do processo erosivo numa microbacia experimental localizada no município de Cunha—SP. Geociências 2005, 24, 43–54. [Google Scholar]
- Pandey, S.; Kumar, P.; Zlatić, M.; Nautiyal, R.; Panwar, V.P. Recent advances in assessment of soil erosion vulnerability in a watershed. Int. Soil Water Conserv. Res. 2021, 9, 305–318. [Google Scholar] [CrossRef]
- Teshome, A.; Halefom, A.; Teshome, M.; Ahmad, I.; Taddele, Y.; Dananto, M.; Demisse, S. Soil erosion modelling using GIS and revised universal soil loss equation approach: A case study of Guna-Tana landscape, Northern Ethiopia. Model. Earth Syst. Environ. 2021, 7, 125–134. [Google Scholar] [CrossRef]
- Uddin, K.; Murthy, M.S.R.; Wahid, S.M.; Matin, M.A. Estimation of soil erosion dynamics in the Koshi Basin using GIS and remote sensing to assess priority areas for conservation. PLoS ONE 2016, 11, e0150494. [Google Scholar] [CrossRef]
- Raj, A.D.; Kumar, S.; Sooryamol, K.R. Modelling climate change impact on soil loss and erosion vulnerability in a watershed of Shiwalik Himalayas. Catena 2022, 214, 106279. [Google Scholar] [CrossRef]
- Assouline, S.; Ben-Hur, M. Effects of rainfall intensity and slope gradient on the dynamics of interrill erosion during soil surface sealing. Catena 2006, 66, 211–220. [Google Scholar] [CrossRef]
- Weiler, E.B.; Tamiosso, M.F.; Cruz, J.C.; Reichert, J.M.; Schorr, L.P.B.; Mantovanelli, B.C.; Santos, F.D.; Fantinel, R.A.; Baumhardt, E. Integrated Environmental Management and Planning based on Soil Erosion Susceptibility Scenarios. An. Da Acad. Bras. De Ciências 2021, 93, e20191120. [Google Scholar] [CrossRef] [PubMed]
- Colman, C.B.; Garcia, K.M.P.; Pereira, R.B.; Shinma, E.A.; Lima, F.E.; Gomes, A.O.; Oliveira, P.T.S. Different approaches to estimate the sediment yield in a tropical watershed. Rev. Bras. Recur. Hídricos 2018, 23, e47. [Google Scholar] [CrossRef]
- Silva, M.M.; Oliveira, F.A.; Santana, A.C. Mudanças na dinâmica de uso das florestas secundárias em Altamira, Estado do Pará, Brasil. Rev. Ciênc. Agrár. 2015, 58, 176–183. [Google Scholar] [CrossRef]
- Saha, S.; Sarkar, D.; Mondal, P. Assessing and mapping soil erosion risk zone in Ratlam District, central India. Reg. Sustain. 2022, 3, 373–390. [Google Scholar] [CrossRef]
- Silva, R.M.; Montenegro, S.M.G.L.; Santos, C.A.G. Integration of GIS and remote sensing for estimation of soil loss and prioritization of critical sub-catchments: A case study of Tapacurá catchment. Nat. Hazards 2012, 62, 953–970. [Google Scholar] [CrossRef]


Disclaimer/Publisher’s Note: The statements, opinions and data contained in all publications are solely those of the individual author(s) and contributor(s) and not of MDPI and/or the editor(s). MDPI and/or the editor(s) disclaim responsibility for any injury to people or property resulting from any ideas, methods, instructions or products referred to in the content. |
© 2025 by the authors. Licensee MDPI, Basel, Switzerland. This article is an open access article distributed under the terms and conditions of the Creative Commons Attribution (CC BY) license (https://creativecommons.org/licenses/by/4.0/).