
Assessing River Corridor Stability and Erosion Dynamics in the Mekong Delta: Implications for Sustainable Management

 ,
, 
 ,
,  ,
, 

Abstract
1. Introduction
- Class I and II waterways: 50 m from the riverbank edge on each side.
- Class III and IV waterways: 30 m from the riverbank edge on each side.
- Class V and VI waterways: 20 m from the riverbank edge on each side.
- Drainage canals and ditches:
- Waterways wider than 15 m: 10 m from the riverbank edge on each side.
- Waterways between 5 and 15 m wide: 7 m from the riverbank edge on each side.
- Waterways narrower than 5 m: 5 m from the riverbank edge on each side.
- Waterways narrower than 5 m with embankments: 3 m from the riverbank edge on each side.
2. Materials and Methods
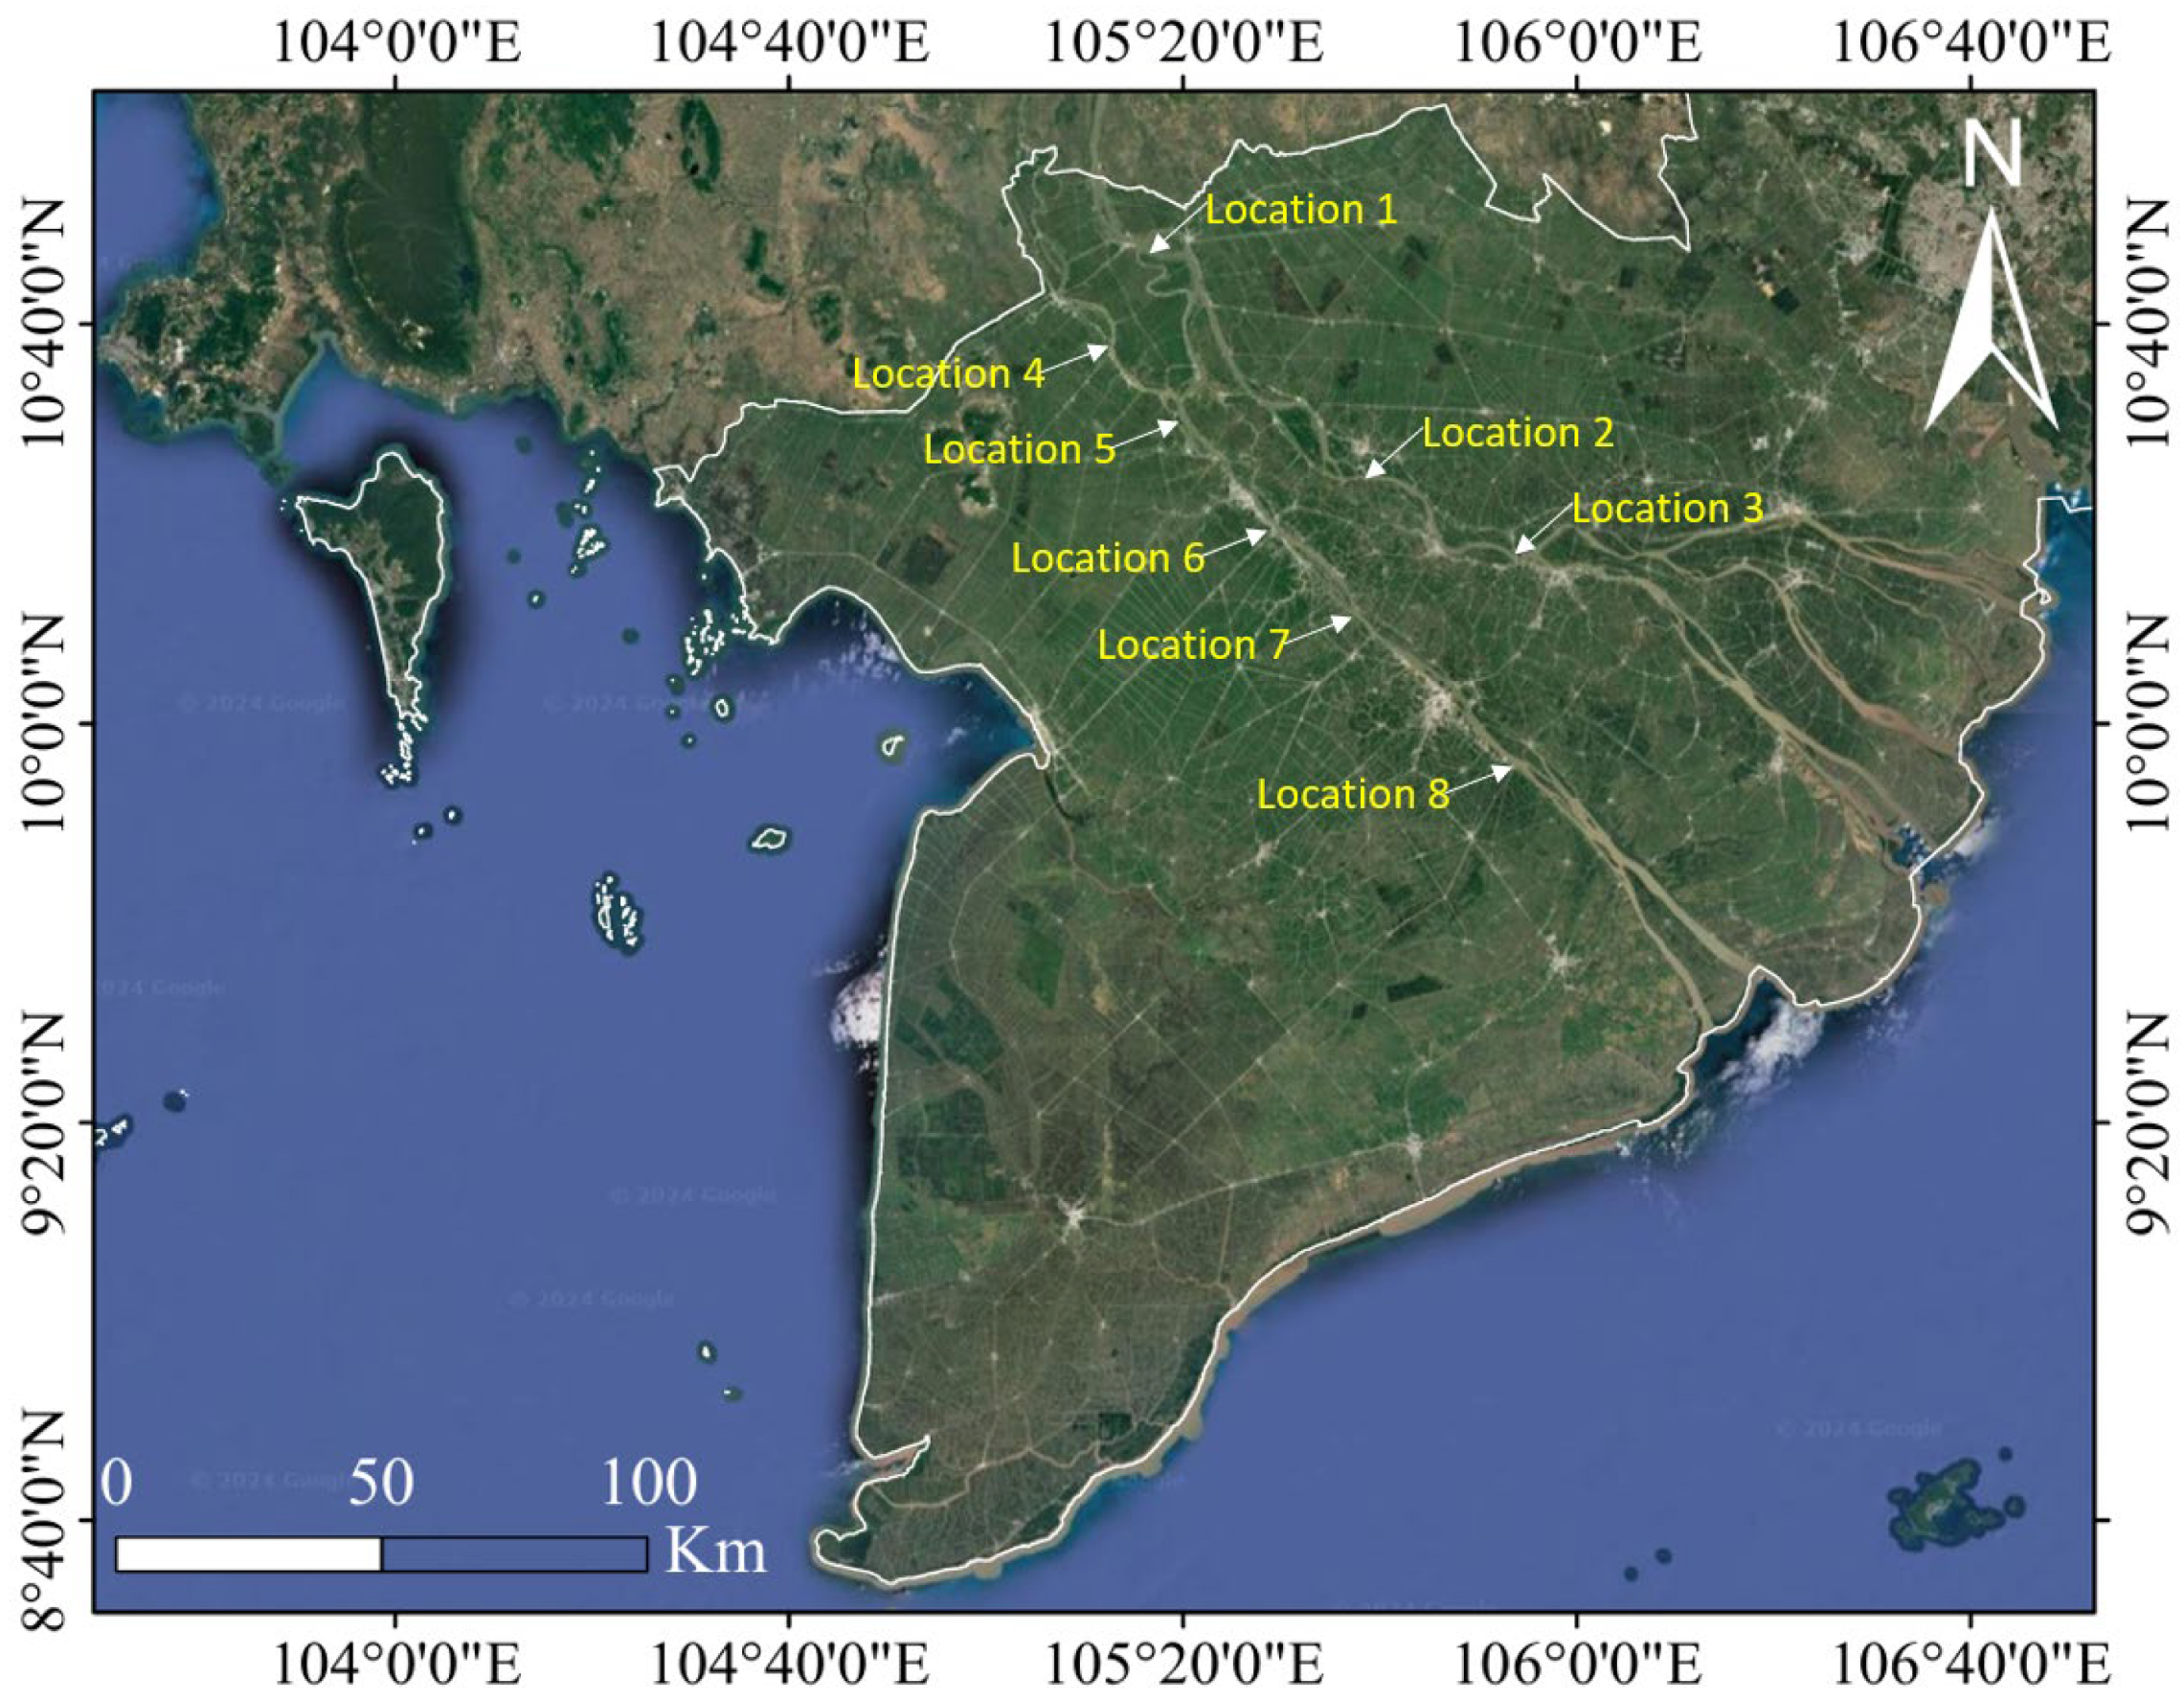
2.1. Study Area
2.2. Remote Sensing Image Analysis
2.3. Assessment of Shoreline and Riverbank Dynamics
2.4. Determination of River Safety Corridor
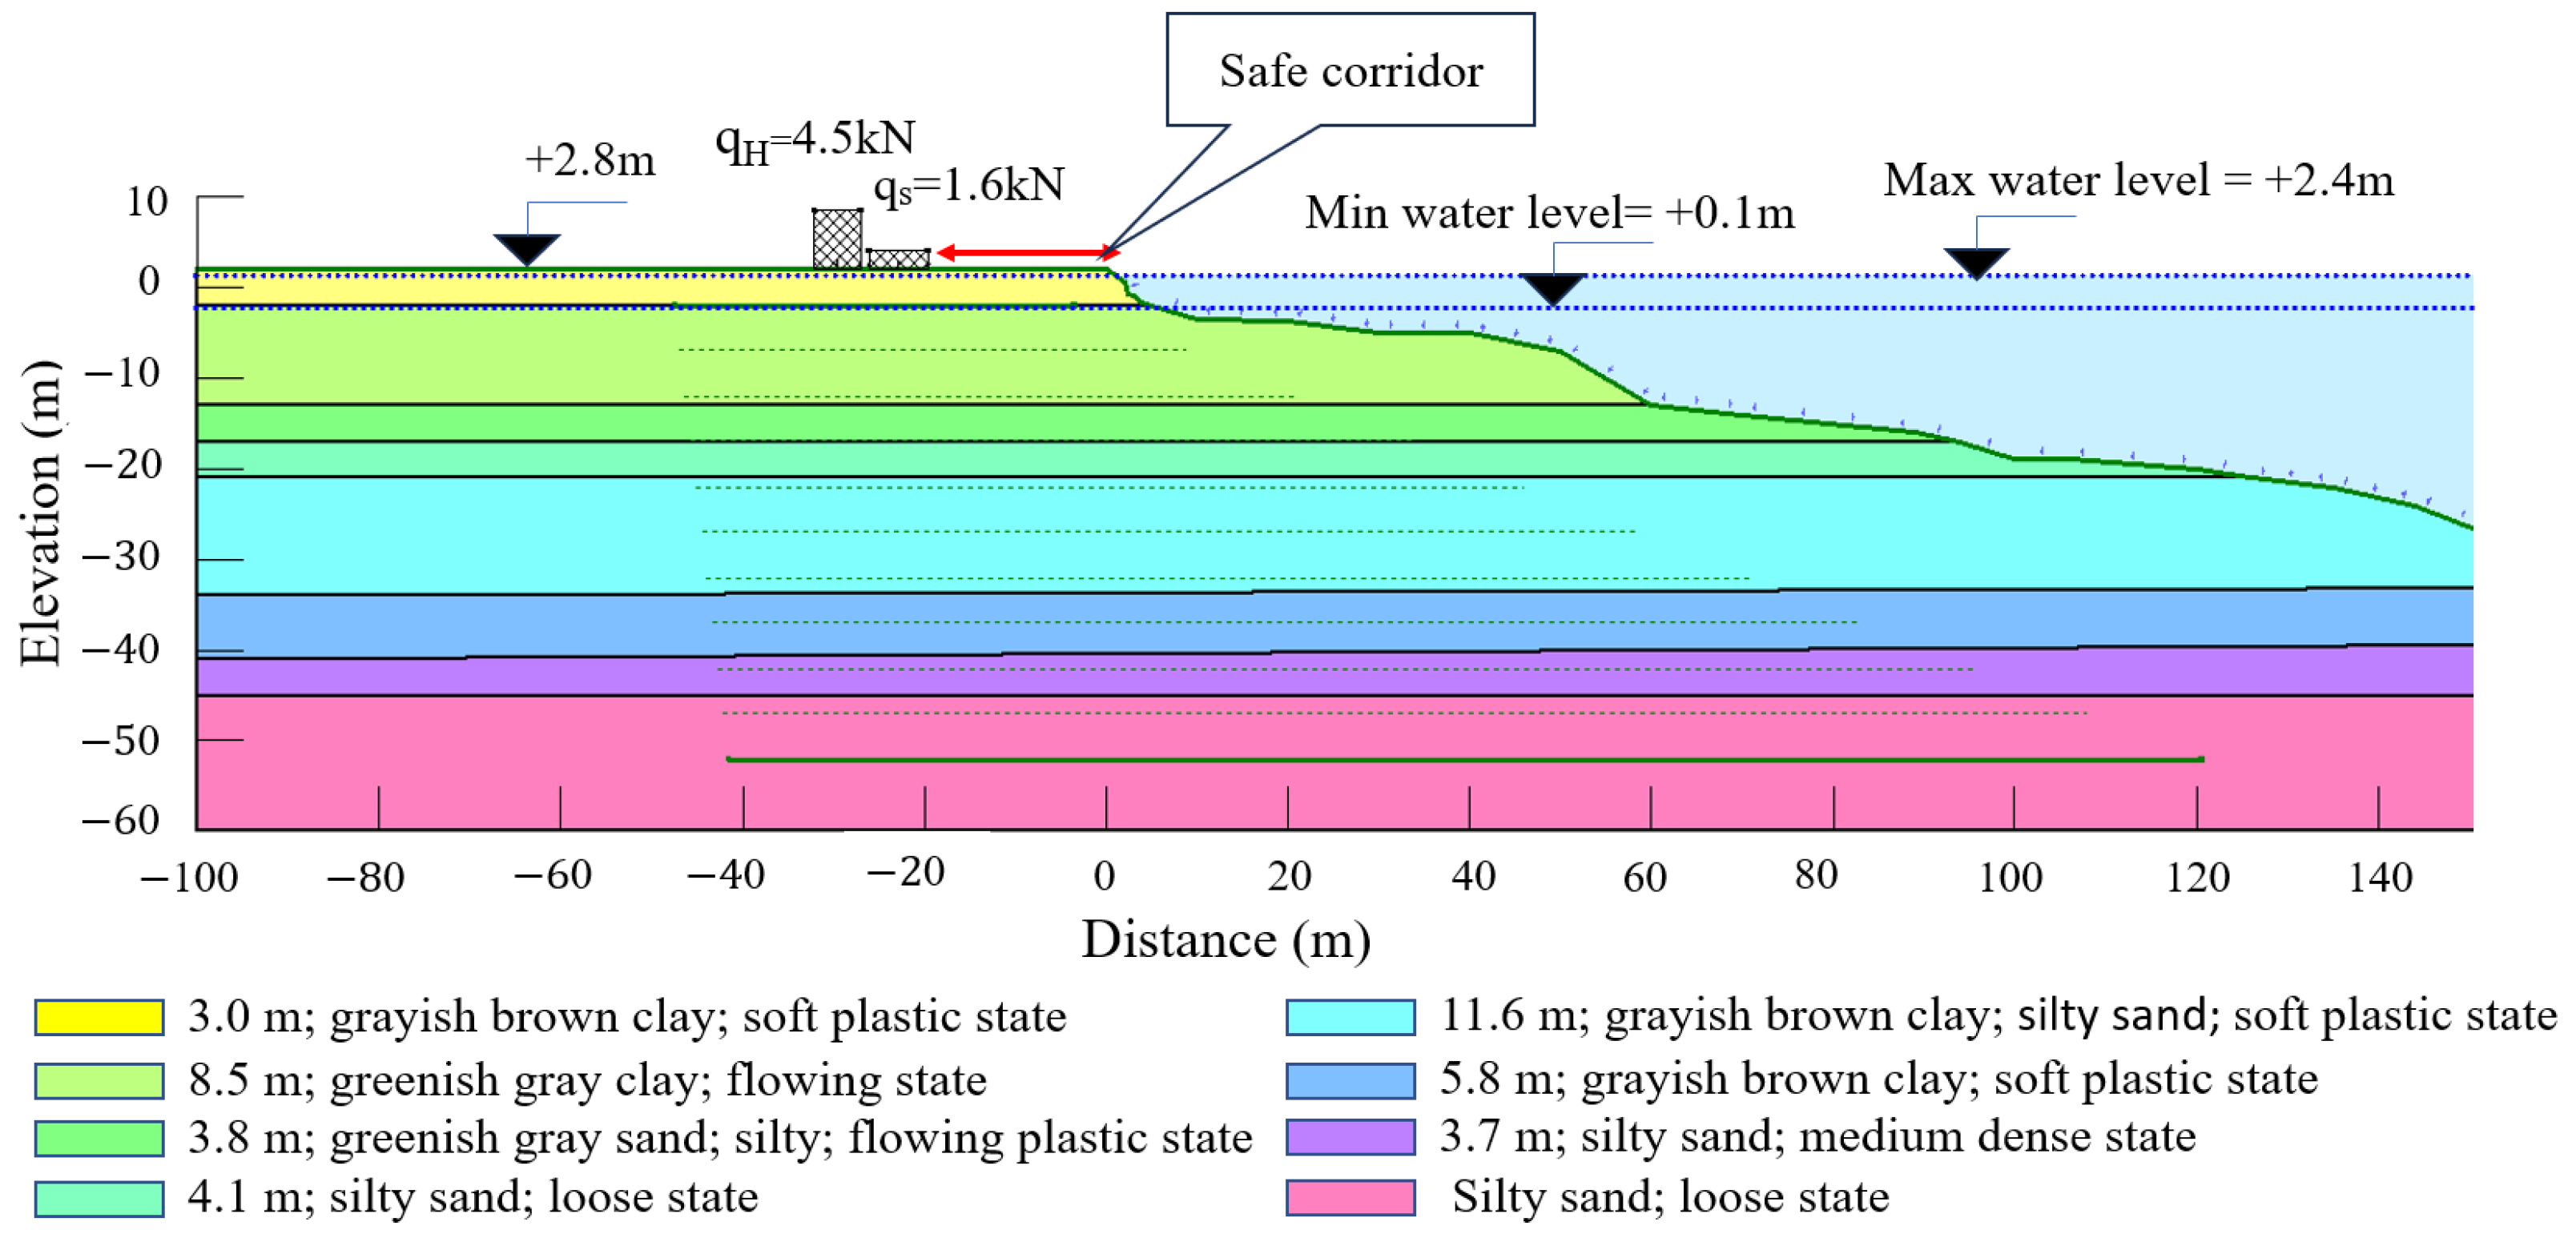
2.5. Riverbank Stability Assessment
- In Dong Thap (Cao Lanh station): the minimum water level is at an elevation of −0.15 m, and the maximum water level is at an elevation of +2.2 m;
- In Vinh Long (My Thuan station): the minimum water level is at an elevation of −0.6 m, and the maximum water level is at an elevation of +1.3 m;
- In An Giang (Long Xuyen station): the minimum water level is at an elevation of −0.55 m, and the maximum water level is at an elevation of +2.4 m;
- In Can Tho (Can Tho station): the minimum water level is at an elevation of −0.2 m, and the maximum water level is at an elevation of +1.4 m;
- In Soc Trang (Đai Ngai station): the minimum water level is at an elevation of −0.8 m, and the maximum water level is at an elevation of +0.6 m.

| Case | No Surcharge Load | Surcharge Loads of Houses and Roads | Consideration of LSCR | No LSCR Consideration | Proposed LSCR |
|---|---|---|---|---|---|
| 1 | ✓ | ||||
| 2 | ✓ | ✓ | |||
| 3 | ✓ | ✓ | |||
| 4 | ✓ | ✓ |
3. Results
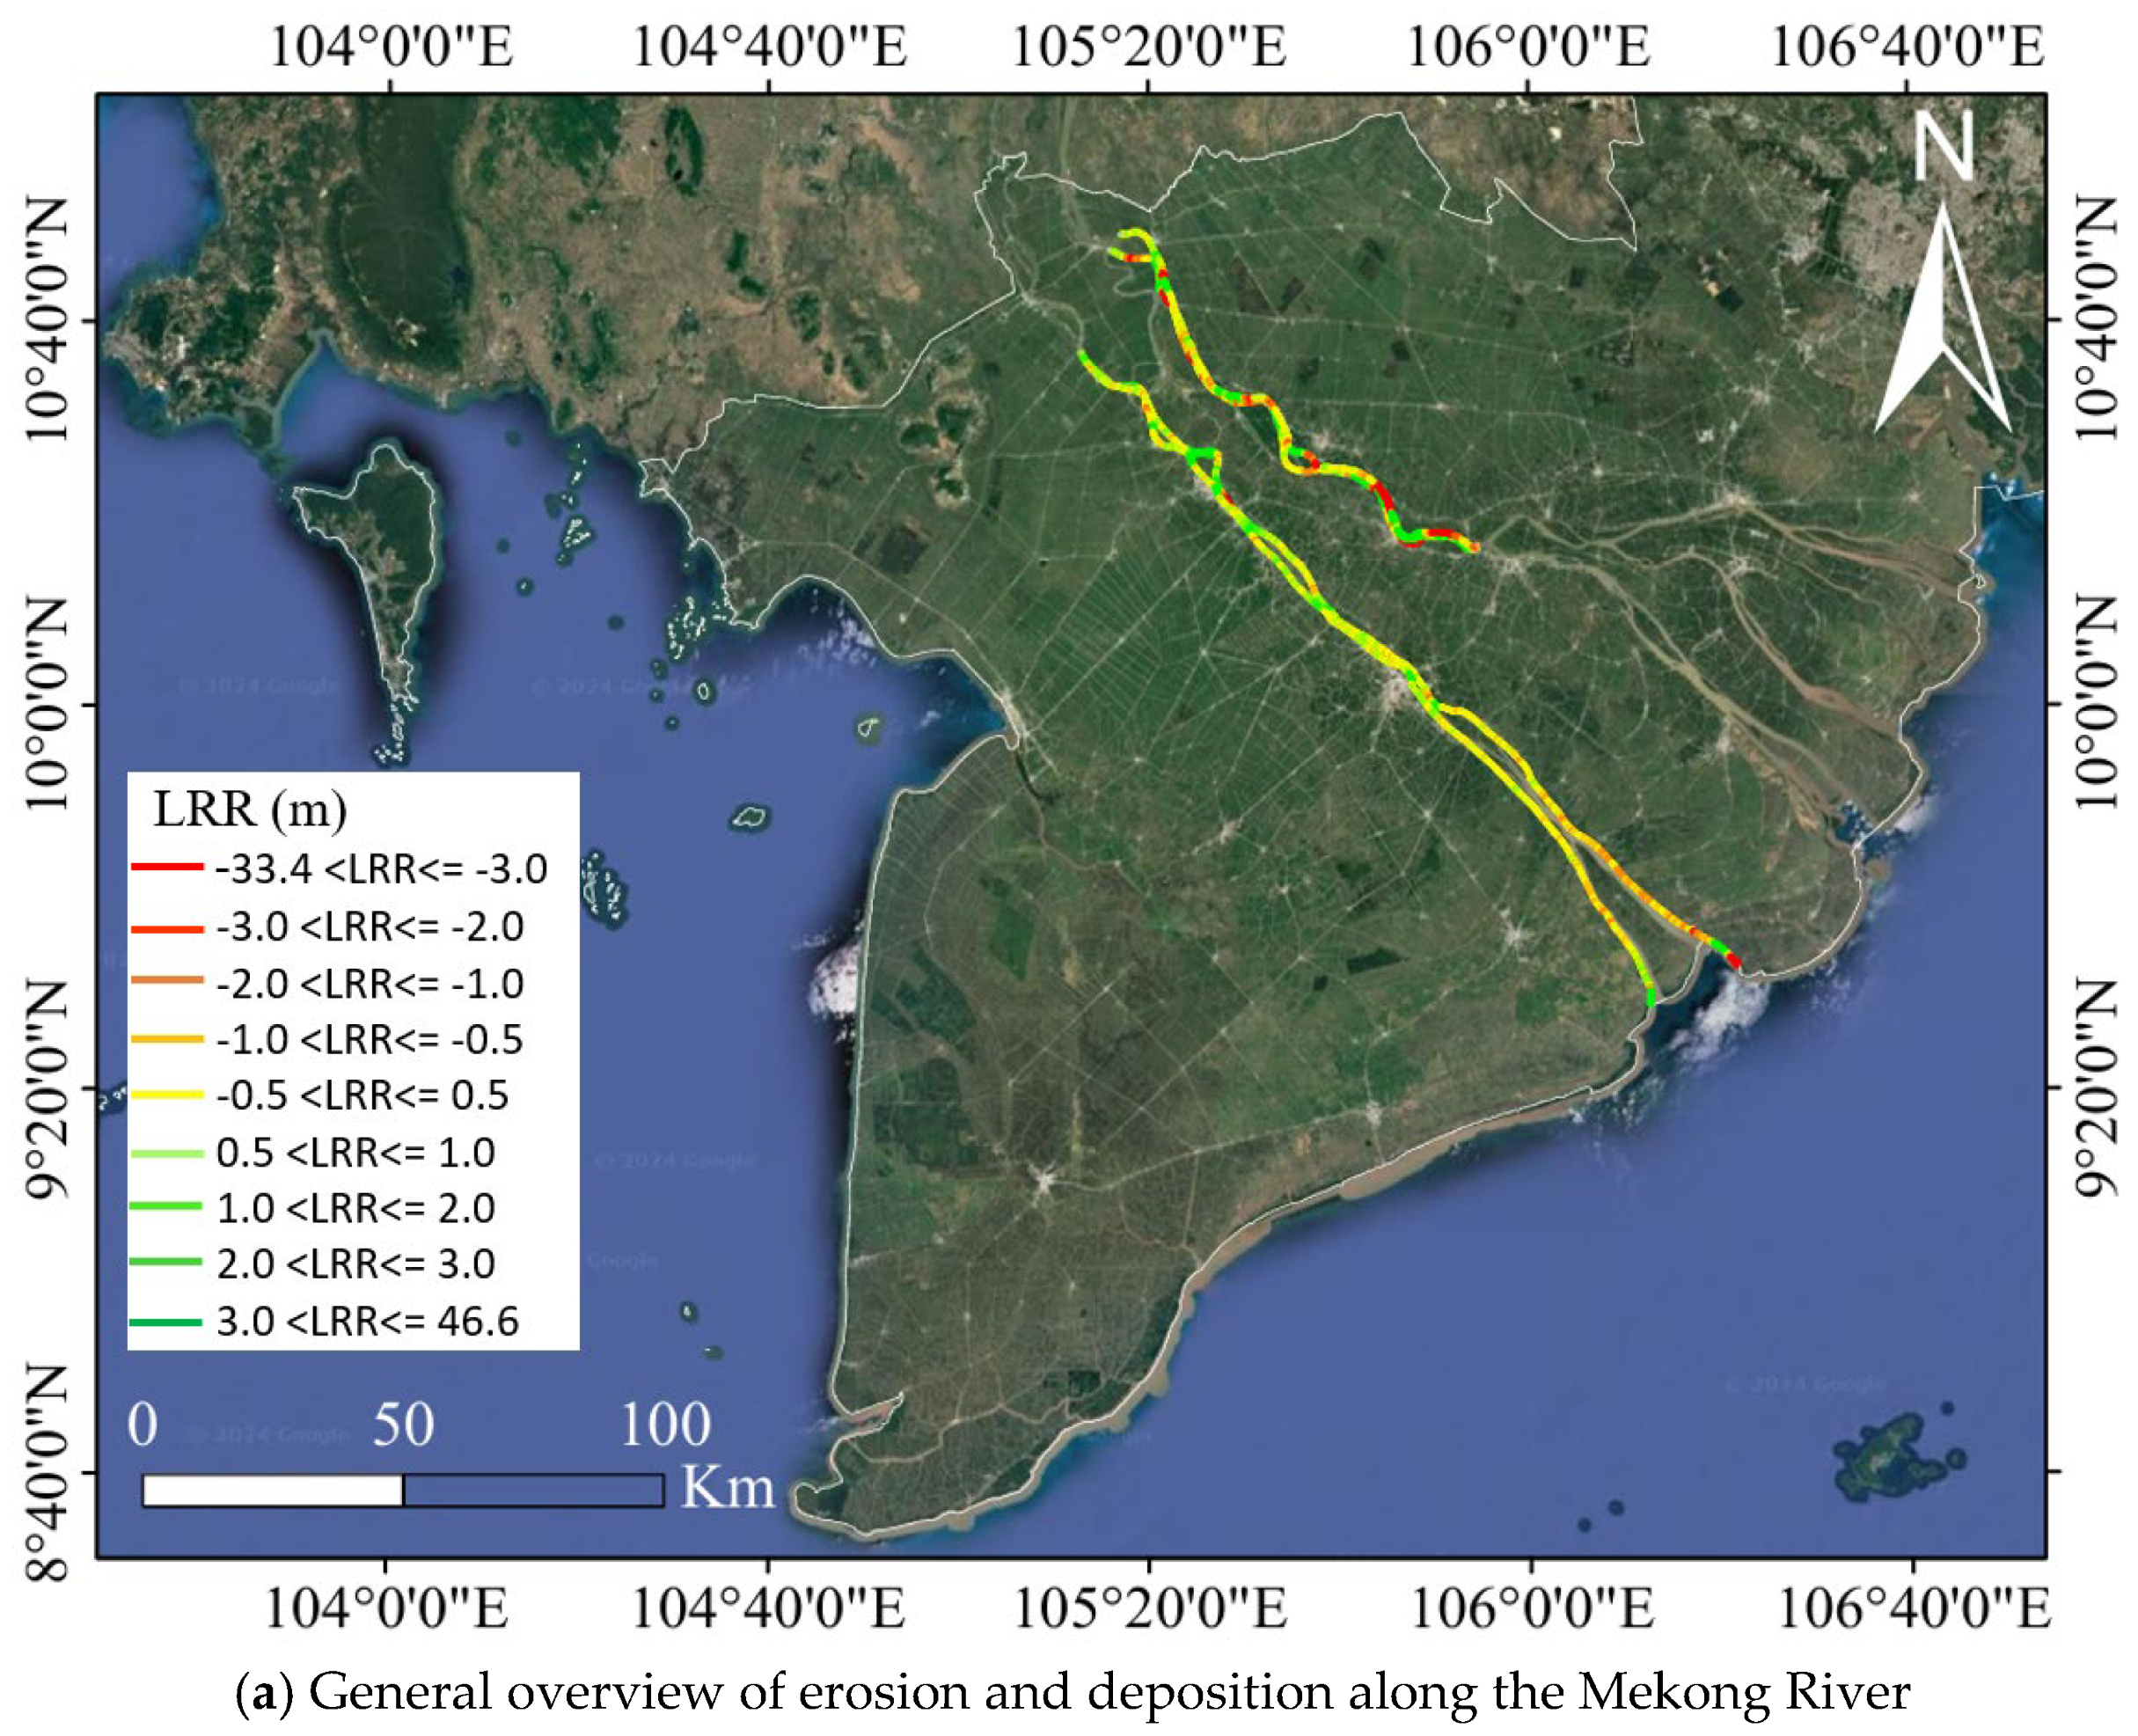
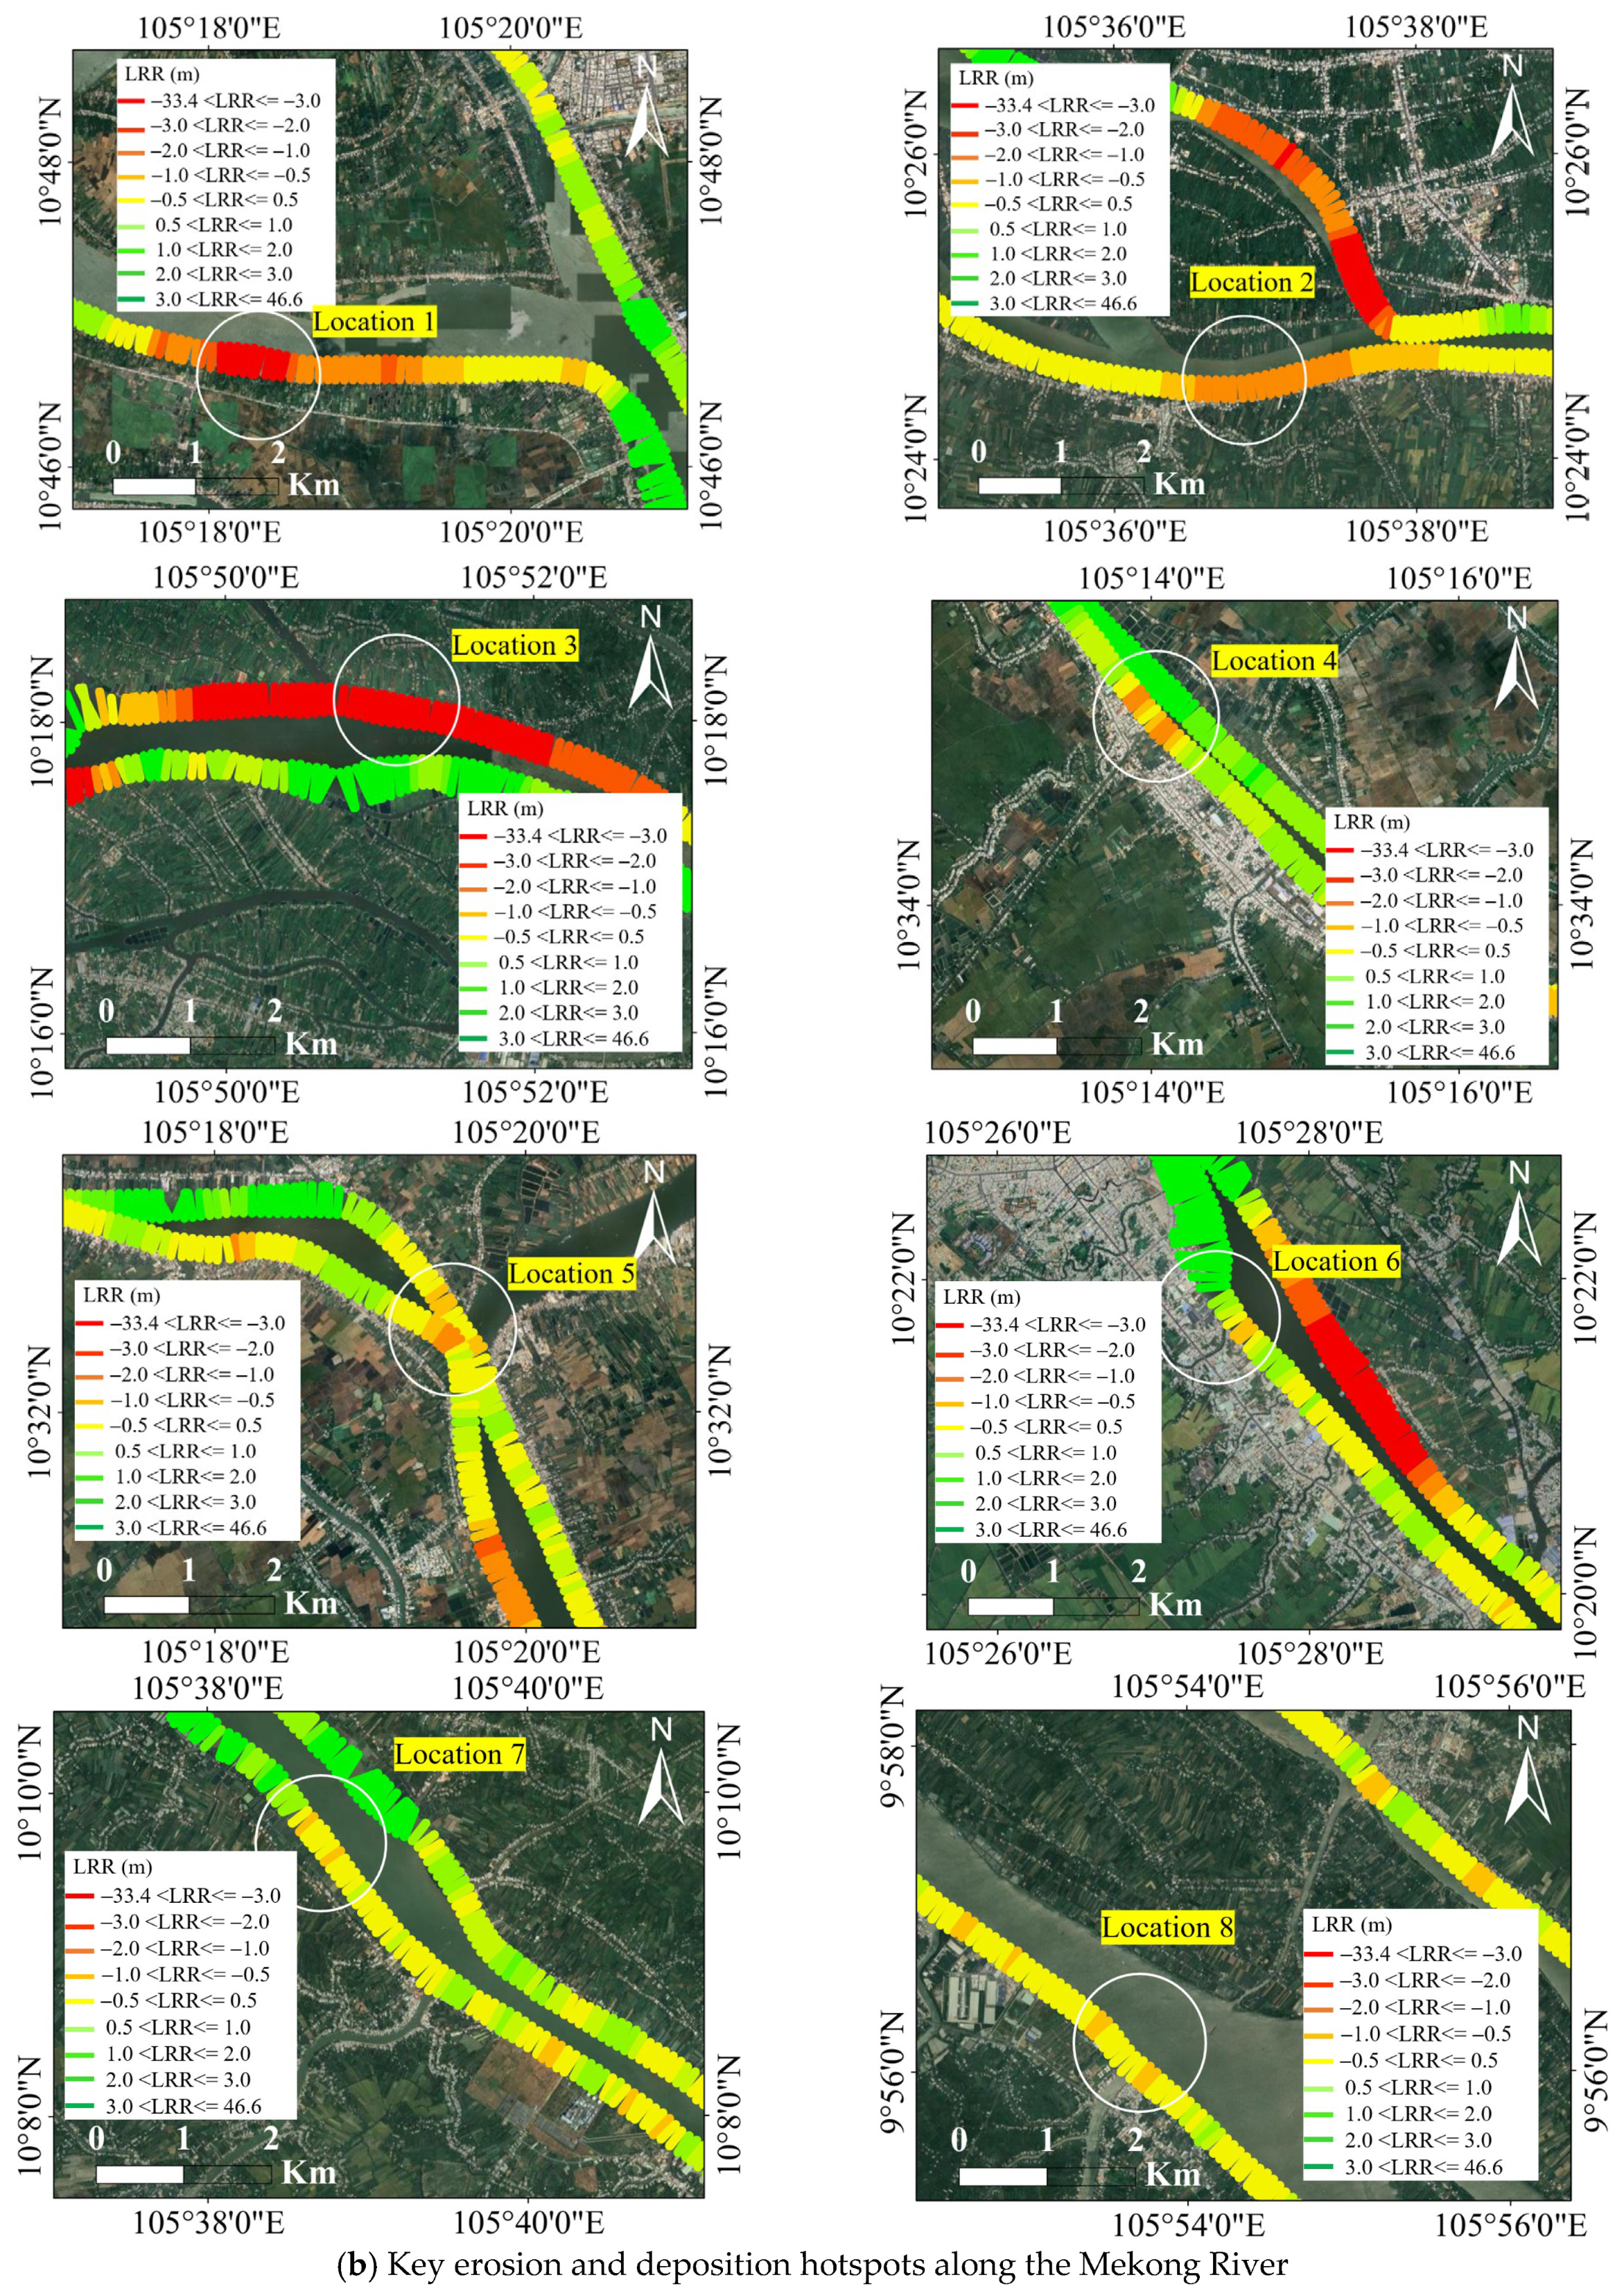
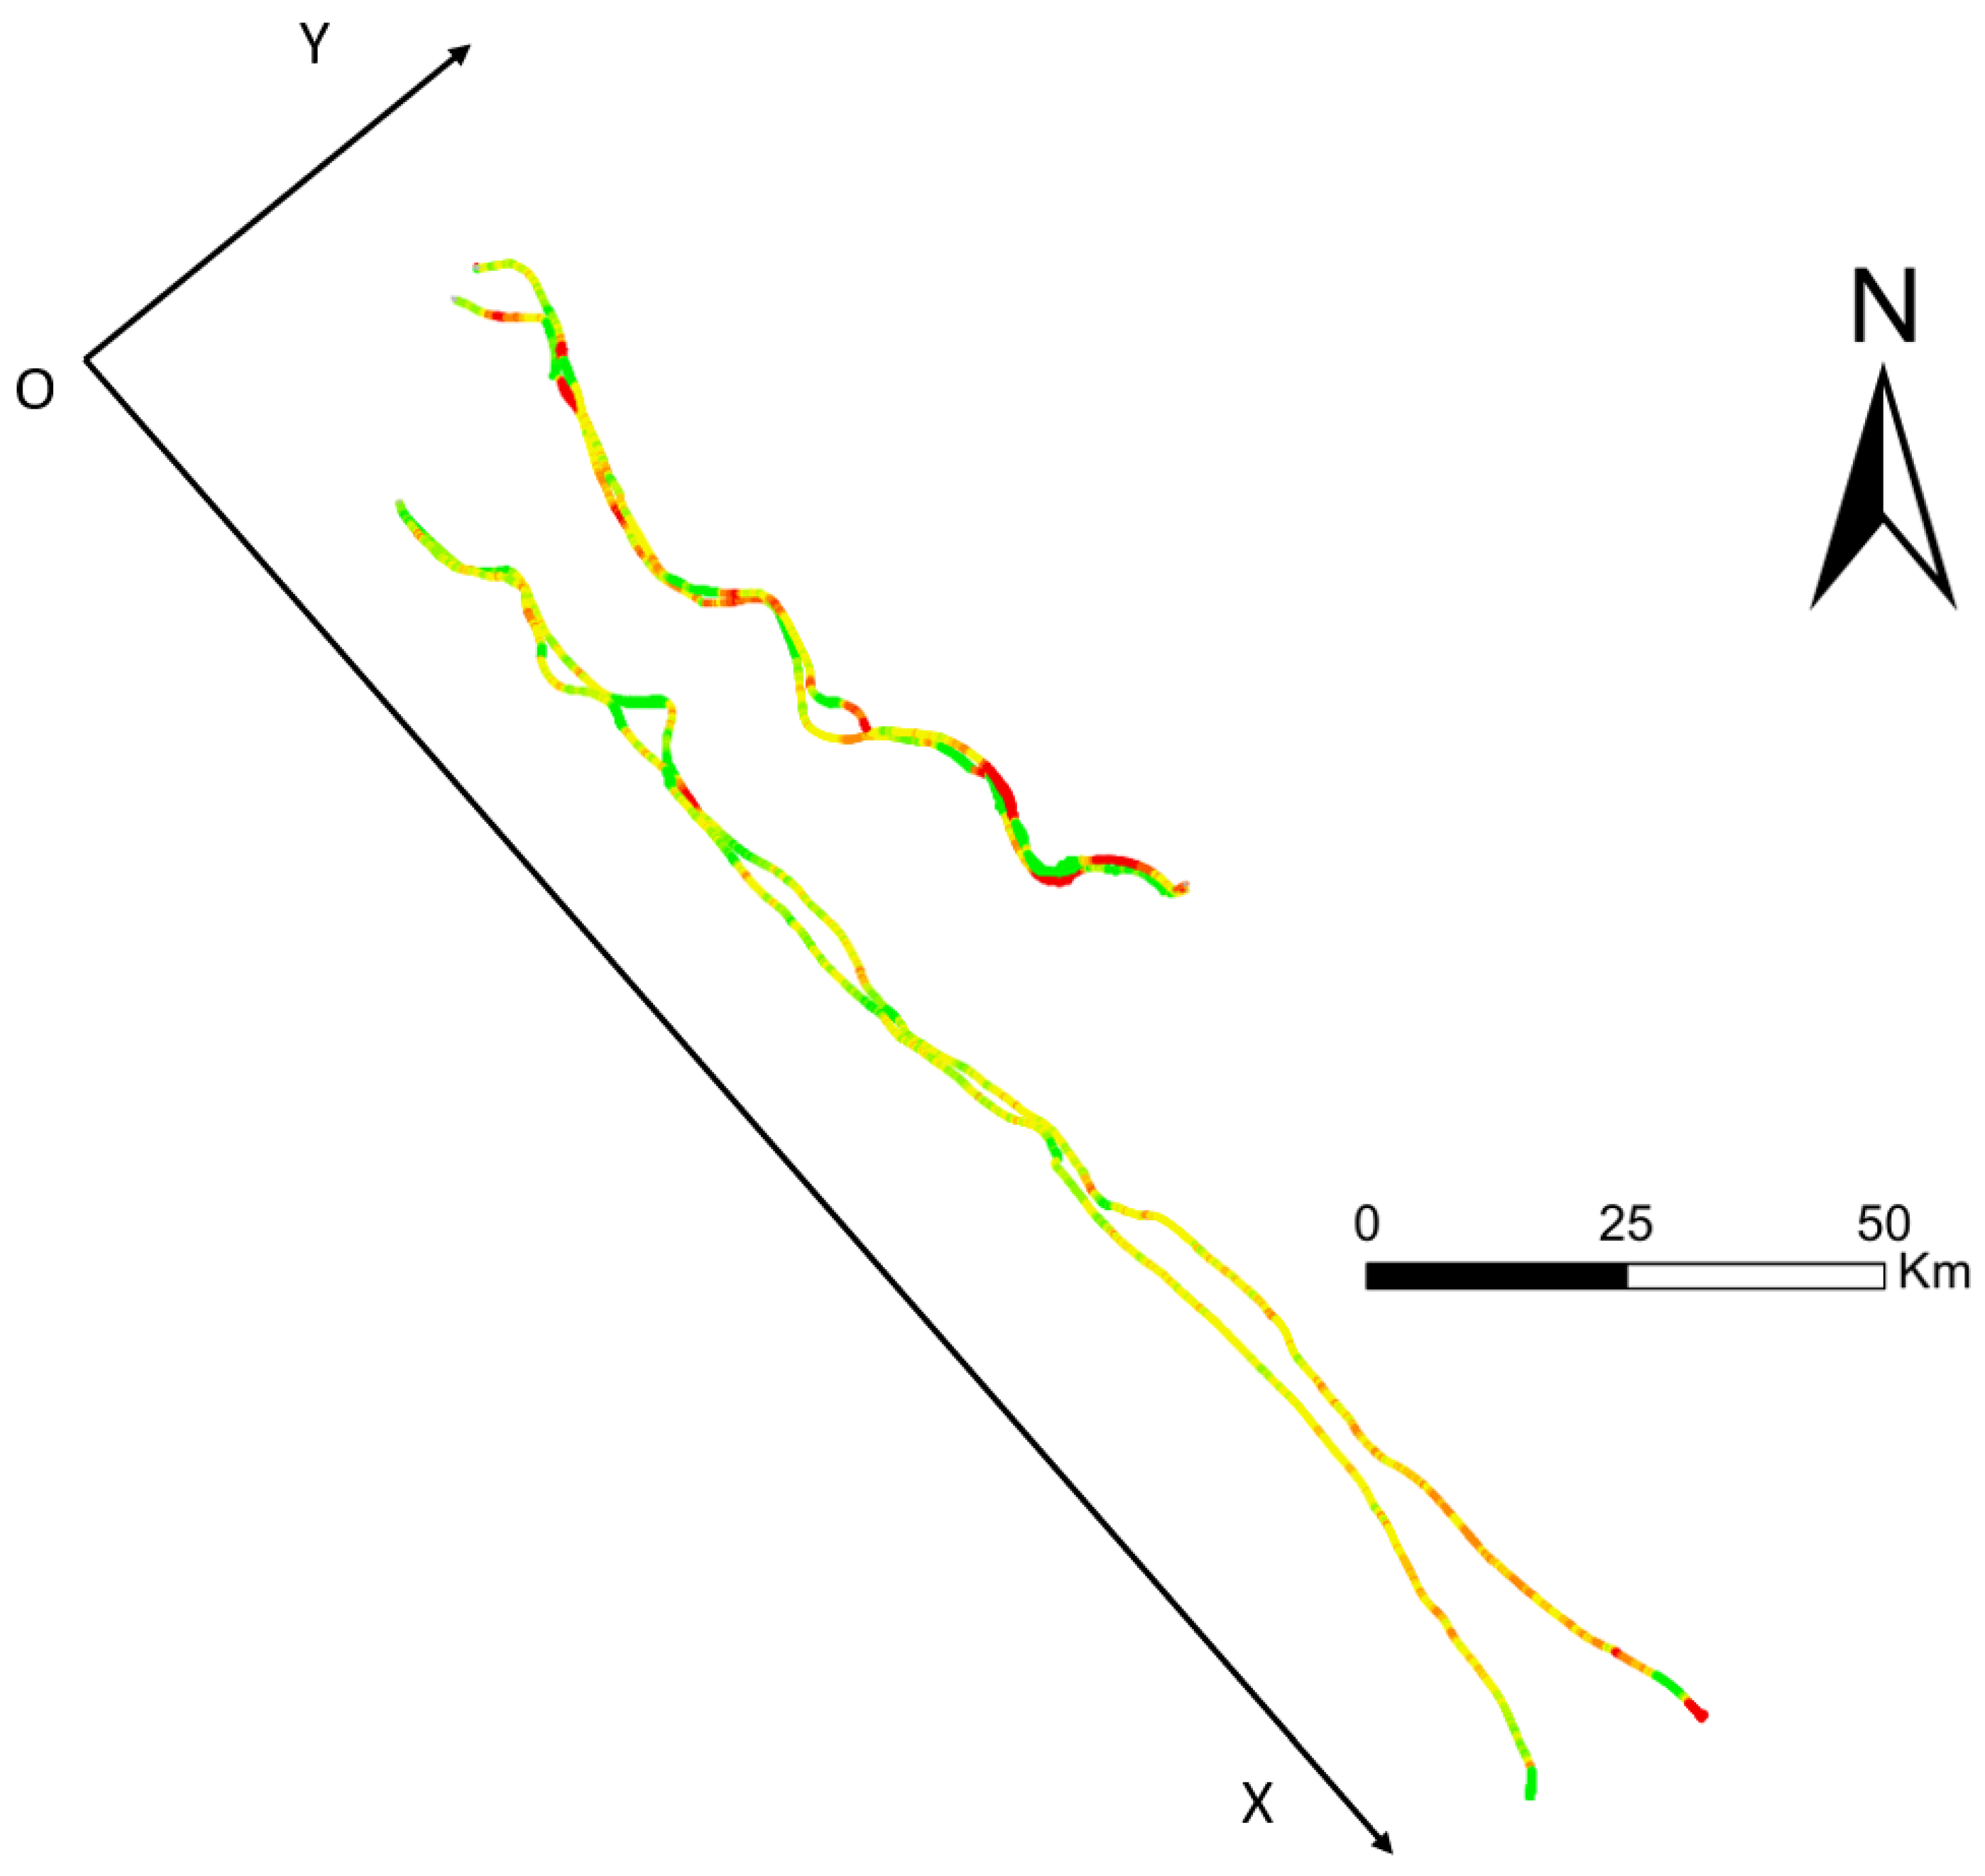
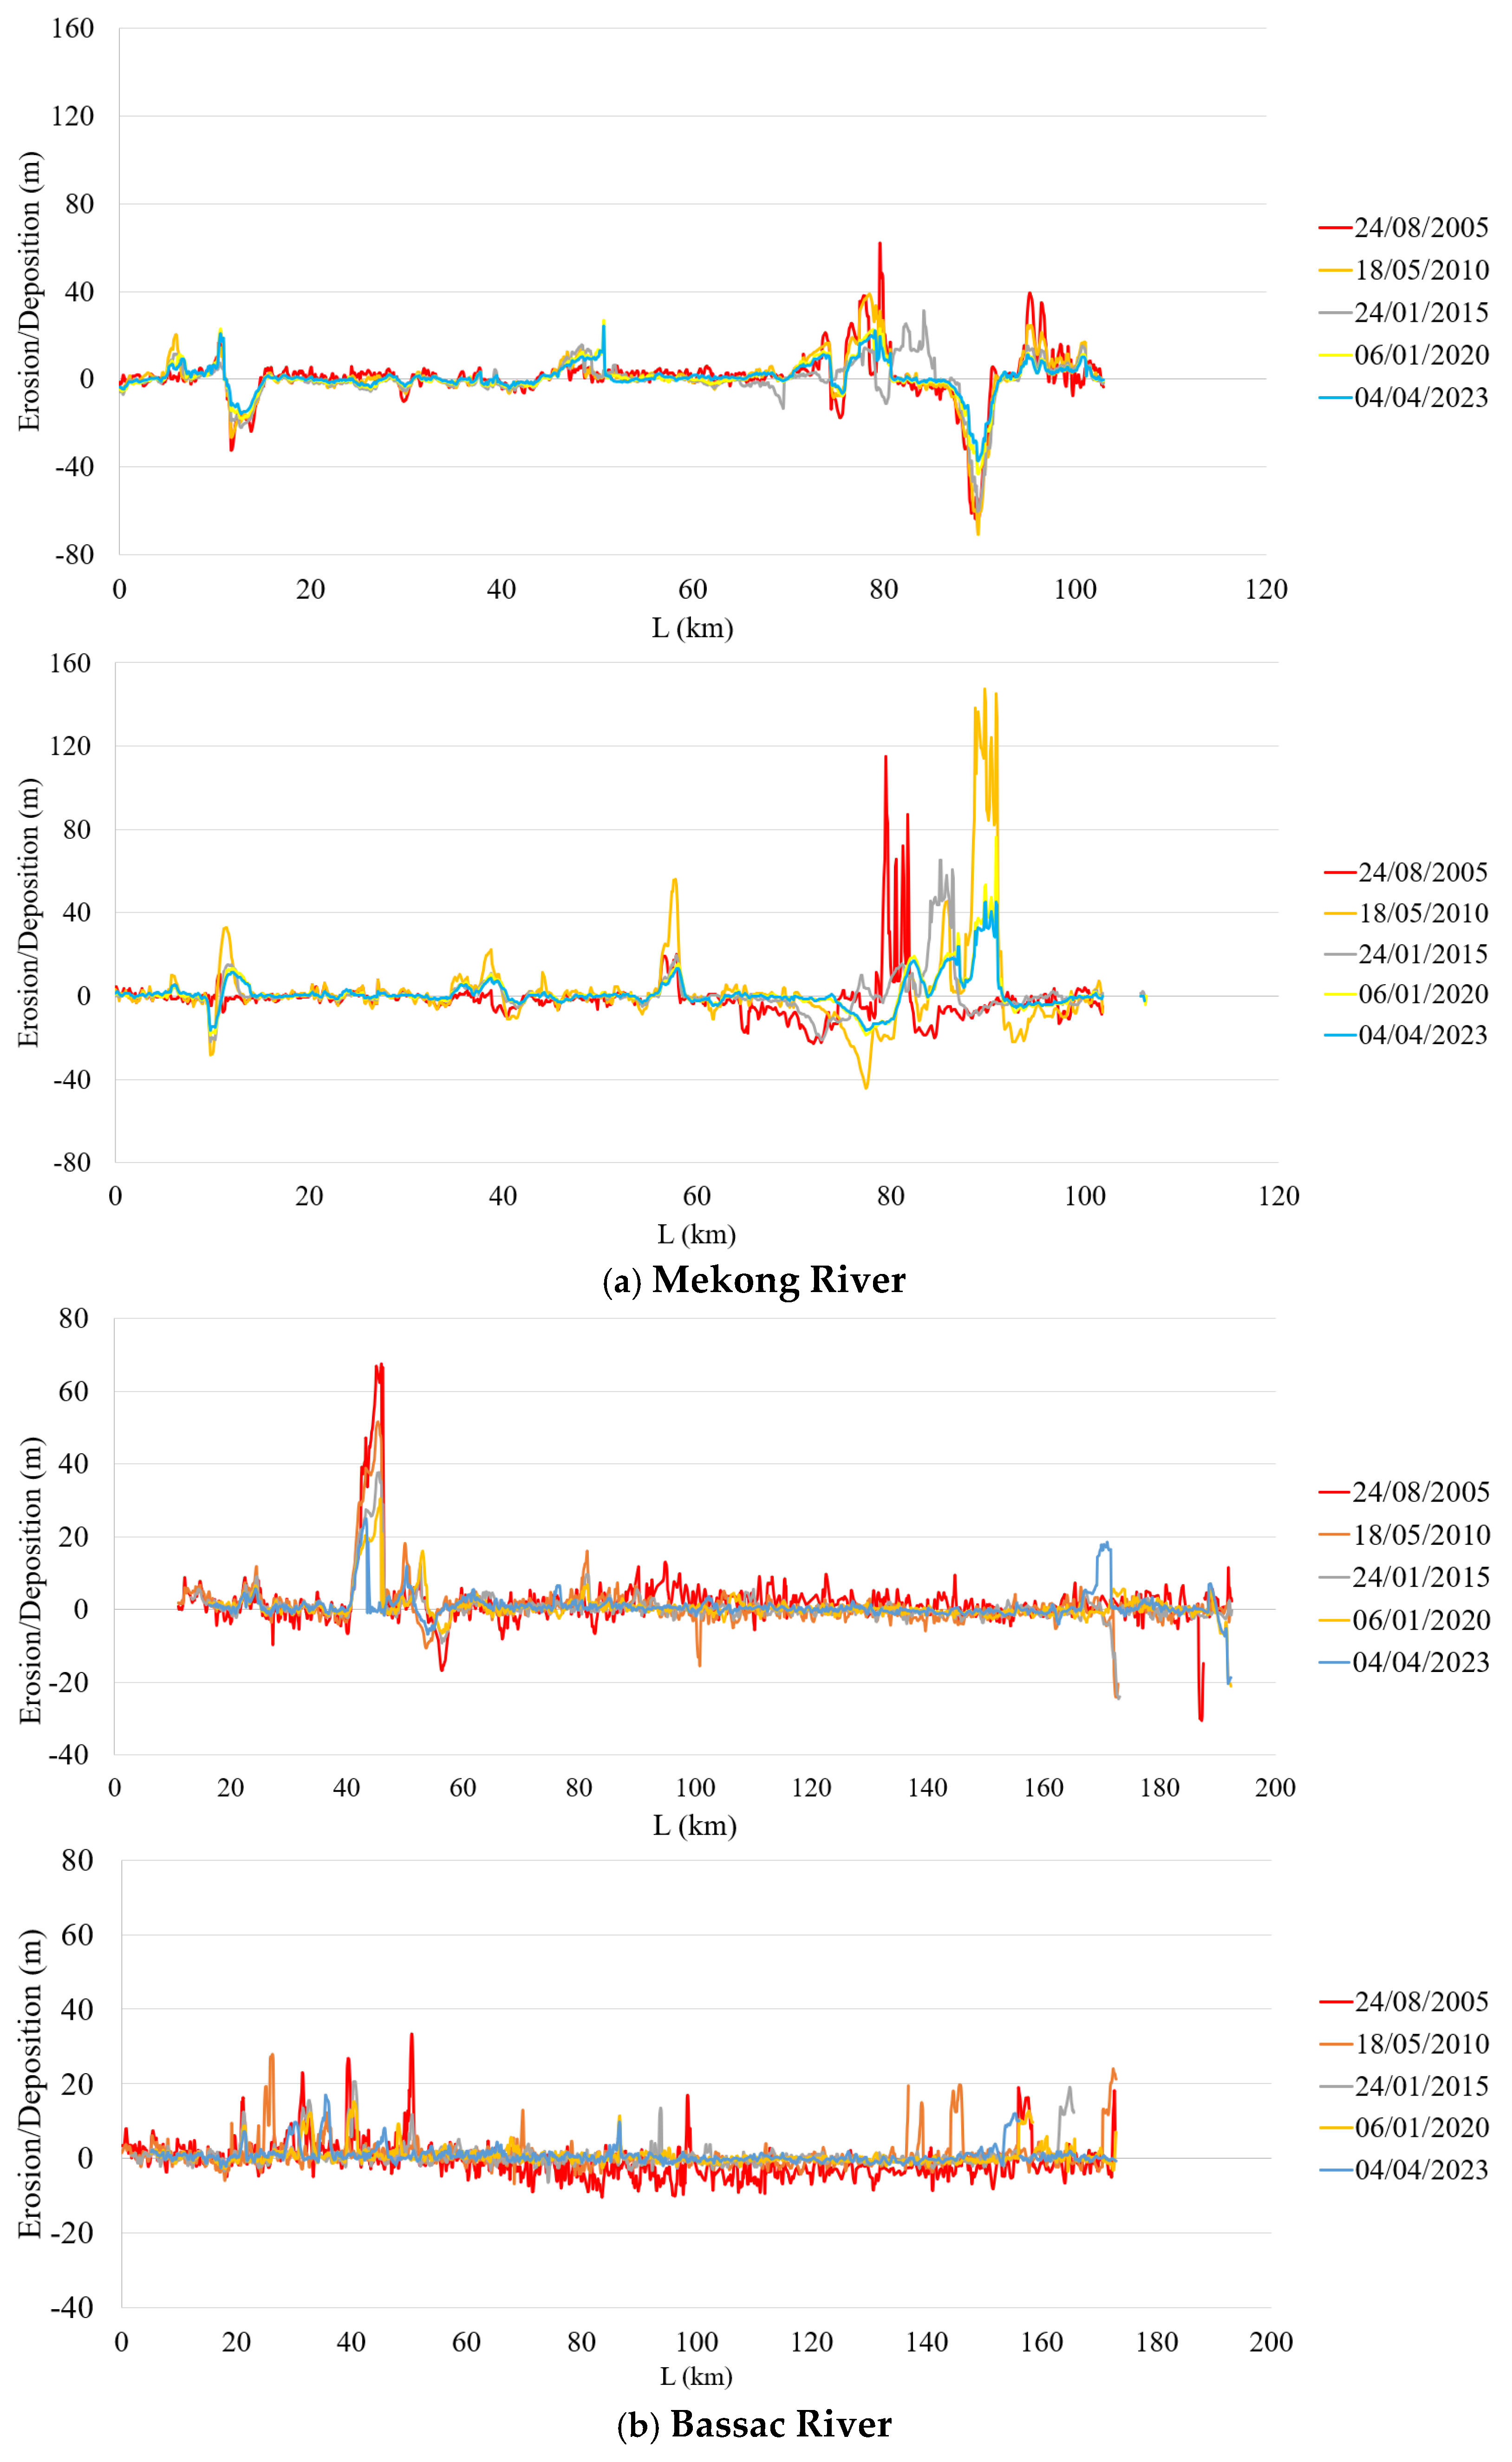
3.1. Erosion/Deposition Dynamics Along the Two Rivers
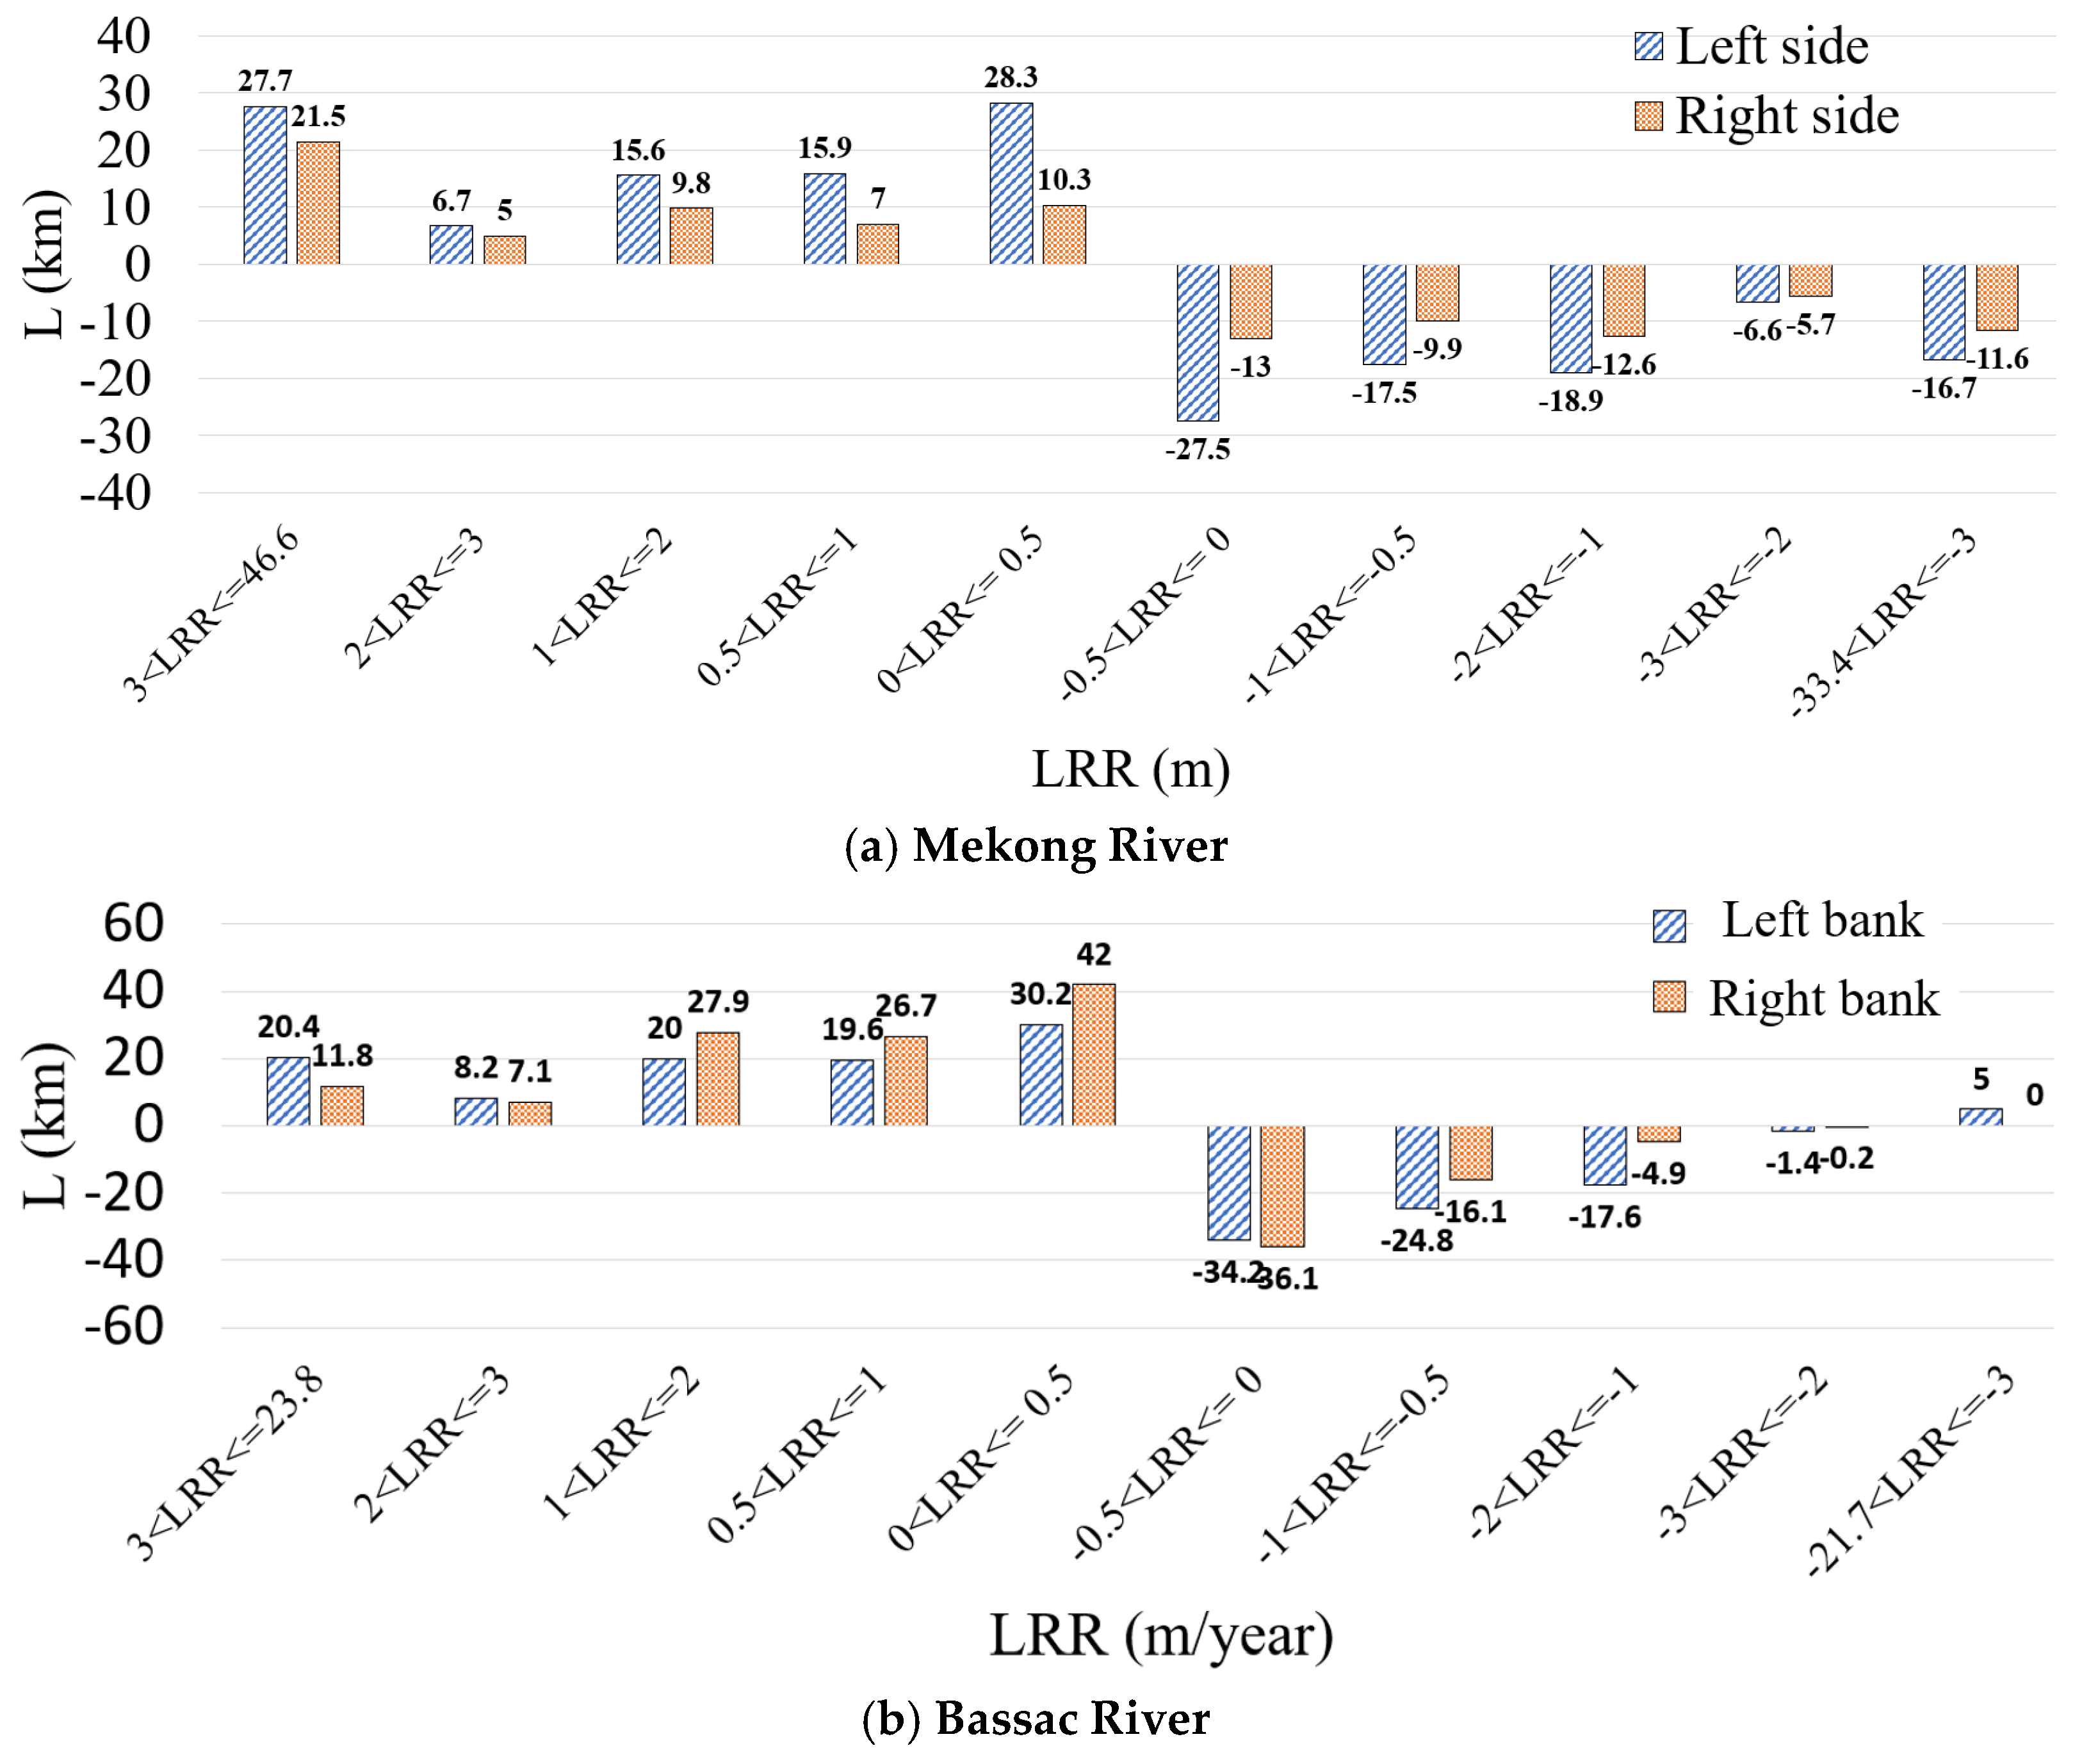
3.2. Annual Erosion/Deposition Rate and Trend (2000–2023)
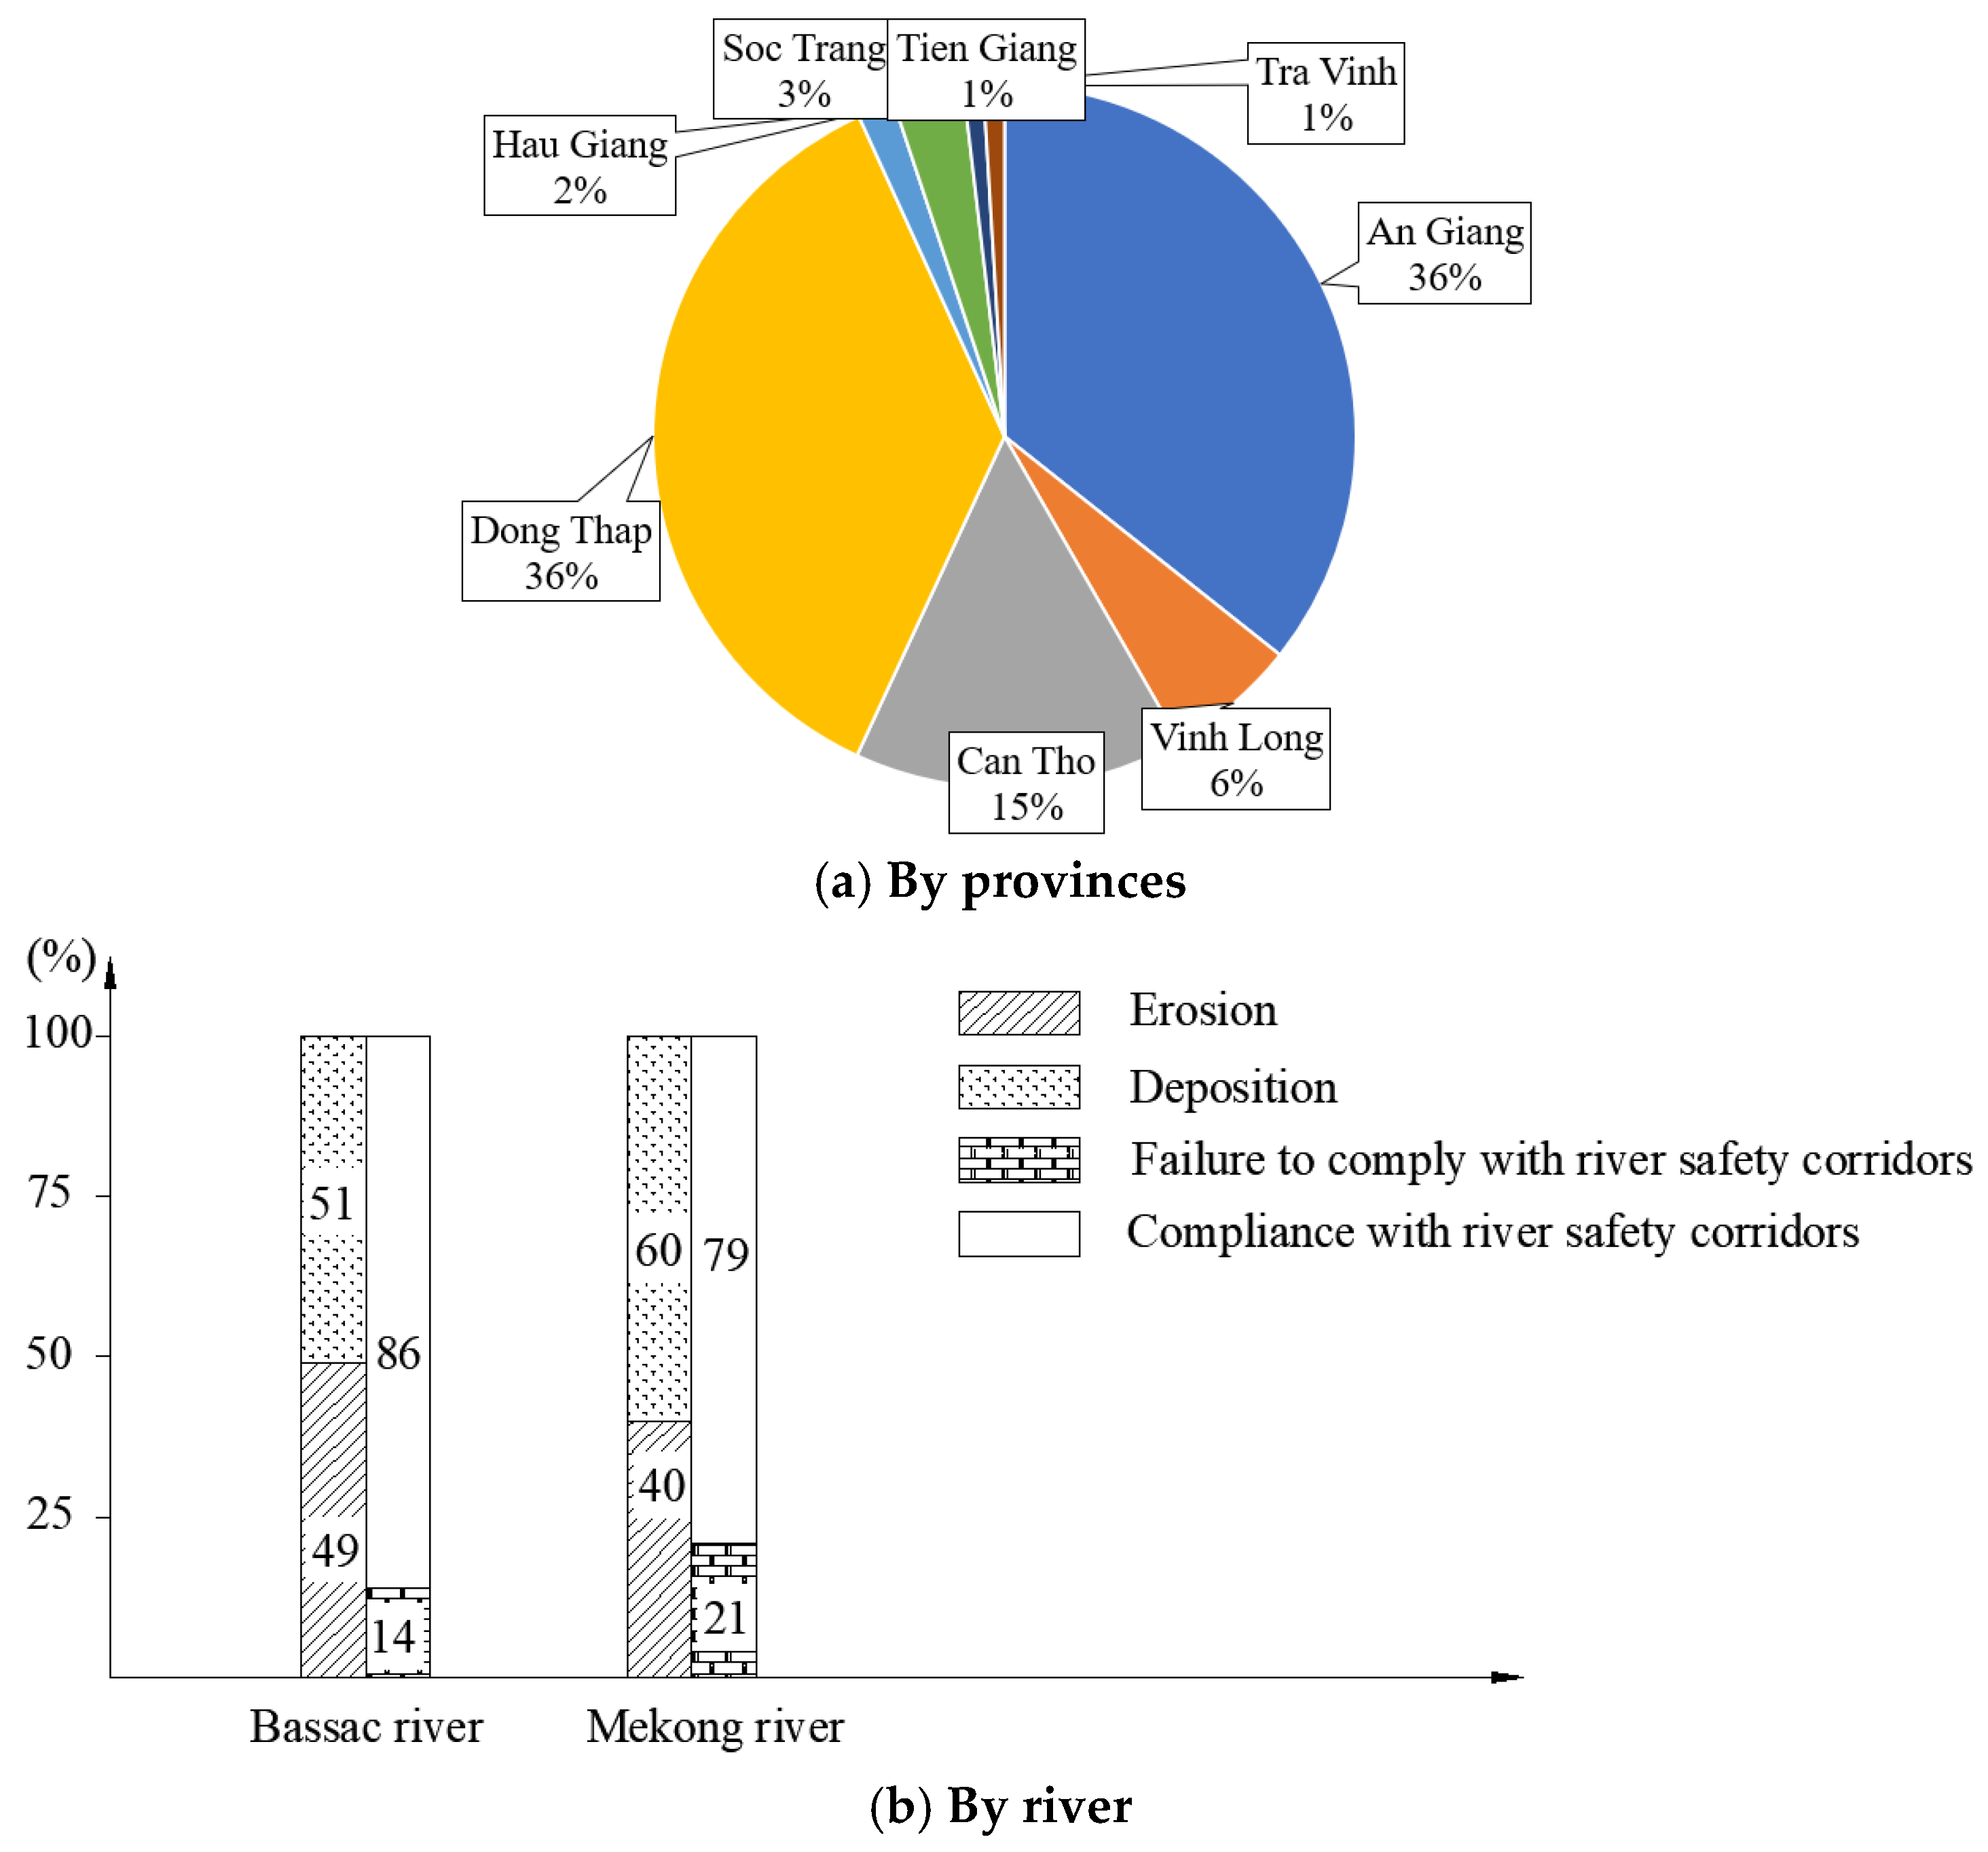
3.3. Current Status of River Safety Corridor (2000–2023)
4. Discussion
5. Conclusions
Author Contributions
Funding
Institutional Review Board Statement
Informed Consent Statement
Data Availability Statement
Acknowledgments
Conflicts of Interest
References
- Wohl, E. An integrative conceptualization of floodplain storage. Rev. Geophys. 2021, 59, e2020RG000724. [Google Scholar] [CrossRef]
- Tri, V.P.D.; Yarina, L.; Nguyen, H.Q.; Downes, N.K. Progress toward resilient and sustainable water management in the Vietnamese Mekong Delta. Wiley Interdiscip. Rev. Water 2023, 10, e1670. [Google Scholar] [CrossRef]
- Kondolf, G.M.; Rubin, Z.K.; Minear, J. Dams on the Mekong: Cumulative sediment starvation. Water Resour. Res. 2014, 50, 5158–5169. [Google Scholar] [CrossRef]
- Yoshida, Y.; Lee, H.S.; Bui, T.H.; Tran, H.-D.; Maharjan, K.L.; Kakar, K.; Xuan, T.D. Impacts of mainstream hydropower dams on fisheries and agriculture in lower Mekong Basin. Sustainability 2020, 12, 2408. [Google Scholar] [CrossRef]
- Baig, M.R.I.; Ahmad, I.A.; Shahfahad; Tayyab, M.; Rahman, A. Analysis of shoreline changes in Vishakhapatnam coastal tract of Andhra Pradesh, India: An application of digital shoreline analysis system (DSAS). Ann. GIS 2020, 26, 361–376. [Google Scholar] [CrossRef]
- Himmelstoss, E.A.; Henderson, R.E.; Kratzmann, M.G.; Farris, A.S. Digital Shoreline Analysis System (DSAS) Version 5.1 User Guide; US Geological Survey: Reston, VA, USA, 2021. [Google Scholar]
- Anthony, E.J.; Brunier, G.; Besset, M.; Goichot, M.; Dussouillez, P.; Nguyen, V.L. Linking rapid erosion of the Mekong River delta to human activities. Sci. Rep. 2015, 5, 14745. [Google Scholar] [CrossRef]
- Phat, L.T.; Duy, D.V.; Hieu, C.T.; An, N.T.; Lavane, K.; Ty, T.V. Initial assessment on the causes of riverbank instability in Chau Thanh district, Hau Giang province. Vietnam. J. Hydrometeorol. 2022, 740, 57–73. (In Vietnamese) [Google Scholar] [CrossRef]
- McFeeters, S.K. The use of the Normalized Difference Water Index (NDWI) in the delineation of open water features. Int. J. Remote Sens. 1996, 17, 1425–1432. [Google Scholar] [CrossRef]
- Bishop, A.W. The use of the slip circle in the stability analysis of slopes. Geotechnique 1955, 5, 7–17. [Google Scholar] [CrossRef]
- Shields, F.D., Jr.; Simon, A.; Steffen, L.J. Reservoir effects on downstream river channel migration. Environ. Conserv. 2000, 27, 54–66. [Google Scholar] [CrossRef]
- Bang, L.H.; Thinh, L.V.; Tri, L.H.; Duy, D.V.; Ty, T.V.; Minh, H.V.T. Study on geological and hydrological factors affecting the stability of Cai Vung riverbank, Hong Ngu District, Dong Thap Province. J. Meteorol. Hydrol. 2021, 731, 16–25. (In Vietnamese) [Google Scholar] [CrossRef]
- Rinaldi, M.; Surian, N.; Comiti, F.; Bussettini, M. A method for the assessment and analysis of the hydromorphological condition of Italian streams: The Morphological Quality Index (MQI). Geomorphology 2013, 180, 96–108. [Google Scholar] [CrossRef]
- Biggs, D.A. Quagmire: Nation-building and nature in the Mekong Delta. Water Altern. 2012, 5, 430–434. [Google Scholar]
- Le, T.V.H.; Nguyen, H.N.; Wolanski, E.; Tran, T.C.; Haruyama, S. The combined impact on the flooding in Vietnam’s Mekong River delta of local man-made structures, sea level rise, and dams upstream in the river catchment. Estuar. Coast. Shelf Sci. 2007, 71, 110–116. [Google Scholar] [CrossRef]
- Downes, N.K.; Nam, N.D.G.; Minh, N.A.; Chi, V.D.; Sang, L.T.; Da Huynh, V.; Tri, V.P.D.; Vu, P.T.; Thanh, B. Climate risks and resilience in urbanizing areas of the Vietnamese Mekong Delta: Future action-orientated research needs. In The Mekong Delta Environmental Research Guidebook; Elsevier: Amsterdam, The Netherlands, 2025; pp. 131–156. [Google Scholar] [CrossRef]
- People’s Committee of Ho Chi Minh City. Decision 22/2017/QD-UBND on the Management and Use of Land Corridors Along Rivers, Streams, Canals, Ditches, and Public Lakes; People’s Committee of Ho Chi Minh City: Ho Chi Minh City, Vietnam, 2017. [Google Scholar]
- Ty, T.V.; Van Duy, D.; Phat, L.T.; Minh, H.V.T.; Thanh, N.T.; Uyen, N.T.N.; Downes, N.K. Coastal erosion dynamics and protective measures in the Vietnamese Mekong Delta. J. Mar. Sci. Eng. 2024, 12, 1094. [Google Scholar] [CrossRef]
- Lan, P.T.H.; Thac, T.K.; Thanh, V.X. Scientific basis for determining riverbank protection corridors for landscape management and exploitation: A pilot study in Thanh Tra Peninsula, Saigon River. J. Water Resour. Sci. 2020, 68, 28–34. (In Vietnamese) [Google Scholar]
- Nelson, A.D.; Collins, V.D.; Payne, J.S.; Abbe, T.B. Proactive river corridor definition: Recommendations for a process-based width optimization approach illustrated in the context of the coastal Pacific Northwest. Wiley Interdiscip. Rev. Water 2024, 11, e1711. [Google Scholar] [CrossRef]
- Cohen-Shacham, E.; Andrade, A.; Dalton, J.; Dudley, N.; Jones, M.; Kumar, C.; Maginnis, S.; Maynard, S.; Nelson, C.R.; Renaud, F.G. Core principles for successfully implementing and upscaling Nature-based Solutions. Environ. Sci. Policy 2019, 98, 20–29. [Google Scholar] [CrossRef]
- Palmer, M.A.; Liu, J.; Matthews, J.H.; Mumba, M.; Paolo, D. Manage water in a green way. Science 2015, 349, 584–585. [Google Scholar] [CrossRef]
- Cohen-Shacham, E.; Janzen, C.; Stewart, M.; Gretchen, W. Nature-Based Solutions to Address Global Societal Challenges; IUCN: Gland, Switzerland, 2016; Volume 97, pp. 2016–2036. [Google Scholar]
- Schmidt, J.C.; Wilcock, P.R. Metrics for assessing the downstream effects of dams. Water Resour. Res. 2008, 44, 1–19. [Google Scholar] [CrossRef]
- Kiss, T.; Amissah, G.J.; Fiala, K. Bank processes and revetment erosion of a large lowland river: Case study of the lower Tisza River, Hungary. Water 2019, 11, 1313. [Google Scholar] [CrossRef]
- Kondolf, G.M. The espace de liberté and restoration of fluvial process: When can the river restore itself and when must we intervene? In River Conservation and Management; John Wiley & Sons, Ltd.: Hoboken, NJ, USA, 2012; pp. 223–241. [Google Scholar] [CrossRef]
- Thaler, T.; Hudson, P.; Viavattene, C.; Green, C. Natural flood management: Opportunities to implement nature-based solutions on privately owned land. Wiley Interdiscip. Rev. Water 2023, 10, e1637. [Google Scholar] [CrossRef]
- Fryirs, K.A.; Brierley, G.J.; Hancock, F.; Cohen, T.J.; Brooks, A.P.; Reinfelds, I.; Cook, N.; Raine, A. Tracking geomorphic recovery in process-based river management. Land Degrad. Dev. 2018, 29, 3221–3244. [Google Scholar] [CrossRef]
- Kondolf, G.M.; Gao, Y.; Annandale, G.W.; Morris, G.L.; Jiang, E.; Zhang, J.; Cao, Y.; Carling, P.; Fu, K.; Guo, Q.; et al. Sustainable sediment management in reservoirs and regulated rivers: Experiences from five continents. Earth’s Future 2014, 2, 256–280. [Google Scholar] [CrossRef]
- Knox, R.L.; Morrison, R.R.; Wohl, E.E. A river ran through it: Floodplains as America’s newest relict landform. Sci. Adv. 2022, 8, eabo1082. [Google Scholar] [CrossRef]
- Agnew, D.; Fryirs, K. Identifying corridors of river recovery in coastal NSW Australia, for use in river management decision support and prioritisation systems. PLoS ONE 2022, 17, e0270285. [Google Scholar] [CrossRef]
- Hack, J.; Molewijk, D.; Beißler, M.R. A conceptual approach to modeling the geospatial impact of typical urban threats on the habitat quality of river corridors. Remote Sens. 2020, 12, 1345. [Google Scholar] [CrossRef]
- Vietnam Government. Decree No. 43/2015/ND-CP Providing the Establishment and Management of Water Source Protection Corridors; Vietnam Government: Hanoi, Vietnam, 2015. [Google Scholar]
- People’s Committee of Hau Giang Province. Decision No.16/2013/QD-UBND: Activities Within the Protective Corridor of Rivers, Canals, and Waterways; People’s Committee of Hau Giang Province: Hau Giang, Vietnam, 2013; p. 8. [Google Scholar]
- People’s Committee of Soc Trang Province. Decision No.47/2015/QD-UBND: Regulations on the Protection of Irrigation Works and Dykes; People’s Committee of Soc Trang Province: Soc Trang, Vietnam, 2015; p. 10. [Google Scholar]
- GEF-ICRSL. GEF-ICRSL on Riverbank Stabilization and the Erosion Measures for the Chau Ma Islet Area Under the Technical Assistance Project for the Integrated Climate Resilience and Sustainable Livelihoods in the Mekong Delta; GEF-ICRSL: An Giang, Vietnam, 2024. [Google Scholar]
- MARD. QCVN 04-05:2022/BNNPTNT: Hydraulic Structures—Essential Regulations for Design; MARD: Ha Noi, Vietnam, 2022; Available online: https://congbao.chinhphu.vn/tai-ve-van-ban-so-29-2022-tt-bnnptnt-38587-43077 (accessed on 30 April 2025).
- Hue, V.H. Construction solutions prevents erosion on Vam Co Tay riverbank. Vietnam. J. Hydrometeorol. 2023, 754, 79–100. (In Vietnamese) [Google Scholar] [CrossRef]
- Rosgen, D.L. A practical method of computing streambank erosion rate. In Proceedings of the Seventh Federal Interagency Sedimentation Conference, Citeseer, Reno, NV, USA, 25–29 March 2001; Available online: https://citeseerx.ist.psu.edu/document?repid=rep1&type=pdf&doi=081153fdcd046d0a4b43aa5de2f4cb0432fc11fe (accessed on 30 April 2025).


| Date (dd/mm/yyyy) | Satellite | Sensors | Resolution (m × m/Pixel) | Coordinates | Cloud Coverage (%) |
|---|---|---|---|---|---|
| 19/03/2000 | Landsat 5 | TM | 30 | UTM | 38.00 |
| 28/04/2005 | Landsat 5 | TM | 30 | UTM | 1.00 |
| 18/05/2010 | Landsat 5 | TM | 30 | UTM | 11.00 |
| 24/01/2015 | Landsat 8 | OLI/TIRS | 30 | UTM | 1.55 |
| 06/01/2020 | Landsat 8 | OLI/TIRS | 30 | UTM | 2.18 |
| 16/12/2023 | Landsat 9 | OLI/TIRS | 30 | UTM | 1.83 |
| Width of River (m) | LSCR (m) Both Sides | Sources |
|---|---|---|
| >100 | 25 | Decision No. 16/2013/QD-UBND [34] |
| 70 < a ≤ 100 | 25 | |
| 50 < a ≤ 70 | 20 | |
| 30 < a ≤ 50 | 15 | |
| 10 < a ≤ 30 | 10 | |
| >100 | 25 | |
| ≥25 | 20 | Decision No. 47/2015/QD-UBND [35] |
| 15 < a ≤ 25 | 15 | |
| 8 < a ≤ 15 | 10 | |
| Depth of river (m) | LSCR (m) both sides | |
| ≤10 | ≤15 | GEF-ICRSL [36] |
| 10 < a ≤ 15 | ≥20 | |
| ≥25 | ≥30 |
| Location | Region |
|---|---|
| 1. | Phu Thuan B Commune, Hong Ngu District, Dong Thap Province |
| 2. | Tan Khanh Trung Commune, Lap Vo District, Dong Thap Province |
| 3. | Tan Hoa Ward, Vinh Long City, Vinh Long Province |
| 4. | Binh Thuy Commune, Chau Phu District, An Giang Province |
| 5. | Long Giang Commune, Cho Moi District, An Giang Province |
| 6. | Thoi Thuan Commune, Thot Not District, Can Tho City |
| 7. | Bui Huu Nghia Ward, Binh Thuy District, Can Tho City |
| 8. | Dai Ngai Town, Long Phu District, Soc Trang Province |
| Location | 1 | 2 | 3 | 4 | 5 | 6 | 7 | 8 |
|---|---|---|---|---|---|---|---|---|
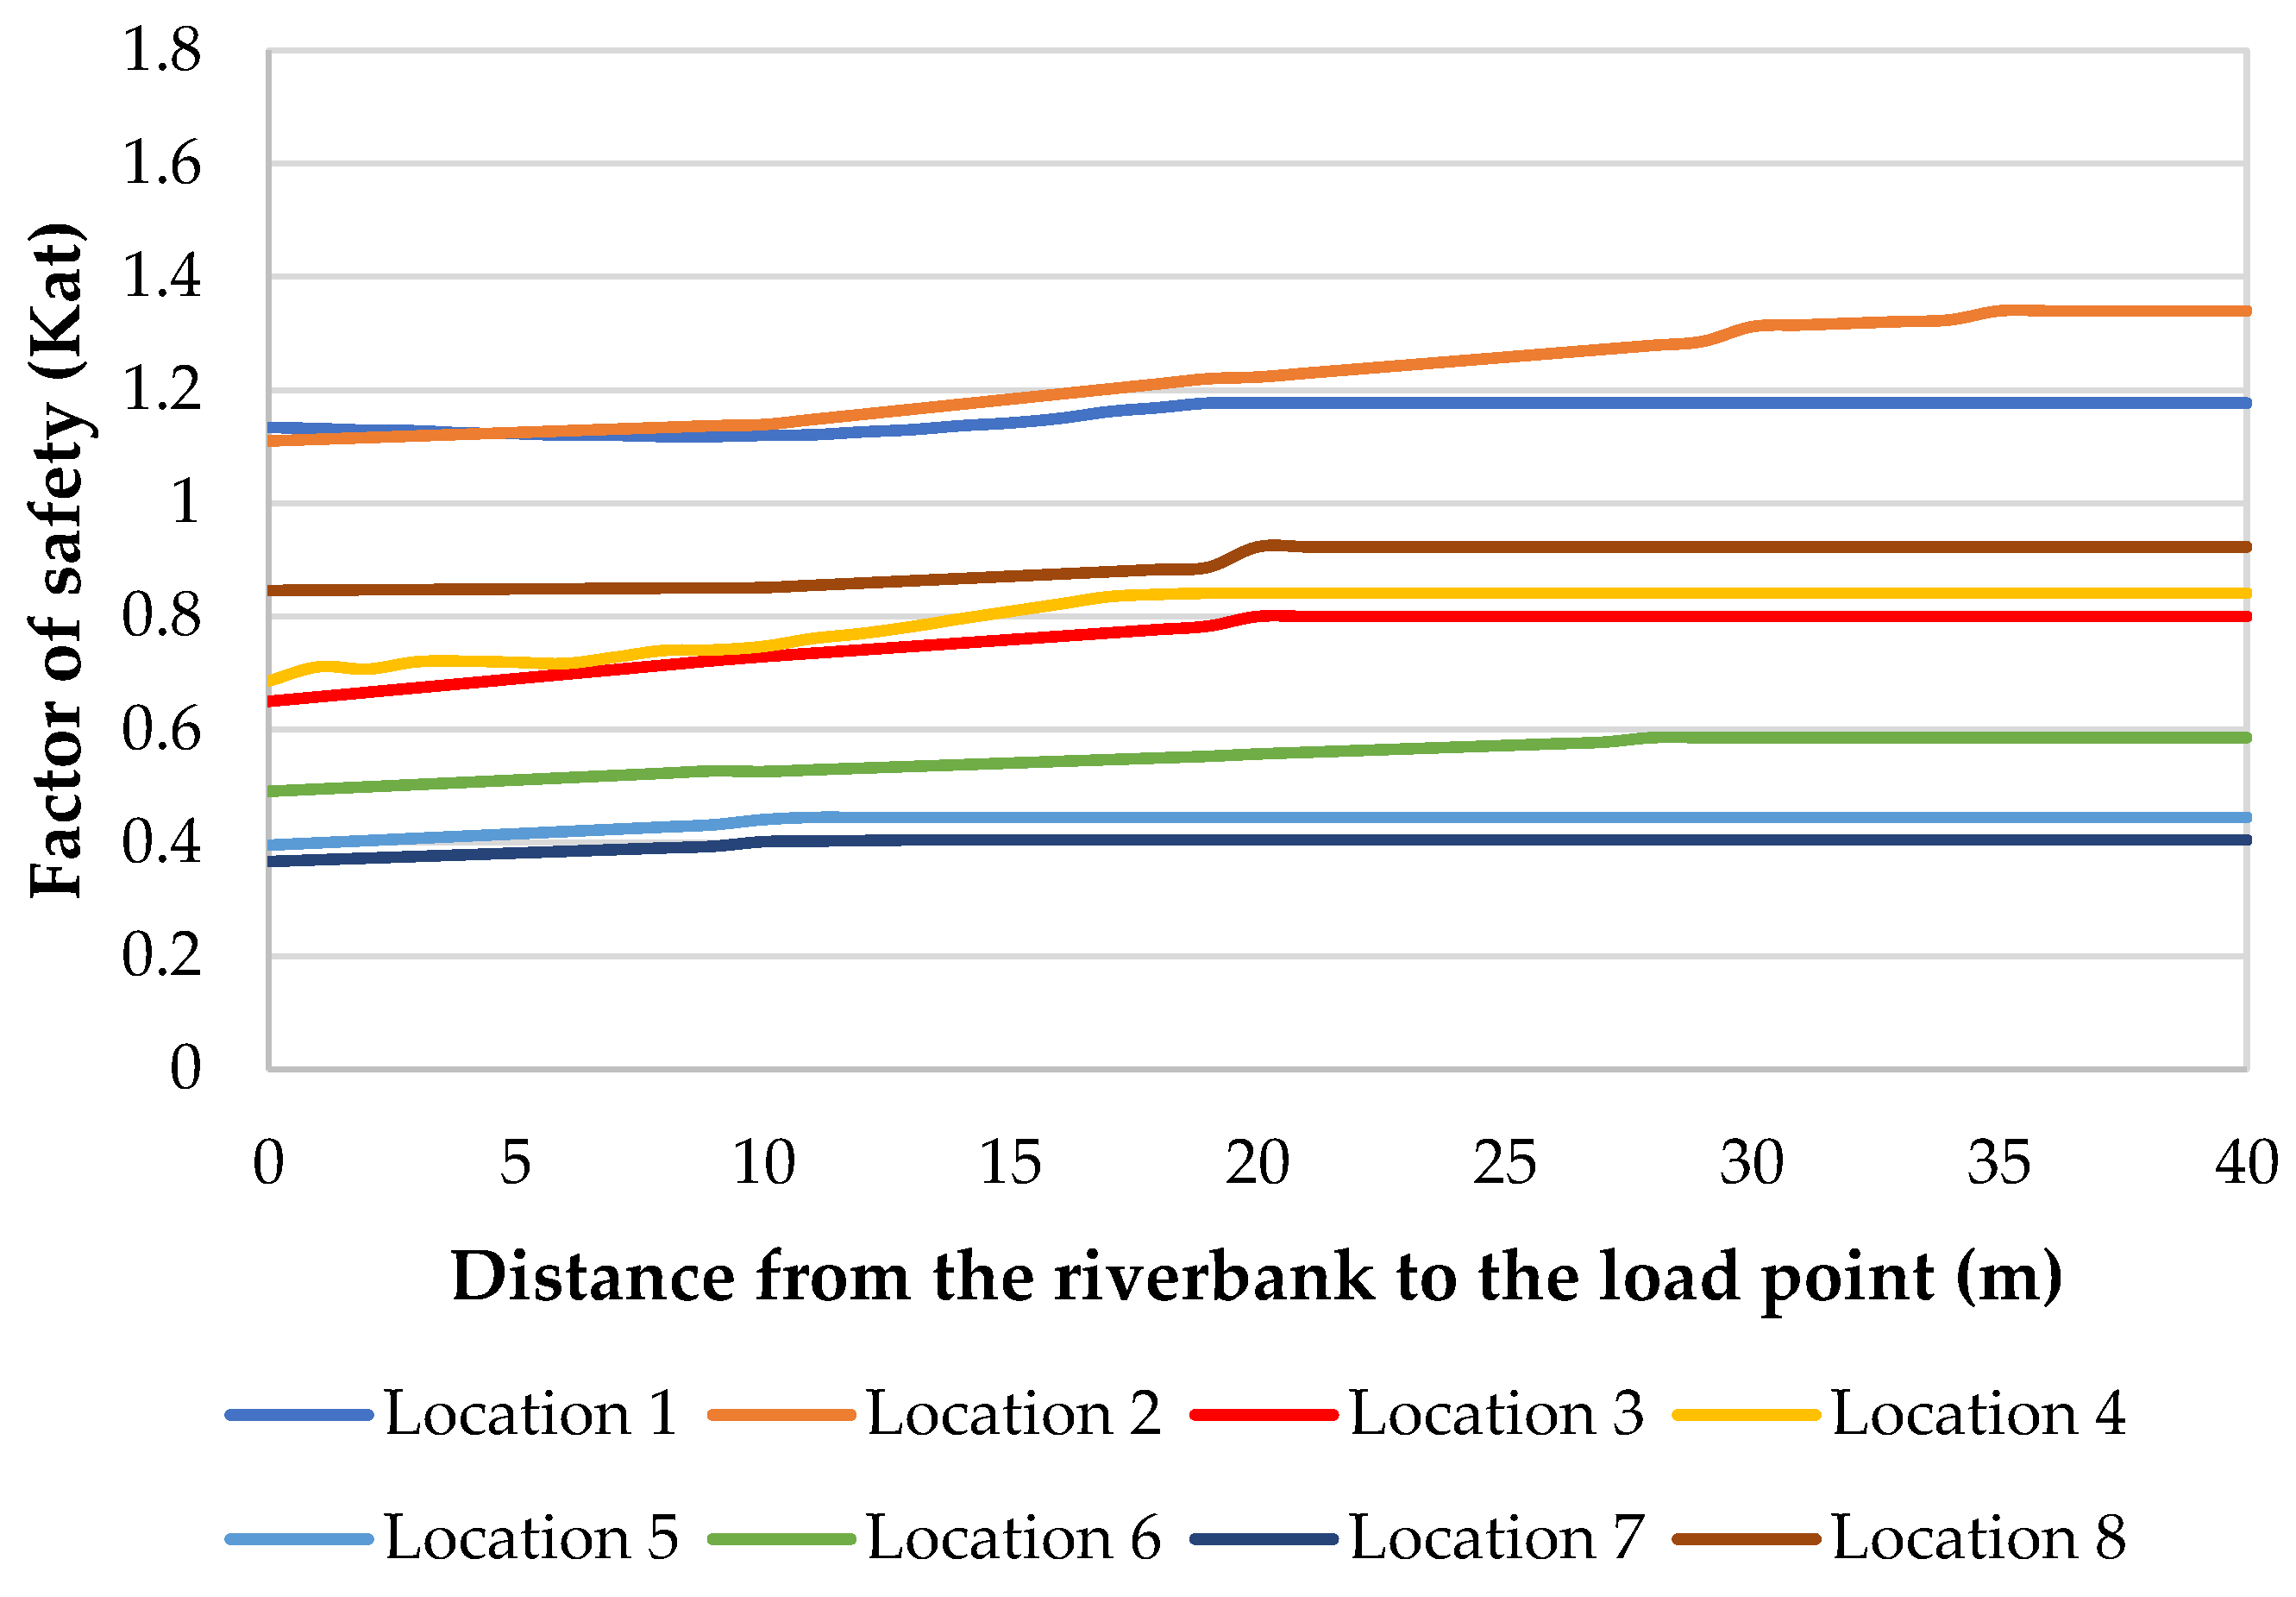
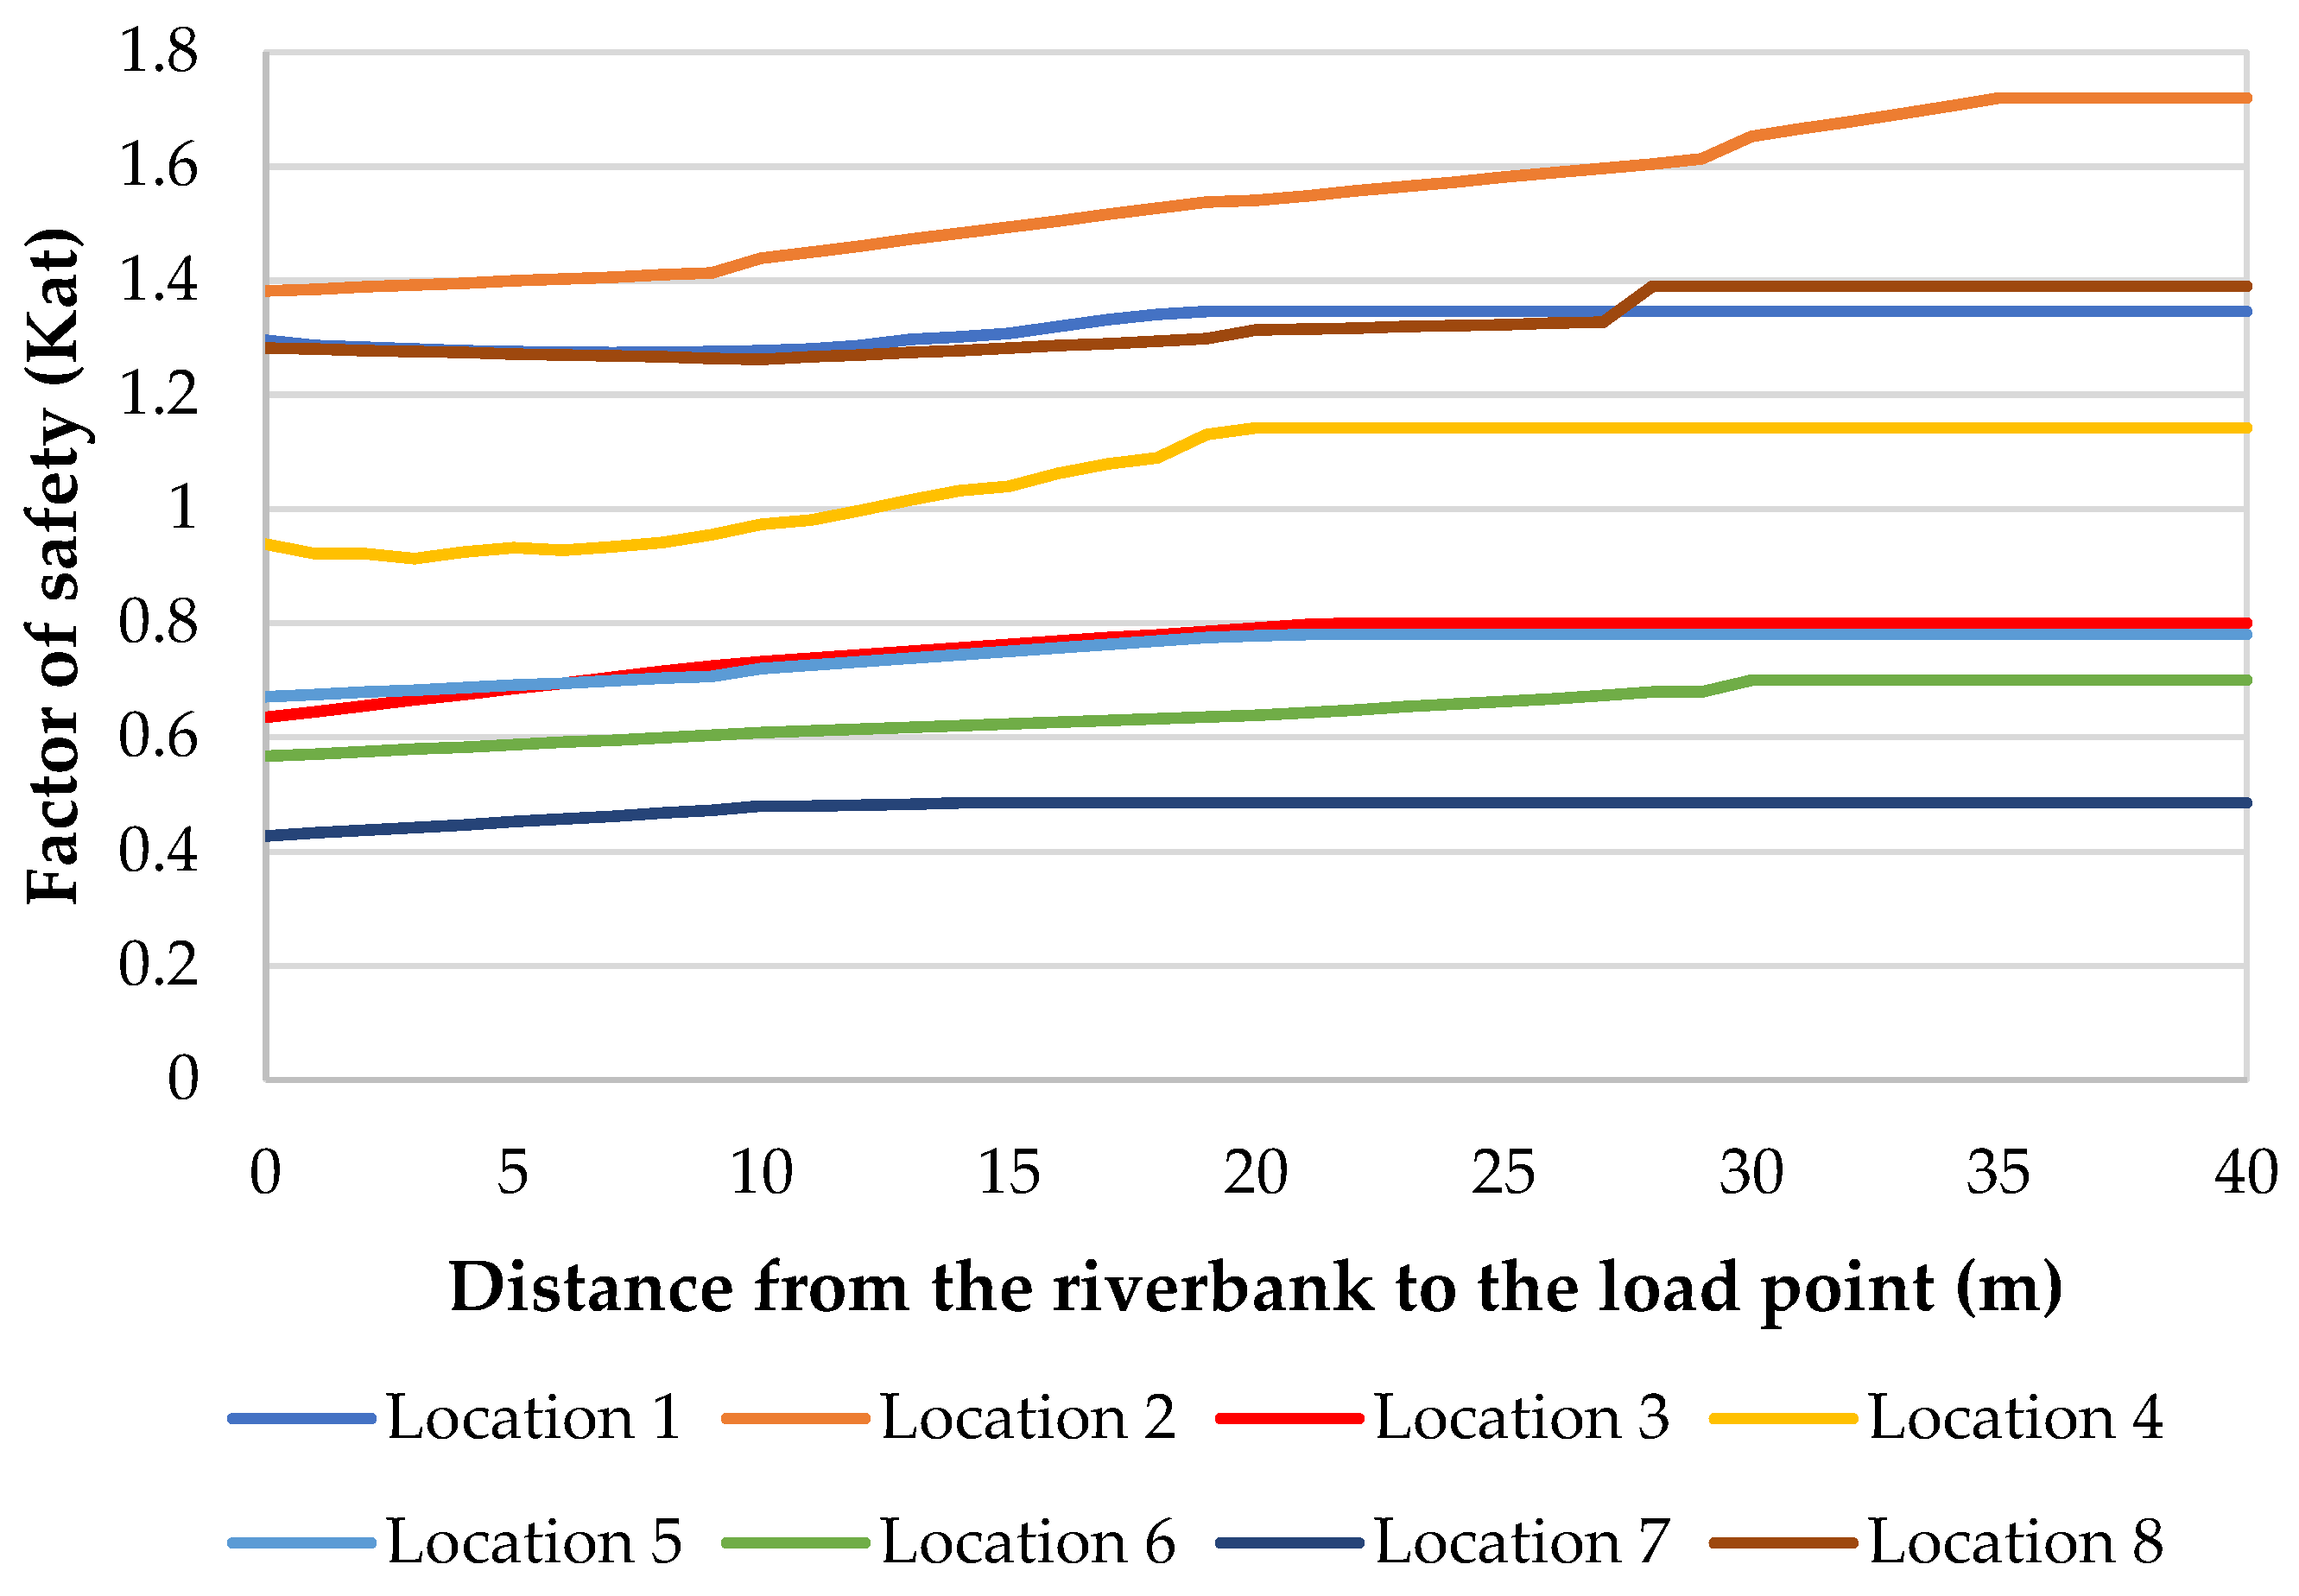
| Proposed a safety corridor with the max water level (Kat) | 1.35 | 1.72 | 0.8 | 1.14 | 0.78 | 0.70 | 0.48 | 1.39 |
| Proposed a safety corridor with the max water level (Kat) | 1.18 | 1.34 | 0.8 | 0.83 | 0.45 | 0.59 | 0.41 | 0.92 |
| Proposed distance for the safety corridor with the max water level (m) | 37 | 35 | 24 | 20 | 21 | 30 | 14 | 28 |
| Proposed distance for the safety corridor with the min water level (m) | 38 | 35 | 23 | 20 | 11 | 28 | 14 | 21 |
| Proposed safety corridor distance (m) | 38 | 35 | 24 | 20 | 21 | 30 | 14 | 28 |
Disclaimer/Publisher’s Note: The statements, opinions and data contained in all publications are solely those of the individual author(s) and contributor(s) and not of MDPI and/or the editor(s). MDPI and/or the editor(s) disclaim responsibility for any injury to people or property resulting from any ideas, methods, instructions or products referred to in the content. |
© 2025 by the authors. Licensee MDPI, Basel, Switzerland. This article is an open access article distributed under the terms and conditions of the Creative Commons Attribution (CC BY) license (https://creativecommons.org/licenses/by/4.0/).
Share and Cite
Duy, D.V.; Ty, T.V.; Phat, L.T.; Minh, H.V.T.; Thanh, N.T.; Downes, N.K. Assessing River Corridor Stability and Erosion Dynamics in the Mekong Delta: Implications for Sustainable Management. Earth 2025, 6, 34. https://doi.org/10.3390/earth6020034
Duy DV, Ty TV, Phat LT, Minh HVT, Thanh NT, Downes NK. Assessing River Corridor Stability and Erosion Dynamics in the Mekong Delta: Implications for Sustainable Management. Earth. 2025; 6(2):34. https://doi.org/10.3390/earth6020034
Chicago/Turabian StyleDuy, Dinh Van, Tran Van Ty, Lam Tan Phat, Huynh Vuong Thu Minh, Nguyen Truong Thanh, and Nigel K. Downes. 2025. "Assessing River Corridor Stability and Erosion Dynamics in the Mekong Delta: Implications for Sustainable Management" Earth 6, no. 2: 34. https://doi.org/10.3390/earth6020034
APA StyleDuy, D. V., Ty, T. V., Phat, L. T., Minh, H. V. T., Thanh, N. T., & Downes, N. K. (2025). Assessing River Corridor Stability and Erosion Dynamics in the Mekong Delta: Implications for Sustainable Management. Earth, 6(2), 34. https://doi.org/10.3390/earth6020034