Abstract
Particle separation is a common process in various industries, particularly in mineral processing. Therefore, this research aimed to evaluate the performance of separation method using fluidized bed. The evaluation was performed using silica gel particle with diameters of 0.9 and 3 mm, including diesel fuel as fuel. This simulation was carried out to obtain the optimum separation of small-sized particle (0.9 mm) based on variations in fluid velocity (0.034, 0.068, and 0.102 m/s), outlet height (0.3, 0.6, and 0.9 m), and time. Optimum separation, defined by maximum separation efficiency (99%) in minimum time for separation, was determined using Computational Particle Fluid Dynamics software (CPFD VR 17.4.0). Separation efficiency of simulation results was validated by experimental research The results showed that, at velocity of 0.034 m/s, big particle could be partially separated at an outlet height of 0.9 m. At velocity of 0.068 m/s, small particle was separated at an outlet height of 0.6 m for 220 s, and big particle at 0.9, with a time longer than 300 s. Based on these results, optimum condition was obtained at velocity of 0.102 m/s, where small and big particle was separated at a time of 100 s, with output heights of 0.9 and 0.6 m, respectively.
1. Introduction
Separation is a common process in various industries, specifically in mineral processing. Common methods for separation are expansion chamber and cyclones. An expansion chamber requires low velocity and pressure with smaller separation efficiency, while a cyclone produces high efficiency with elevated velocity. To address this limitation, fluidized bed has been proven effective as new method capable of producing high efficiency and requiring moderate velocity [1,2].
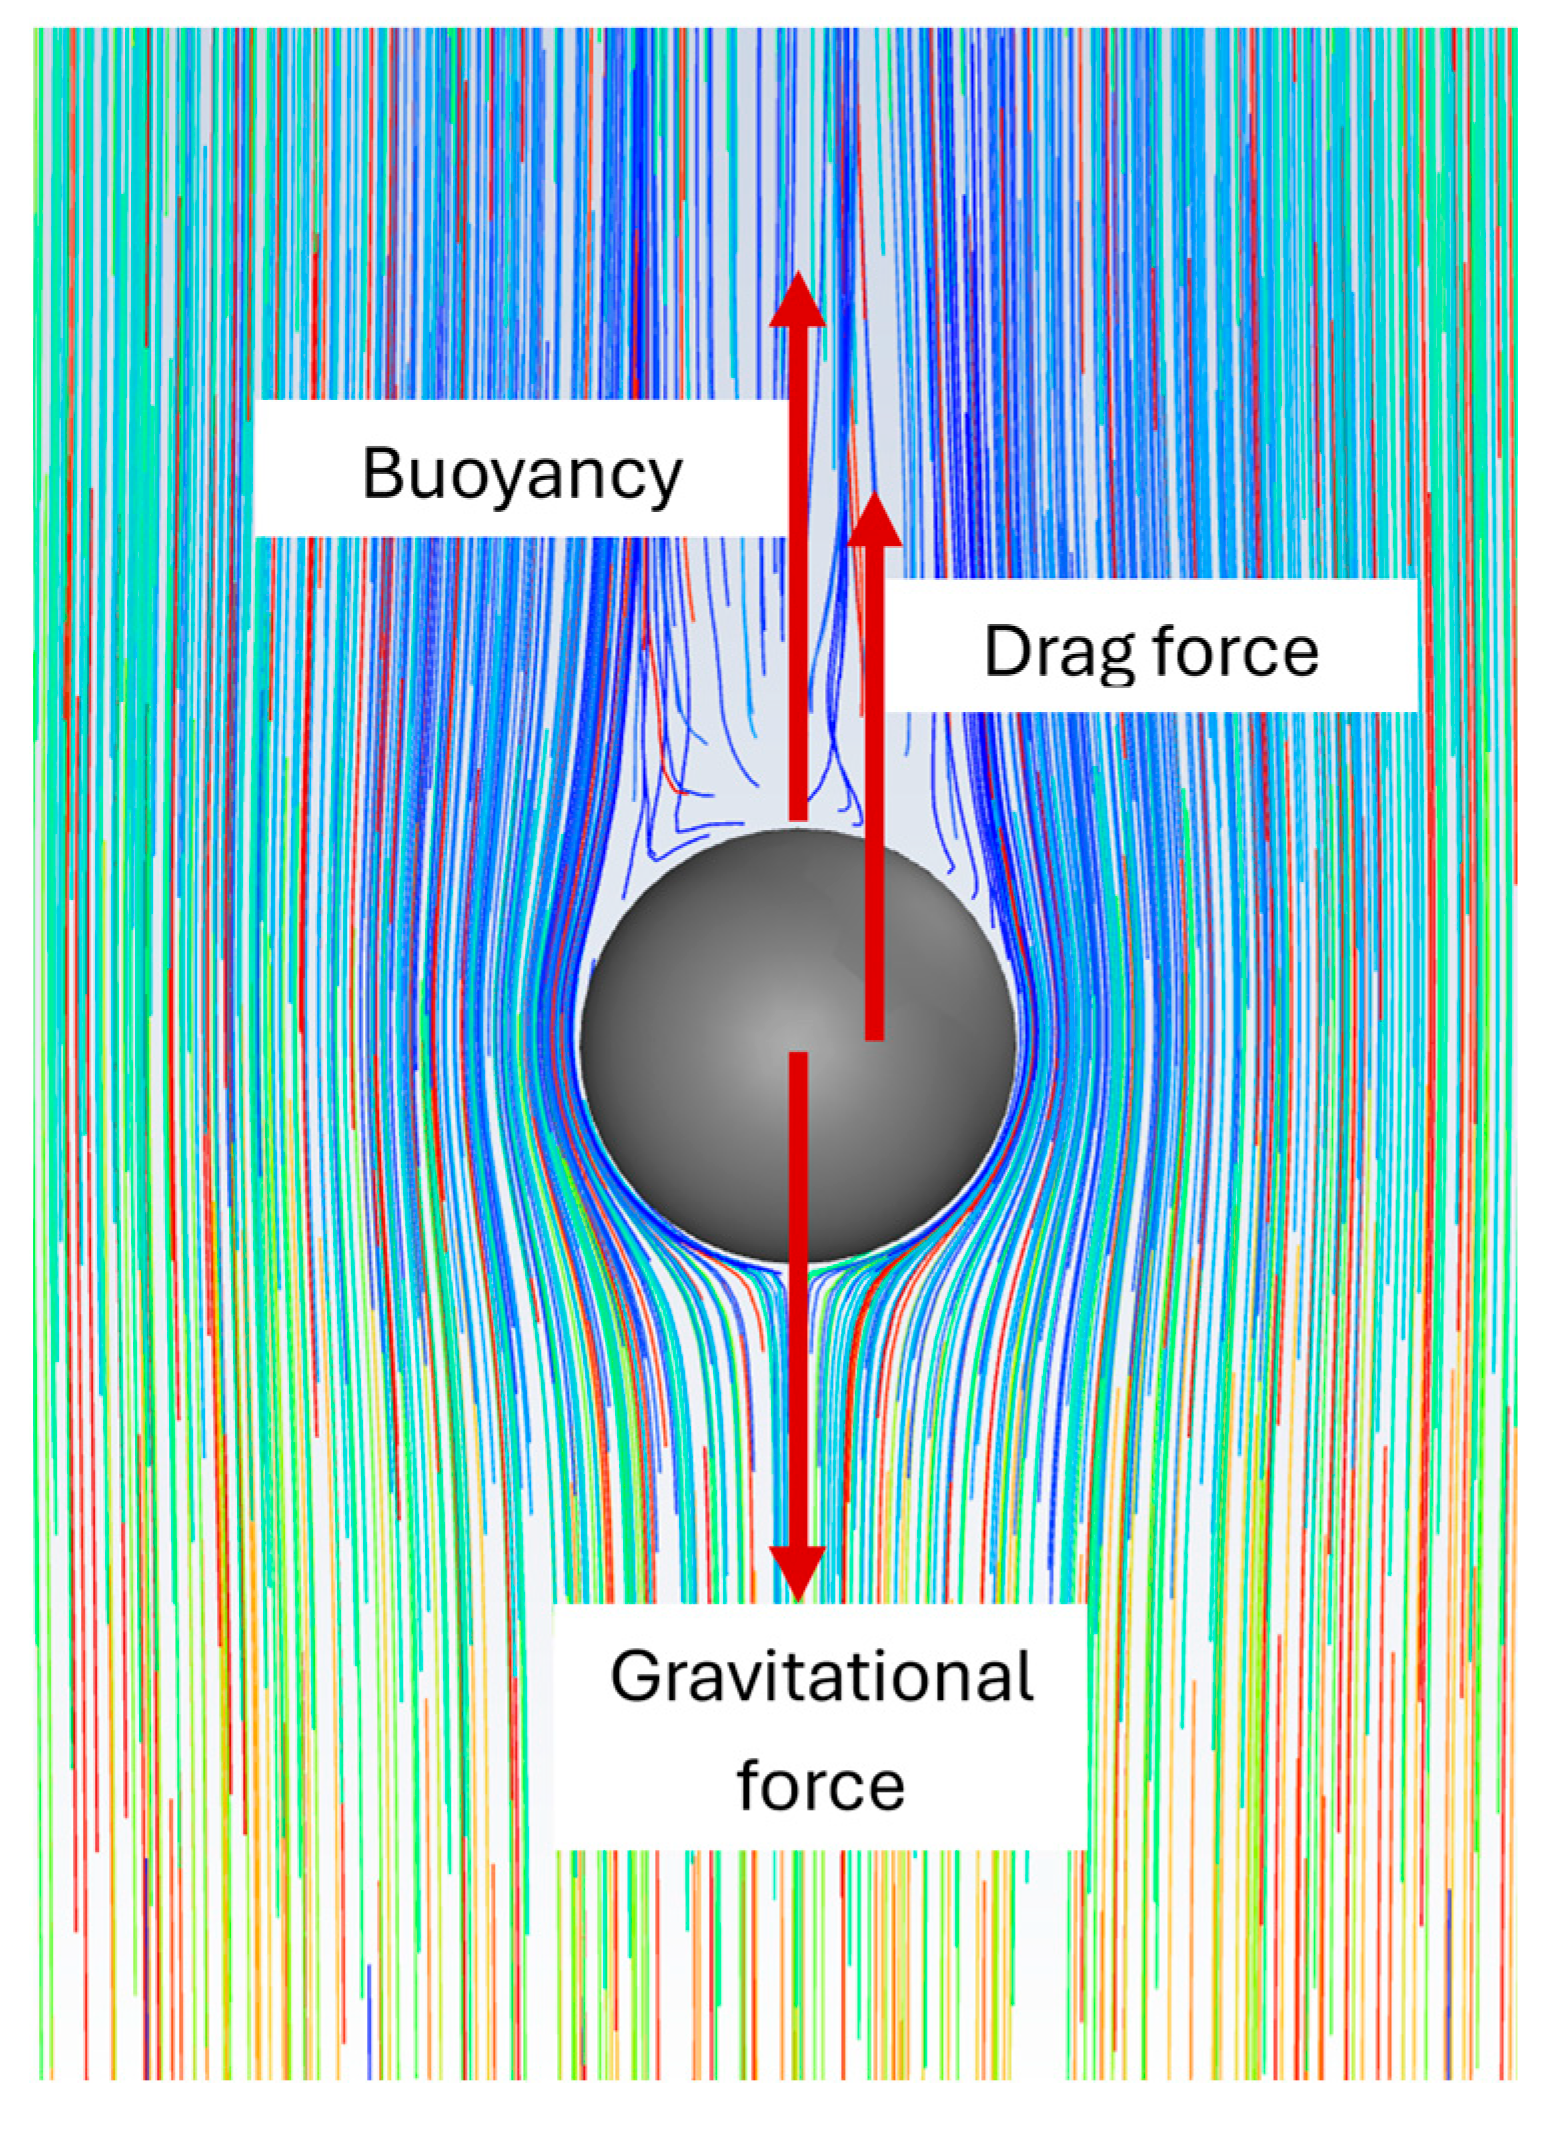
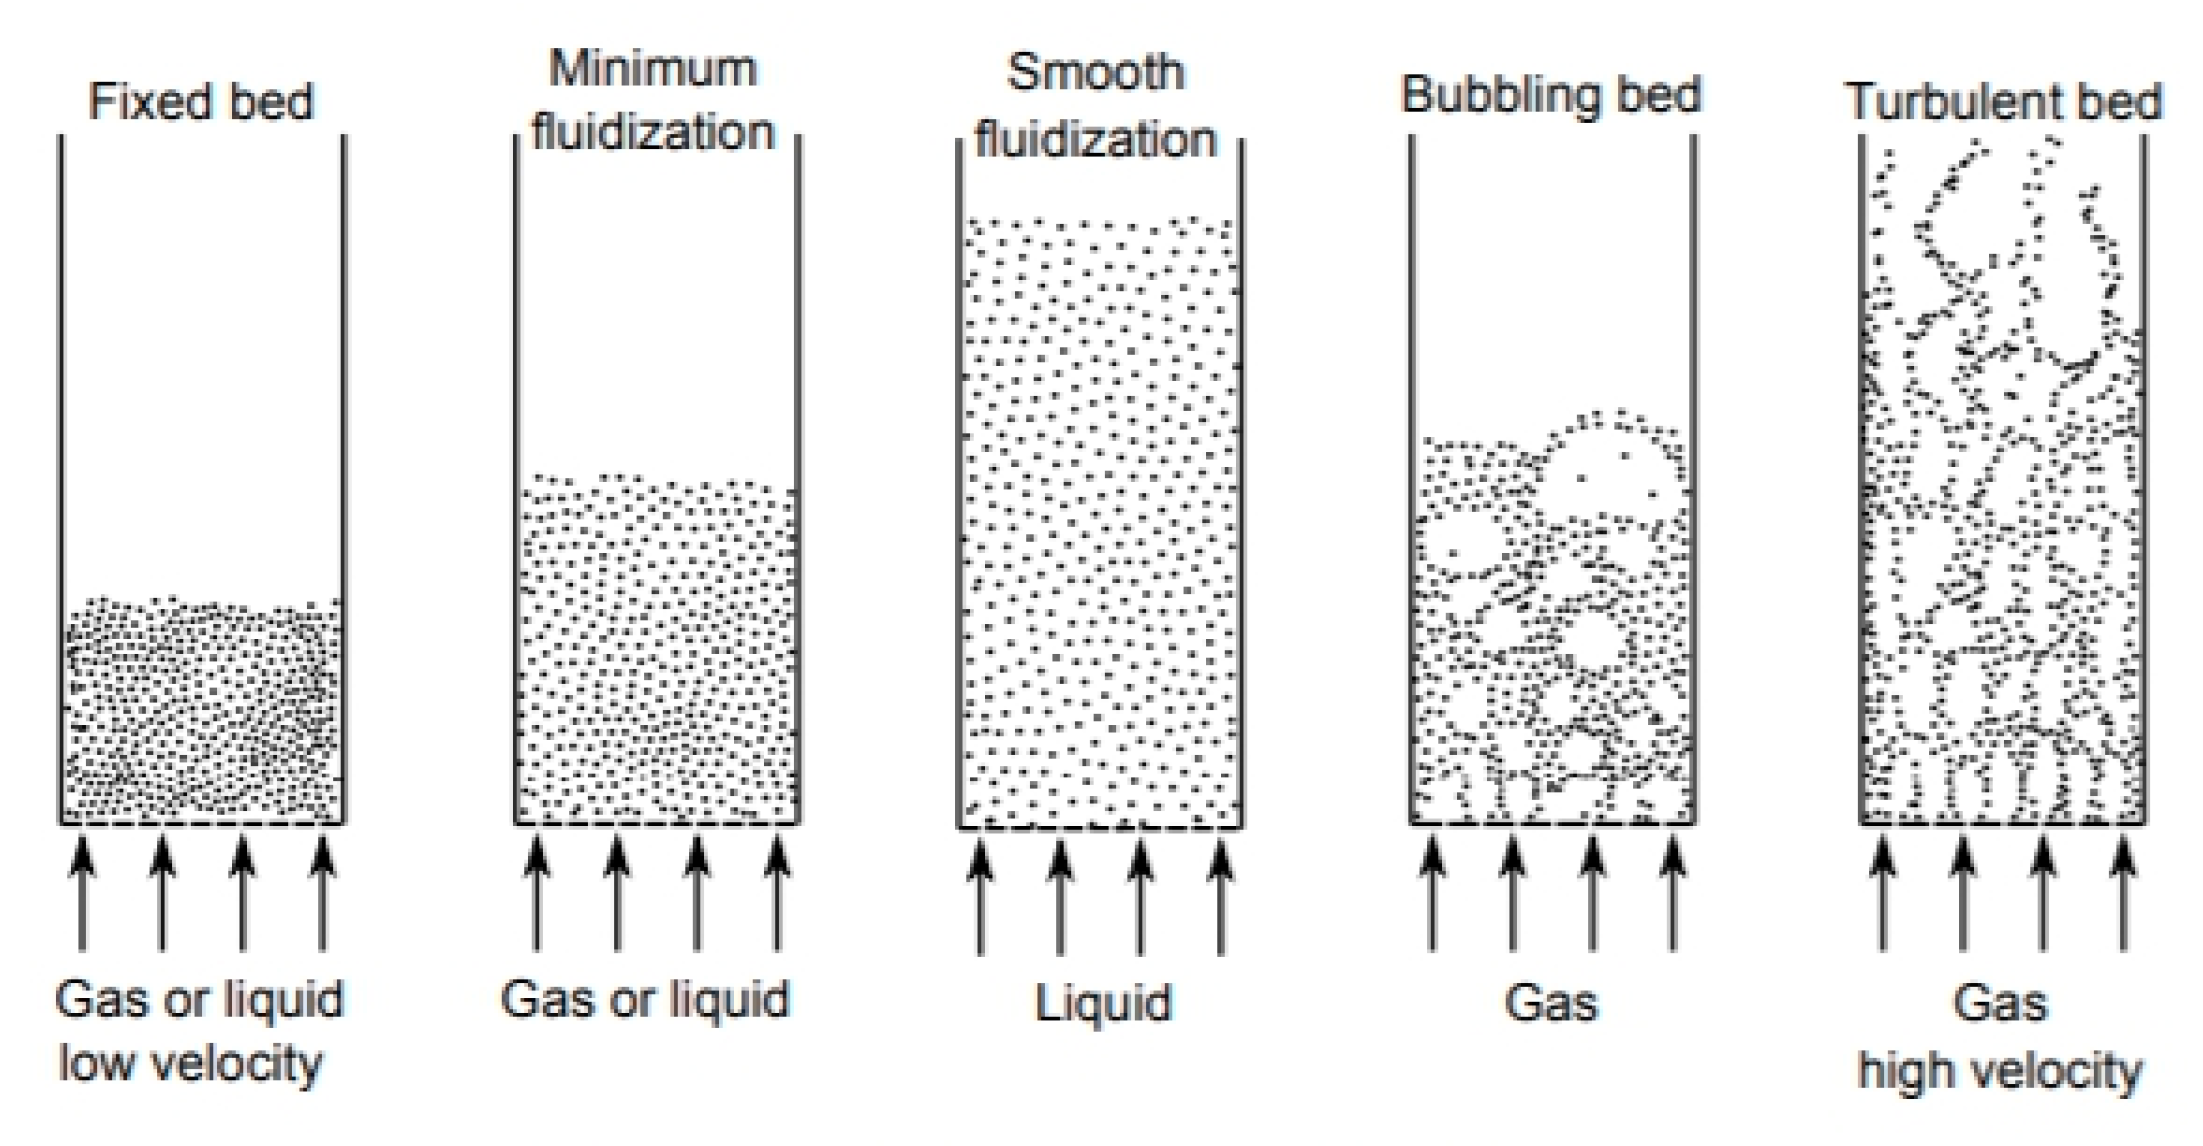
Fluidized bed occurs by exerting drag force and producing a buoyance effect on solid particle by flowing fluid on particle in a vertical column (riser). Force balance on a particle will determine the relative movement, as shown in Figure 1 [3]. Relative drag force against particle weight also determines the movement pattern [4]. This suggests that small drag force will cause particle to stay still (fixed bed) or expand, allowing the occurrence of fluidization. In comparison, high relative drag force causes the formation of bubbles (bubbling bed) or even flow along with fluid (turbulent bed), as shown in Figure 2.
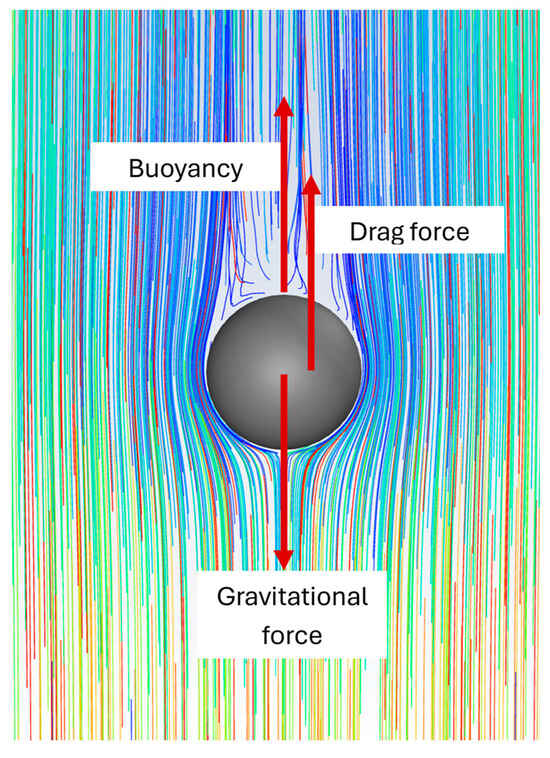
Figure 1.
Particle force balance in a fluidized bed [3].
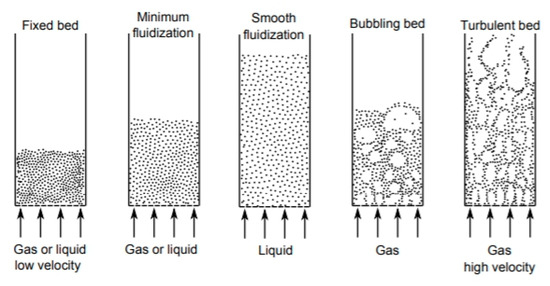
Figure 2.
Fluidization regimes of fluidized beds [4].
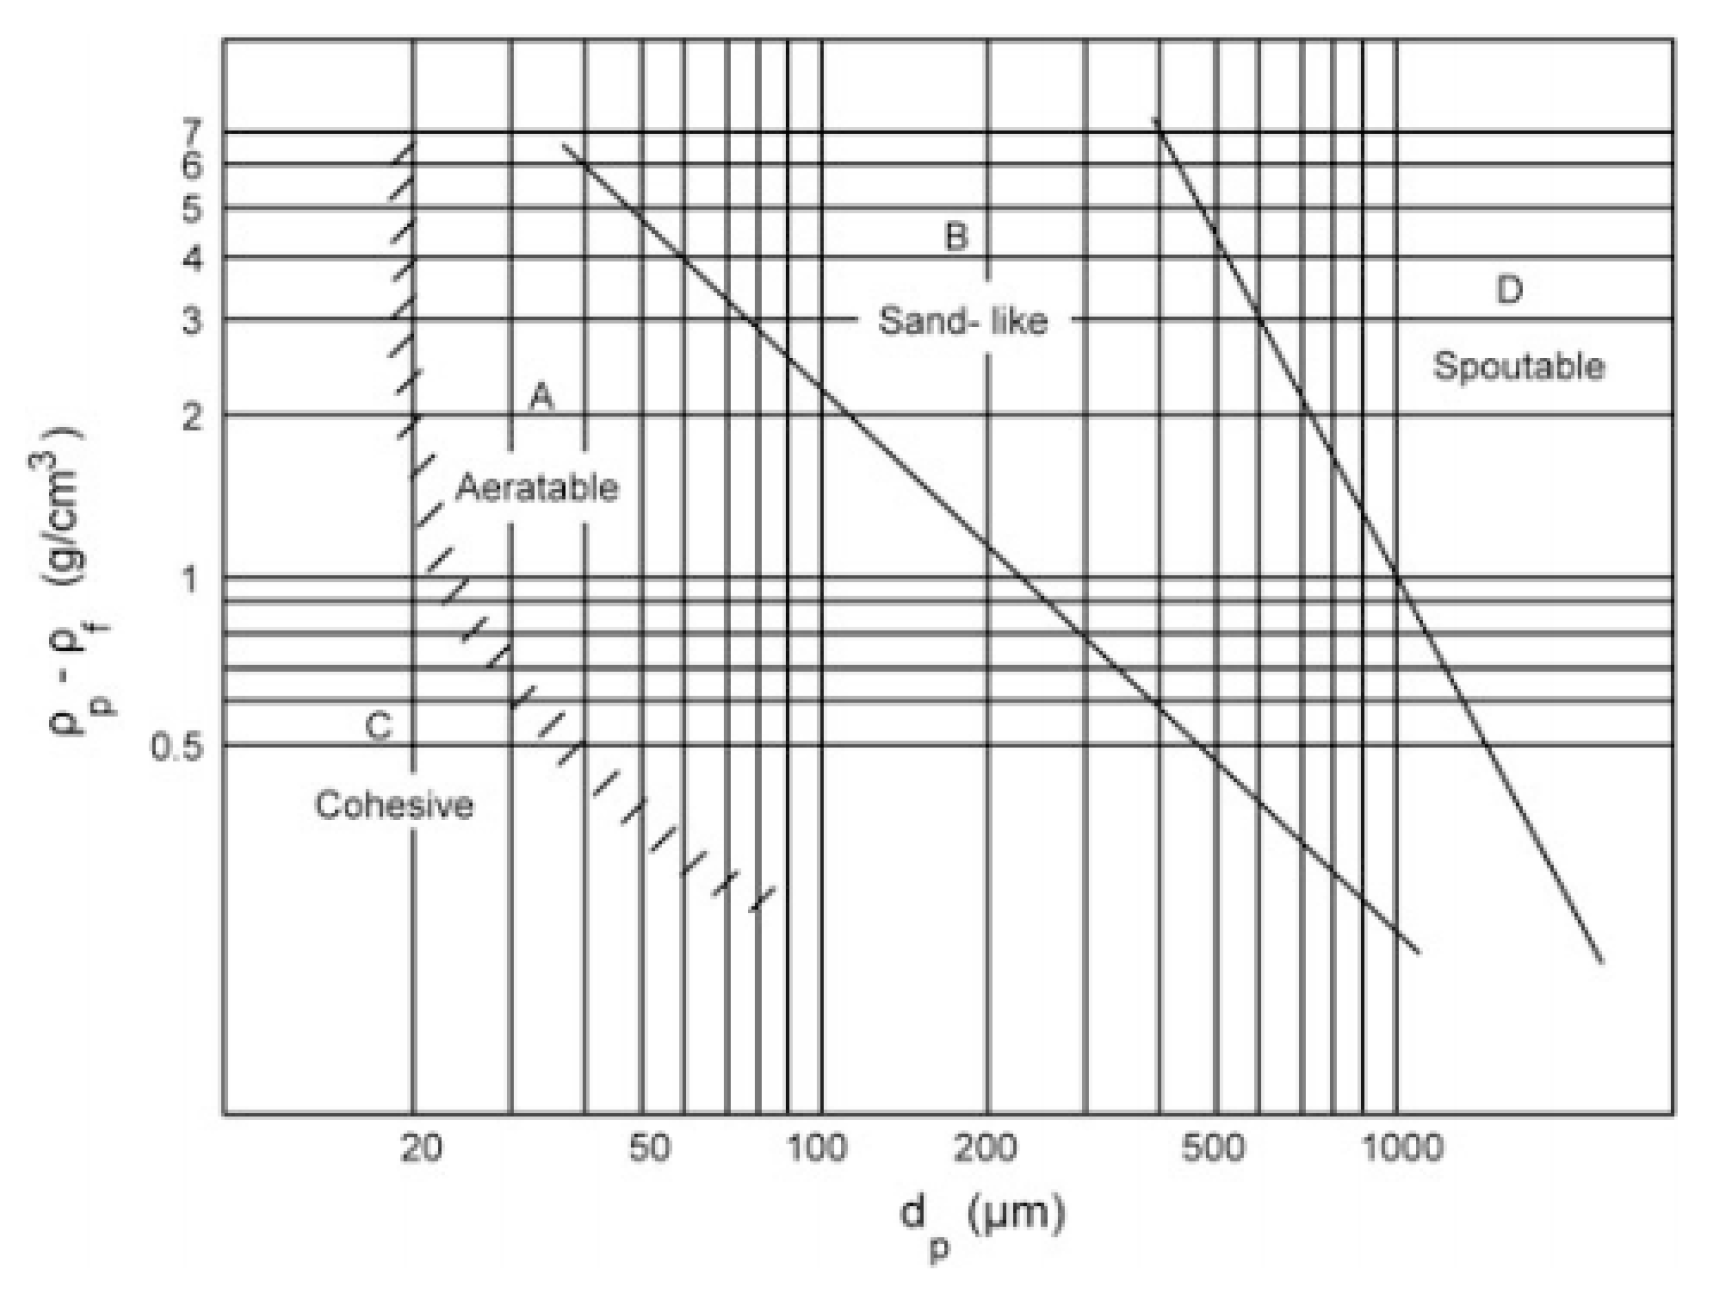
According to the relative density of particle in fluid and the diameters, particle can be classified as aeratable (easily fluidized by small velocity), sand-like (ideal fluidized), or spoutable (requires high velocity for fluidization) [4,5]. Sand-like particle are ideal because of the ability to be fluidized under low-velocity conditions (Figure 3).
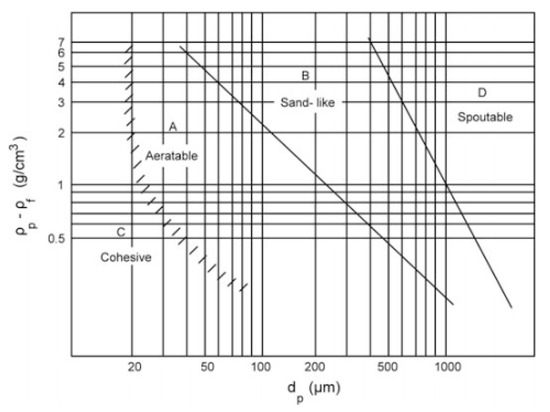
Figure 3.
Geldard’s particle classification in a fluidized bed [5].
Kunii and Levenspiel [6] stated that fluidization for two different sizes would cause big particle to form a bubbling regime in the bottom of riser and small particle to float throughout the riser. The maximum floatation height for small particle is known as total disengaging height, which serves as the fundamental principle in particle separation of different sizes. Generally, small particle can be separated from big sizes by locating the riser outlet at the upper side in the total disengaging height zone [6].
2. Governing Equations
In this research, simulation was performed by Computational Particle Fluid Dynamics (CPFD) software, Barracuda VR 17.4.0. The software modeled fluid phase as a continuum using Navier–Stokes equations discretized by the finite volume method. Turbulence was modeled by a Large Eddy Simulation (LES) with sub-grid viscosity calculated according to the Smagorinsky model [7]. Furthermore, strong coupling between fluid and particle was evaluated with a particle momentum equation using a multi-phase-particle in cell (MP-PIC) formulation, as suggested by Snider [8]. A continuity and momentum equation for fluid phase was obtained from staggered grid averaging, as suggested by Anderson and Jackson [9].
where θf is fluid volume fraction, ρf is fluid density, τf is fluid shear stress tensor, ρs is solid density, uf is fluid velocity vector, us is solid particle velocity vector, g is gravitational acceleration vector, and F is momentum transfer rate per unit volume in fluid–particle interaction.
Momentum transfer between particle and fluid is modeled as an interphase momentum transfer (F) calculated by the following:
where ms is solid particle mass, Ds is solid particle diameter, p is fluid pressure, and f is the particle diameter distribution function. Shear stress tensor on fluid phase is calculated as follows:
where μ is total (laminar and turbulent) viscosity and turbulent viscosity (μt) is obtained from the following:
Solid particle velocity (us) is calculated from particle movement as follows:
During particle–fluid interaction, particles can experience acceleration that is calculated from the following:
where is the drag force function, is shear stress on the particle surface, and is the particle collision damping time, as suggested by O’Rourke and Snider [10], CD is the drag coefficient, as suggested by Wen and Yu [11] as follows:
3. Simulation Set Up
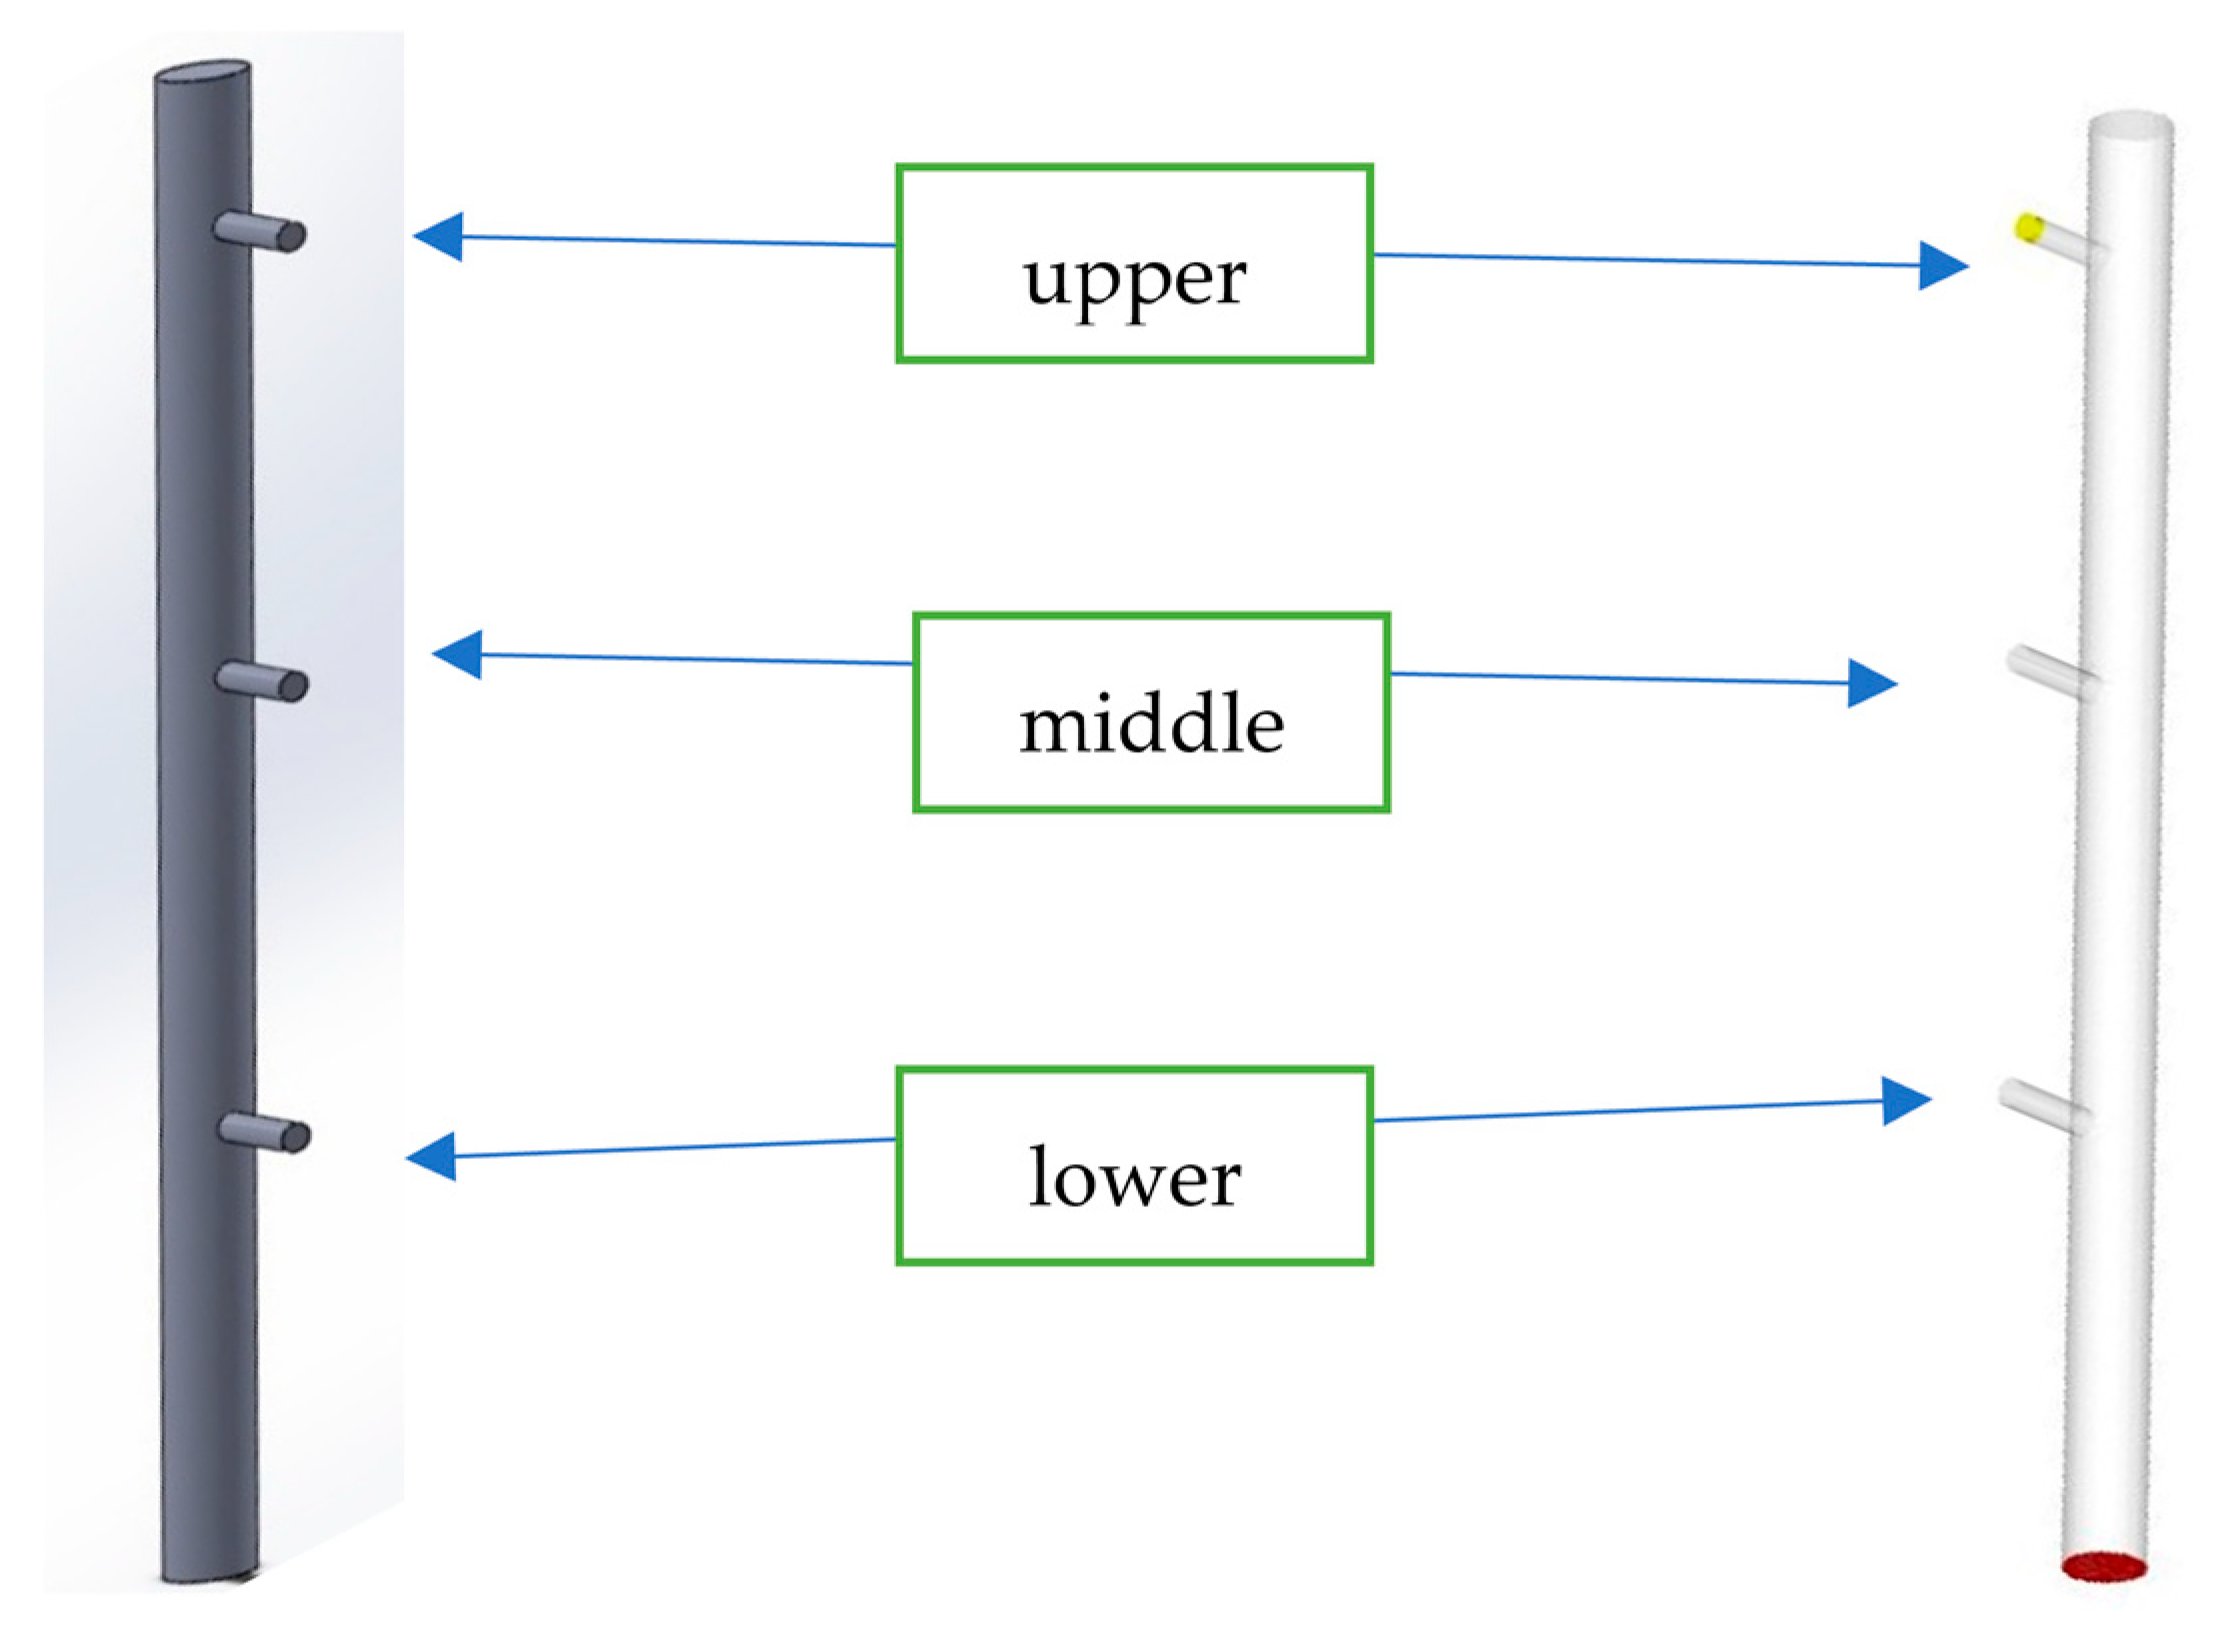
Simulation was performed in a riser with a diameter of 4.6 cm and height of 1 m. There were three outlets, with heights of 0.3, 0.4, and 0.6 m for the lower, middle, and upper outlets, respectively (Figure 4). A screen on the bottom/lower side of the riser was used to prevent solid particle from falling, modeled as a boundary that would not allow the particle to flow out. Each simulation used one outlet for the upper side, the middle, and lower side of walls. The outlet allowed for both fluid and particle escape from the outlet and the accumulated particle was counted every 5 s.
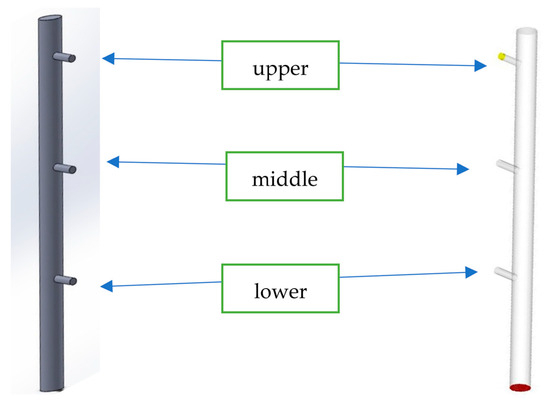
Figure 4.
Riser’s geometry and boundary conditions.
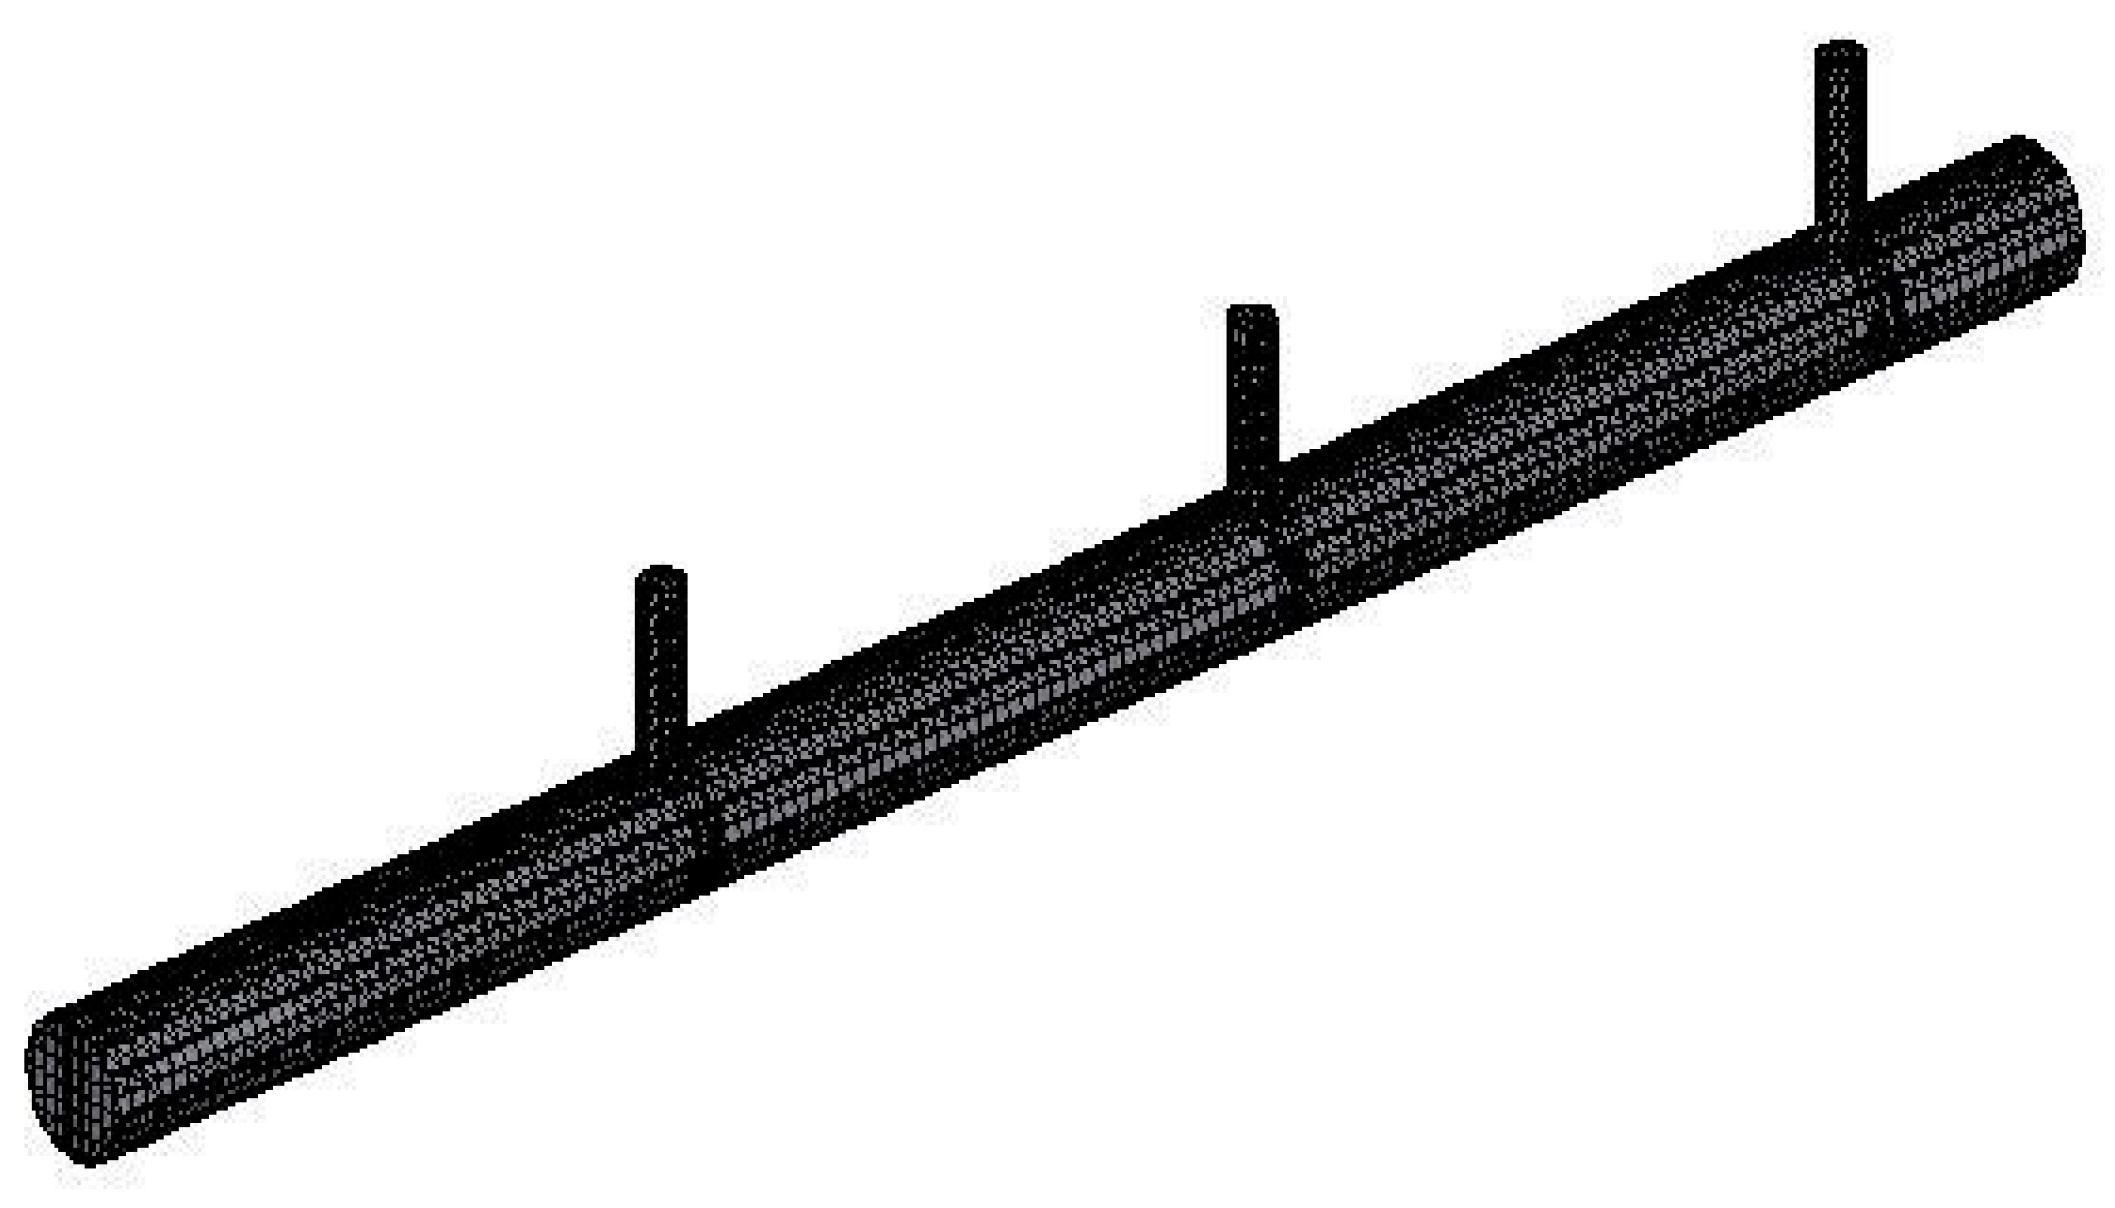
Meshing for simulation domain was performed by using a linear-shaped finite element that estimated a curved shape into linear lines (Figure 5). Particle and fluid properties are shown in Table 1, obtained from [12] and [13], respectively. The particle shape was spherical, with sphericity equal to one. Particle zone classification referred to Geldard’s rule [6], while terminal velocity and minimum fluidization were based on [5,6], respectively. Fluid velocity varied between minimum fluidization and terminal velocity in order to maintain fluidization mechanisms, namely 0.034 m/s (5 lpm), 0.068 m/s (10 lpm), and 0.102 m/s (15 lpm).
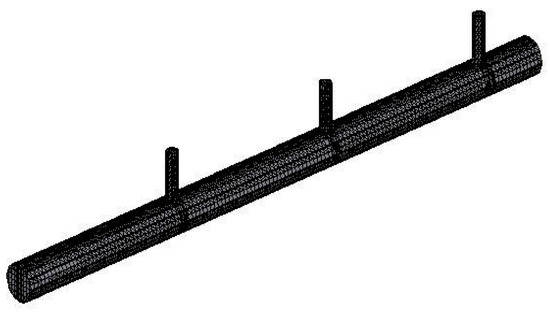
Figure 5.
Domain meshing on riser.

Table 1.
Properties of solid particles and fluid [13].
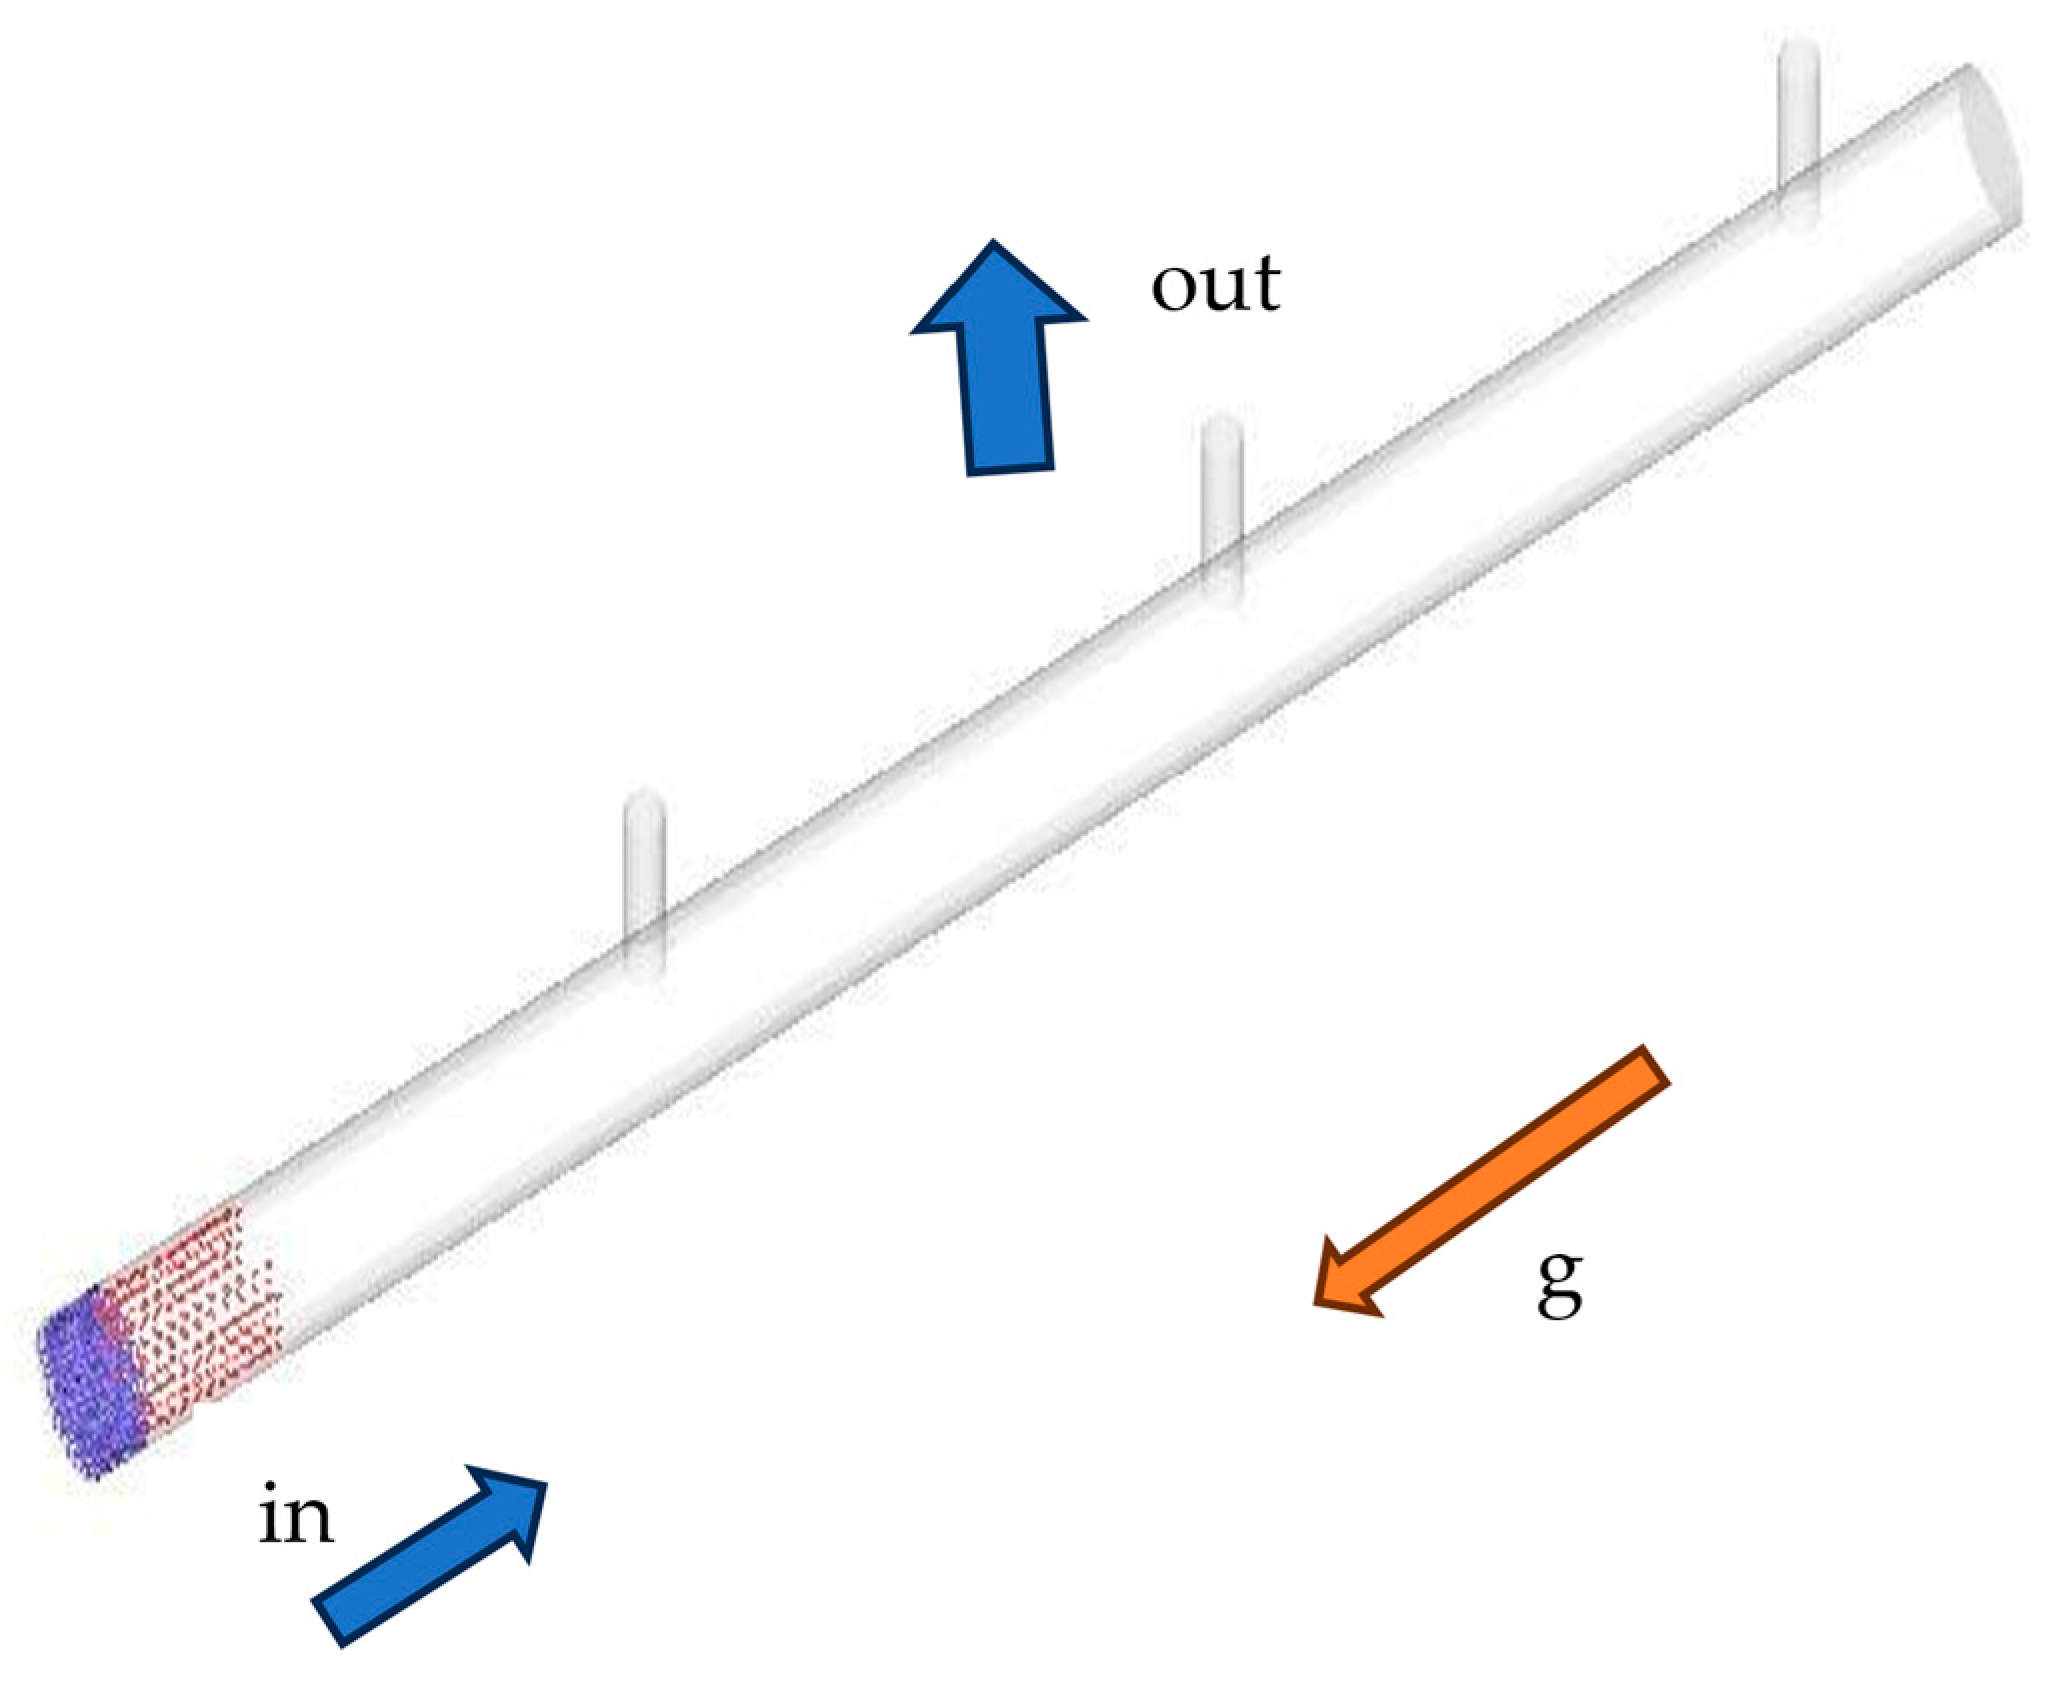
According to the Large Eddy Simulation, sub-grid scale for viscosity, fluid properties, and highest velocity (0.102 m/s), a simulation was performed in transient conditions with a time step less than 0.015 s. In this research, simulation was performed on a time step of 0.01 s, totaling 300 s. Initially, particle was located at the bottom of the riser with height of small and big particle set at 0.025 m (blue color) and 0.075 m (red color), respectively (Figure 6). Fluid entered the riser from the bottom side, and gravitational acceleration reversed direction from velocity inlet. Simulation variations in fluid velocity inlet were 0.034, 0.068, and 0.102 m/s, while outlet positions had 0.3, 0.4, and 0.6 m, respectively.
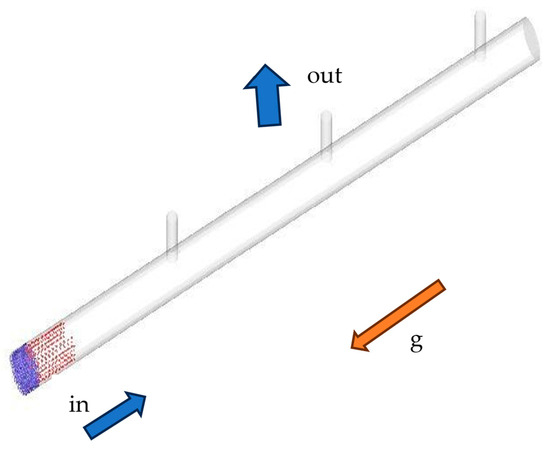
Figure 6.
Initial condition for particle composition.
4. Simulation Results
The transient simulation for high velocity (0.102 m/s) and the upper outlet (0.6 m) is shown in Figure 7. At the initial condition, particle began to be fluidized (2 s) and expanded in the riser (5 s). After 8 s, the small particle moved into a higher position and separated at the upper outlet. At the end of simulation approximately at 300 s, the small particle was completely separated, and big particle remained in the riser.
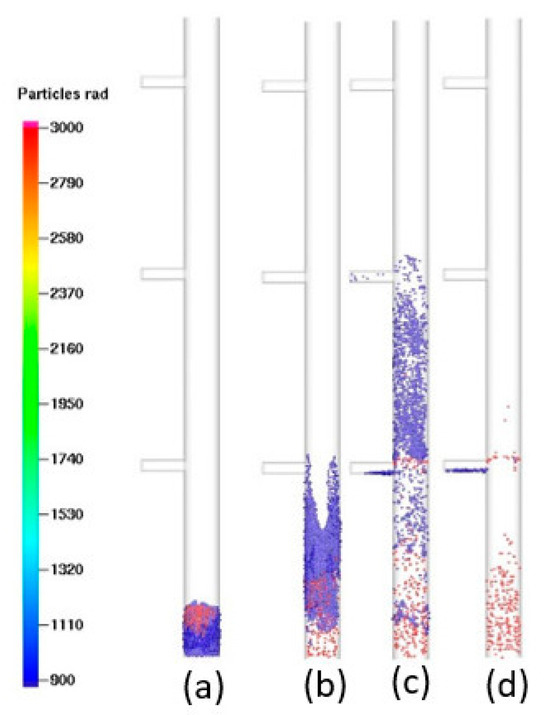
Figure 7.
Fluidization process with fluid velocity at 0.102 m/s, outlet at 0,6 m, and at time (a) 2 s; (b) 5 s; (c) 8 s; and (d) 300 s.
Table 2 shows separation results from the experiment and simulation. At low velocity (0.034 m/s), the majority of particle was not separated since velocity was significantly smaller than terminal velocity. With medium velocity (0.068 m/s), all small particle was separated at the bottom of the riser (0.3 m), although were separated in the middle (0.6 m). An ideal condition for separation was obtained at high velocity (0.102 m/s) and at the top of the riser (0.9 m). Compared to the experimental data, simulation results had small differences. The time step was also smaller than 0.01 s to increase accuracy in capturing dynamic interactions between the particle and fluid during fluidization process.
Table 2.
Accumulated particle weight on separation process for the experimental and simulation results.
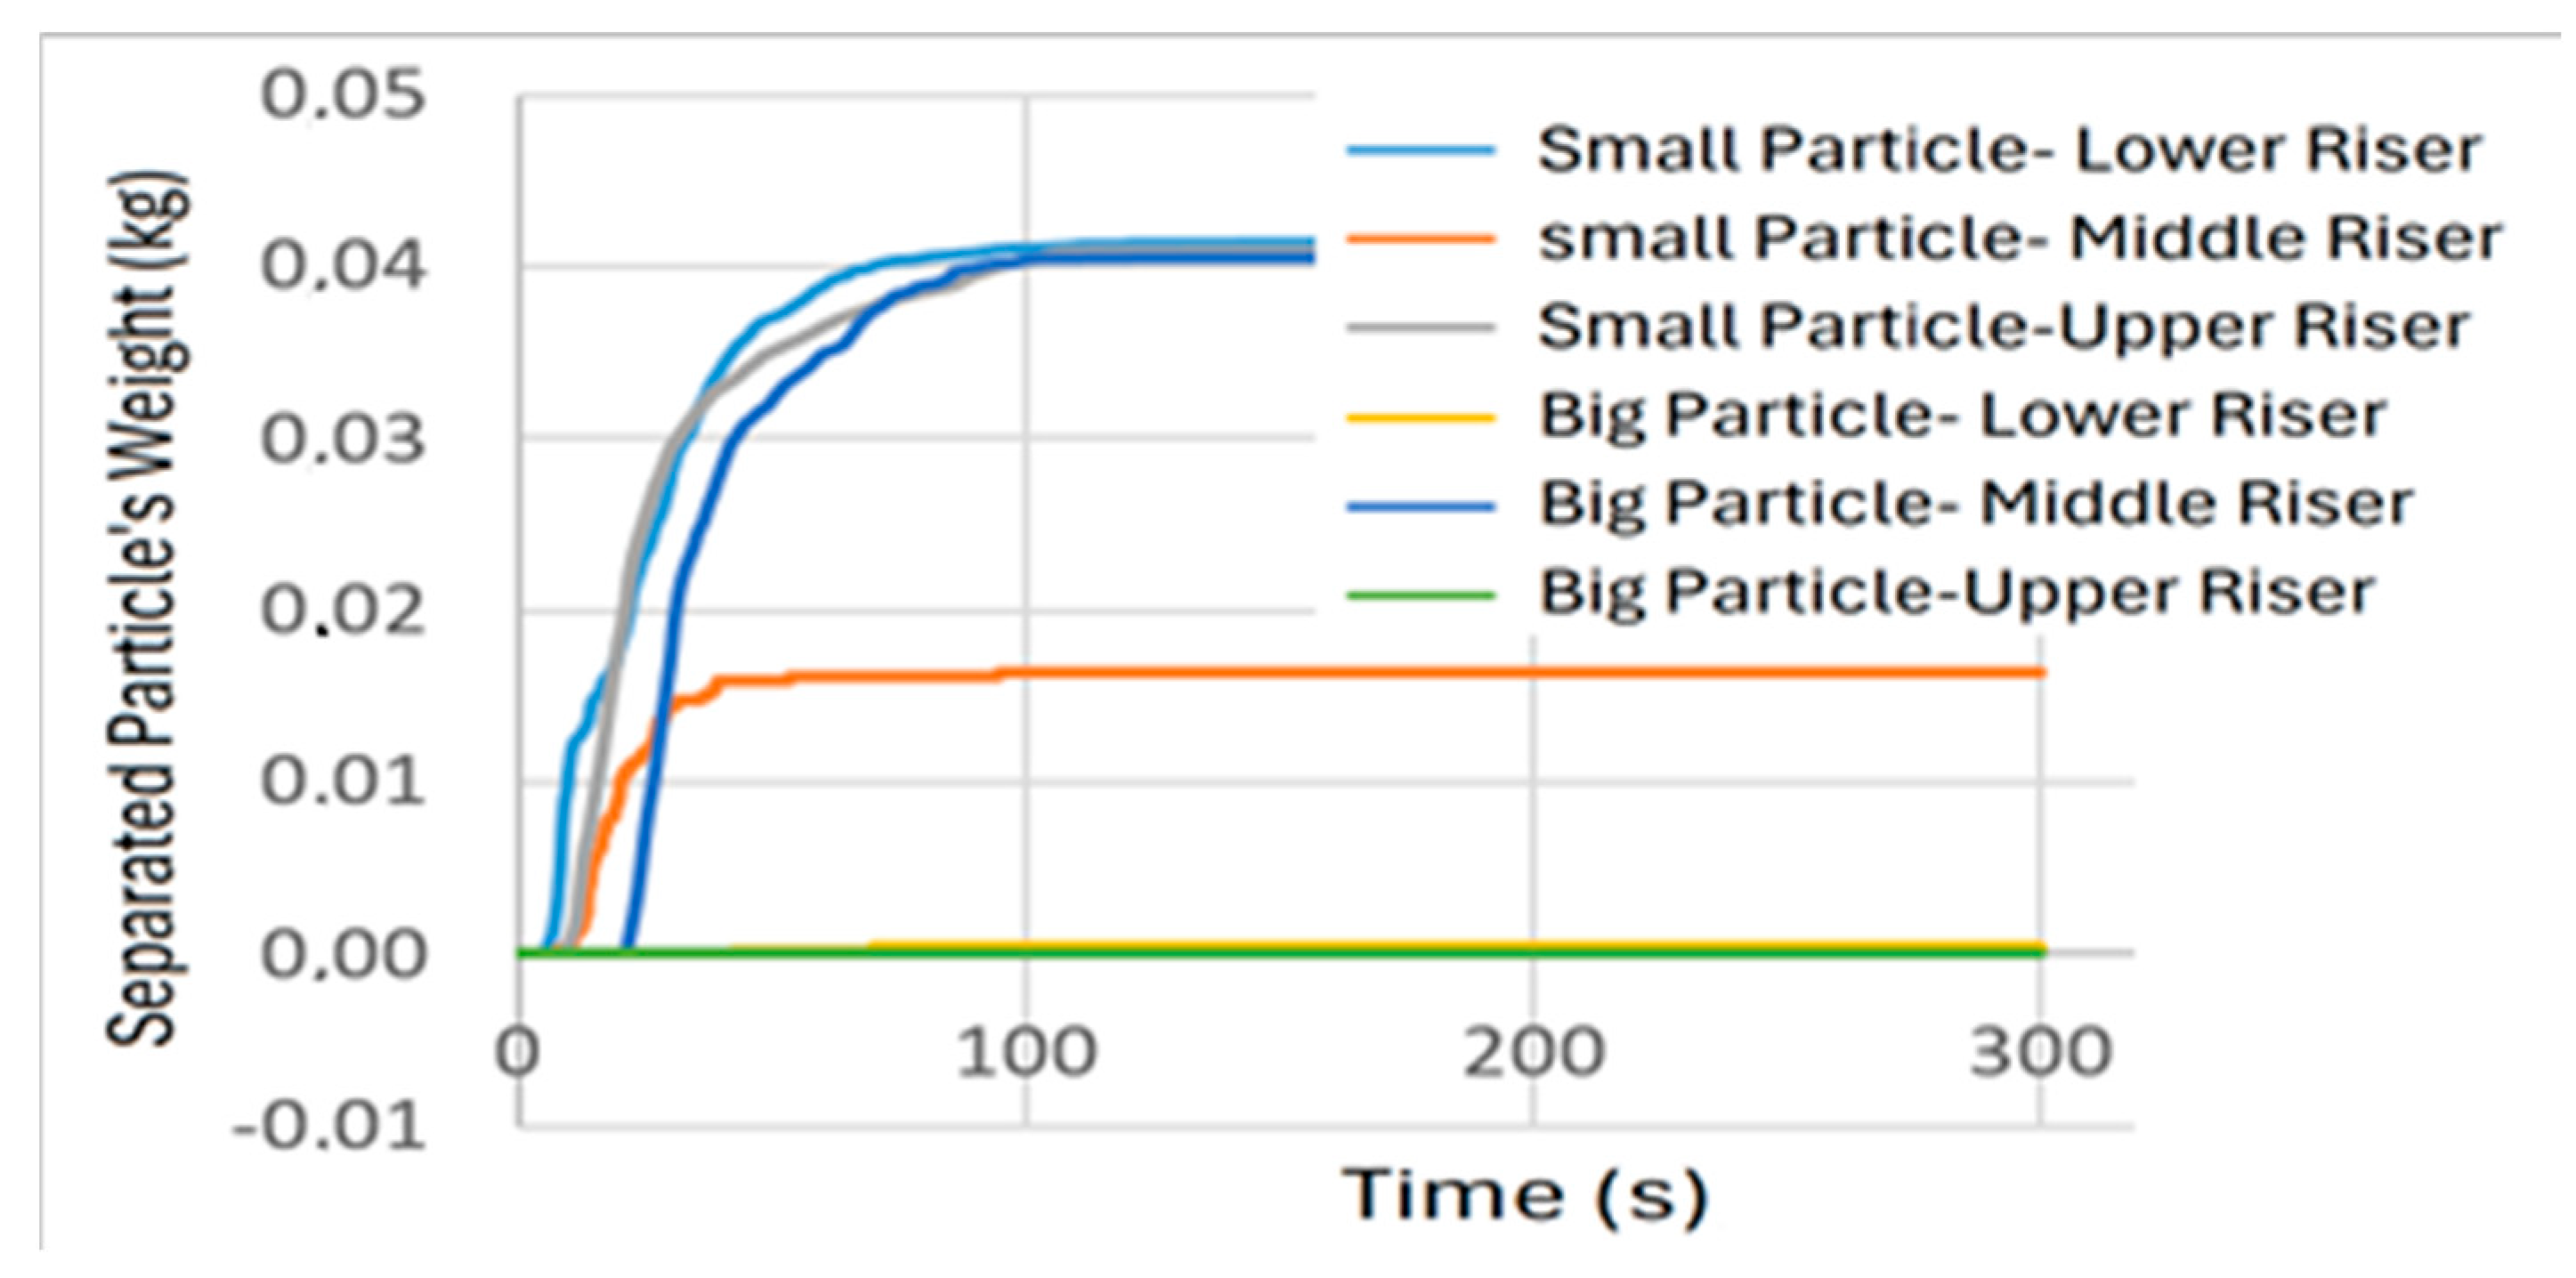
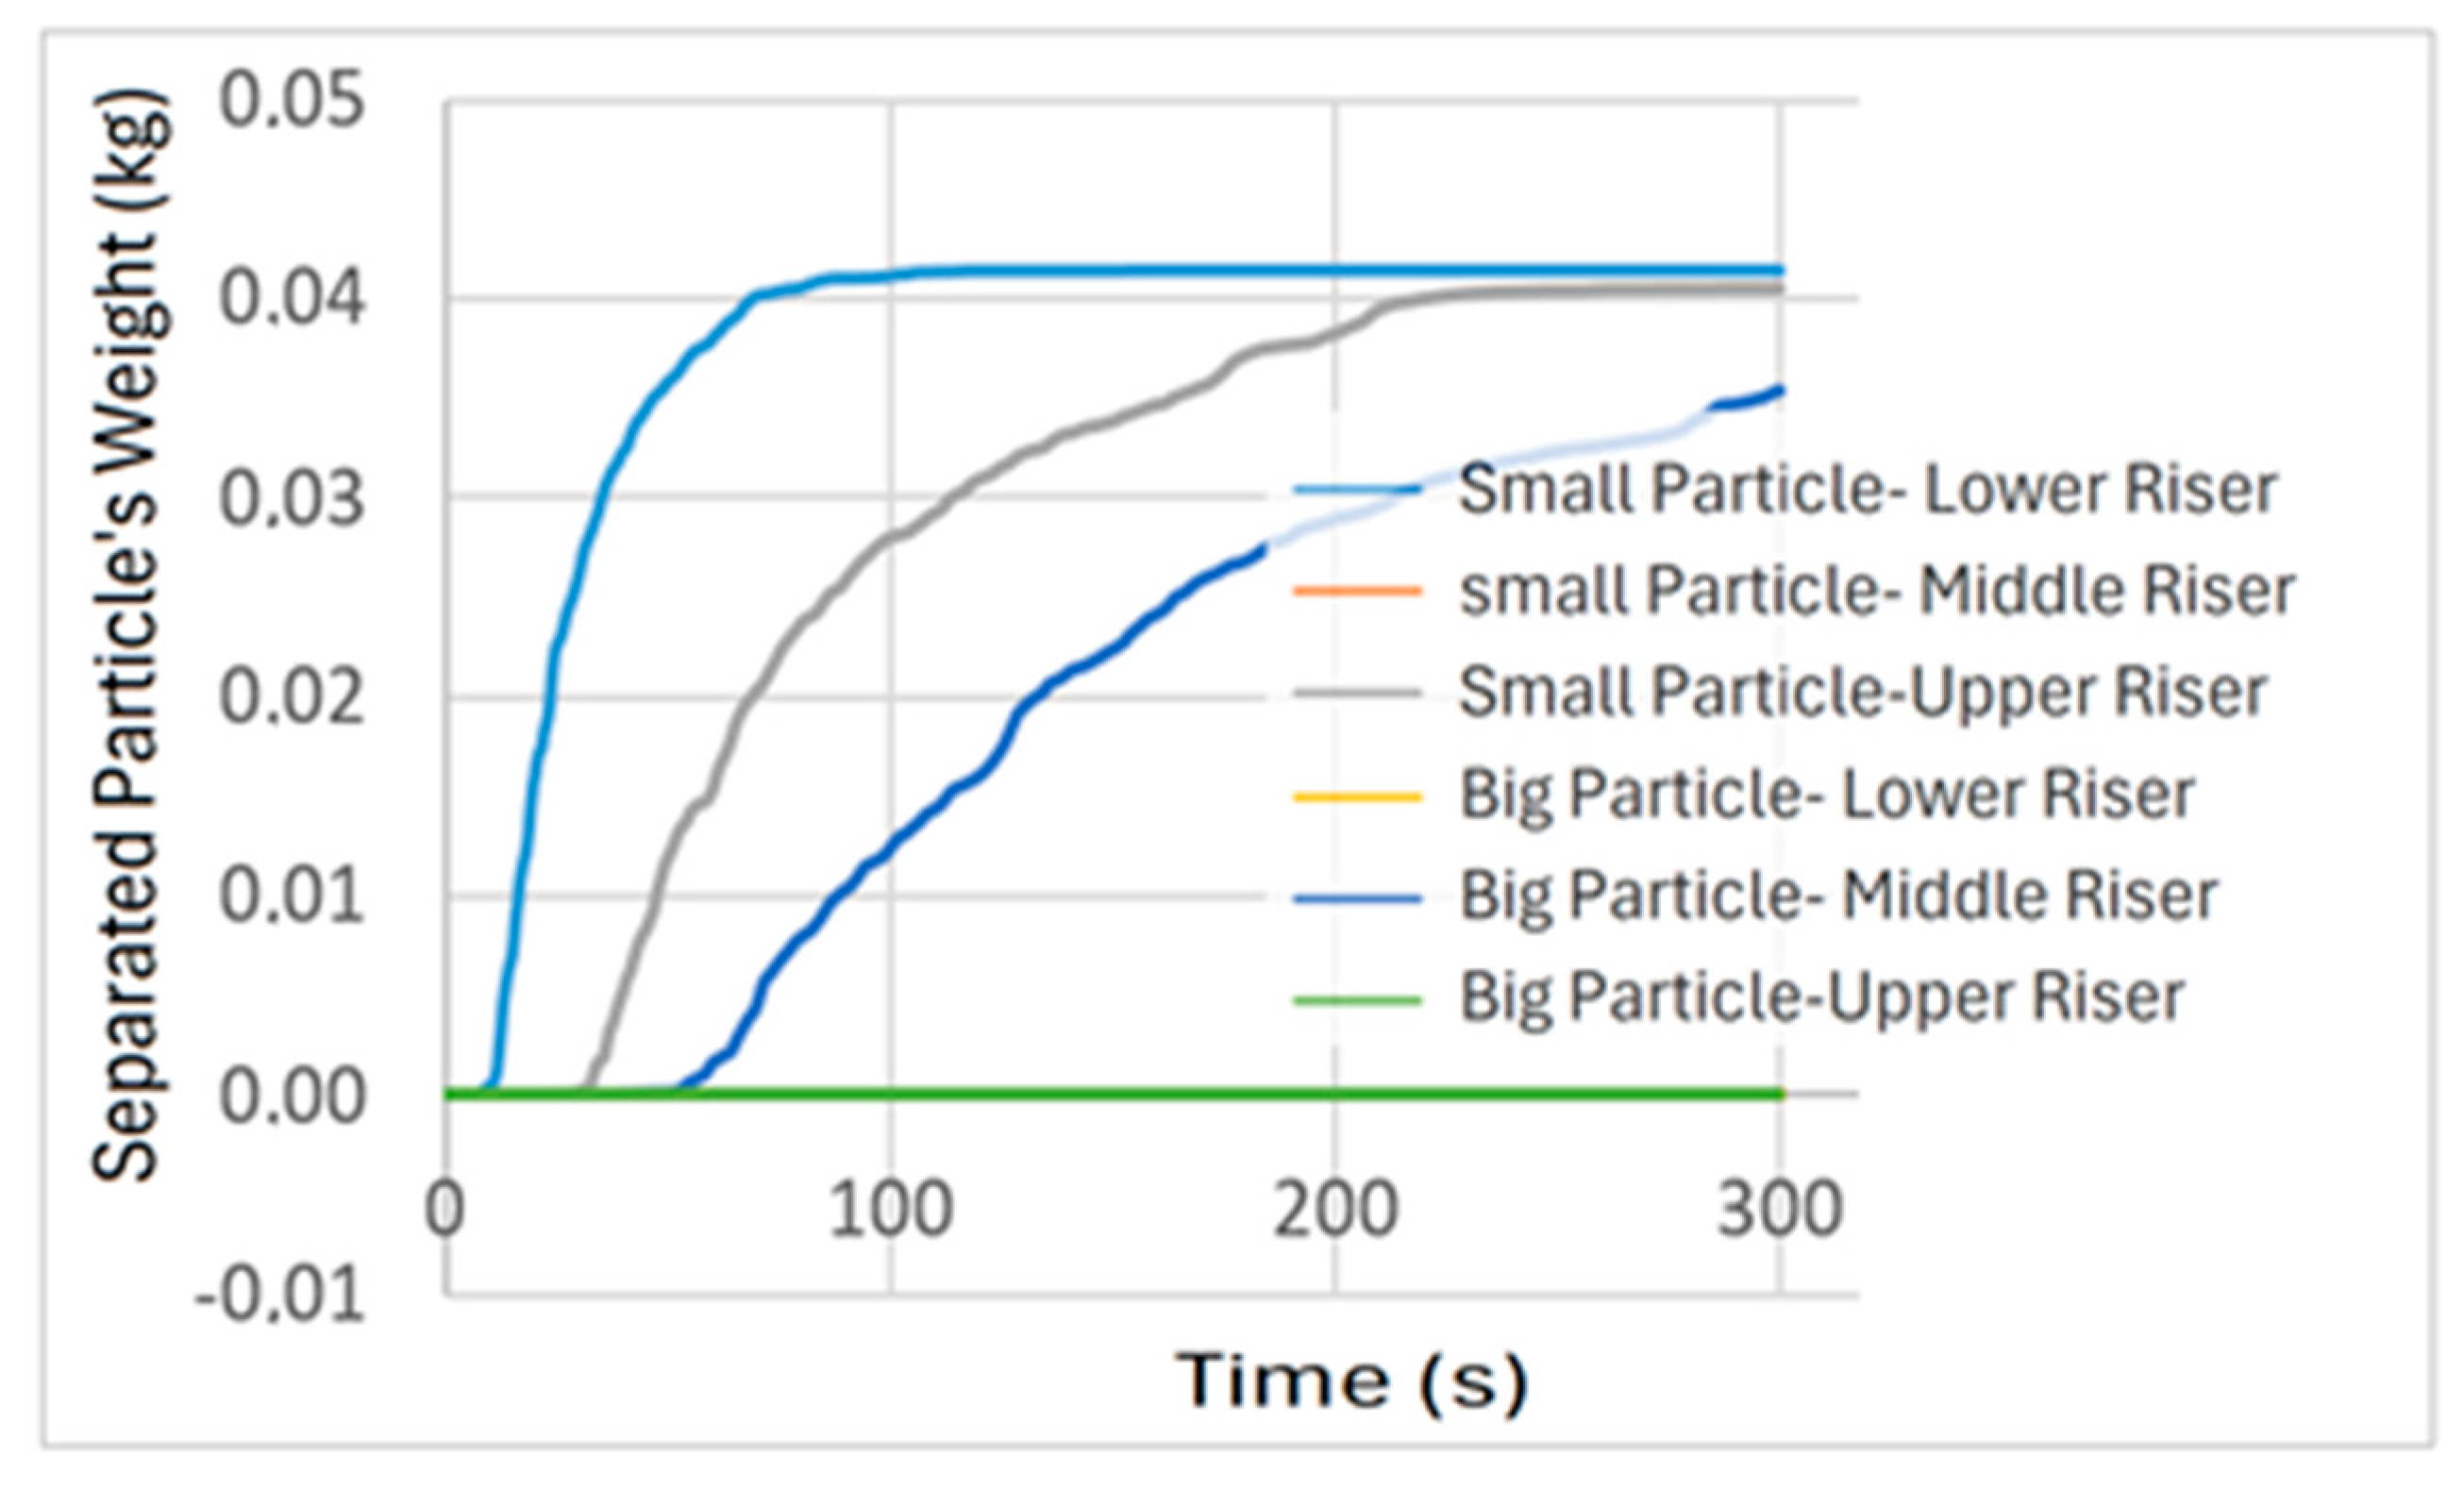
In addition to suitable fluid velocity and outlet position, separation requires optimum time to completely separate small particle. Figure 8 shows that small particle require 100 s to be separated in the upper and lower riser, while big particle needs 100 s for separation in the middle riser.
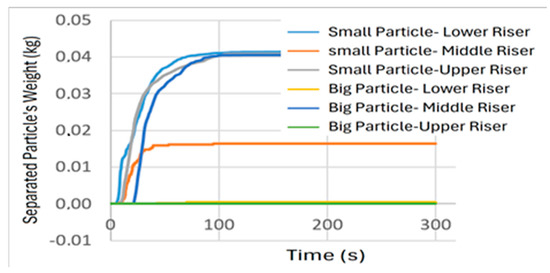
Figure 8.
Particle separation time for fluid velocity at 0.102 m/s.
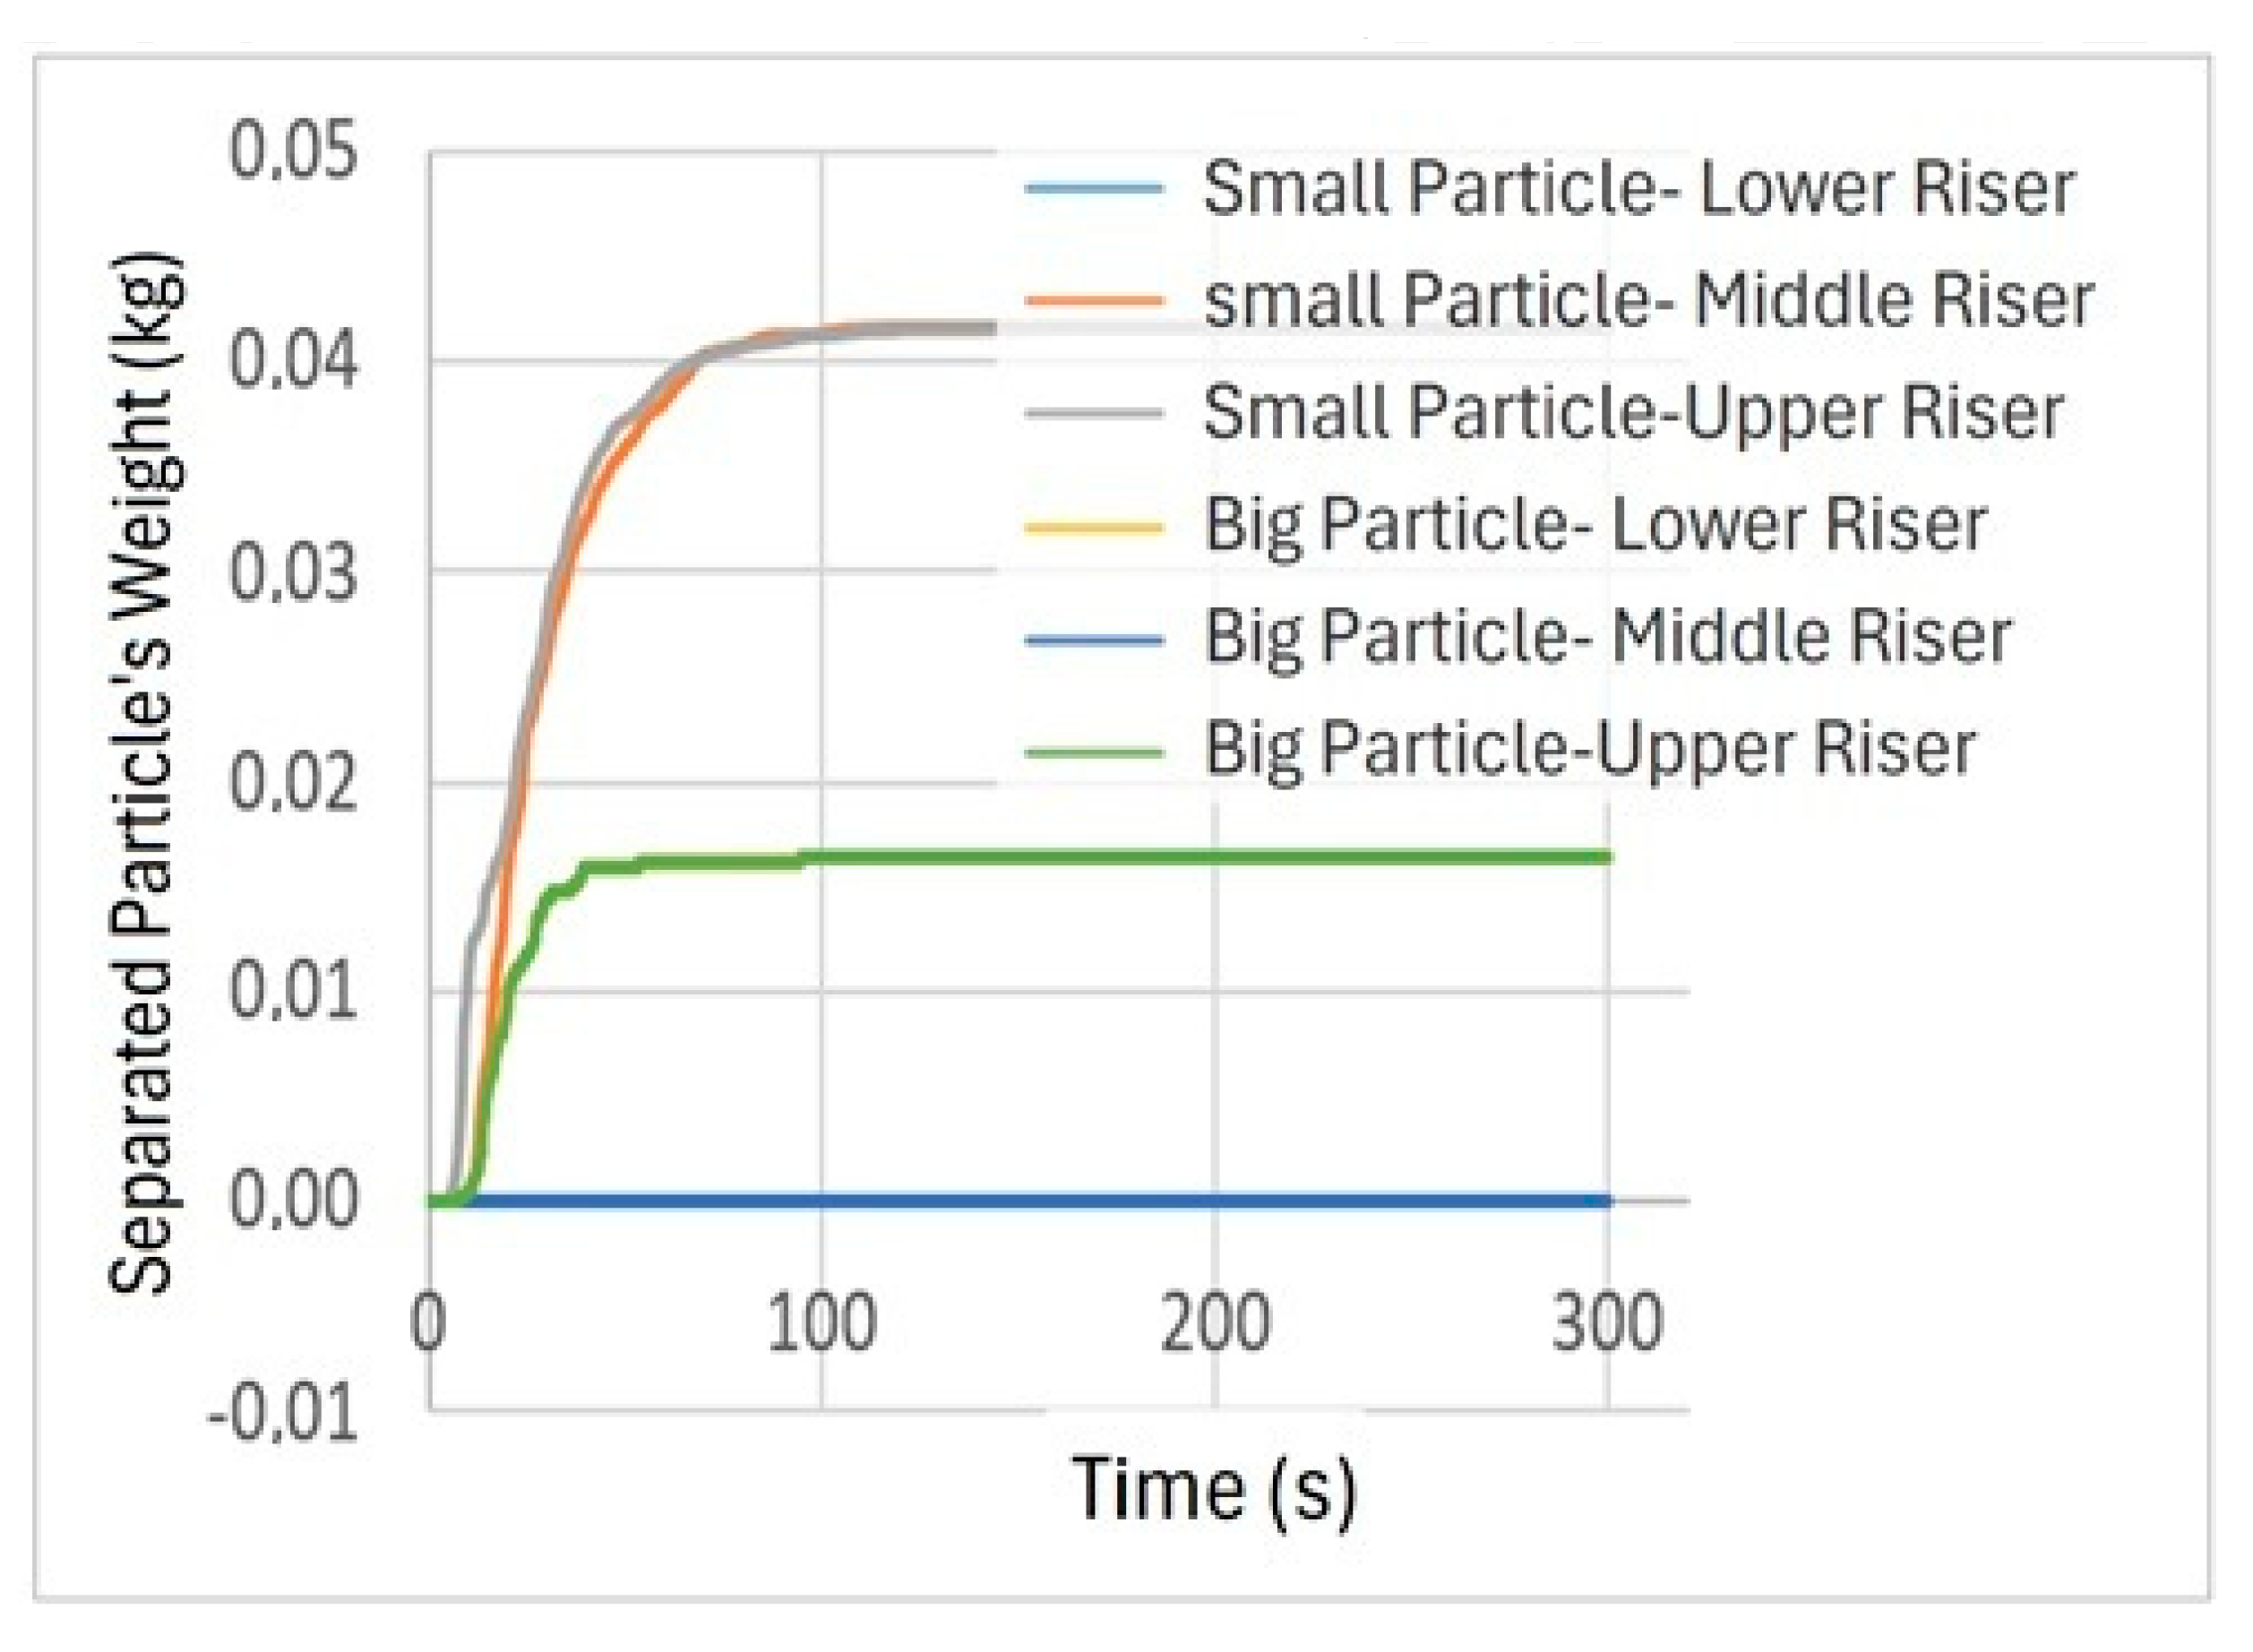
With medium velocity (0.068 m/s), small particle separates at the upper riser after 220 s, while separation of big size occurs at the middle riser at times longer than 300 s (Figure 9). A longer separation time for particle indicates that less velocity causes low particle–fluid interaction in fluidization process. At low velocity (0.034 m/s), small particle separate at the middle and upper riser, while separation of big size occurs in the upper riser (Figure 10).
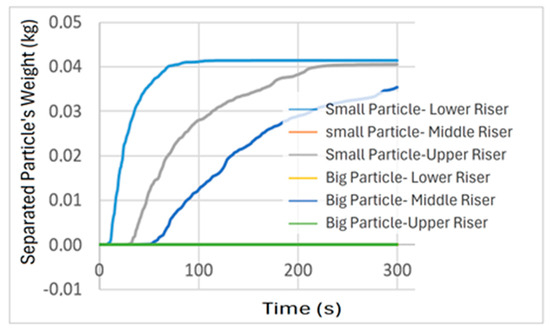
Figure 9.
Particle separation time for fluid velocity at 0.068 m/s.

Figure 10.
Particle separation time for fluid velocity at 0.034 m/s.
5. Conclusions
In conclusion, simulation results were similar to experimental data in estimating accumulated particle separation. The small difference observed could be reduced by selecting simulation time step below 0.01 s. Furthermore, the results showed that particle separation was performed completely by using fluid velocity of 0.102 m/s, with outlet at the upper riser (0.9 m) for small particle and the middle riser (0.6 m) for big sizes. The optimum time for separation was found to be 100 s for small and big particle. At velocity of 0.068 and 0.034, separation was less effective since fluidization process showed low dynamic.
Author Contributions
Resources, N.I.; conceptualization, N.I.; computation, M.L.A.; visualization, M.L.A.; writing—original draft preparation, M.L.A.; writing—review and editing, N.I.; project administration, N.I. All authors have read and agreed to the published version of the manuscript.
Funding
This research received no external funding.
Institutional Review Board Statement
Not applicable.
Informed Consent Statement
Not applicable.
Data Availability Statement
The datasets presented in this article are not readily available due to technical/time limitations. Requests to access the datasets should be directed to ikhwan@me.its.ac.id.
Acknowledgments
The authors gratefully acknowledge financial support from the Institut Teknologi Sepuluh Nopember for this work, under the project scheme of the Publication Writing and IPR Incentive Program (PPHKI) 2023.
Conflicts of Interest
The authors declare no conflict of interest.
References
- Mukherjee, A.K.; Mishra, B.K. Experimental and simulation studies on the role of fluid velocity during particle separation in a liquid-solid fluidized bed. Int. J. Miner. Process. 2007, 82, 211–221. [Google Scholar] [CrossRef]
- Rasul, M.G.; Rudolph, V.; Wang, F.Y. Particles separation using fluidization techniques. Int. J. Miner. Process. 2000, 60, 163–179. [Google Scholar] [CrossRef]
- Basu, P. Circulating Fluidized Bed Boilers Design, Operations, and Maintenance; Springer: Halifax, NS, Canada, 2015; pp. 143–144. [Google Scholar]
- Geldart, D. Types of gas fluidization. Powder Technol. 1973, 7, 285–292. [Google Scholar] [CrossRef]
- Ergun, S. Fluid flow through packed columns. Chem. Eng. Progress 1952, 48, 9–94. [Google Scholar]
- Kunii, D.; Levenspiel, O. Fluidization Engineering, 2nd ed; Butterworth-Heinemann: Oxford, UK, 1991; pp. 155–164. [Google Scholar]
- Smagorinsky, J. General Circulation Experiments with the Primitive Equations. I. The Basic Experiment. Mon. Weather Rev. 1963, 91, 99–164. [Google Scholar] [CrossRef]
- Snider, D.M. An incompressible three dimensional multiphase particle-incell model for dense particle flows. J. Comput. Phys. 2001, 170, 523–549. [Google Scholar] [CrossRef]
- Anderson, T.B.; Jackson, R. A fluid mechanical description of fluidized beds. Ind. Eng. Chem. Fund. 1967, 6, 527–539. [Google Scholar] [CrossRef]
- O’Rourke, P.J.; Zhao, P.; Snider, D. A model for collisional exchange in gas/liquid/solid fluidized beds. Chem. Eng. Sci. 2009, 64, 1784–1797. [Google Scholar] [CrossRef]
- Wen, C.Y. Mechanics of fluidization. Fluid Part. Technol. Chem. Eng. Progress. Symp. Ser. 1966, 62, 100–111. [Google Scholar]
- Anam, A.C.; Ikhwan, N. Experimental study of particle separation using fluidised bed method. In AIP Conference Proceedings, Proceedings of the THERMOFLUID X: 10th International Conference on Thermofluids 2019, Yogyakarta, Indonesia, 5 November 2019; AIP Publishing: Melville, NY, USA, 2019. [Google Scholar] [CrossRef]
- Pusat Penelitian Kelapa Sawit (PPKS), Biodiesel Minyak Sawit. Available online: https://iopri.co.id/product/detail/biodiesel-minyak-sawit (accessed on 15 September 2022).

Disclaimer/Publisher’s Note: The statements, opinions and data contained in all publications are solely those of the individual author(s) and contributor(s) and not of MDPI and/or the editor(s). MDPI and/or the editor(s) disclaim responsibility for any injury to people or property resulting from any ideas, methods, instructions or products referred to in the content. |
© 2025 by the authors. Licensee MDPI, Basel, Switzerland. This article is an open access article distributed under the terms and conditions of the Creative Commons Attribution (CC BY) license (https://creativecommons.org/licenses/by/4.0/).