
Design and Implementation of an Indoor and Outdoor Air Quality Measurement Device for the Detection and Monitoring of Gases with Hazardous Health Effects †

 , ,
, ,
Abstract
1. Introduction
2. Materials, Methodology, Air Quality Index
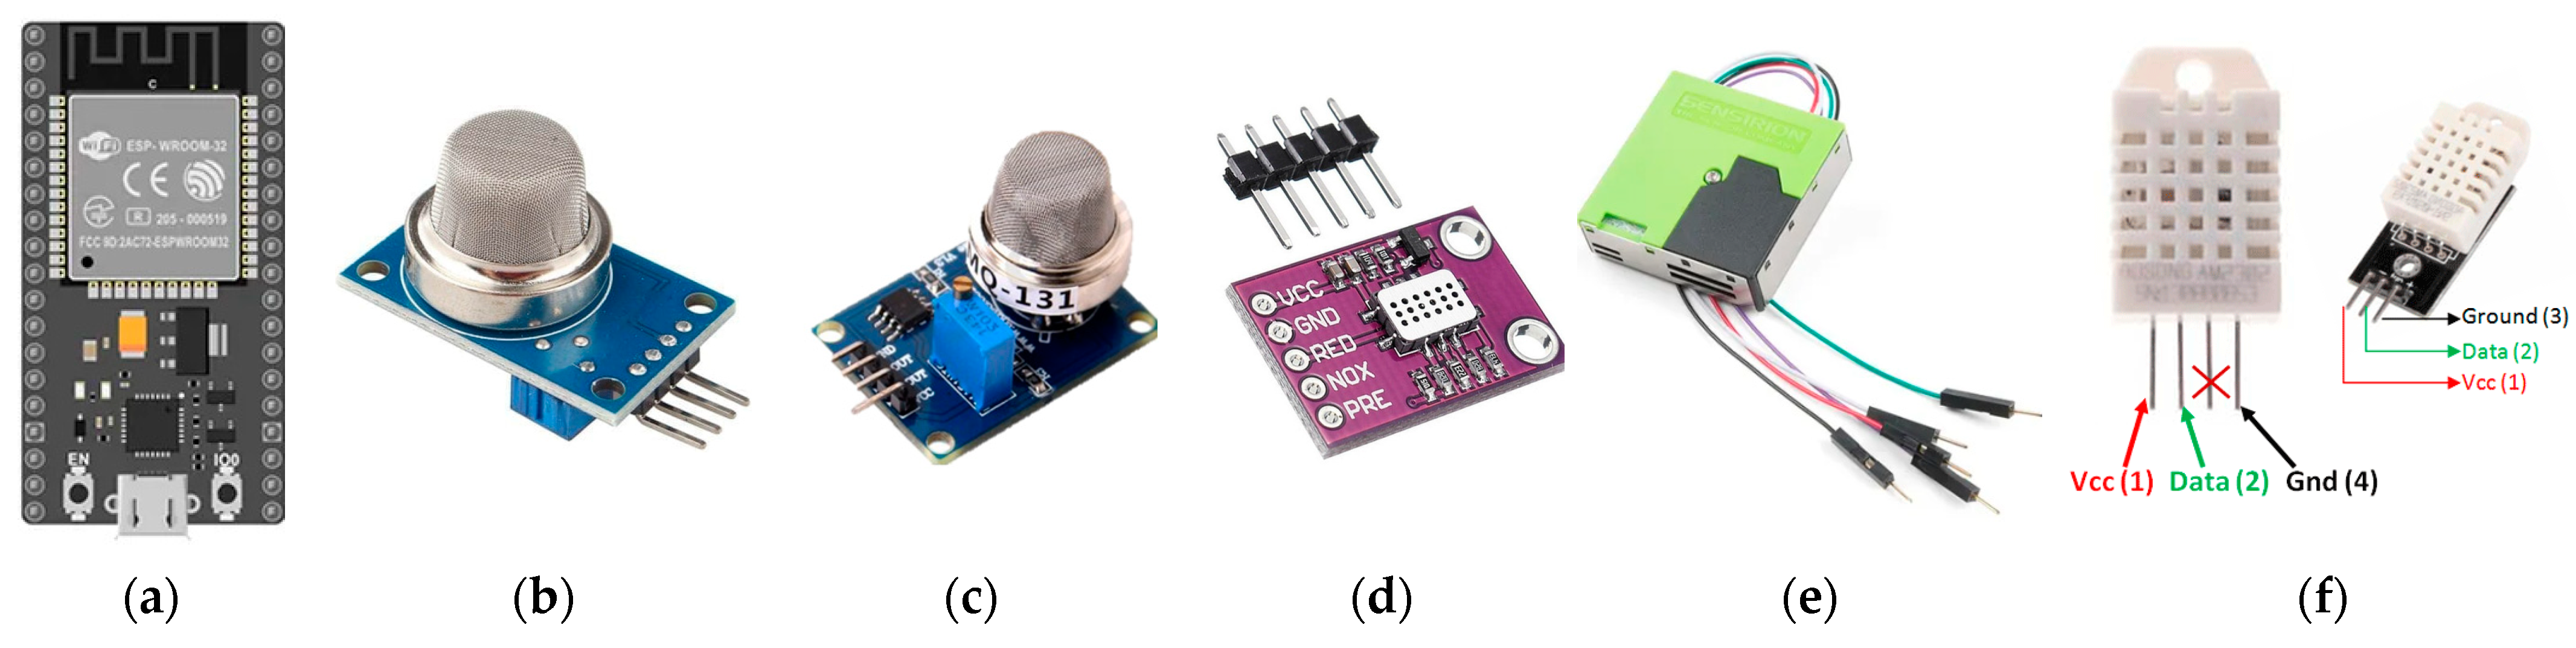
2.1. Materials
2.2. Methodology
- Phase 1:
- Reading
- Phase 2:
- Processing
- Phase 3:
- Storage
- Phase 4:
- Visualization
2.3. Air Quality Index
3. Prototype Design, Printed Circuit Board (PCB) Design, Assembly, Data Display Interface Design
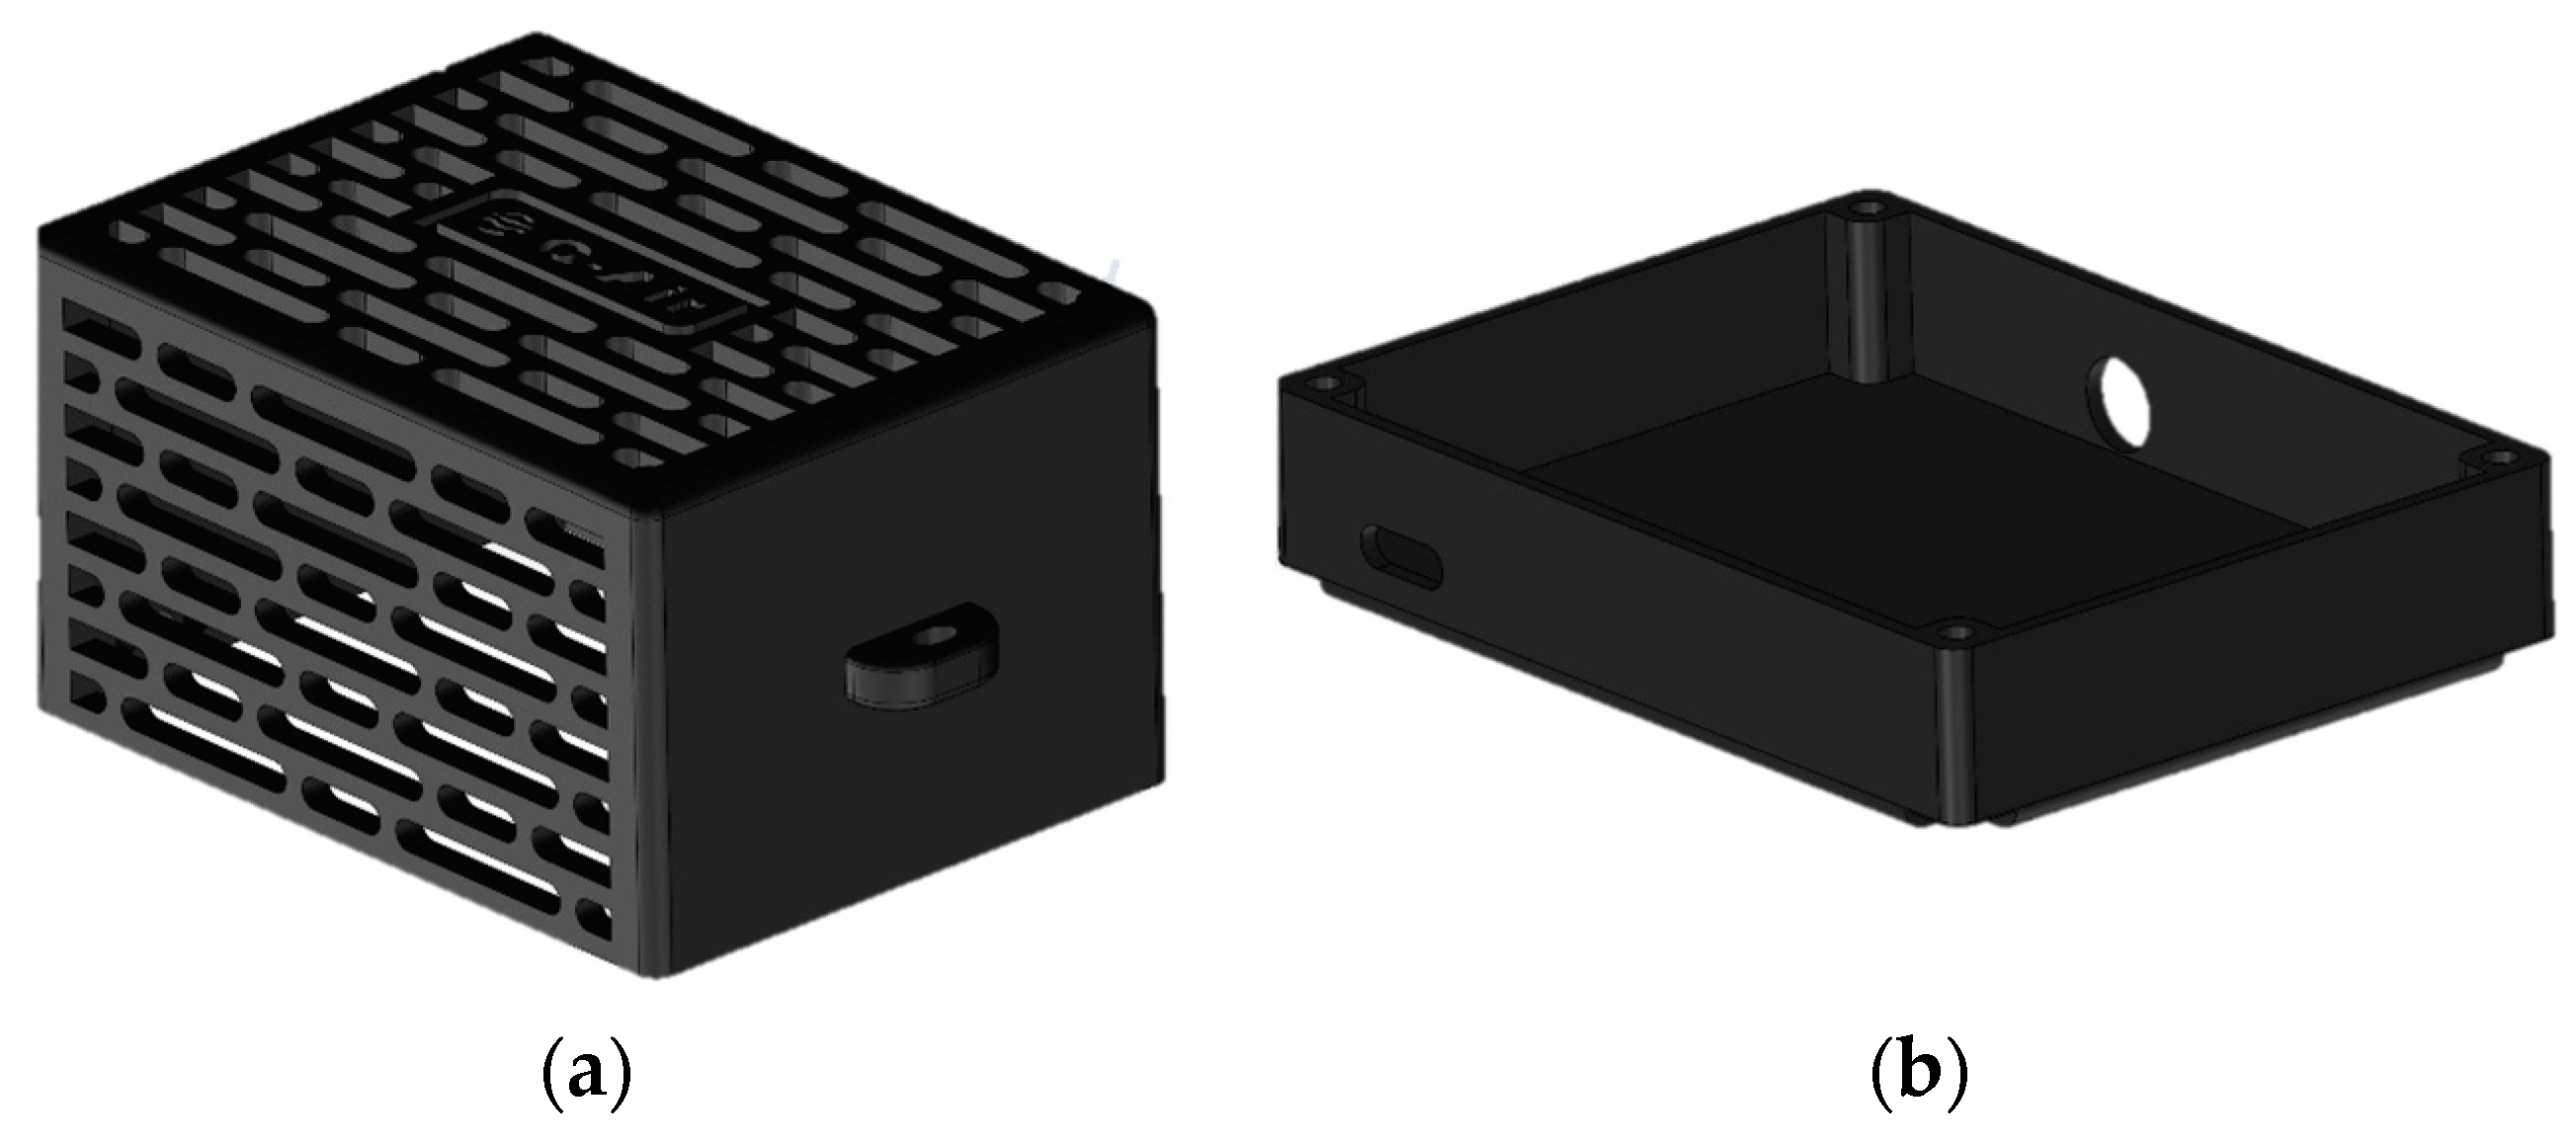
3.1. Prototype Design
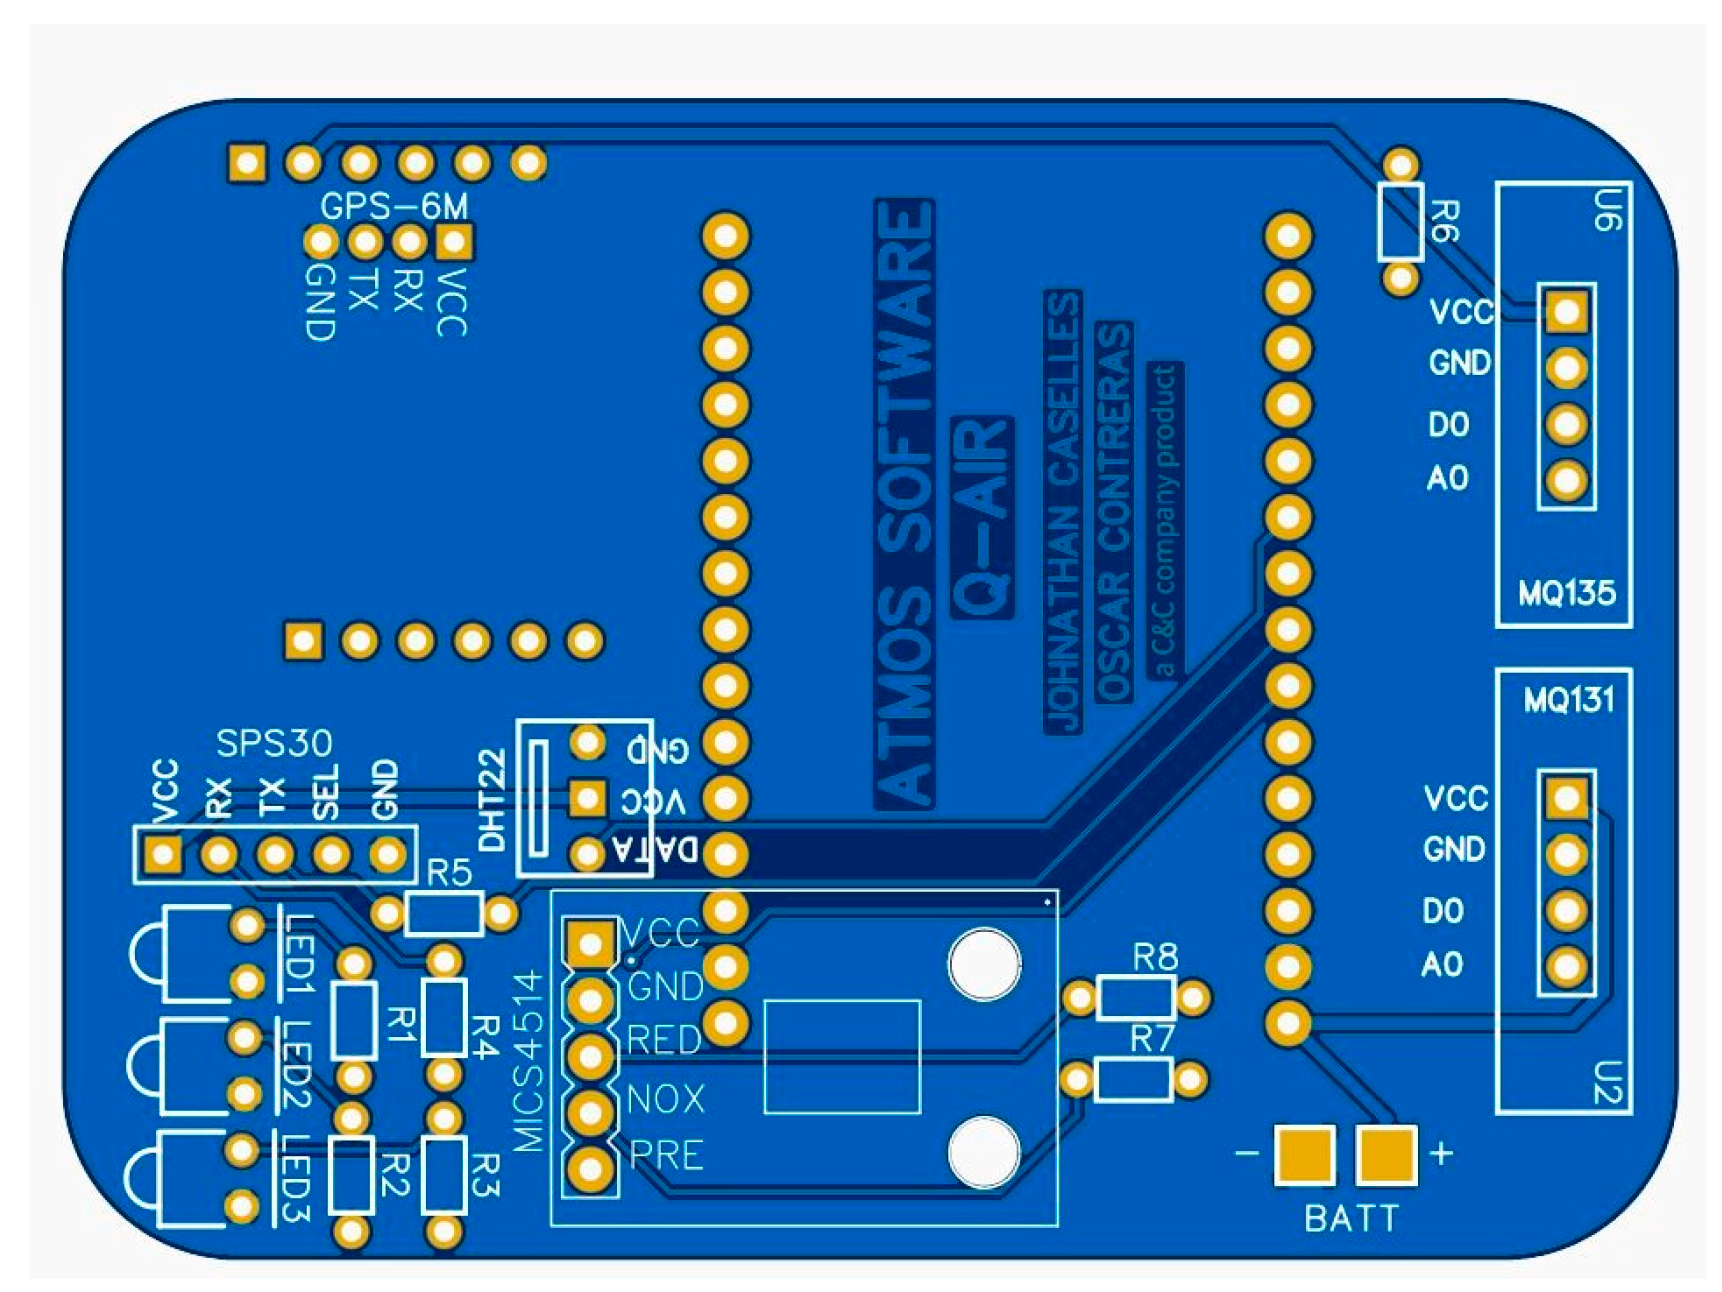
3.2. PCB Desing
3.3. Assembly
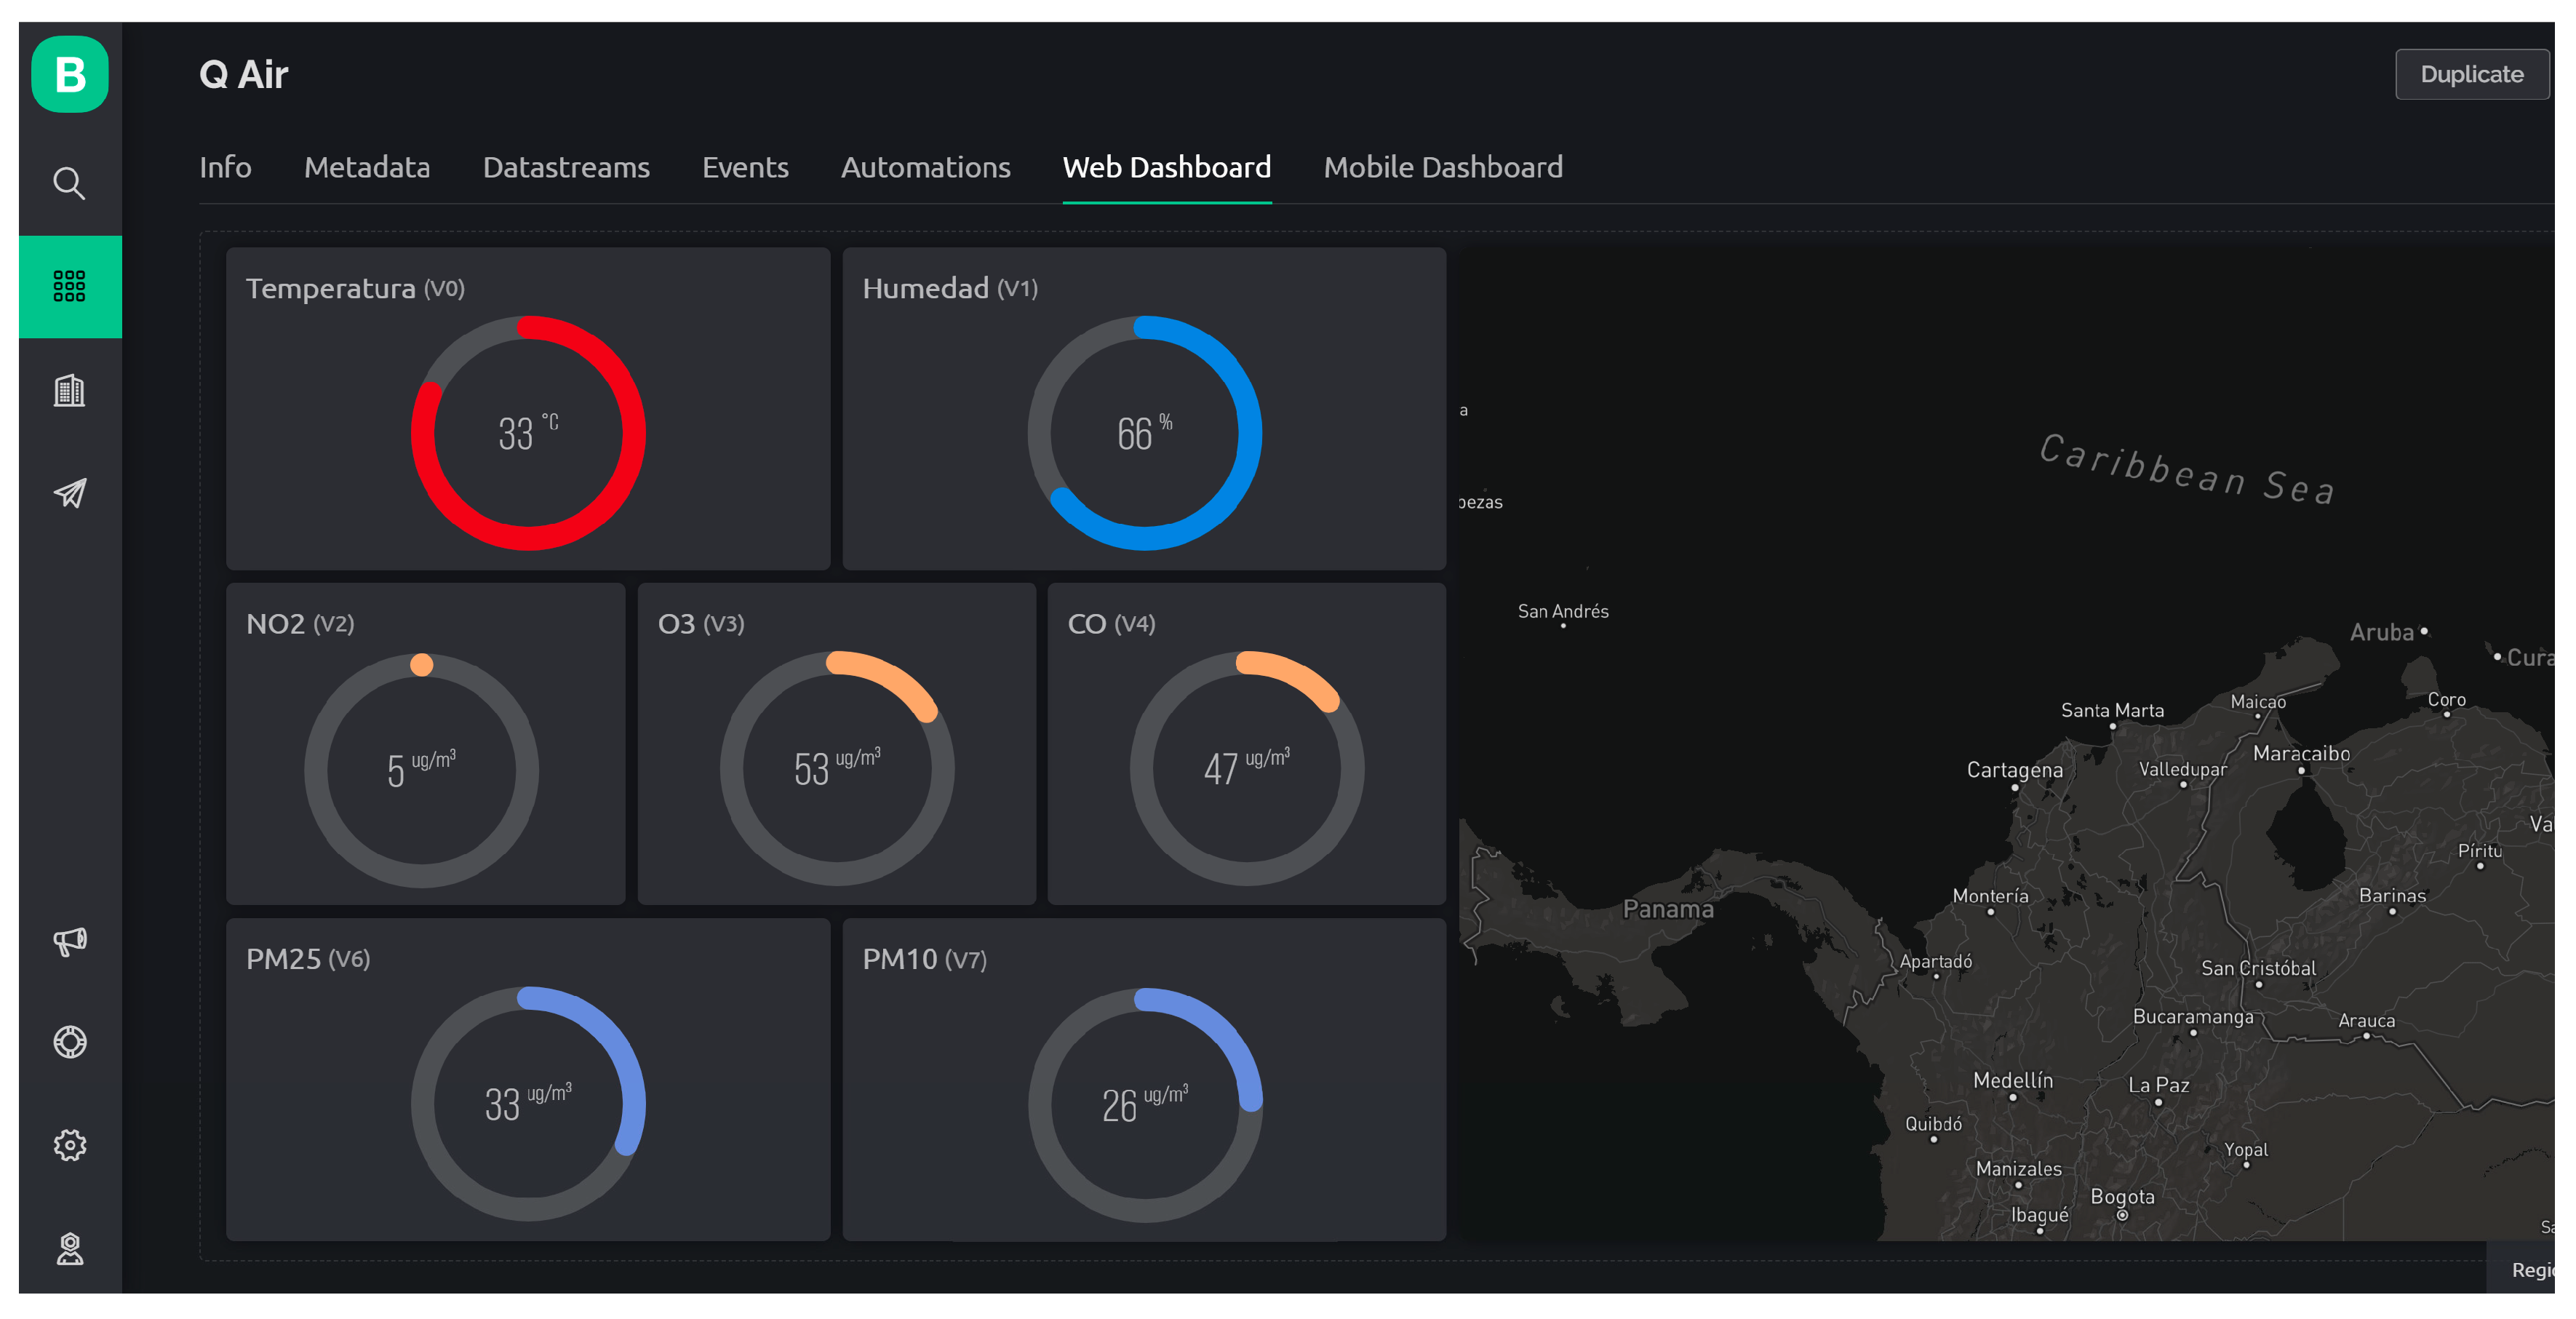
3.4. Data Visualization Interface Design
4. Data Collection, Analysis of the Tests Performed by the Device
4.1. Data Collection
4.2. Test Analysis Performed by the Device
5. Conclusions and Recommendations
Author Contributions
Funding
Institutional Review Board Statement
Informed Consent Statement
Data Availability Statement
Conflicts of Interest
References
- OMS. [En línea]. 2007. Volume 3, pp. 154–196. Available online: https://www.who.int/data/gho/data/themes/air-pollution?lang=en (accessed on 3 November 2022).
- Minambiente. [En línea]. Personal Communication. 2012. Available online: https://www.minambiente.gov.co/asuntos-ambientales-sectorial-y-urbana/contaminacion-atmosferica/#:~:text=La%20contaminaci%C3%B3n%20atmosf%C3%A9rica%20en%20Colombia,y%20de%20los%20desastres%20naturales (accessed on 3 November 2022).
- Uelectronics. Uelectronics. [En línea]. Available online: https://uelectronics.com/producto/mq-135-modulo-detector-de-calidad-de-aire/ (accessed on 21 October 2022).
- Electronicaplugandplay. Electronicaplugandplay. [En línea]. Available online: https://www.electronicaplugandplay.com/sensores-y-transductores/product/833-module-mq-131-ozone (accessed on 21 October 2022).
- SGX Sensortech. MiCS-4514 Datasheet. 2014. [Online]. Available online: https://www.sgxsensortech.com/content/uploads/2014/08/0278_Datasheet-MiCS-4514.pdf (accessed on 21 October 2022).
- Ryan, J. Hackster. 29 December 2018. [En línea]. Available online: https://www.hackster.io/rpj/atmospheric-particulate-matter-environmental-sensing-fb31a1 (accessed on 21 October 2022).
- Naylampmechatronics. Naylampmechatronics. [En línea]. Available online: https://naylampmechatronics.com/sensores-temperatura-y-humedad/58-sensor-de-temperatura-y-humedad-relativa-dht22-am2302.html (accessed on 21 October 2022).
- Suconel, Suconel. [En línea]. Available online: https://suconel.com/productos/tarjeta-de-desarrollo-con-wifi-bluetooth-38pines-esp32 (accessed on 21 October 2022).
- Caselles Nuñez, J.G.; Contreras Negrette, O.A. Diseño e Implementación de un Dispositivo de Medición de la Calidad del aire en Recintos Abiertos y Cerrados para la Detección y Medición de Gases Nocivos para la Salud. Universidad Autónoma del Caribe, Facultad de Ingeniería, Programa de Ingeniería Mecatrónica, Barranquilla, Colombia. 2023. Available online: http://repositorio.uac.edu.co/bitstream/handle/11619/4111/IMK0161.pdf?isAllowed=y&sequence=1 (accessed on 19 November 2023).
- Ministerio de Ambiente y Desarrollo Sostenible. Resolución 2254 de 2017. Colombia. 2017. [Online]. Available online: https://www.minambiente.gov.co/wp-content/uploads/2021/10/Resolucion-2254-de-2017.pdf (accessed on 21 October 2022).


| Component | Manufacturer | Manufacturing Site | Acquired in |
|---|---|---|---|
| ESP32 | Espressif Systems | Shanghai, China | Bogotá, Colombia |
| MQ135, MQ131 | Winsen | Zhengzhou, China | Bogotá, Colombia |
| MiCS-4514 | Amphenol SGX Sensortech | Corcelles-Cormondrèche, Switzerland | Bogotá, Colombia |
| SPS30 | Sensirion AG | Stäfa, Switzerland | Bogotá, Colombia |
| DHT22 (AM2302) | Aosong Electronics | Guangzhou, China | Bogotá, Colombia |
| Range (μg/m3) | Color | Quality | Effects |
|---|---|---|---|
| 0–50 | Green | Good | Air pollution represents a low risk to health. |
| 51–100 | Yellow | Acceptable | Possible respiratory symptoms in sensitive population groups. |
| 101–150 | Orange | Harmful to the health of sensitive groups | Sensitive population groups may present health effects. (1) Tropospheric ozone: People with lung disease, children, the elderly, and those who are constantly engaged in outdoor physical activity should reduce their exposure to air pollutants. (2) Particulate matter: People with heart or lung disease, the elderly and children are considered sensitive and therefore at greater risk. |
| 151–200 | Red | Harmful to health | All individuals may experience initial health effects. Sensitive groups may experience more severe health effects. |
| 201–300 | Purple | Highly harmful to health | State of alert, indicating that everyone may experience more serious health effects. |
| 301–500 | Brown | Hazardous | Health warning. The entire population may have serious adverse effects on human health and are susceptible to serious health effects. |
| Air Quality Index | Cut-Off Points ICA | |||||||
|---|---|---|---|---|---|---|---|---|
| ICA Range | Category | PM10 μg/m3 24 h | PM2.5 μg/m3 24 h | CO μg/m3 8 h | SO2 μg/m3 1 h | NO2 μg/m3 1 h | O3 μg/m3 8 h | O3 μg/m3 1 h |
| 0–50 | Green | 0–54 | 0–12 | 0–5094 | 0–93 | 0–100 | 0–106 | --- |
| 51–100 | Yellow | 55–154 | 13–37 | 5095–10,819 | 94–197 | 101–189 | 107–138 | --- |
| 101–150 | Orange | 155–254 | 38–55 | 10,820–14,254 | 198–486 | 190–677 | 139–167 | 245–323 |
| 151–200 | Red | 255–354 | 56–150 | 14,255–17,688 | 487–797 | 678–1221 | 168–207 | 324–401 |
| 201–300 | Purple | 355–424 | 151–250 | 17,689–34,862 | 798–1583 | 1222–2349 | 208–393 | 402–794 |
| 301–500 | Brown | 425–604 | 251–500 | 34,863–57,703 | 1584–2629 | 2350–3853 | 394 | 795–1185 |
| Time (s) | Temperature (°C) | Humidity (%) | NO2 (ppm) | O3 (μg/m3) | CO (μg/m3) | PM2.5 (μg/m3) | PM10 (μg/m3) |
|---|---|---|---|---|---|---|---|
| 0 | 32.01 | 58.9 | 4.96 | 20.54 | 89.22 | 13.91 | 26.44 |
| 30 | 32.01 | 58.4 | 4.96 | 18.89 | 89.22 | 13.89 | 26.4 |
| 60 | 32.01 | 59 | 4.83 | 20.85 | 86.04 | 13.89 | 26.39 |
| 90 | 32.01 | 59.1 | 4.96 | 21.49 | 89.04 | 13.89 | 26.39 |
| 120 | 32.02 | 59.3 | 5.09 | 20.08 | 92.52 | 13.88 | 26.38 |
| 150 | 32.02 | 59 | 5.19 | 20.54 | 94.97 | 13.89 | 26.4 |
| 180 | 32.1 | 59.3 | 5.09 | 18.75 | 92.34 | 13.92 | 26.46 |
| 210 | 32 | 59 | 4.85 | 18.84 | 86.39 | 13.93 | 26.48 |
| 240 | 32.05 | 58.7 | 5.01 | 20.13 | 90.49 | 13.92 | 26.45 |
| 270 | 32.04 | 58.3 | 5.14 | 22.97 | 93.65 | 13.93 | 26.49 |
| 300 | 32.04 | 58.9 | 4.76 | 19.79 | 84.15 | 13.94 | 26.51 |
| 330 | 32 | 58.6 | 4.88 | 18.39 | 87.09 | 13.94 | 26.51 |
| 360 | 31.9 | 58.6 | 5.14 | 21.6 | 93.65 | 13.95 | 26.51 |
| 390 | 32 | 58.4 | 4.98 | 20.33 | 89.59 | 13.96 | 26.55 |
| 420 | 31.95 | 58.8 | 4.78 | 19.64 | 84.66 | 13.97 | 26.56 |
| Time (s) | Temperature (°C) | Humidity (%) | NO2 (ppm) | O3 (μg/m3) | CO (μg/m3) | PM2.5 (μg/m3) | PM10 (μg/m3) |
|---|---|---|---|---|---|---|---|
| 0 | 27.6 | 74.5 | 3.6 | 56 | 125.14 | 14.73 | 28.2 |
| 30 | 27.6 | 74.5 | 3.72 | 60.92 | 130.63 | 14.74 | 28.22 |
| 60 | 27.7 | 74.3 | 3.66 | 56 | 127.99 | 14.74 | 28.22 |
| 90 | 27.6 | 74.8 | 3.45 | 58.94 | 117.92 | 14.73 | 28.2 |
| 120 | 27.7 | 74.6 | 3.71 | 63.04 | 130.36 | 14.73 | 28.2 |
| 150 | 27.7 | 74.5 | 3.93 | 66.18 | 140.85 | 14.72 | 28.18 |
| 180 | 27.7 | 74.5 | 3.79 | 65.54 | 134.14 | 14.71 | 28.15 |
| 210 | 27.6 | 74.7 | 3.59 | 64.5 | 124.63 | 14.7 | 28.13 |
| 240 | 27.7 | 74.7 | 3.71 | 62.46 | 130.1 | 14.7 | 28.14 |
| 270 | 27.7 | 74.2 | 3.79 | 60.24 | 133.87 | 14.71 | 28.17 |
| 300 | 27.7 | 74.5 | 3.64 | 57.92 | 126.69 | 14.72 | 28.18 |
| 330 | 27.8 | 74.4 | 3.86 | 64.16 | 137.46 | 14.74 | 28.22 |
| 360 | 27.8 | 74.4 | 3.67 | 60.38 | 128.25 | 14.74 | 28.22 |
| 390 | 27.8 | 74.6 | 3.56 | 57.06 | 123.11 | 14.75 | 28.24 |
| 420 | 27.8 | 74.2 | 3.46 | 59.84 | 118.4 | 14.75 | 28.24 |
| Variables | Average Readings (μg/m3) | Reference Readings (μg/m3) | Rate of Error (%) |
|---|---|---|---|
| Temperature | 32.09 | 32 | 0.281 |
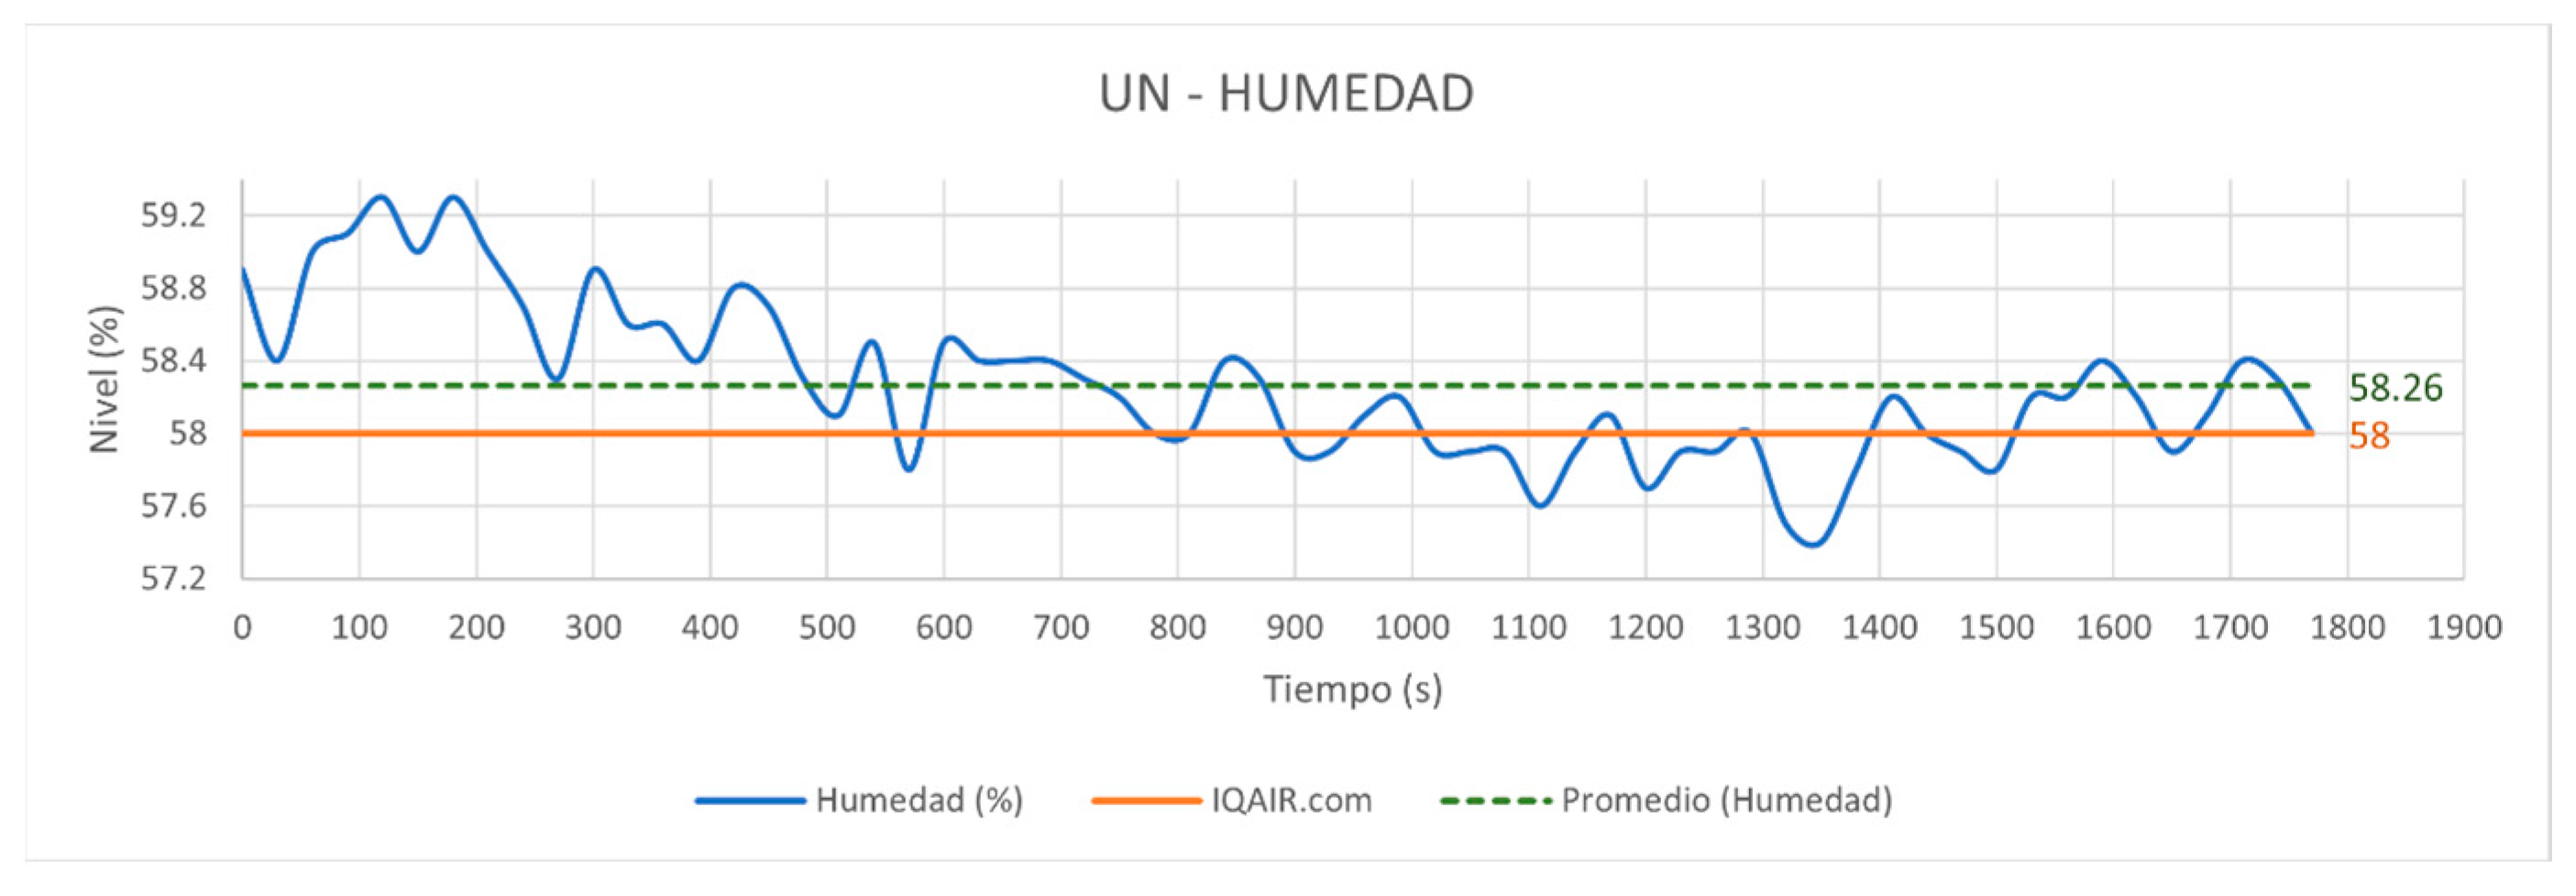
| Humidity | 58.26 | 58 | 0.448 |
| NO2 | 4.96 | 5.02 | 1.195 |
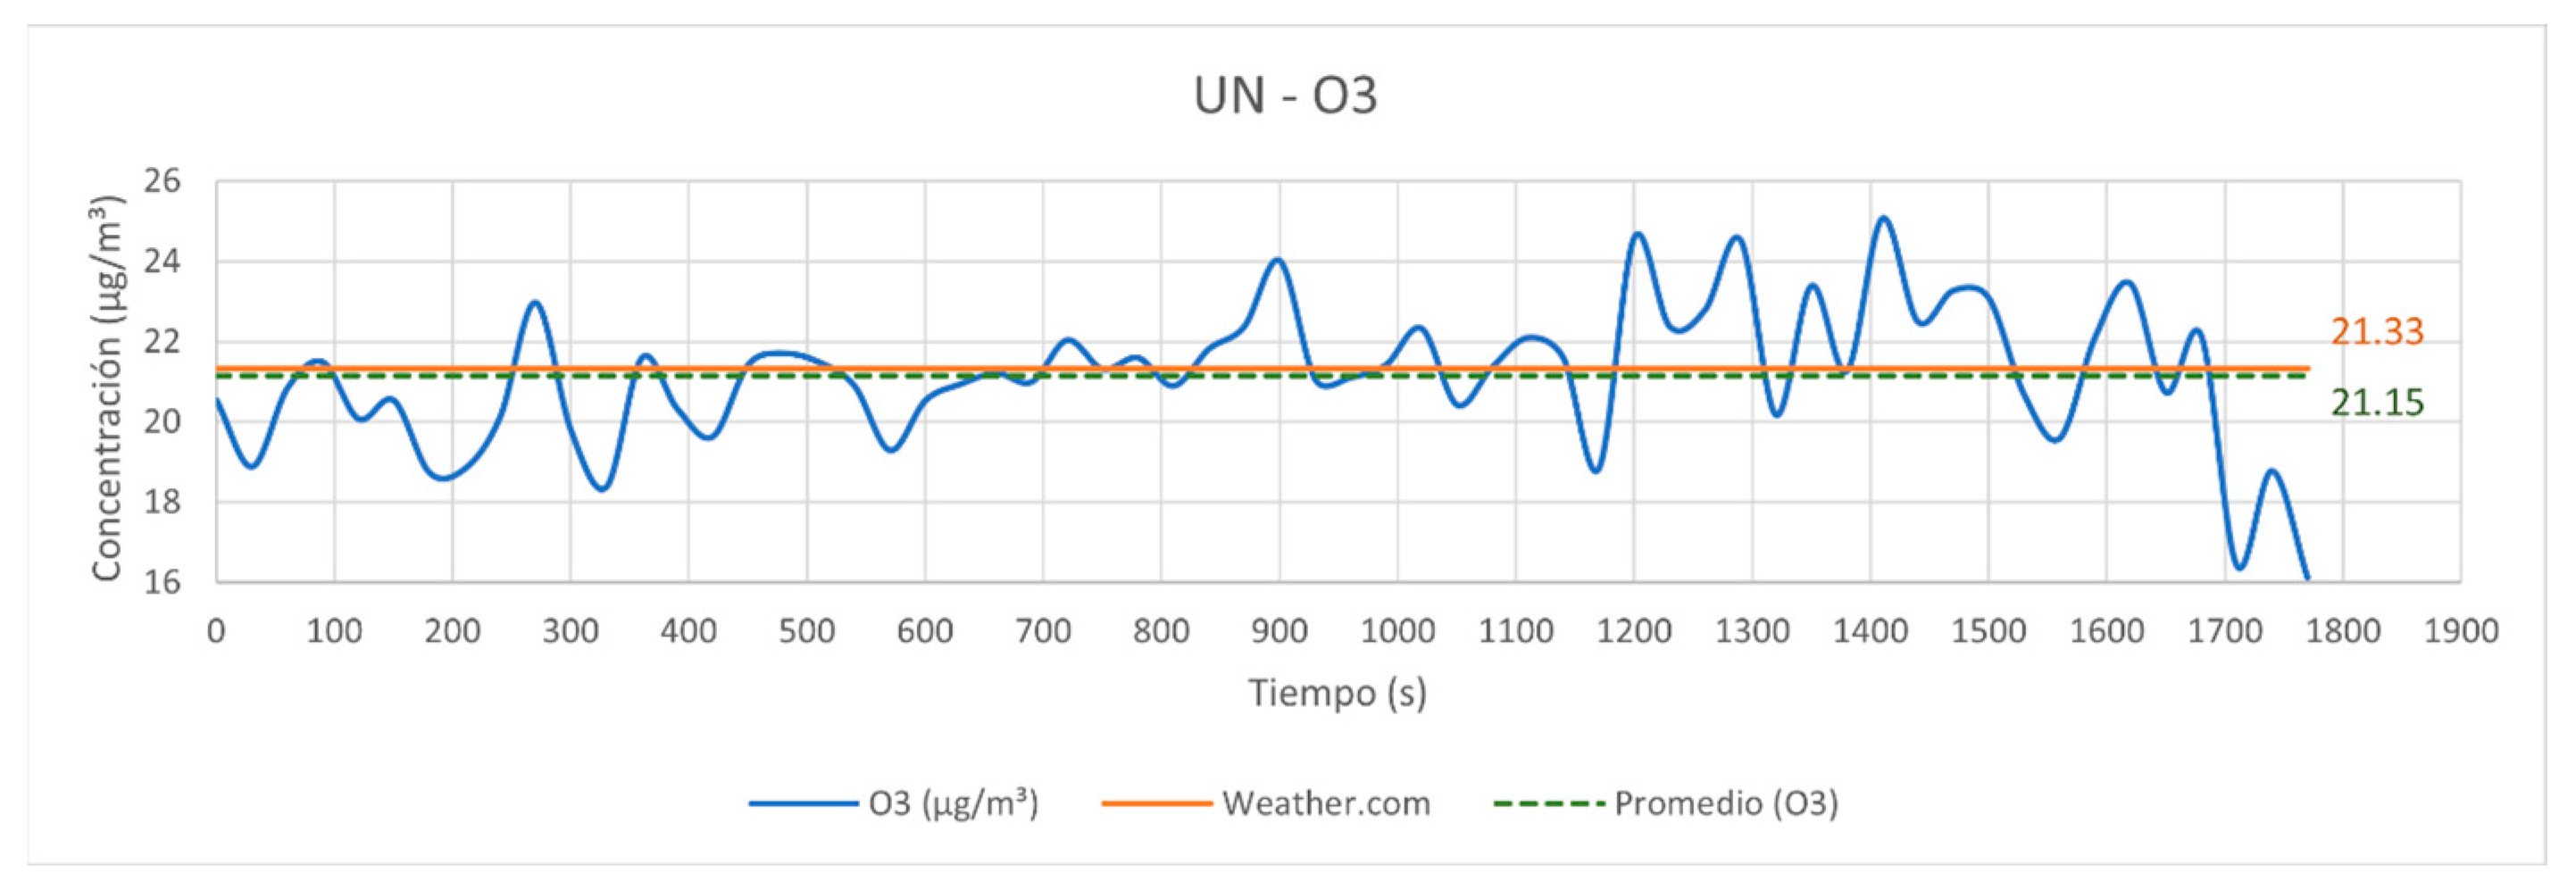
| O3 | 21.15 | 21.33 | 0.844 |
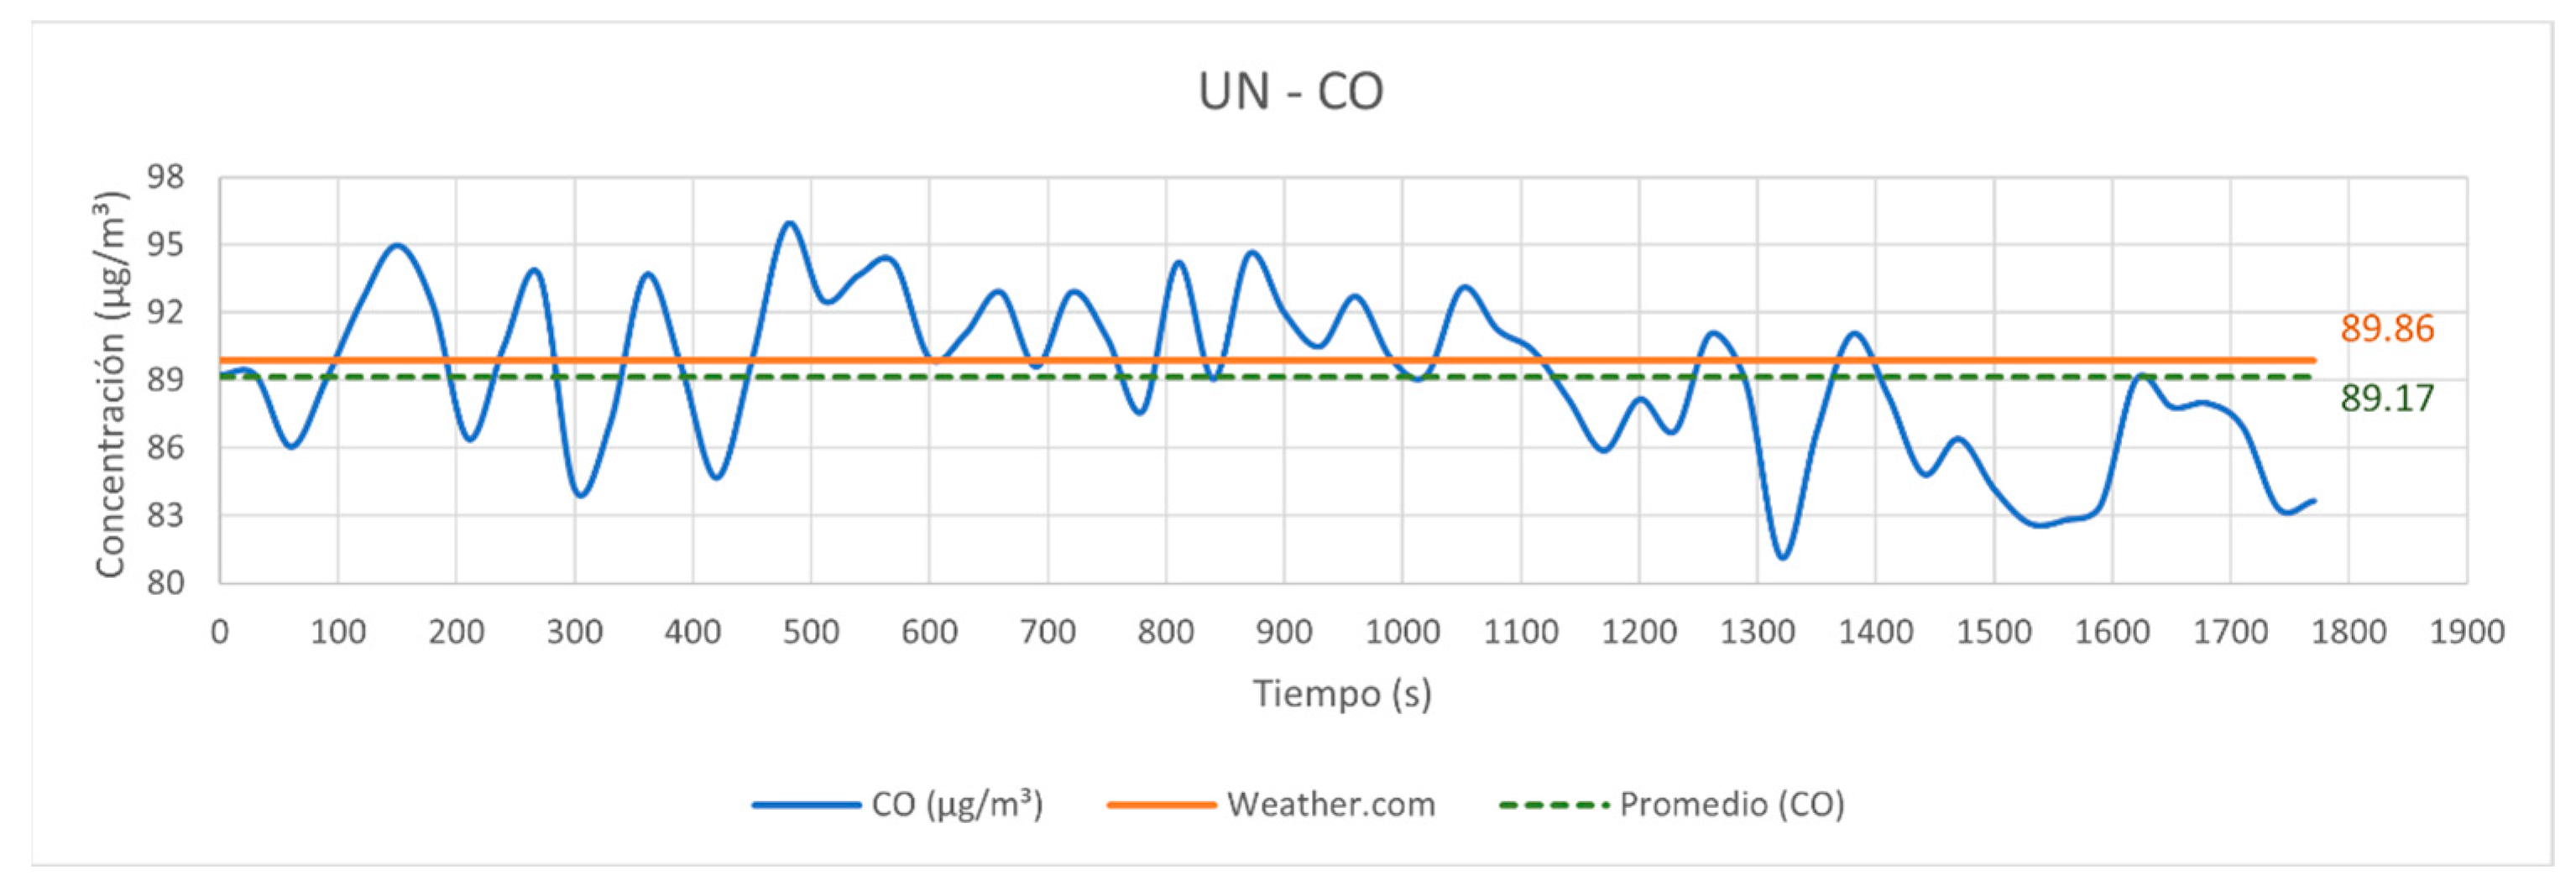
| CO | 89.17 | 89.86 | 0.768 |
| PM2.5 | 13.96 | 13.75 | 1.527 |
| PM10 | 26.53 | 26.9 | 1.375 |
| Variables | Average Readings (μg/m3) | Reference Readings (μg/m3) | Rate of Error (%) |
|---|---|---|---|
| Temperature | 27.79 | 28 | 0.750 |
| Humidity | 74.54 | 75 | 0.613 |
| NO2 | 3.61 | 3.65 | 1.096 |
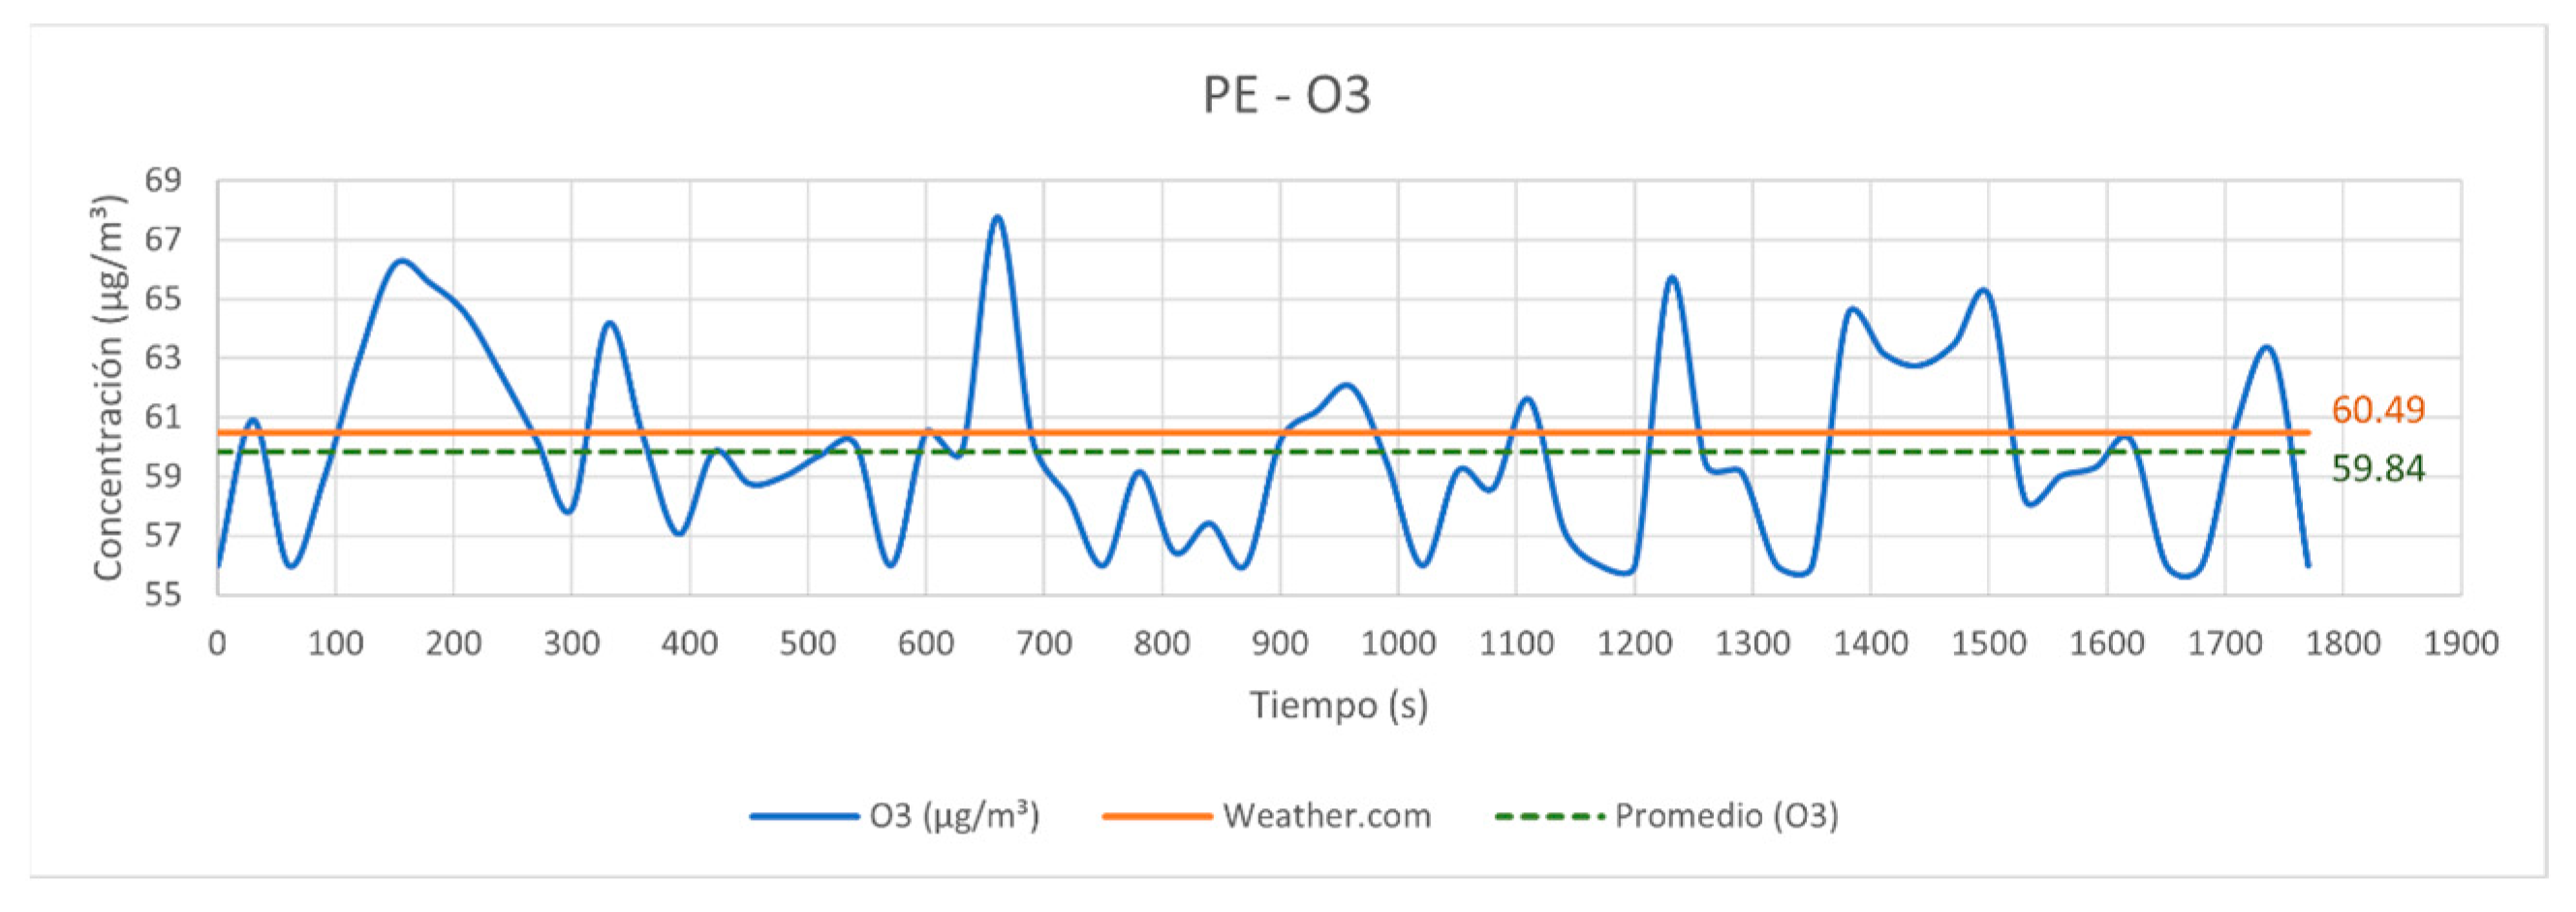
| O3 | 59.84 | 60.49 | 1.075 |
| CO | 125.27 | 124.6 | 0.538 |
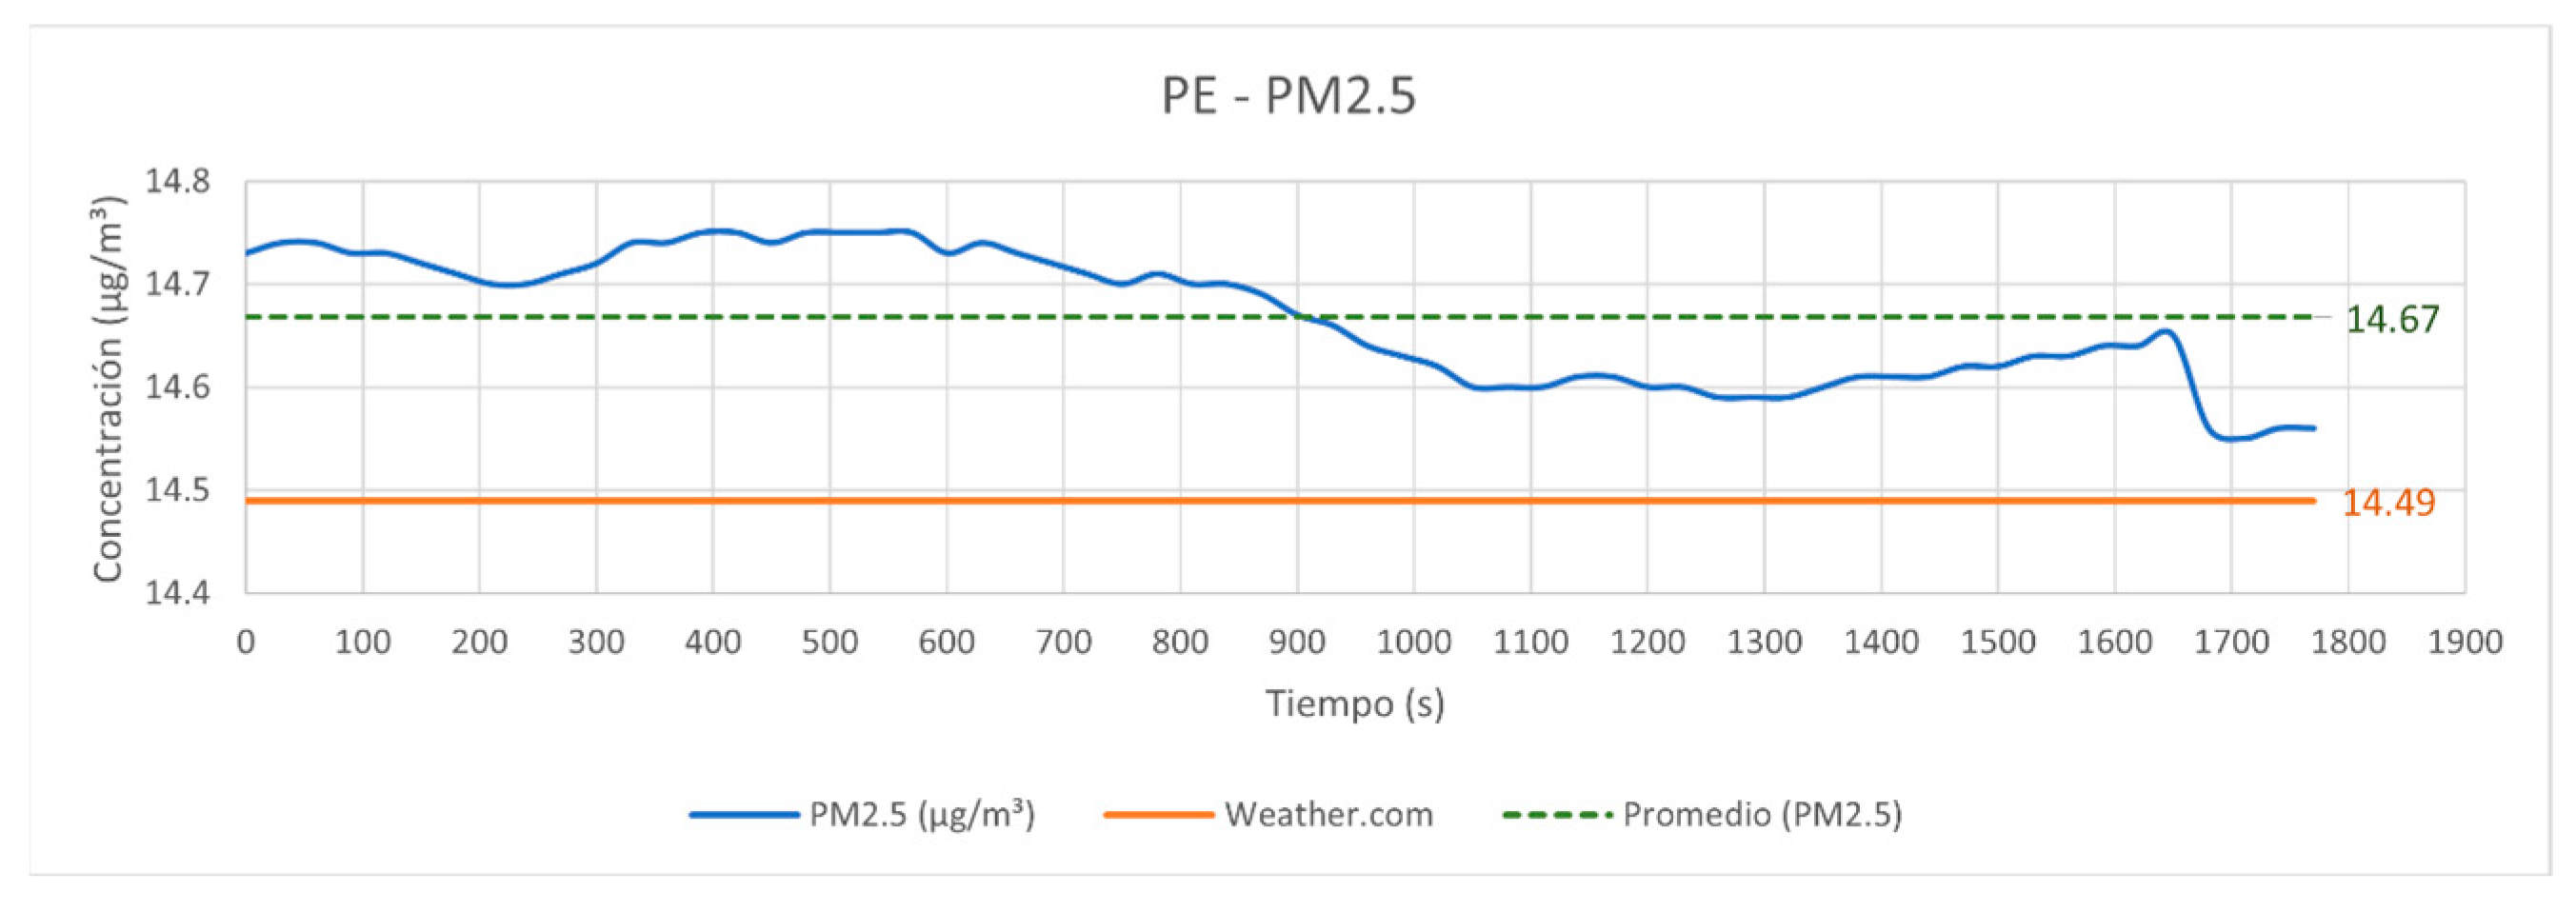
| PM2.5 | 14.67 | 14.49 | 1.242 |
| PM10 | 28.08 | 27.82 | 0.935 |
Disclaimer/Publisher’s Note: The statements, opinions and data contained in all publications are solely those of the individual author(s) and contributor(s) and not of MDPI and/or the editor(s). MDPI and/or the editor(s) disclaim responsibility for any injury to people or property resulting from any ideas, methods, instructions or products referred to in the content. |
© 2025 by the authors. Licensee MDPI, Basel, Switzerland. This article is an open access article distributed under the terms and conditions of the Creative Commons Attribution (CC BY) license (https://creativecommons.org/licenses/by/4.0/).
Share and Cite
Caselles Nuñez, J.G.; Contreras Negrette, O.A.; de Jesús Beleño Sáenz, K.; Díaz Sáenz, C.G. Design and Implementation of an Indoor and Outdoor Air Quality Measurement Device for the Detection and Monitoring of Gases with Hazardous Health Effects. Eng. Proc. 2025, 83, 13. https://doi.org/10.3390/engproc2025083013
Caselles Nuñez JG, Contreras Negrette OA, de Jesús Beleño Sáenz K, Díaz Sáenz CG. Design and Implementation of an Indoor and Outdoor Air Quality Measurement Device for the Detection and Monitoring of Gases with Hazardous Health Effects. Engineering Proceedings. 2025; 83(1):13. https://doi.org/10.3390/engproc2025083013
Chicago/Turabian StyleCaselles Nuñez, Johnathan Gabriel, Oscar Alejandro Contreras Negrette, Kelvin de Jesús Beleño Sáenz, and Carlos Gabriel Díaz Sáenz. 2025. "Design and Implementation of an Indoor and Outdoor Air Quality Measurement Device for the Detection and Monitoring of Gases with Hazardous Health Effects" Engineering Proceedings 83, no. 1: 13. https://doi.org/10.3390/engproc2025083013
APA StyleCaselles Nuñez, J. G., Contreras Negrette, O. A., de Jesús Beleño Sáenz, K., & Díaz Sáenz, C. G. (2025). Design and Implementation of an Indoor and Outdoor Air Quality Measurement Device for the Detection and Monitoring of Gases with Hazardous Health Effects. Engineering Proceedings, 83(1), 13. https://doi.org/10.3390/engproc2025083013