Abstract
Gait disorders are significant indicators of neurological diseases, such as Parkinson’s disease, and reduce the quality of life of patients. Soft body exoskeletons offer a therapeutic solution to address these disorders. Although the detection and classification of gait disorders is essential for treatment and diagnosis, a single standardized gait analysis system for exoskeleton control remains absent. This study presents the design of a real-time gait analysis system using wearable sensors. This system generates real-time feedback data by evaluating kinematic, kinetic and physiological parameters of gait. The digitized data can be used for ML integration and exoskeleton control.
1. Introduction
Gait disorders are significant indicators of neurological diseases such as Parkinson’s disease and reduce the quality of life of patients [1]. Although the detection and classification of gait disorders is essential for treatment and diagnosis, there is currently no single standardized gait analysis system [2,3]. Wearable sensors offer a promising solution, providing accessible gait analysis by capturing periodic movements during walking. These sensors enable continuous monitoring, allowing for a better understanding of gait dynamics over time [4]. In addition to analysis, real-time sensory feedback controlled soft body robotic exoskeletons improve walking by applying controlled robotic forces to correct abnormal gait patterns for optimal therapeutic effects [5]. Effective usage of these technologies can improve rehabilitation process for patients and help in their daily life [6].
The development of real-time gait analysis systems is critical to advance our understanding of gait mechanics. In this way, we can provide timely interventions for patients that use soft body exoskeletons [7,8]. This study presents the design of a real-time gait analysis system using different types of wearable sensors. This analysis system can be used to both diagnose and control soft body exoskeletons in Parkinson’s patients. Wearable sensors consist of physiological, kinetic and kinematic sensors positioned on the primary muscle groups involved in gait. This strategic placement ensures comprehensive data collection related to muscle activity and movement patterns [9,10]. Also, measuring ground reaction forces, the system can provide insights into weight distribution and balance during walking. All sensor data are acquired and wirelessly transmitted to the server for signal processing by a central microcontroller.
This real-time analysis system supports the development of adaptive control algorithms for the exoskeletons, enhancing their responsiveness to the user’s needs. The integration of ML techniques could potentially allow the system to learn from user data and optimize therapy plans over time [10].
1.1. Physiological Metrics
Surface electromyography (sEMG) is a biomedical method used to measure muscle activity. In this system, low-amplitude signals are obtained from muscle activity measured with electrodes placed on the skin surface [11]. In our system, electrodes were placed on the motor endings of the Gastrocnemius and Soleus muscles associated with walking. The signals obtained here are amplified and filtered by the signal conditioning circuit. The obtained data are digitized and then transferred to our server and processed to extract the physiological parameters required for gait analysis [12].
Typical surface EMG signals are in the range of ±10 mV, with frequency content generally ranging from 6 Hz to 600 Hz, with a dominant frequency range of 20 Hz to 150 Hz. These signals contain noise such as ambient noise from electromagnetic devices and transducer noise due to impedance change caused by motion induced impedance change in electrode–skin contact. With the electronic circuit we have built, the EMG signals become a representation of the physiological activity of the muscles after noise reduction [13]. EMG data extracted and digitized in this way can be used for exoskeleton control [14].
1.2. Kinetic Metrics
An important type of mechanical data to be obtained in gait analysis is vertical ground reaction force (vGRF). This force between the sole of the foot and the ground is sensed by force-based resistance (FSR) embedded in the sole [15]. The GRF can be used to understand the characteristics of normal and pathological gait, enabling the detection of pathological gait. In this way, exoskeletons can offer adaptive gait compensation to the patient in a personalized manner [16].
1.3. Kinematic Metrics
Among the parameters required for gait analysis are kinematic data consisting of angle changes in the joints. Acceleration and angular rate change measurements can be made in three-dimensional space by means of inertial sensors placed on the limb. These inertial data from the sensors can be fused with a Kalman or complementary filter to reveal the orientation of the limbs and the joint angles accordingly. In addition, turning these orientation data into a three-dimensional modeling structure is also included in the feedback systems used for exoskeletons [17,18]. The IoT inertial measurement unit (IMU) sensors placed in our system can extract real-time orientation data using a complementary filter and perform 3D structural modeling via MATLAB (version R2024b). In this way, a digital representation of the gait is created [19].
2. Materials and Methods
In this study, physiological, kinematic and kinetic data were collected in real time from the user’s leg. Different types of sensors were placed appropriately on muscle groups and the foot. Physiological and kinematic sensor data were collected via a wireless device attached to the user’s leg with a belt and processed by a central microcontroller. Kinetic data were collected by load cells placed on the sole of the shoe. The data were transferred in real time to a server and then converted into a database format suitable for machine learning.
An EMG signal acquisition circuit was used to process physiological data, a ground reaction force acquisition circuit was used to collect kinetic data and inertial measurement (IMU) sensors were used to collect kinematic data. The components and devices designed for this purpose are shown in Figure 1.
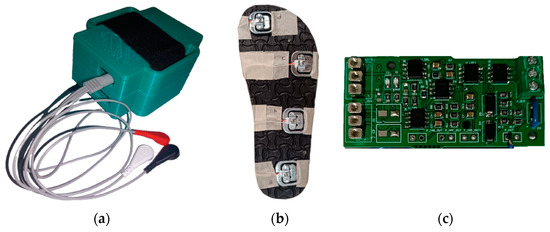
Figure 1.
Photographs of the basic devices we produced within the scope of this project. (a) The main device connected to the foot; the EMG cables coming out of it are visible. (b) Measuring slippers with force-sensitive resistors placed underneath, which we use for ground reaction force measurement. (c) Printed circuit board (PCB) that we produced.
2.1. EMG Signal Acquisition
We designed and produced low-cost EMG signal acquisition hardware in accordance with our requirements and integrated it into our wearable device. This system, which will be used to obtain physiological data, has a signal conditioning circuit, a power distribution circuit, and an analog-to-digital converter, and it will be examined in three parts. The summary diagram of the system is shown in Figure 2 [20].
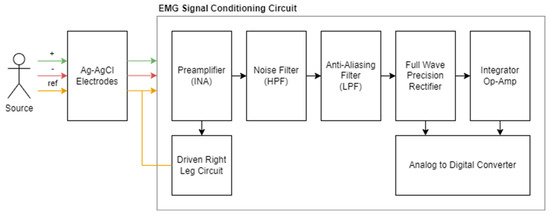
Figure 2.
Summary diagram for EMG signal conditioning circuit and components.
2.1.1. Preamplifier
Low-amplitude EMG signals from electrodes in the antagonist muscle regions are affected by noise sources and must be de-noised and amplified to accurately represent muscle activity. Here, the common mode voltage is amplified using instrumental amplifiers to suppress and amplify the noise. Compared to conventional op-amp amplifiers, instrumentational amplifiers have a much higher CMRR (common mode rejection ratio), making them very suitable for use as pre-amplifiers in EMG sensors.
An ideal preamplifier has a high CMRR and a very high input impedance. It is positioned close to the signal source and can strongly suppress DC signals. INA128 (Texas Instruments, Dallas, TX, USA) was chosen as the instrumentation amplifier in our system. The INA128 is a widely preferred instrumentational amplifier for biomedical signals, characterized by its low cost and high data accuracy. The device is available in an 8-pin SOIC package and is designed to adapt to various application scenarios. It can increase the adjustable gain up to G = 10,000 with an RG resistor [21].
The INA128 has important technical features, such as low offset voltage (VOS = 50 μV), low drift (Vdrift 0.5 μV/°C), an input bias current within acceptable limits (IB = 5 nA), and a low noise level (8 nV/√Hz, 0.2 μVpp). In addition, its high CMRR value (120 dB) is higher than the system requirement of 100 dB due to its intended use in our system. It can also be used in our system with its bandwidth frequency (1.3 MHz). The inputs are protected up to ±40 V and have a wide supply range (±2.25 V to ±18 V). In our system, it will be supplied with ±7.4 V. Its low quiescent current (Iq: 700 μA) makes it suitable for wearable applications. The manufacturer has also indicated that the INA128 can be used in medical instrumentation. As a result of the comparisons, it was decided to use the INA128 integration in our system as a cost-effective solution [22].
The maximum amplifier noise that can be seen in the preamplifier according to the manufacturer’s specifications is calculated as 74 µV in Equation (1):
To achieve this gain value, the gain resistors (RG) shown in the schematic are set. The RG that should be used according to the desired gain value for the INA128 instrumental amplifier are calculated with the formula determined by the manufacturer [23].
Two commonly used 1.3 kΩ resistors with a precision of 5% were chosen as RG gain resistors (RG,TOTAL = 2.6 kΩ 5%). This gives a gain of 20.2 ± 1 (26.1 dB ± 0.5 dB). There is also a DRL circuit connected to the preamplifier circuit. This circuit is used to suppress noise caused by electromagnetic interference and is connected to the preamplifier through RG resistors. Owing to the DRL, the CMRR is improved by active feedback.
U1, R1 and R2 in the schematic in Figure 3 belong to this DRL circuit. The amplifier (U2) and the resistors RG (RG1, RG2) on the right side of the figure belong to the instrumental amplifier. The DRL system can be simplified as in Figure 4.
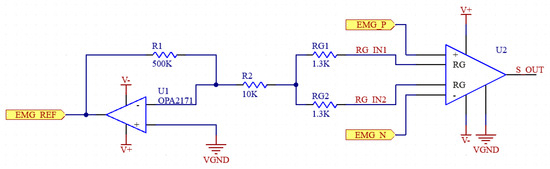
Figure 3.
Schematic of preamplifier and DRL circuits.
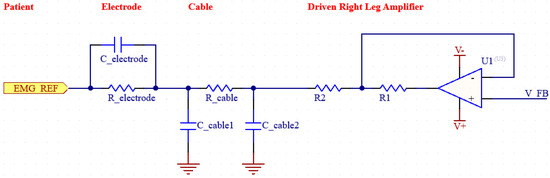
Figure 4.
Simplified diagram of DRL.
2.1.2. Driven Right Leg (DRL) Circuit
Increasing the CMRR and suppressing noise is an extremely important goal for biosignal measurement systems such as EMG. To achieve a higher CMRR, it is also necessary to suppress EMI noise. EMI noise is usually caused by the capacitive coupling of electromagnetic waves generated by electrical devices in the environment to the patient’s body. Effective suppression of such noise is essential for the design of an efficient EMG system [22]. By using a DRL (Driven Right Leg) circuit in our system, we increased the CMRR value by reducing EMI-induced noise. The DRL circuit has a feedback system and detects the common mode signals from the patient and actively suppresses the noise in the system by sending back the reverse phase signal it generates. Thus, the signal-to-noise ratio (SNR) is also improved. The circuit in the figure shows the DRL circuit along with the electrode and cable modeling [23].
DRL circuitry has safety advantages; resistors in the circuit protect the patient by limiting the current. In the worst scenario, the maximum current under a single-fault condition should be below 50 uA. In our circuit, 17.65 uA is provided as the highest current value that can be reached [13]. The DRL circuit can increase the CMRR of the system by up to 18dB at frequencies where EMI noise is dominant, such as 50/60 Hz [24].
2.1.3. Motion Artifact Filter
Movement artifacts caused by electrode–skin interactions are usually observed below 20 Hz [25]. Since the examination of EMG signals from muscles between 24 and 400 Hz is sufficient for the acquisition of many medical signals, we filter these very low-frequency signals in our system. Therefore, in our system, we aimed to perform analog filtering below 24 Hz, where EMG signals occur at low power and the dominant signal is motion artifacts [26]. We perform this filtering process by using two second-order unity-gain sallan-key filters in our analog circuit. The parameters used for the circuit with Bessel characteristics are given in Table 1 [27]. The frequency domain simulation results of the motion artifact filter are shown in Figure 5, and the schematic is provided in Figure 6.

Table 1.
Noise filter design parameters.
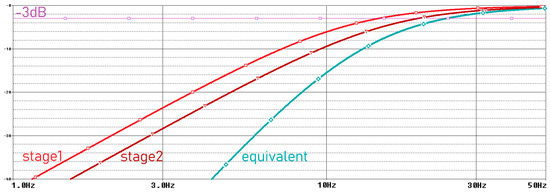
Figure 5.
Frequency domain simulation results of motion artifact filter.
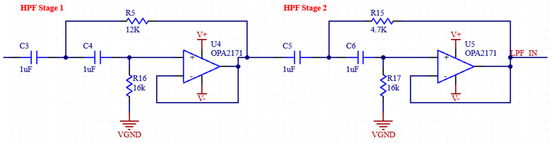
Figure 6.
Schematic of motion artifact filter.
2.1.4. Anti-Aliasing Filter
In biopotential measurement applications, the ADC (Analog-to-Digital Converter) modules are used to digitize the signal. The ADC modules sample analog signals at specific frequencies. However, high-frequency signal components cannot be sampled when they cannot reach a sufficient sampling frequency according to Nyquist’s theorem. These unsampled signals, even if they are real physiological values to be measured, overlap during A/D conversion and cause a distortion called aliasing noise [28].
To suppress aliasing noise, the signal must be filtered with an AAF (anti-aliasing filter) before going to the ADC. The AFF consists of a low pass filter and an op-amp used as a buffer at the output of this filter. The op-amp output is connected to a passive low pass filter ADC input [29,30]. The frequency domain simulation results of the anti-aliasing filter are shown in Figure 7, and the schematic of the filter is shown in Figure 8.
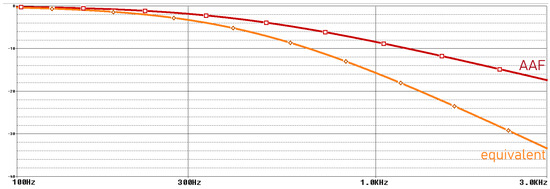
Figure 7.
Frequency domain simulation results of anti-aliasing filter.
The ADC we use has a 16-bit resolution and a sampling frequency of 860 Hz. In this case, the Nyquist frequency is 430 Hz. Therefore, an RC filter with a corner frequency of 430 Hz is added to the buffer output of the ADC. Before the buffer, an RC filter with a corner frequency of 400 Hz was used, which is the upper limit of the measured EMG signals. In addition, 1 uF capacitors will be used for the filters. The required resistance values are also calculated in Equation (3).
2.1.5. Full-Wave Precision Rectifier
A full-wave precision rectifier with a ratio of 1:1 is used to ensure that the negative components are rectified. The schematic of the circuit in our system is shown in Figure 9 [31,32].

Figure 8.
Schematic of anti-aliasing filter.
Figure 8.
Schematic of anti-aliasing filter.


Figure 9.
Schematic of full-wave precision rectifier.
Figure 9.
Schematic of full-wave precision rectifier.

2.1.6. Moving Window Integration
In order to make rectified EMG signals smoother and easier to analyze, we integrate the signal by adding a moving window integration circuit to our analog circuit [33]. Since the EMG signals that we are processing contain bursts of muscle activity that occur over relatively short periods (2 to 50 ms), a 100 ms window is used because it captures enough information about muscle activation without losing temporal resolution. A shorter window might not capture enough muscle activity, leading to a more jittery or noisy integrated signal. A longer window would smooth the signal too much and reduce the ability to detect rapid muscle contractions [34]. The ratios of the passive integrated parameters required to achieve a given integration time in the circuit were found as in Equation (3). A 10 kΩ RIN resistor was added for current limiting [33,34].
2.2. Ground Reaction Force Acquisition
In our system, we used half-bridge load cells capable of measuring up to 500 N as force-sensitive resistors (FSRs). Four load cell transducers, each measuring 34 × 34 × 2.5 mm, were utilized. These load cells have a sensitivity of 2 mV/V and are powered by an excitation voltage (VE) of ±9 V, resulting in a signal output of 19 mV under maximum load. To ensure an accurate digitization of the signal, it must be amplified and subjected to several signal-processing stages. The summary diagram of the system is shown in Figure 10 [35].
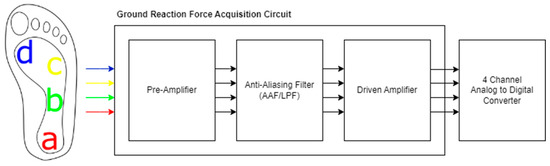
Figure 10.
Summary diagram for GRF acquisition circuit. The sensors placed on medial heel (a), lateral midfoot (b), fourth metatarsal head (c), and first metatarsal head (d).
Half-bridge load cells were placed at four points on the insole. Transducer A was in the rearfoot, at the medial heel; transducer B in the lateral midfoot; transducer C under the 4th metatarsal head; and transducer D between the 1st metatarsal head and the big toe. The placements are approximately shown in the system diagram. These vGRF measurements from four distinct points allow for the calculation of values such as contact area, contact characteristics, and step angle [36].
A power-dependent full-bridge circuit is constructed using half-bridge load cells and precision 1 kΩ ± 1% resistors on the circuit board. This circuit is used to generate the differential signal. To obtain the vGRF, preamplification is performed first. Here, the initial gain is set to 50 (+20 dB). The maximum differential signal amplitude, which was previously 19 mV, is increased to 800 mV using an instrumentational amplifier, while common mode noise is suppressed. The preamplification circuit and the subsequent anti-aliasing filter are similarly used in the EMG. A secondaryamplifier with 5.7 gains is then used to prepare the signal for digitalization. Schematics of our system are shown in Figure 11.
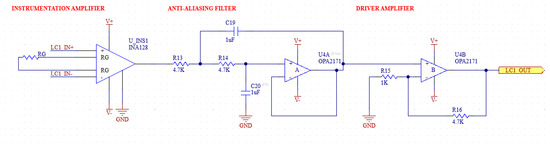
Figure 11.
Schematic of GRF acquisition circuit.
2.3. Inertial Measurement
For the kinetic data we aim to obtain in addition to physiological and mechanical data, IMU (inertial measurement unit) sensors were placed on three regions of the leg: femoral, crural, and pedal. These sensors collect real-time accelerometer and gyroscope data. We selected the MPU6050 IMU module (Invensense, San Jose, CA, USA) [37]. The data are fused using a complementary filter and converted into roll and pitch values. Subsequently, the data from the three sensors are analyzed using basic mathematical equations to calculate joint angles between the limbs. These data are then used for 3D structural construction in MATLAB. Equations (5) and (6) were used for the roll and pitch calculations [38,39]:
For the orientations of each segment, Equation (7) was applied:
The angles between the segments were calculated using Equation (8).
With accelerometer and gyroscope data from the three sensors, we can determine the roll and pitch values of each limb, their intersection points, intersection angles, and approximate positions in space [40].
2.4. Analog-to-Digital Module
An analog-to-digital converter (ADC) was required to digitize the analog data from the sEMG and vGRF sensors in the system. The AD1115, a low-cost and reliable ADC, was selected for this purpose. This 4-channel ADC offers 16-bit resolution and can sample at 860 SPS (samples per second). Additionally, its built-in programmable gain amplifier (PGA) allows for a dynamic adjustment of the system’s gain. Tests were conducted for the AD1115 in various environments and configurations, evaluating its PGA, SPS, and firmware filter settings [41]. The record for the highest noise levels observed during experiments conducted at different configurations are provided in Table 2 and Table 3. Test results showed that adding the firmware filter or removing the PGA had no significant positive impact on noise levels, and, thus, these features were not implemented in the system.
Table 2.
Comparison of different sample rates.
Table 3.
Comparison of different firmware configurations.
3. Results
3.1. Physiological Measurements
The experimental setup was designed to observe voluntary muscle contractions. Additionally, the detection of tetanic muscle contractions was successfully achieved as demonstrated in Figure 12.
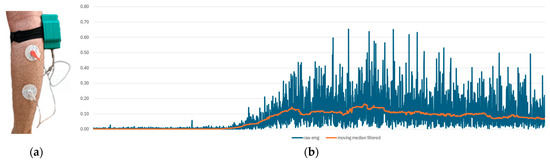
Figure 12.
The EMG measurement setup. (a) The experimental interface of our system, and (b) EMG measurement results. The blue line represents raw data, while the orange line indicates moving median filtered data.
In Figure 13, the data from the IMU and EMG sensors are synchronized with the same timestamp. The results indicate that the raw EMG results provide a favorable outcome for observing phasic muscle contraction activities occurring within one second. Upon examining all these results, it is demonstrated that we have a circuit capable of capturing physiological muscle signals in the range of 24–400 Hz at a sampling rate of 860 SPS. The total resolution is 45 nV, with the calculated lowest real sensitivity being 1.5 μV with a 5-bit uncertainty. The baseline noise is below 15 µVrms. The utilized DRL and instrumentation amplifiers, when used in conjunction, offer a CMRR greater than 110 dB as per their design. Measurements for the SNR could not be conducted.
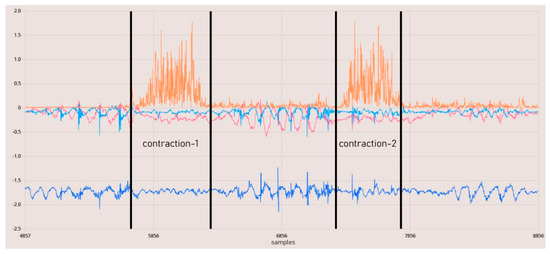
Figure 13.
EMG contraction test results. The orange line represents rectified raw EMG data.
3.2. Ground Reaction Force Measurements
As shown in Figure 14, the ground reaction force (GRF) was calculated from the data obtained from the sensors, and the center of pressure (CoP) was determined. These data were processed using algorithms in MATLAB and converted into data tables that can be used for detecting anomalies or characterizing movements. A separate data table was generated for each step, allowing for the digitization of each step’s characteristics, reduced to 48 variables. An example variable table is displayed in Figure 15.
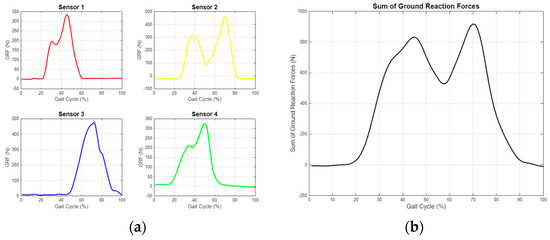
Figure 14.
Ground reaction force measurement graphs for single step. (a) Separate evaluation of data from four different sensors. (b) Resultant GRF obtained by combining sensor data.
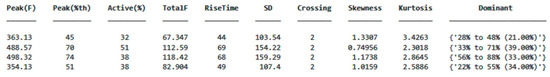
Figure 15.
An example data table obtained by calculating the selected parameters displays each row as representing a single step from a different sensor.
3.3. Inertial Measurements
Kinematic data were collected through the inertial sensors and combined in real time using a complementary filter. The 3D structural modeling created in MATLAB visually matches the actual test data, as shown in Figure 16. The measurement sensitivity of the gyroscope data obtained from the IMU is specified as ±250°/s with a sensitivity of 131 LSB/°/s. The sensitivity for acceleration measurements is set at ±2 g with a value of 16,384 LSB/g. This sensitivity will enable a more comprehensive analysis by aligning the values with physiological data [42].
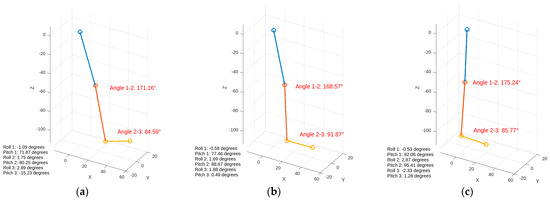
Figure 16.
Visualization of inertial data during walking. The figures display the angles between joints and orientation information. (a) Heel strike, (b) foot flat, (c) midstance.
4. Discussion
This study presents a comprehensive gait analysis system using wearable sensors to capture real-time data for soft body exoskeleton control in patients with gait disorders. By strategically positioning sensors on key muscle groups and integrating signal processing techniques, we obtain diverse data related to gait. Physiological measurements from EMG sensors effectively captured muscle activity with low noise. GRF measurements provided insights into foot pressure distribution, enabling kinetic analysis of gait characteristics. Inertial measurements, combined with complementary filtering, generated 3D models of limb movement, matching real-world test data and providing joint kinematics data. These results confirm the system’s ability to provide real-time feedback for soft body exoskeletons. Furthermore, a ML integration will allow for personalized therapy and continuous adaptation, which could improve therapeutic outcomes and overall quality of life for patients.
Funding
This research received no external funding.
Institutional Review Board Statement
Not applicable.
Informed Consent Statement
Not applicable.
Data Availability Statement
Data sharing is not applicable.
Conflicts of Interest
The author declares no conflicts of interest.
References
- Brozova, H.; Stochl, J.; Roth, J.; Ruzicka, E. Fear of Falling Has Greater Influence than Other Aspects of Gait Disorders on Quality of Life in Patients with Parkinson’s Disease. Neuro Endocrinol. Lett. 2009, 30, 453–457. [Google Scholar]
- Caldas, R.; Mundt, M.; Potthast, W.; Buarque de Lima Neto, F.; Markert, B. A Systematic Review of Gait Analysis Methods Based on Inertial Sensors and Adaptive Algorithms. Gait Posture 2017, 57, 204–210. [Google Scholar] [CrossRef]
- Le, A.M.; Neuschatz, J.S.; Golding, J.M.; Jenkins, B.D.; Cutler, B.L. A Step Too Far: The Problems with Forensic Gait Analysis. In Advances in Psychology and Law; Springer: Berlin/Heidelberg, Germany, 2022; pp. 89–109. [Google Scholar] [CrossRef]
- Balakrishnan, A.; Medikonda, J.; Namboothiri, P.K.; Natarajan, M. Role of Wearable Sensors with Machine Learning Approaches in Gait Analysis for Parkinson’s Disease Assessment: A Review. Eng. Sci. 2022, 19, 5–19. [Google Scholar] [CrossRef]
- Marinou, G.; Kourouma, I.; Mombaur, K. Development and Validation of a Modular Sensor-Based System for Gait Analysis and Control in Lower-Limb Exoskeletons. arXiv 2024, arXiv:2409.01174. [Google Scholar]
- Pinheiro, C.; Figueiredo, J.; Magalhães, N.; Santos, C.P. Wearable Biofeedback Improves Human-Robot Compliance during Ankle-Foot Exoskeleton-Assisted Gait Training: A Pre-Post Controlled Study in Healthy Participants. Sensors 2020, 20, 5876. [Google Scholar] [CrossRef] [PubMed]
- Bijalwan, V.; Semwal, V.B.; Mandal, T.K. Fusion of Multi-Sensor Based Biomechanical Gait Analysis Using Vision and Wearable Sensor. IEEE Sens. J. 2021, 21, 14213–14220. [Google Scholar] [CrossRef]
- Haque, M.R.; Imtiaz, M.H.; Kwak, S.T.; Sazonov, E.; Chang, Y.-H.; Shen, X. A Lightweight Exoskeleton-Based Portable Gait Data Collection System. Sensors 2021, 21, 781. [Google Scholar] [CrossRef]
- Sarajchi, M.; Sirlantzis, K. Pediatric Robotic Lower-Limb Exoskeleton: An Innovative Design and Kinematic Analysis. IEEE access 2023, 11, 115219–115230. [Google Scholar] [CrossRef]
- Guerra, B.M.V.; Schmid, M.; Sozzi, S.; Pizzocaro, S.; De Nunzio, A.M.; Ramat, S. A Recurrent Deep Network for Gait Phase Identification from EMG Signals during Exoskeleton-Assisted Walking. Sensors 2024, 24, 6666. [Google Scholar] [CrossRef]
- Chowdhury, R.; Reaz, M.; Ali, M.; Bakar, A.; Chellappan, K.; Chang, T. Surface Electromyography Signal Processing and Classification Techniques. Sensors 2013, 13, 12431–12466. [Google Scholar] [CrossRef] [PubMed]
- Kaur, M.; Mathur, S.; Bhatia, D.; Verma, S. EMG Analysis for Identifying Walking Patterns in Healthy Males. In Proceedings of the 2015 11th Conference on Ph.D. Research in Microelectronics and Electronics (PRIME), Glasgow, UK, 29 June–2 July 2015. [Google Scholar] [CrossRef]
- Salman, A.; Iqbal, J.; Izhar, U.; Khan, U.S.; Rashid, N. Optimized Circuit for EMG Signal Processing. In Proceedings of the 2012 International Conference of Robotics and Artificial Intelligence, Rawalpindi, Pakistan, 22–23 October 2012. [Google Scholar] [CrossRef]
- Fleischer, C.; Wege, A.; Kondak, K.; Hommel, G. Application of EMG Signals for Controlling Exoskeleton Robots. Biomed. Technik. Biomed. Eng. 2006, 51, 314–319. [Google Scholar] [CrossRef] [PubMed]
- Tahir, A.M.; Chowdhury, M.E.H.; Khandakar, A.; Al-Hamouz, S.; Abdalla, M.; Awadallah, S.; Reaz, M.B.I.; Al-Emadi, N. A Systematic Approach to the Design and Characterization of a Smart Insole for Detecting Vertical Ground Reaction Force (VGRF) in Gait Analysis. Sensors 2020, 20, 957. [Google Scholar] [CrossRef] [PubMed]
- Kloeckner, J.; Visscher, R.M.S.; Taylor, W.R.; Viehweger, E.; De Pieri, E. Prediction of Ground Reaction Forces and Moments during Walking in Children with Cerebral Palsy. Front. Hum. Neurosci. 2023, 17, 1127613. [Google Scholar] [CrossRef] [PubMed]
- Seel, T.; Raisch, J.; Schauer, T. IMU-Based Joint Angle Measurement for Gait Analysis. Sensors 2014, 14, 6891–6909. [Google Scholar] [CrossRef]
- Htun, Z.M.M.; Latt, M.M.; New, C.M.; Mon, S.S.Y. Performance Comparison of Experimental-Based Kalman Filter and Complementary Filter for IMU Sensor Fusion by Applying Quadrature Encoder. Int. J. Sci. Res. Publ. (IJSRP) 2018, 8, 11. [Google Scholar] [CrossRef]
- Sardjono, T.A.; Kusuma, H.; Tasripan; Sugiarto, K. Comparative SNR Analysis between Instrument ADAS1000 and AD620. J. Sistim Inf. Teknol. 2022, 4, 129–133. [Google Scholar] [CrossRef]
- Ganesan, Y.; Gobee, S.; Durairajah, V. Development of an Upper Limb Exoskeleton for Rehabilitation with Feedback from EMG and IMU Sensor. Procedia Comput. Sci. 2015, 76, 53–59. [Google Scholar] [CrossRef]
- Gohel, V.; Mehendale, N. Review on Electromyography Signal Acquisition and Processing. Biophys. Rev. 2020, 12, 1361–1367. [Google Scholar] [CrossRef] [PubMed]
- Guo, C.; Wang, S.; Chai, Y.; Guo, Z. Design of Variable Gain Amplifier Circuit Based on Newton Rings Stress. In Proceedings of the International Conference on Chemical, Material and Food Engineering, Advances in Engineering Research/Advances in Engineering Research, Kunming, China, 25–26 July 2015. [Google Scholar] [CrossRef]
- Reaz, M.B.I.; Hussain, M.S.; Mohd-Yasin, F. Techniques of EMG Signal Analysis: Detection, Processing, Classification and Applications. Biol. Proced. Online 2006, 8, 11–35. [Google Scholar] [CrossRef]
- Levin, M. Safe Current Limits for Electromedical Equipment and Hazards to Patients. Circulation 1994, 90, 2160–2162. [Google Scholar] [CrossRef]
- Guerrero, F.N.; Spinelli, E. High Gain Driven Right Leg Circuit for Dry Electrode Systems. Med. Eng. Phys. 2017, 39, 117–122. [Google Scholar] [CrossRef]
- Boyer, M.; Bouyer, L.; Roy, J.-S.; Campeau-Lecours, A. Reducing Noise, Artifacts and Interference in Single-Channel EMG Signals: A Review. Sensors 2023, 23, 2927. [Google Scholar] [CrossRef] [PubMed]
- Komi, P.V.; Tesch, P. EMG Frequency Spectrum, Muscle Structure, and Fatigue during Dynamic Contractions in Man. Eur. J. Appl. Physiol. Occup. Physiol. 1979, 42, 41–50. [Google Scholar] [CrossRef]
- Oyebola Blessed Olalekan Sallen-Key Topology, MFB and Butterworthy in Bandpass Design for Audio Circuit Design. Asian J. Manag. Sci. 2017, 6, 23–28. [CrossRef]
- Chi, Y.M.; Deiss, S.R.; Cauwenberghs, G. Non-Contact Low Power EEG/ECG Electrode for High Density Wearable Biopotential Sensor Networks. In Proceedings of the Wearable and Implantable Body Sensor Networks, Berkeley, CA, USA, 3–5 June 2009. [Google Scholar] [CrossRef]
- Baker, B.C. Designing an Anti-Aliasing Filter for ADCs in the Frequency Domain. Ind. Analog. Appl. J. 2015, 7, AAJ 2Q. [Google Scholar]
- Pandey, V.K.; Krishnan, N.; Pandey, P.C. Tracking Based Baseline Restoration for Acquisition of Impedance Cardiogram and Other Biosignals. In Proceedings of the 2005 IEEE Engineering in Medicine and Biology 27th Annual Conference, Shanghai, China, 17–18 January 2006. [Google Scholar] [CrossRef]
- Aydoğan, İ.; Aydin, E.A. Wearable Electromyogram Design for Finger Movements Based Real-Time Human-Machine Interfaces. Politek. Derg. 2023, 26, 973–981. [Google Scholar] [CrossRef]
- Norizan, M.A.; Ali, F.; Abas, N.; Jamaluddin, H.; Nor, A.S.M. Electromyography Circuit Based on Forearm Muscle. J. Theor. Appl. Inf. Technol. 2015, 81, 331–336. [Google Scholar]
- Farfán, F.D.; Politti, J.C.; Felice, C.J. Evaluation of EMG Processing Techniques Using Information Theory. BioMed. Eng. OnLine 2010, 9, 72. [Google Scholar] [CrossRef]
- Ding, Q.; Xiong, A.; Zhao, X.; Han, J. A Novel EMG-Driven State Space Model for the Estimation of Continuous Joint Movements. In Proceedings of the 2011 IEEE International Conference on Systems, Man, and Cybernetics, Anchorage, AK, USA, 9–12 October 2011. [Google Scholar] [CrossRef]
- Muller, I.; de Brito, R.; Pereira, C.; Brusamarello, V. Load Cells in Force Sensing Analysis—Theory and a Novel Application. IEEE Instrum. Meas. Mag. 2010, 13, 15–19. [Google Scholar] [CrossRef]
- Pirani, H.; Azizi, M. Comparison of Peak Pressure, Maximum Force, Contact Area, and Contact Time between the Right and Left Foot in Elite Weightlifters. J. Kermanshah Univ. Med. Sci. 2020, 24, e96967. [Google Scholar] [CrossRef]
- Fitriani, D.A.; Andhyka, W.; Risqiwati, D. Design of Monitoring System Step Walking with MPU6050 Sensor Based Android. JOINCS J. Inform. Netw. Comput. Sci. 2017, 1, 1–8. [Google Scholar] [CrossRef]
- Higgins, W.T. A Comparison of Complementary and Kalman Filtering. IEEE Trans. Aerosp. Electron. Syst. 1975, AES-11, 321–325. [Google Scholar] [CrossRef]
- Cheng, P.L.; Nicol, A.; Paul, J.P. Determination of Axial Rotation Angles of Limb Segments—A New Method. J. Biomech. 2000, 33, 837–843. [Google Scholar] [CrossRef] [PubMed]
- dos Santos, D.A.; de Souza Soares, A.M.; Tupinambá, W.L.M. Development of a Portable Data Acquisition System for Extensometry. Exp. Tech. 2021, 46, 723–730. [Google Scholar] [CrossRef]
- Liu, C.; Alif, M.A.; He, G. Shoulder Motion Detection Algorithm Based on MPU6050 Sensor and XGBoost Model. In Proceedings of the 2022 International Conference on Computing, Communication, Perception and Quantum Technology (CCPQT), Xiamen, China, 5–7 August 2022. [Google Scholar] [CrossRef]


Disclaimer/Publisher’s Note: The statements, opinions and data contained in all publications are solely those of the individual author(s) and contributor(s) and not of MDPI and/or the editor(s). MDPI and/or the editor(s) disclaim responsibility for any injury to people or property resulting from any ideas, methods, instructions or products referred to in the content. |
© 2024 by the author. Licensee MDPI, Basel, Switzerland. This article is an open access article distributed under the terms and conditions of the Creative Commons Attribution (CC BY) license (https://creativecommons.org/licenses/by/4.0/).