Abstract
Increasingly, humans are exposed to different activities at work, at home, and in general in their daily lives that generate episodes of stress. In many cases, these episodes could produce disorders in their health and reduce their quality of life. For this reason, it is crucial to implement mechanisms that can detect stress in individuals and develop applications that provide feedback through various activities to help reduce stress levels. Physiological parameters, such as galvanic skin response (GSR) and heart rate (HR) are indicative of stress-related changes. There exist methodologies that use wearable sensors to measure these stress levels. In this study, a sensor of blood volume pulse (BVP) and an electrocardiography (ECG) sensor were utilized to obtain metrics like heart rate variability (HRV) and pulse arrival time (PAT). Their features were extracted, processed, and analyzed for anxiety detection. The classification performance was evaluated using decision trees, a support vector machine (SVM), and meta-classifiers to accurately distinguish between “stressed” and “non-stressed” states. We obtained the best results with the SVM classifier using all the features. Additionally, we found that the ECG AD8232 sensor provided more reliable data compared to the photoplethysmography (PPG) signal obtained from the MAX30100 sensor. Therefore, the ECG is a more accurate tool for assessing emotional states related to stress and anxiety.
1. Introduction
Anxiety and stress are common in daily life and can impact performance. According to the World Health Organization (WHO), depression and anxiety cases have increased by 50% from 1990 to 2013 [1]. The WHO has also recommended investing in mental health treatment to enhance both individual well-being and economic growth [1]. Technology allows for the monitoring of physical and mental health through Quality-of-Life Technology (QoLT) [2,3], we can use devices like the MAX30100 oximeter (Maxim Integrated, San Jose, CA, USA) and AD8232 (Analog Devices, Wilmington, MA, USA) ECG sensors to assess anxiety. Physiological indicators such as heart rate (HR) [2,3,4,5,6], blood pressure (BP) [7,8], and heart rate variability (HRV) [6,8] can reflect stress levels.
This article analyzes students’ behavior before a test or evaluation about their stress and anxiety levels, using ECG and BVP sensors, with data collected by an ESP32 (Espressif, Shanghai, China). The ESP32 was chosen for its ability to handle multiple sensors and ADC converters with a higher resolution, facilitating connection and accuracy in reading. Twenty volunteers were monitored for five minutes before and after an evaluation event, and features were extracted from ECG and PPG signals using Matlab 2018B.
2. Analysis of Anxiety with Custom Sensors
Affective states can be analyzed by monitoring physiological signals, reflecting the influence of the Autonomic Nervous System (ANS) on respiratory and cardiovascular functions [8].
The ANS regulates involuntary activities like heart contraction and blood pressure [3] and consists of the parasympathetic nervous system (PNS) and the sympathetic nervous system (SNS) [7]. The PNS fosters a “rest and repose” state, while the SNS triggers a “fight or flight” response [8]. Stress increases SNS activity and decreases PNS activity [3,7]. Both HR and HRV are affected by these systems [3].
This study examines heart activity and oximetry responses to stress using the MAX30100 oximeter (Maxim Integrated, San Jose, CA, USA) and AD8232 ECG sensor (Analog Devices, Wilmington, MA, USA).
2.1. Heart Activity
Heart rate variability (HRV) measures the variation between consecutive heartbeats that can be analyzed in both the frequency and time domains [9]. It serves as a non-invasive tool to assess the ANS and is a useful stress indicator [3]. Factors like anxiety, stress, physical exercise, and heart disease activate the SNS, leading to increased HR [9]. HRV is derived from ECG and BVP signals.
Measurements of BVP can be realized using a photoplethysmography (PPG) sensor. The MAX30100 sensor can be configured to record a PPG signal at a frequency of 100 Hz. The finger is placed on the sensor, and it sends infrared light into the skin and measures the amount of light reflected. There is a direct relation between the amount of light reflected and the amount of blood that is present [3].
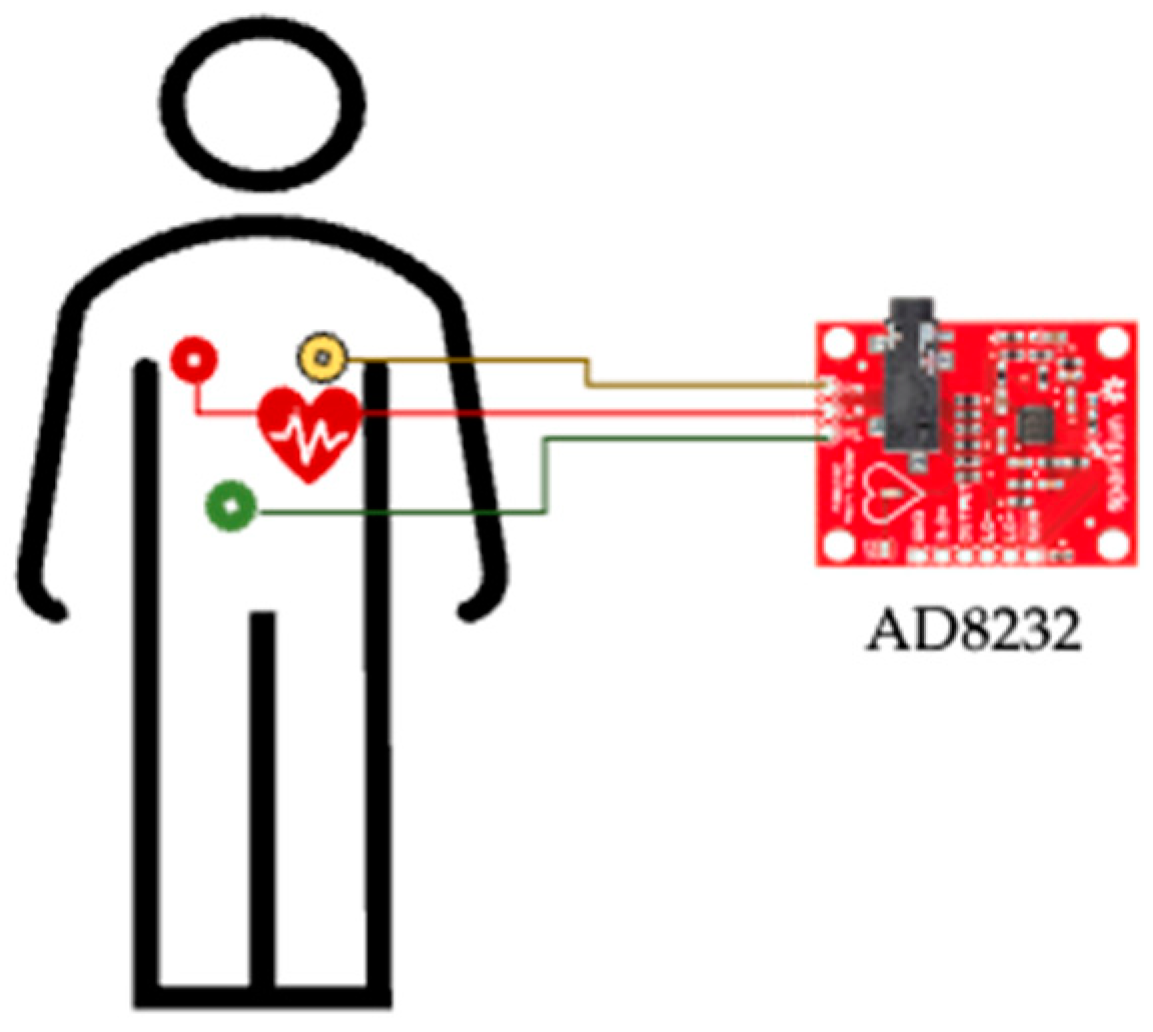
The AD8232 sensor captures ECG signals by detecting the electrical activity of the heart through body electrodes (Figure 1). It is ideal for HRV studies, as it provides cardiac data that help identify patterns related to stress, anxiety, and other physiological states related to the autonomic nervous system. The ECG is a periodic signal that shows the electrical activity produced by an impulse of ions flowing through the heart muscles [3].

Figure 1.
Measuring with a triode ECG sensor.
In the time domain, the features of the ECG signal can be obtained using statistical and geometric methods. The features extracted statistically are as follows:
- RR interval: Distance between two R-peaks consecutives (Figure 2) of the ECG signal.
- Heart Rate: Number of R-peaks measured inside a period (beats per minute bpm).
- : Mean value of normal RR intervals, where RRi is the interval i-th between two R-peaks consecutives.
- SDNN: Standard deviation of all normal RR intervals; where RRi is the interval i-th between R-peaks consecutives, N is the total number of normal RR intervals inside a period and is the mean value of all normal RR intervals [10].
- RMSSD: Root mean square successive difference of normal RR intervals.
- pNN50%: Number of successive differences of normal RR intervals (ΔRR) which differ by more than 50 ms. It is expressed as a percentage of the total number of normal RR intervals [9], where is the difference j-th between two RR intervals.
- SDSD: Standard deviation of differences between the adjacent normal RR intervals, where is the mean of all values [11].
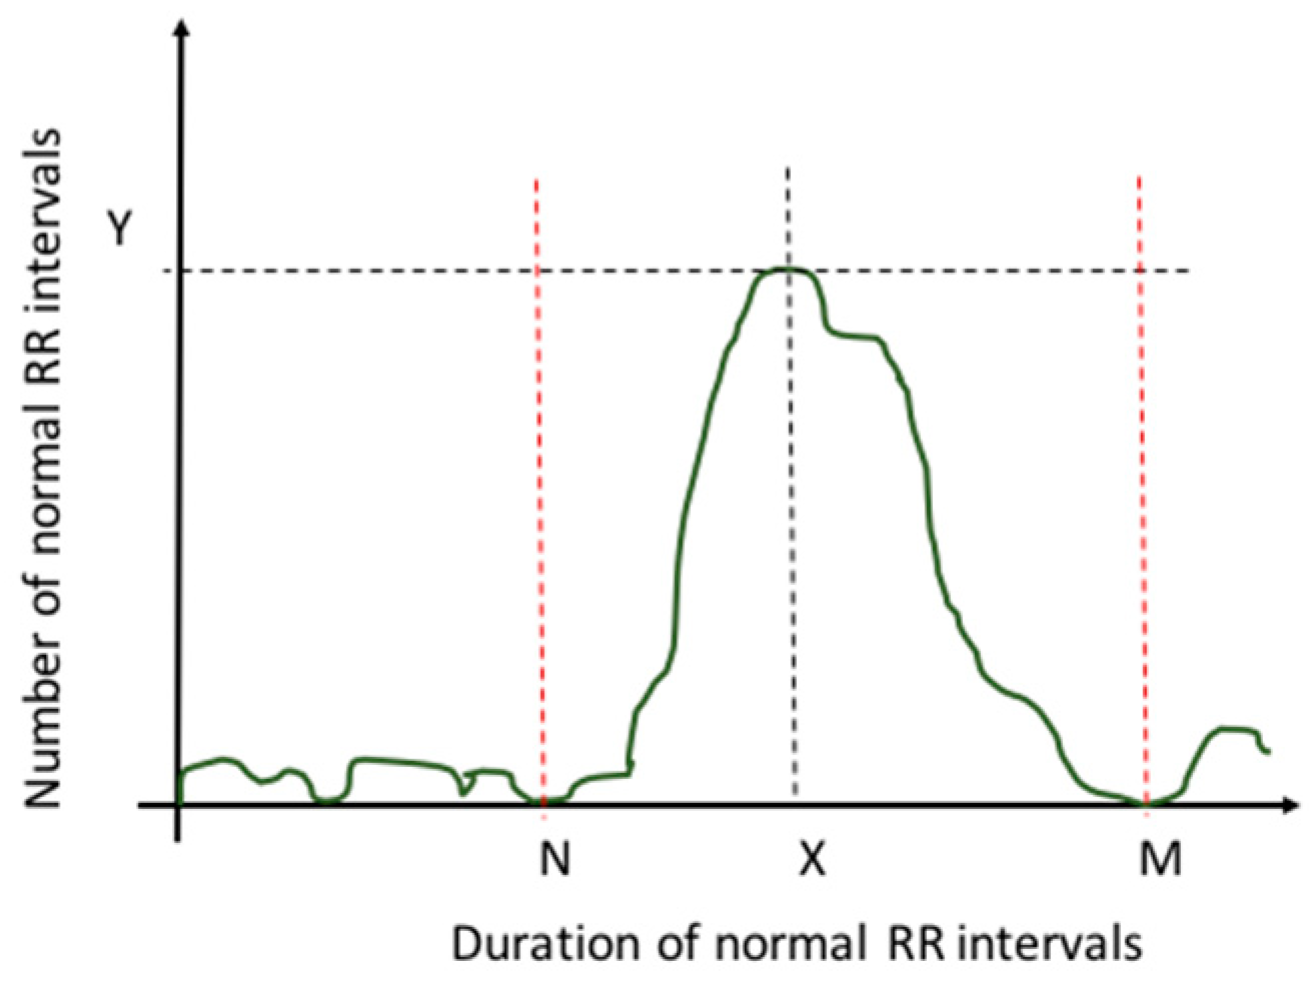
In the case of geometric methods, the features can be the HRV triangular index and the triangular interpolation of NN interval histogram (TINN) [6,9,11]. To calculate these features, the series of normal RR intervals should be converted into geometric patterns (Figure 2), where the duration of normal RR intervals serves as the x-axis of the plot and the number of normal RR intervals serves as the y-axis [11].
- HVR triangular index is measured as the relation between the total number of all normal RR intervals and the Y value, where Y is the maximum value of the sample density function [11].
- TINN is given by the difference between M and N values shown in Figure 2.
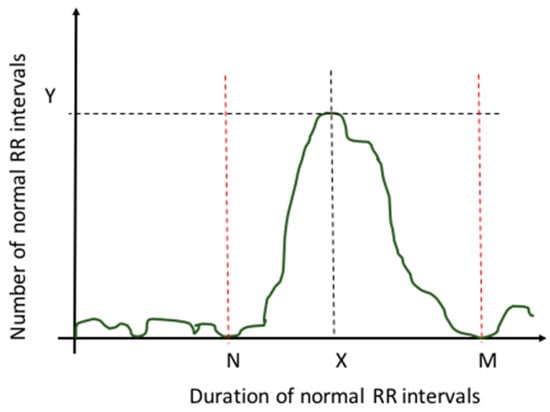
Figure 2.
Sample density distribution function [11].
Figure 2.
Sample density distribution function [11].
In the frequency domain, the short-term or long-term recordings can be executed. In short-term recordings (2 to 5 min), the power distribution and the central frequency of very low frequency (VLF, f < 0.04 Hz) [11], low frequency (LF, 0.04–0.15 Hz) and high frequency (HF, 0.15–0.4 Hz) [3,11,12] bands can be analyzed and quantified; other features can be obtained like the ratio of power in the LF to HF bands and total spectral power of all RR intervals up to 0.4 Hz [4,5,6,8,11,13]. For long-term recording (24 h), calculations can include total spectral power and the power in the ultra-low frequency (ULF, f ≤ 0.003 Hz), VLF (0.003–0.04 Hz), LF, and HF bands [11].
2.2. Pulse Arrival Time
Pulse arrival time (PAT) is the interval that a pulse wave takes to travel the distance from the heart to some distal place on the body [14]. It can be determined as the time delay between the R-peak of ECG and the peak value of an arterial pulse waveform Since PAT and HR are correlated with blood pressure, features related to PAT variability may be useful for analyzing their relationship with a person’s stress level. PAT features used can be the mean of PAT, standard deviation (SD) of PAT, SD of PAT variability PAT-V, and RMS of PAT-V.
3. Collected Data
3.1. Participants
The collected dataset was realized in twenty student volunteers between 19 and 27 years old, including two women and eighteen men. The measurements were taken for five minutes in the following two stages: minutes before an evaluation event and after this event. Consent was obtained from all volunteers before the measurement protocol started.
3.2. Equipment
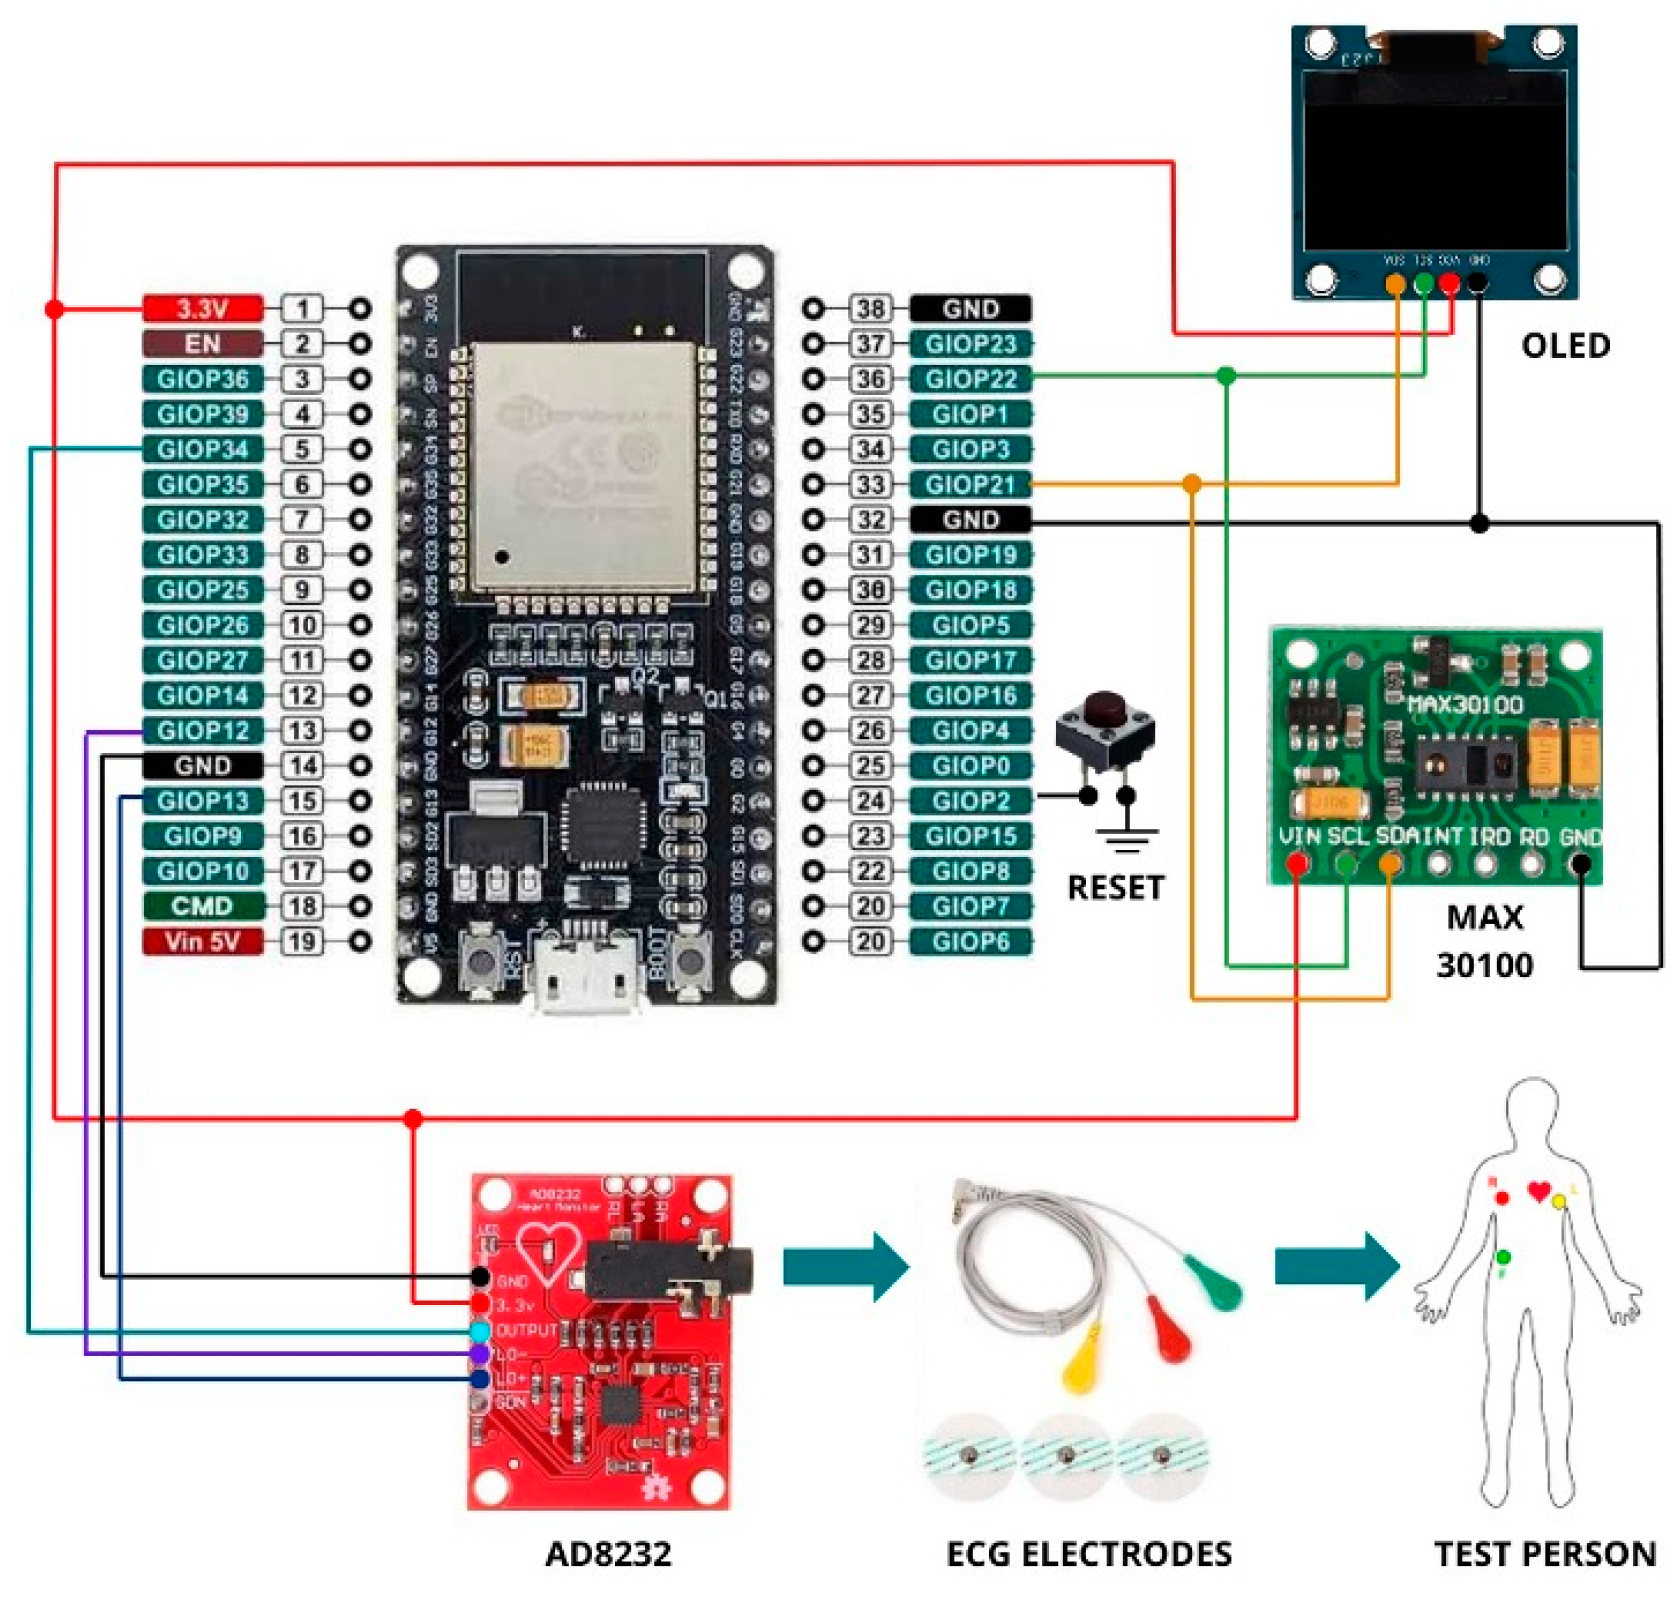
The MAX30100 sensor and the AD8232 module were used for data acquisition. To measure ECG, the AD8232 sensor was placed on the left side of the student’s chest. The MAX30100 sensor was positioned on the student’s index finger to obtain the PPG signal and heart rate data (Figure 3).
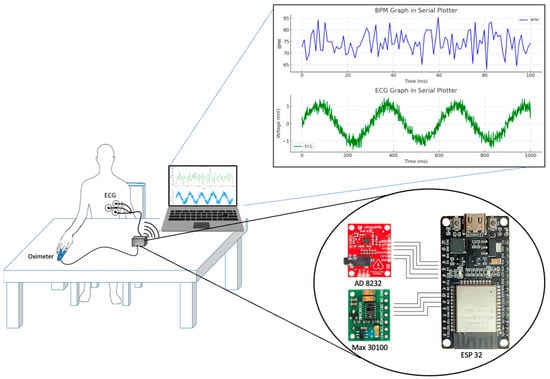
Figure 3.
Connections with MAX-30100, AD8232, and ESP32.
3.3. Measure Protocol
The measures were divided into the following two stages over five minutes: one stage, a few minutes before the evaluation activity, and the second stage, after this activity. Each stage was executed in the same manner as follows:
- Each student filled out the “Cognitive Test Anxiety Scale” of 27 questions [15].
- Triode ECG and oximeter were placed.
- Each student sat still for five minutes, with their arm resting on a table and hand outstretched.
3.4. Extract Features
In this work, we extracted five features from the ECG and PPG data recording, and four were calculated with the PAT value. All the measurements before the evaluation activity were associated with a “stressed” state. At the same time, the measures after an evaluation activity were associated with a “non-stressed” state.
Table 1 shows the features calculated. Each feature set consisted of 20 values for the “stressed” state and 20 values for the “non-stressed state”.

Table 1.
Features analyzed.
3.5. Anxiety Level Calculation
An anxiety test [15] was applied before the measurement process, which consisted of 27 questions. Students were asked to score for each question ranging from A to D, where A = “Not at all typical of me”, B = “Only somewhat typical of me”, C = “Quite typical of me”, and D = “Very typical of me”. The weights to calculate the score for A, B, C, and D were 1, 2, 3, and 4 points, respectively. The possible range of scores was 27 to 108 points. The score calculated was characterized by the following three anxiety levels: less than 33 as “Low”, 33–66 as “Moderate”, and greater than 66 as “High” (Table 2).
Table 2.
The score obtained in the anxiety test.
4. Methods
4.1. ECG and PPG Signals Obtained from ESP32
ECG data collected with an AD8232 sensor was sent to ESP32 using pin 34 as analogic input, while PPG data collected with a MAX30100 sensor was sent to ESP32 using I2C. Schematic of the connection between the MAX30100, AD8232, and ESP32.
Figure 4 shows the connections between the ESP32, sensors, OLED display, and electrodes on the test subject. The program on the ESP32 initializes the sensors and display, providing instructions and real-time readings. The MAX30100 sensor detects heartbeats, with data continuously updated on the OLED screen. Simultaneously, the AD8232 module monitors heart electrical activity, transmitting the ECG signal to the ESP32. Signals indicating electrode contact loss (LO+ and LO−) are managed to ensure data accuracy. The reset button allows system reinitialization at any time, easily enabling new measurements.
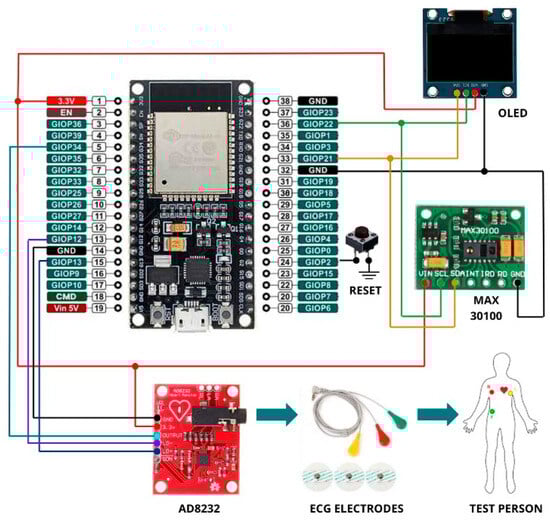
Figure 4.
Wiring diagram implemented for data acquisition.
4.2. Heart Rate and Features Obtained from ECG and PPG Signals
Before feature extraction, signals were preprocessed in Matlab using a 4th order Butterworth low-pass filter to eliminate high-frequency noise and a five-sample median filter to remove peaks and unwanted noise.
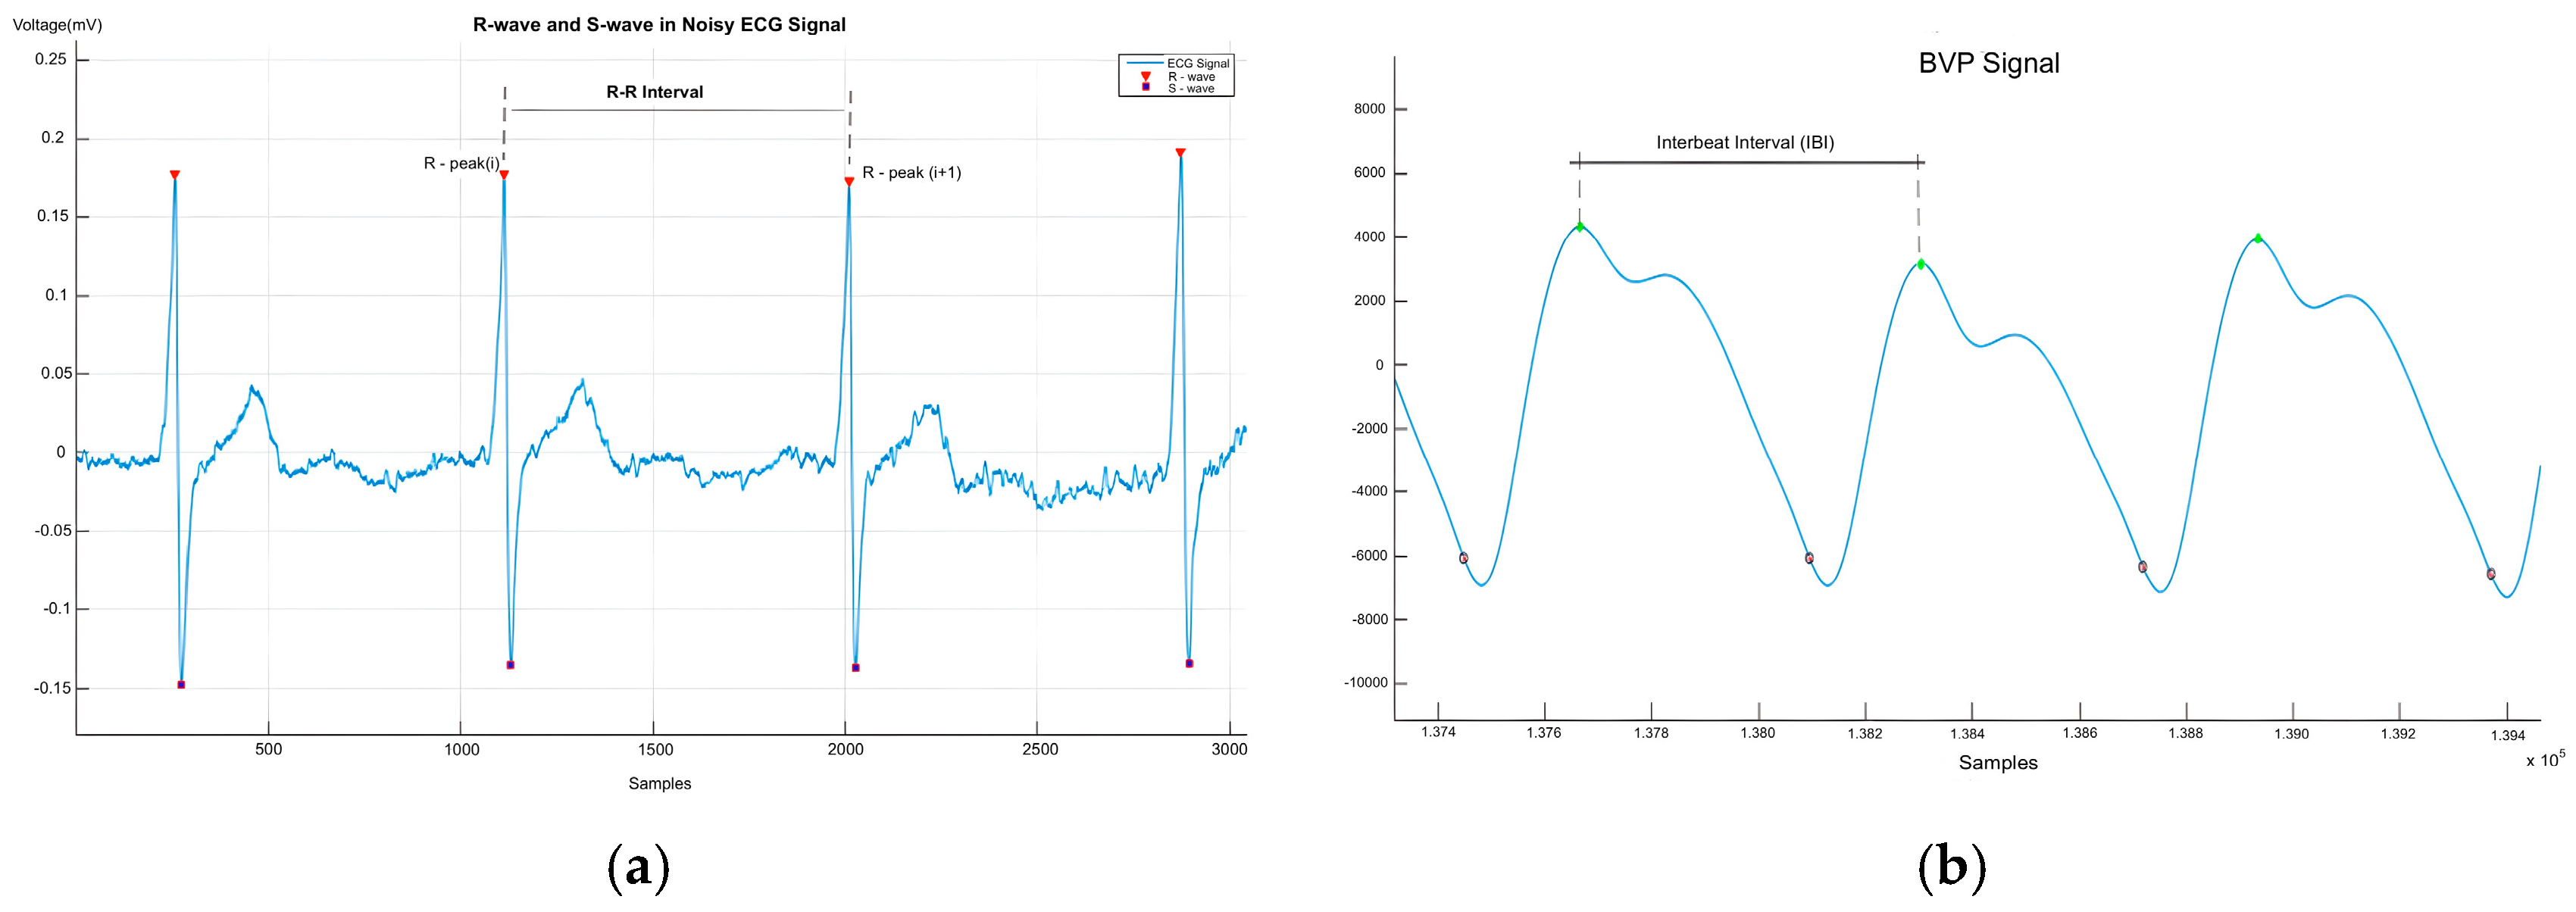
The ECG signal’s periodic nature allowed for the calculation of HRV features from the R–R intervals. Matlab was used to segment the ECG data and detect R-peaks, with RR intervals as shown in Figure 5a. The HR was derived from ECG R-peaks and calculated with Equation (1). ECG features like SDNN, RMSSD, SDSD, and pNN50% were computed with Matlab.
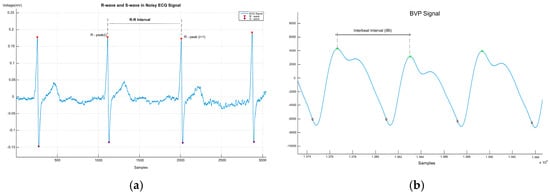
Figure 5.
(a) R–R interval in the ECG signal; (b) IBI in the BVP signal [16].
For PPG signals, beat peaks and intervals were calculated using Matlab and represented in Figure 5b. On the other hand, Figure 6 represents the PAT calculated by synchronizing ECG and PPG signals; the green and red markers represent the R-peak of the ECG signal and the maximum peak of the BVP signal, respectively.
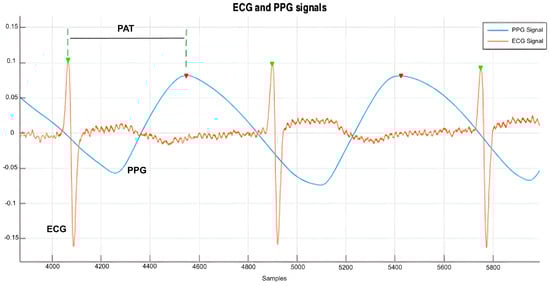
Figure 6.
Representation of pulse arrival time [16].
4.3. Statistical Evaluation Methods
The Kolmogorov–Smirnov test (KST) assessed if each feature followed a normal distribution with a 5% significance level. Table 3 shows that ECG and PAT features met this requirement, while SDNN, SDSD, and RMSSD from PPG did not. Despite this, parametric methods were used as only 3 of 14 features rejected normality.
Table 3.
Results of Kolmogorov–Smirnov test.
This paired study compared stress levels before and after a stressor, evaluating the same subjects two times. Paired Student t-test was used, assuming a normal distribution. The null hypothesis stated no significant difference in stress levels, while the alternative suggested changes due to evaluation.
Table 4 shows that for the ECG features, the null hypothesis was rejected for pNN50. For SDNN, RMSSD, and SDSD, the null hypothesis was rejected due to t-stat values outside the confidence interval. Significant differences were also found in the PAT features and SDNN and RMSSD from the PPG. The other features met the null hypothesis.
Table 4.
Results of t-test.
5. Results and Discussion
5.1. Anxiety Score and Relation with ECG and PPG Features
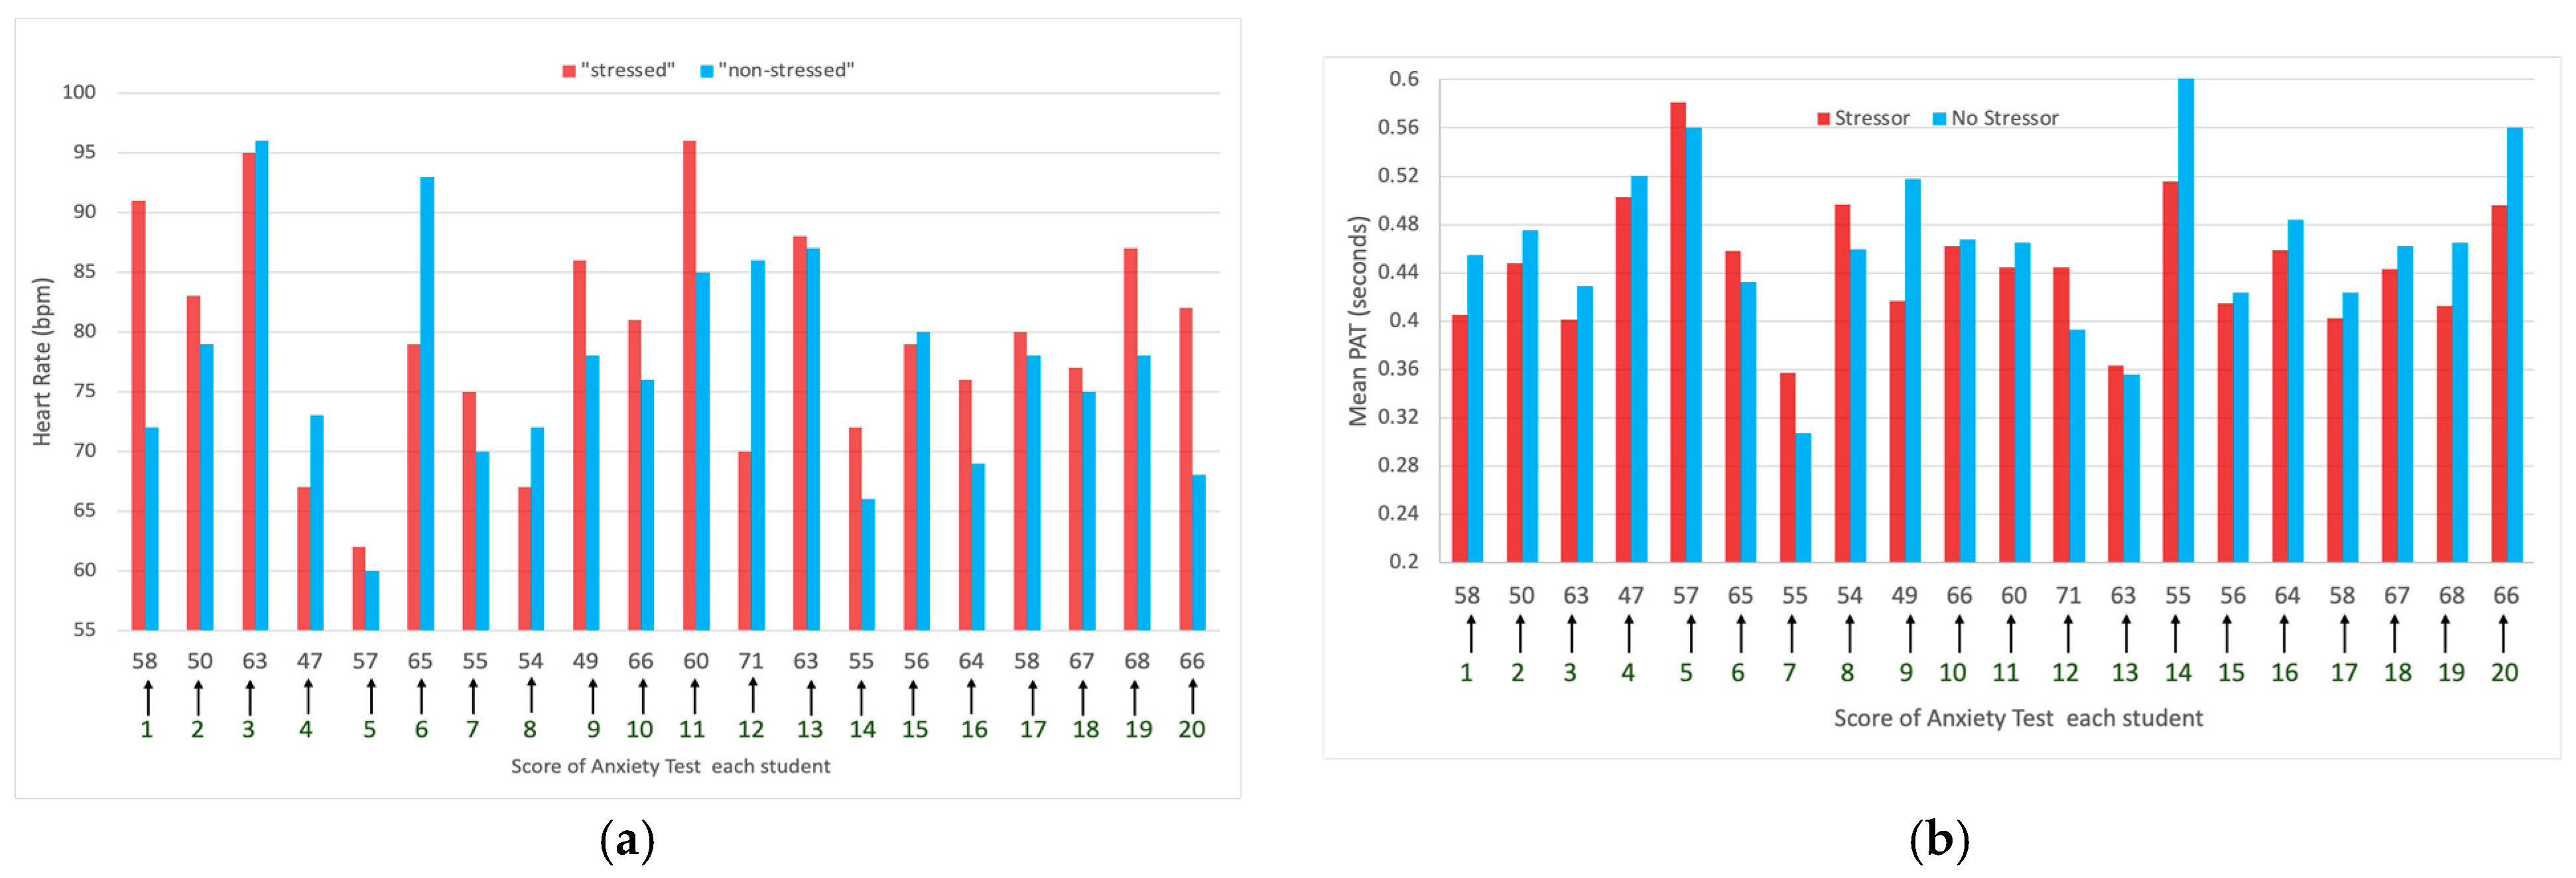
According to the Cognitive Test Anxiety Scale, 3 subjects scored over 66, indicating “high” anxiety, while 17 had moderate anxiety. Figure 7a shows HR changes before and after the evaluation event. Ten students experienced a significant HR increase, four had a decrease, and six showed minimal variation.
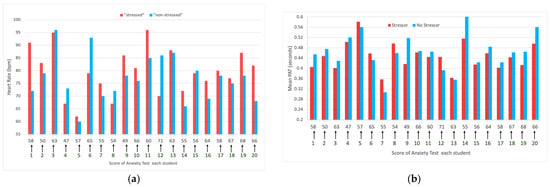
Figure 7.
(a) HR of each student before and after the activity evaluation related to the score of tests.; (b) Mean of PAT related to the score of the test.
Figure 7b shows that nine students had a decrease in the mean PAT before the evaluation event, five experienced an increase, and three showed minimal change.
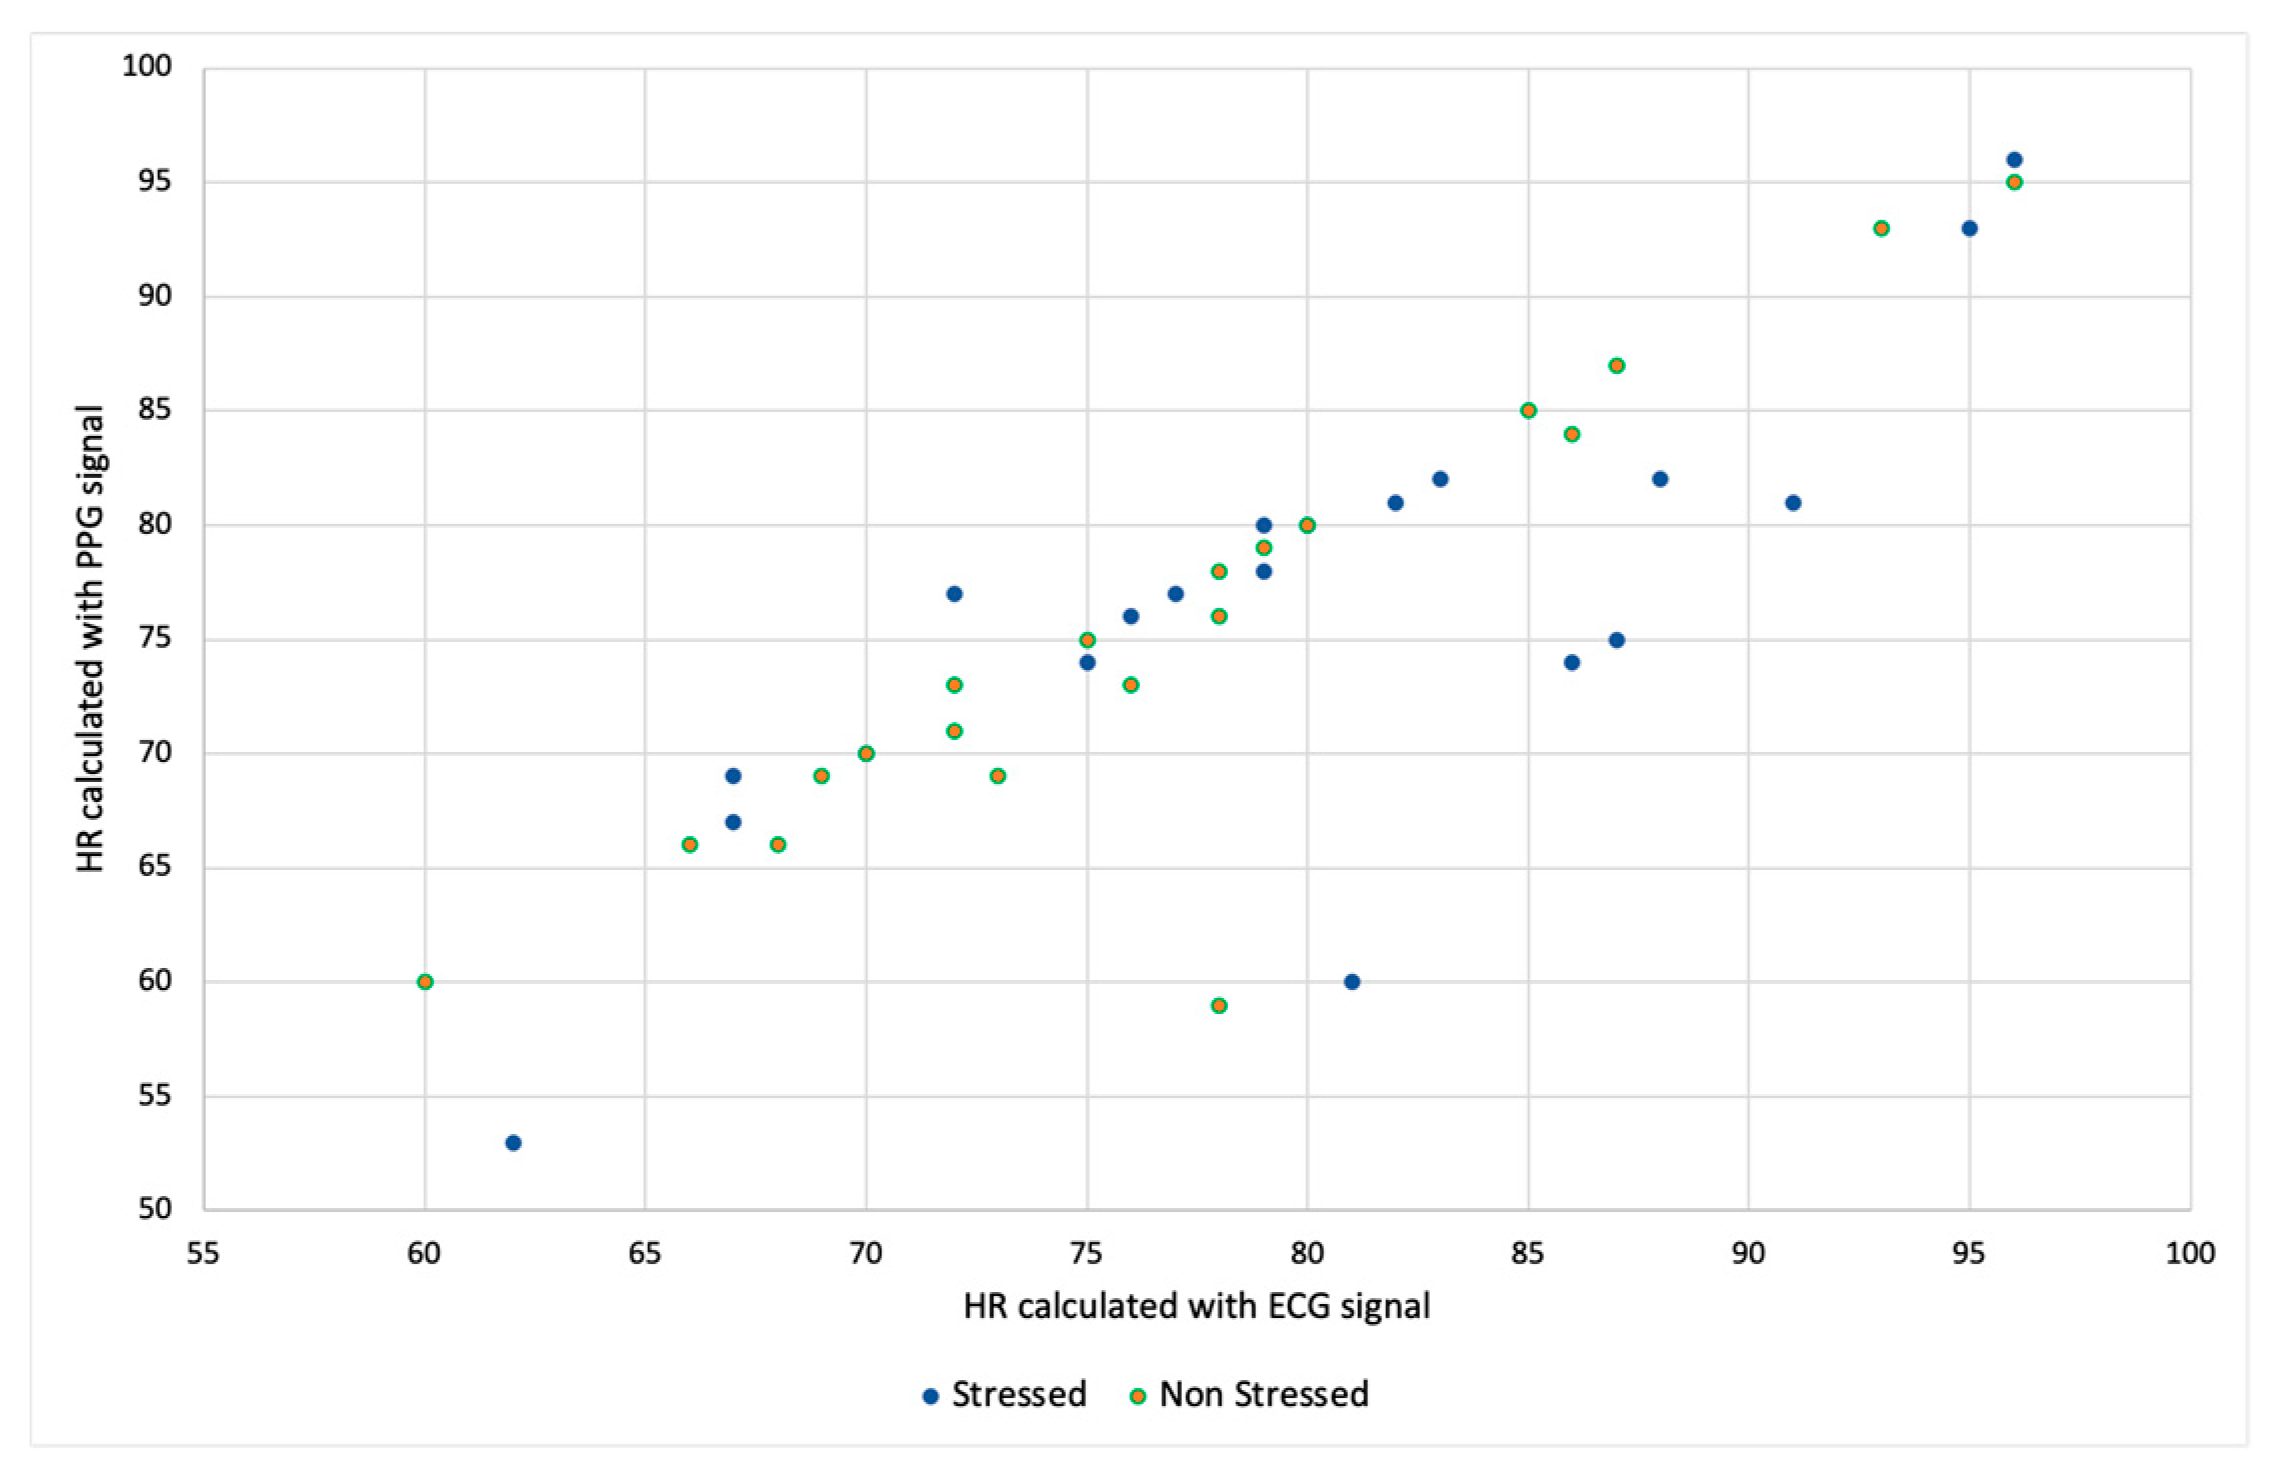
5.2. Relation between HR Calculated with ECG and PPG Signal
If we make the correlation between the values of HR obtained with the ECG signal and the value calculated using the PPG signal, we can see that it has a linear tendency in Figure 8.
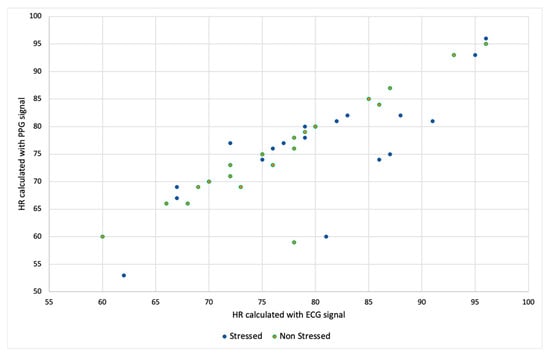
Figure 8.
Relation between HR calculated with ECG and PPG signals.
5.3. Classification Performance
Each ECG, PPG, and PAT feature was calculated with a 180 s window, shifting every 6 s. The data were split into 70% training and 30% testing, with the training set containing 633 instances. Based on the t-test results, 11 out of 14 features were selected. Classification performance was evaluated using 10-fold cross-validation on the training set. The results from our experiments are displayed in Table 5. The best results are with the SMO-RBF classifier using all the features with a value of 99.84%. If we compare each feature, the best result is with the PAT features.
Table 5.
Stress classification accuracies with different classifiers.
6. Conclusions
This study analyzed features of ECG, PPG, and PAT signals, finding that the ECG AD8232 sensor provided more reliable data than the PPG signal obtained from the MAX30100 sensor. This indicates that ECG is a more accurate tool for assessing emotional states related to stress and anxiety.
To enhance the accuracy and reliability of the results, it is crucial to increase the sample size. A larger sample would enable a more robust and representative population analysis. No direct relationship was observed between the anxiety test values and the features of the signals, suggesting that current tests may not fully capture the variability in emotional responses.
Frequency domain analysis was not included in this study, which could be a promising direction for future research. Additionally, while the MAX30100 sensor is useful for measuring oxygen saturation and heart rate, it showed less precision than ECG for detecting subtle changes. The AD8232, on the other hand, provided detailed measurements of the cardiac activity, excelling in the heart rate variability (HRV) assessment.
In conclusion, while both sensors have their strengths, the combined use of the MAX30100 and AD8232 can offer a more comprehensive view of emotional and physical states. Future studies should consider including frequency domain analysis and expanding the sample size to improve the understanding of the relationship between physiological signals and stress.
Author Contributions
Conceptualization, S.S.; methodology, S.S., J.A., and P.H.; software, S.S.; validation, S.S., J.A., and P.H.; writing—original draft preparation, S.S.; writing—review and editing, S.S., J.A., and P.H. All authors have read and agreed to the published version of the manuscript.
Funding
This research received no external funding.
Institutional Review Board Statement
Not applicable.
Informed Consent Statement
Informed consent was obtained from all subjects involved in the study.
Data Availability Statement
The raw data supporting the conclusions of this article will be made available by the authors upon request.
Conflicts of Interest
The authors declare no conflict of interest.
References
- World Health Organization Investing in Treatment for Depression and Anxiety Leads to Fourfold Return. Available online: https://www.who.int/news/item/13-04-2016-investing-in-treatment-for-depression-and-anxiety-leads-to-fourfold-return (accessed on 9 October 2024).
- Sandulescu, V.; Andrews, S.; Ellis, D.; Bellotto, N.; Mozos, O.M. Stress Detection Using Wearable Physiological Sensors. In Proceedings of the International Work-Conference on the Interplay Between Natural and Artificial Computation (IWINAC 2015), Elche, Spain, 1–5 June 2015; pp. 526–532. [Google Scholar]
- Sharma, N.; Gedeon, T. Objective Measures, Sensors and Computational Techniques for Stress Recognition and Classification: A Survey. Comput. Methods Programs Biomed. 2012, 108, 1287–1301. [Google Scholar] [CrossRef] [PubMed]
- Liu, D.; Ulrich, M. Listen to Your Heart: Stress Prediction Using Consumer Heart Rate Sensors. 2013. Available online: https://cs229.stanford.edu/proj2013/LiuUlrich-ListenToYourHeart-StressPredictionUsingConsumerHeartRateSensors.pdf (accessed on 9 October 2024).
- Jung, S.-J.; Chung, W.-Y. Non-Intrusive Healthcare System in Global Machine-to-Machine Networks. IEEE Sens. J. 2013, 13, 4824–4830. [Google Scholar] [CrossRef]
- Zenonos, A.; Khan, A.; Kalogridis, G.; Vatsikas, S.; Lewis, T.; Sooriyabandara, M. HealthyOffice: Mood Recognition at Work Using Smartphones and Wearable Sensors. In Proceedings of the 2016 IEEE International Conference on Pervasive Computing and Communication Workshops (PerCom Workshops), Sydney, Australia, 14–18 March 2016; pp. 1–6. [Google Scholar]
- Fernandes, A.; Helawar, R.; Lokesh, R.; Tari, T.; Shahapurkar, A.V. Determination of Stress Using Blood Pressure and Galvanic Skin Response. In Proceedings of the 2014 International Conference on Communication and Network Technologies, Sivakasi, India, 18–19 December 2014; pp. 165–168. [Google Scholar]
- Barreto, A.; Zhai, J.; Adjouadi, M. Non-Intrusive Physiological Monitoring for Automated Stress Detection in Human-Computer Interaction. In Proceedings of the Human-Computer Interaction (HCI 2007), Rio de Janeiro, Brazil, 20 October 2007; pp. 29–38. [Google Scholar]
- Rajendra Acharya, U.; Paul Joseph, K.; Kannathal, N.; Lim, C.M.; Suri, J.S. Heart Rate Variability: A Review. Med. Biol. Eng. Comput. 2006, 44, 1031–1051. [Google Scholar] [CrossRef] [PubMed]
- Wang, H.M.; Huang, S.C. SDNN/RMSSD as a Surrogate for LF/HF: A Revised Investigation. Model. Simul. Eng. 2012, 2012. [Google Scholar] [CrossRef]
- Malik, M. Heart Rate Variability: Standards of Measurement, Physiological Interpretation, and Clinical Use. Circulation 1996, 93, 1043–1065. [Google Scholar] [CrossRef]
- Karim, N.; Hasan, J.; Ali, S.S. Heart Rate Variability—A Review. J. Basic Appl. Sci. 2011, 7, 71–77. [Google Scholar]
- Zheng, Y.; Wong, T.; Leung, B.; Poon, C. Unobtrusive and Multimodal Wearable Sensors to Quantify Anxiety. IEEE Sens. J. 2016, 16, 1. [Google Scholar] [CrossRef]
- Allen, J. Photoplethysmography and Its Application in Clinical Physiological Measurement. Physiol Meas 2007, 28, R1–R39. [Google Scholar] [CrossRef] [PubMed]
- Cassady, J.C.; Johnson, R.E. Cognitive Test Anxiety and Academic Performance. Contemp Educ Psychol 2002, 27, 270–295. [Google Scholar] [CrossRef]
- Maita, S.L.S.; Silva, J.M.S. New Models of Reliability in the New Generation of Internet of Things. Ph.D. Thesis, Universidade de Coimbra, Coimbra, Portugal, 2020. [Google Scholar]


Disclaimer/Publisher’s Note: The statements, opinions and data contained in all publications are solely those of the individual author(s) and contributor(s) and not of MDPI and/or the editor(s). MDPI and/or the editor(s) disclaim responsibility for any injury to people or property resulting from any ideas, methods, instructions or products referred to in the content. |
© 2024 by the authors. Licensee MDPI, Basel, Switzerland. This article is an open access article distributed under the terms and conditions of the Creative Commons Attribution (CC BY) license (https://creativecommons.org/licenses/by/4.0/).