Abstract
In this paper, we propose a new test for the detection of polynomial modulated signals, as well as an aggregated test based on the new test. The test statistics are developed under the multitaper spectral framework, and are designed to be robust to the choice of the multitaper order K. The proposed tests are based on a modification of a previous test statistic developed by the authors, denoted by . We review the test, and discuss some of its shortcomings, then propose our two tests. We illustrate performance via simulations, and apply our tests to SoHO GOLF optical solar time series.
1. Introduction
In many fields [1,2,3,4,5], detecting periodic signals is an important application, and an active area of research. Both the Harmonic F-test and the non-parametric multitaper spectral estimator, described in [6], are well established as robust tests for detecting signals with a periodic form in stationary noise. If the time series in question has a carrier frequency that is modulated by a polynomial of degree P, the detection probability of the aforementioned F-test is reduced drastically.
We propose two modifications to the semi-parametric tests, introduced in [7], to detect a line component of a Frequency Modulated (FM) signal modulated by a polynomial of degree (1, ⋯, P). The first modification is intended to improve the detection probability when an even number of tapers is selected. The second modification is an improvement to the Aggregate test proposed in [7] through use of the new test. These modifications are shown to be more effective than the and the Aggregate test. To approximate the quantile of the Aggregate test statistic corresponding to a given test size, we provide a simple upper bound for the complementary cumulative distribution function (CDF) of the Aggregate test statistic [8].
This paper is organized as follows. In Section 2, the test statistic from [7] is reviewed; denoted by . In Section 3, we discuss our modification of the statistic and its distribution. We also redefine the Aggregate test statistic from [7], denoted by , and provide an upper bound for its complementary CDF. In Section 4, the performance of the , , , the Harmonic-F (HARM−F) and the test statistic from [9], is compared via simulation. In Section 5, we apply our F-tests to a time series generated by the SoHO GOLF instrument.
2. Statistic
We first review the test statistic , previously proposed in [7]. Let be a time series of length N of the form
where is the amplitude, represents a polynomial of degree P, and is a stationary noise process. We aim to detect , the carrier frequency, of this modulated signal. The test uses the sine tapers [10], where the taper is an vector with components given by
, possessing derivatives
We let V and denote the matrices whose columns are the tapers and their derivatives, respectively.
The statistic is essentially a weighted version of the statistic from [9]. As such, we define a matrix of weights by such that the elements on the diagonal are given by
where . The vector of K weighted complex-valued eigencoefficients at frequency f is then given by
where is a vector with components , , and is an vector with components , .
Now that we have tapered the series, we want to transform the series from the frequency domain back into the time domain. By doing so, we gain the ability to isolate the contribution due to a single frequency f across the whole time span. We achieve this with a standard inverse projection filter [11], given by and its derivative ; we have suppressed the dependence on f in the preceding notation. The standard inverse is then written in polar form, allowing us to take the derivative the instantaneous phase with respect to time. By doing so, we obtain the instantaneous frequency is given by (see [12]):
The component estimates, in the band surrounding frequency f, the instantaneous frequency at time t. is the component of U, and similarly for , , and . The eigencoefficients of represents the polynomial trends in the time series given by
where is the data taper and
As the polynomial trends are concentrated near 0, we set . Solving a polynomial regression problem with H being a design matrix and as the input, using ordinary least squares, we obtain
The test statistic is then defined as:
where is calculated with Equation (9), but with the first column () removed from before it is computed. The vector has dimension with elements . converges in distribution to [8].
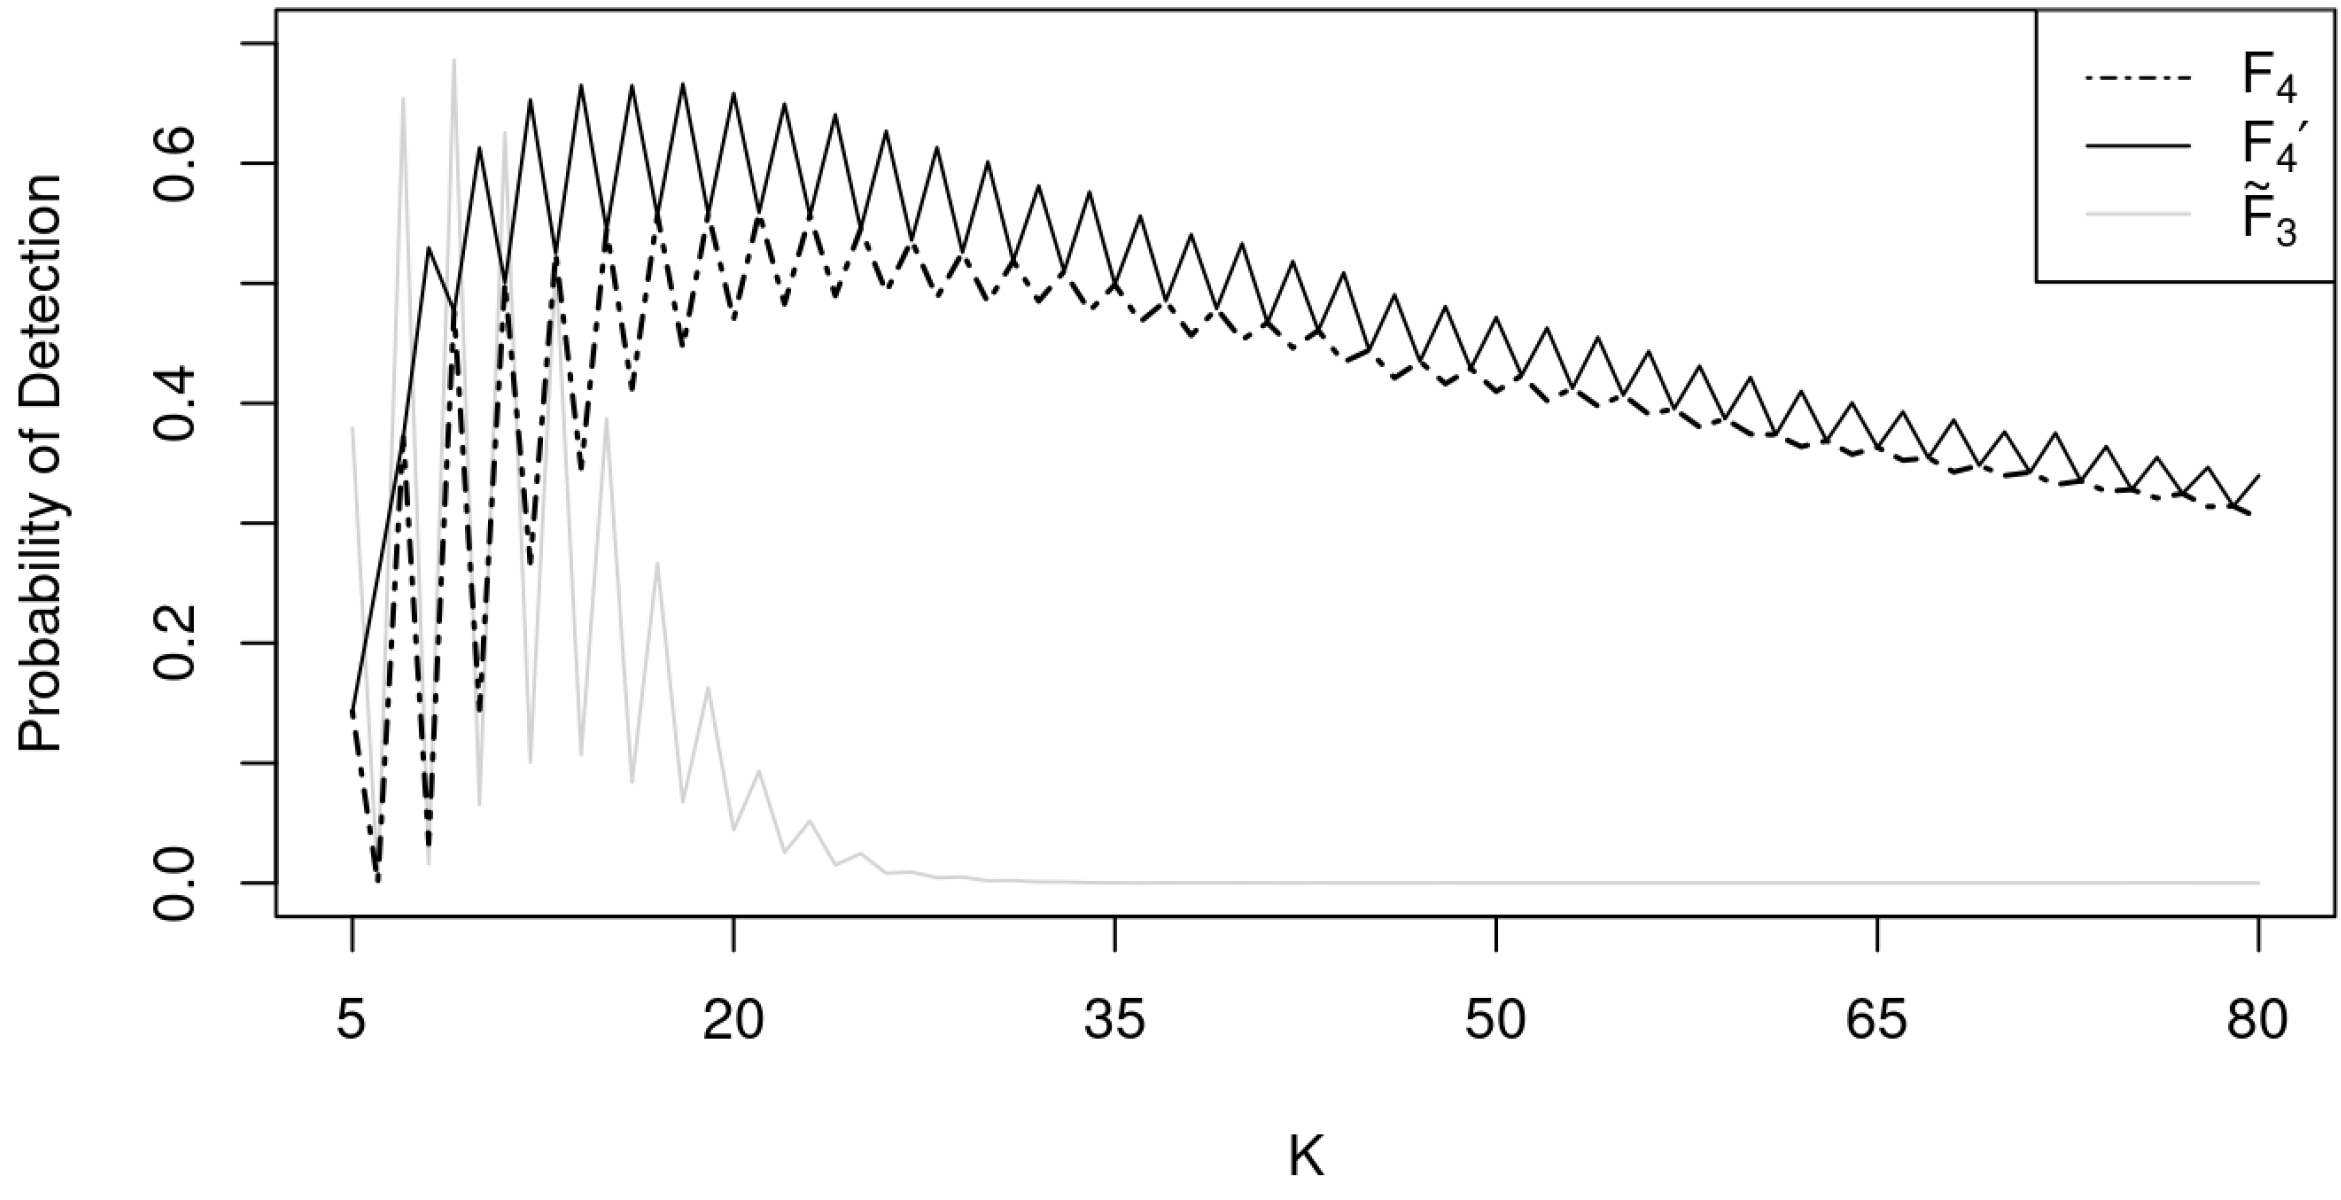
From Figure 1, it can be seen that the weighting used in does improve the test statistic compared to . Notice that both tests still suffer from a worse detection probability when an even K is used. To fix this issue, a new test, , was created.
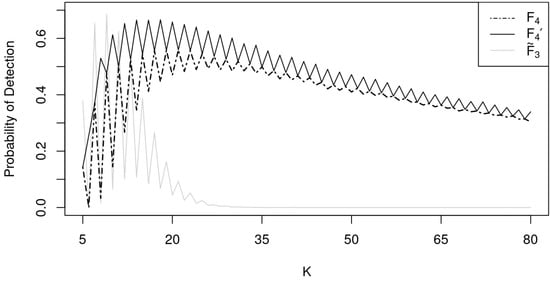
Figure 1.
Detection probability of in gray (dashed), in gray, and in black. A total of 10,000 simulations conducted with for each simulation at a significance level of . The signal is given by Equation (1) with and is a white noise process with mean 0 and variance 1.
3. Statistic
The sine tapers have the very interesting property in that, when using a fixed length N, and , the first K columns of both taper matrices will be identical (this is not true of DPSS tapers). Therefore, the only difference between the taper matrices corresponding to any consecutive even and odd choices of K is the last column. With this in mind, in the following, we isolate and remove the contribution to the test statistic due to the last taper for any choice of even K, assuming that the polynomial modulation is linear . We believe that focusing on the simpler case is useful as, in practice, the frequency modulation of interest will vary slowly over time. If the time series does contain a polynomial of degree , then the modulation occurring in a finite time, while polynomial, may be approximated well by a linear modulation.
For , we rewrite the statistic for a given K as
where , is the isolated contribution to r due to only the last taper (of order ) and is the contribution to r from all other tapers (of orders ). The component is obtained by replacing K with in the statistics and . We found that, for even choices of K, was positive, causing a reduction in test statistic value. In contrast, for odd choices of K, was negative. can now be defined as
It has been shown [8] that has the PDF
where
with .
Observing Figure 1, note that even choices of K now have a higher probability of detection, surpassing odd choices of K sometimes. The same idea was examined for odd K, but under simulation, it was found to decrease the probability of detection compared to .
An alternative approach introduced previously was called the Aggregate Test, based on [7]. Let , , where each is a prespecified number of tapers, each of which is used in the -test. The test statistic is given by:
where is the -quantile of the distribution. For a specified threshold integer, R, which represents the quantity of tests that reject the null hypothesis, and the Aggregate test rejects the null if . The null hypothesis for the Aggregate test is that at frequency f, there is no modulated signal. There are two main difficulties with this test statistic. As we have shown above, for any even K, the test will have a lower detection probability than the . In order to improve the Aggregate test statistic, we suggest re-defining the test in terms of instead of . Writing
we can define the new Aggregate test statistic using regularized incomplete beta functions. The CDF corresponding to a significance level is used to calculate the quantile, , given by:
The second issue is the unknown distribution of the Aggregate test. Previously, the necessary confidence level, , could only be approximated through simulation. We will now propose a new method using an upper bound on the distribution. Let be the Type I error for each ; then, for , the union-upper-bound is
The point where the complementary CDF is essentially zero can be estimated. From Figure 2, if is chosen, setting the Type I error to be implies , which is valid for .
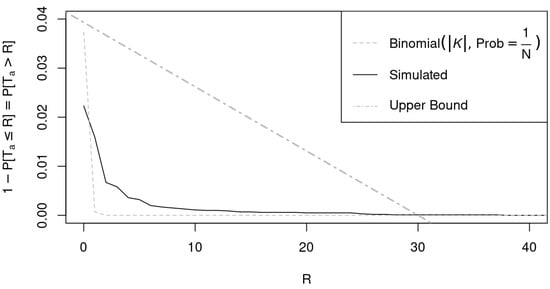
Figure 2.
Estimate of the complementary CDF of the Aggregate test for and , , with 10,000. The time series were created using independent Gaussian white noise replicates.
4. Simulation and Comparison
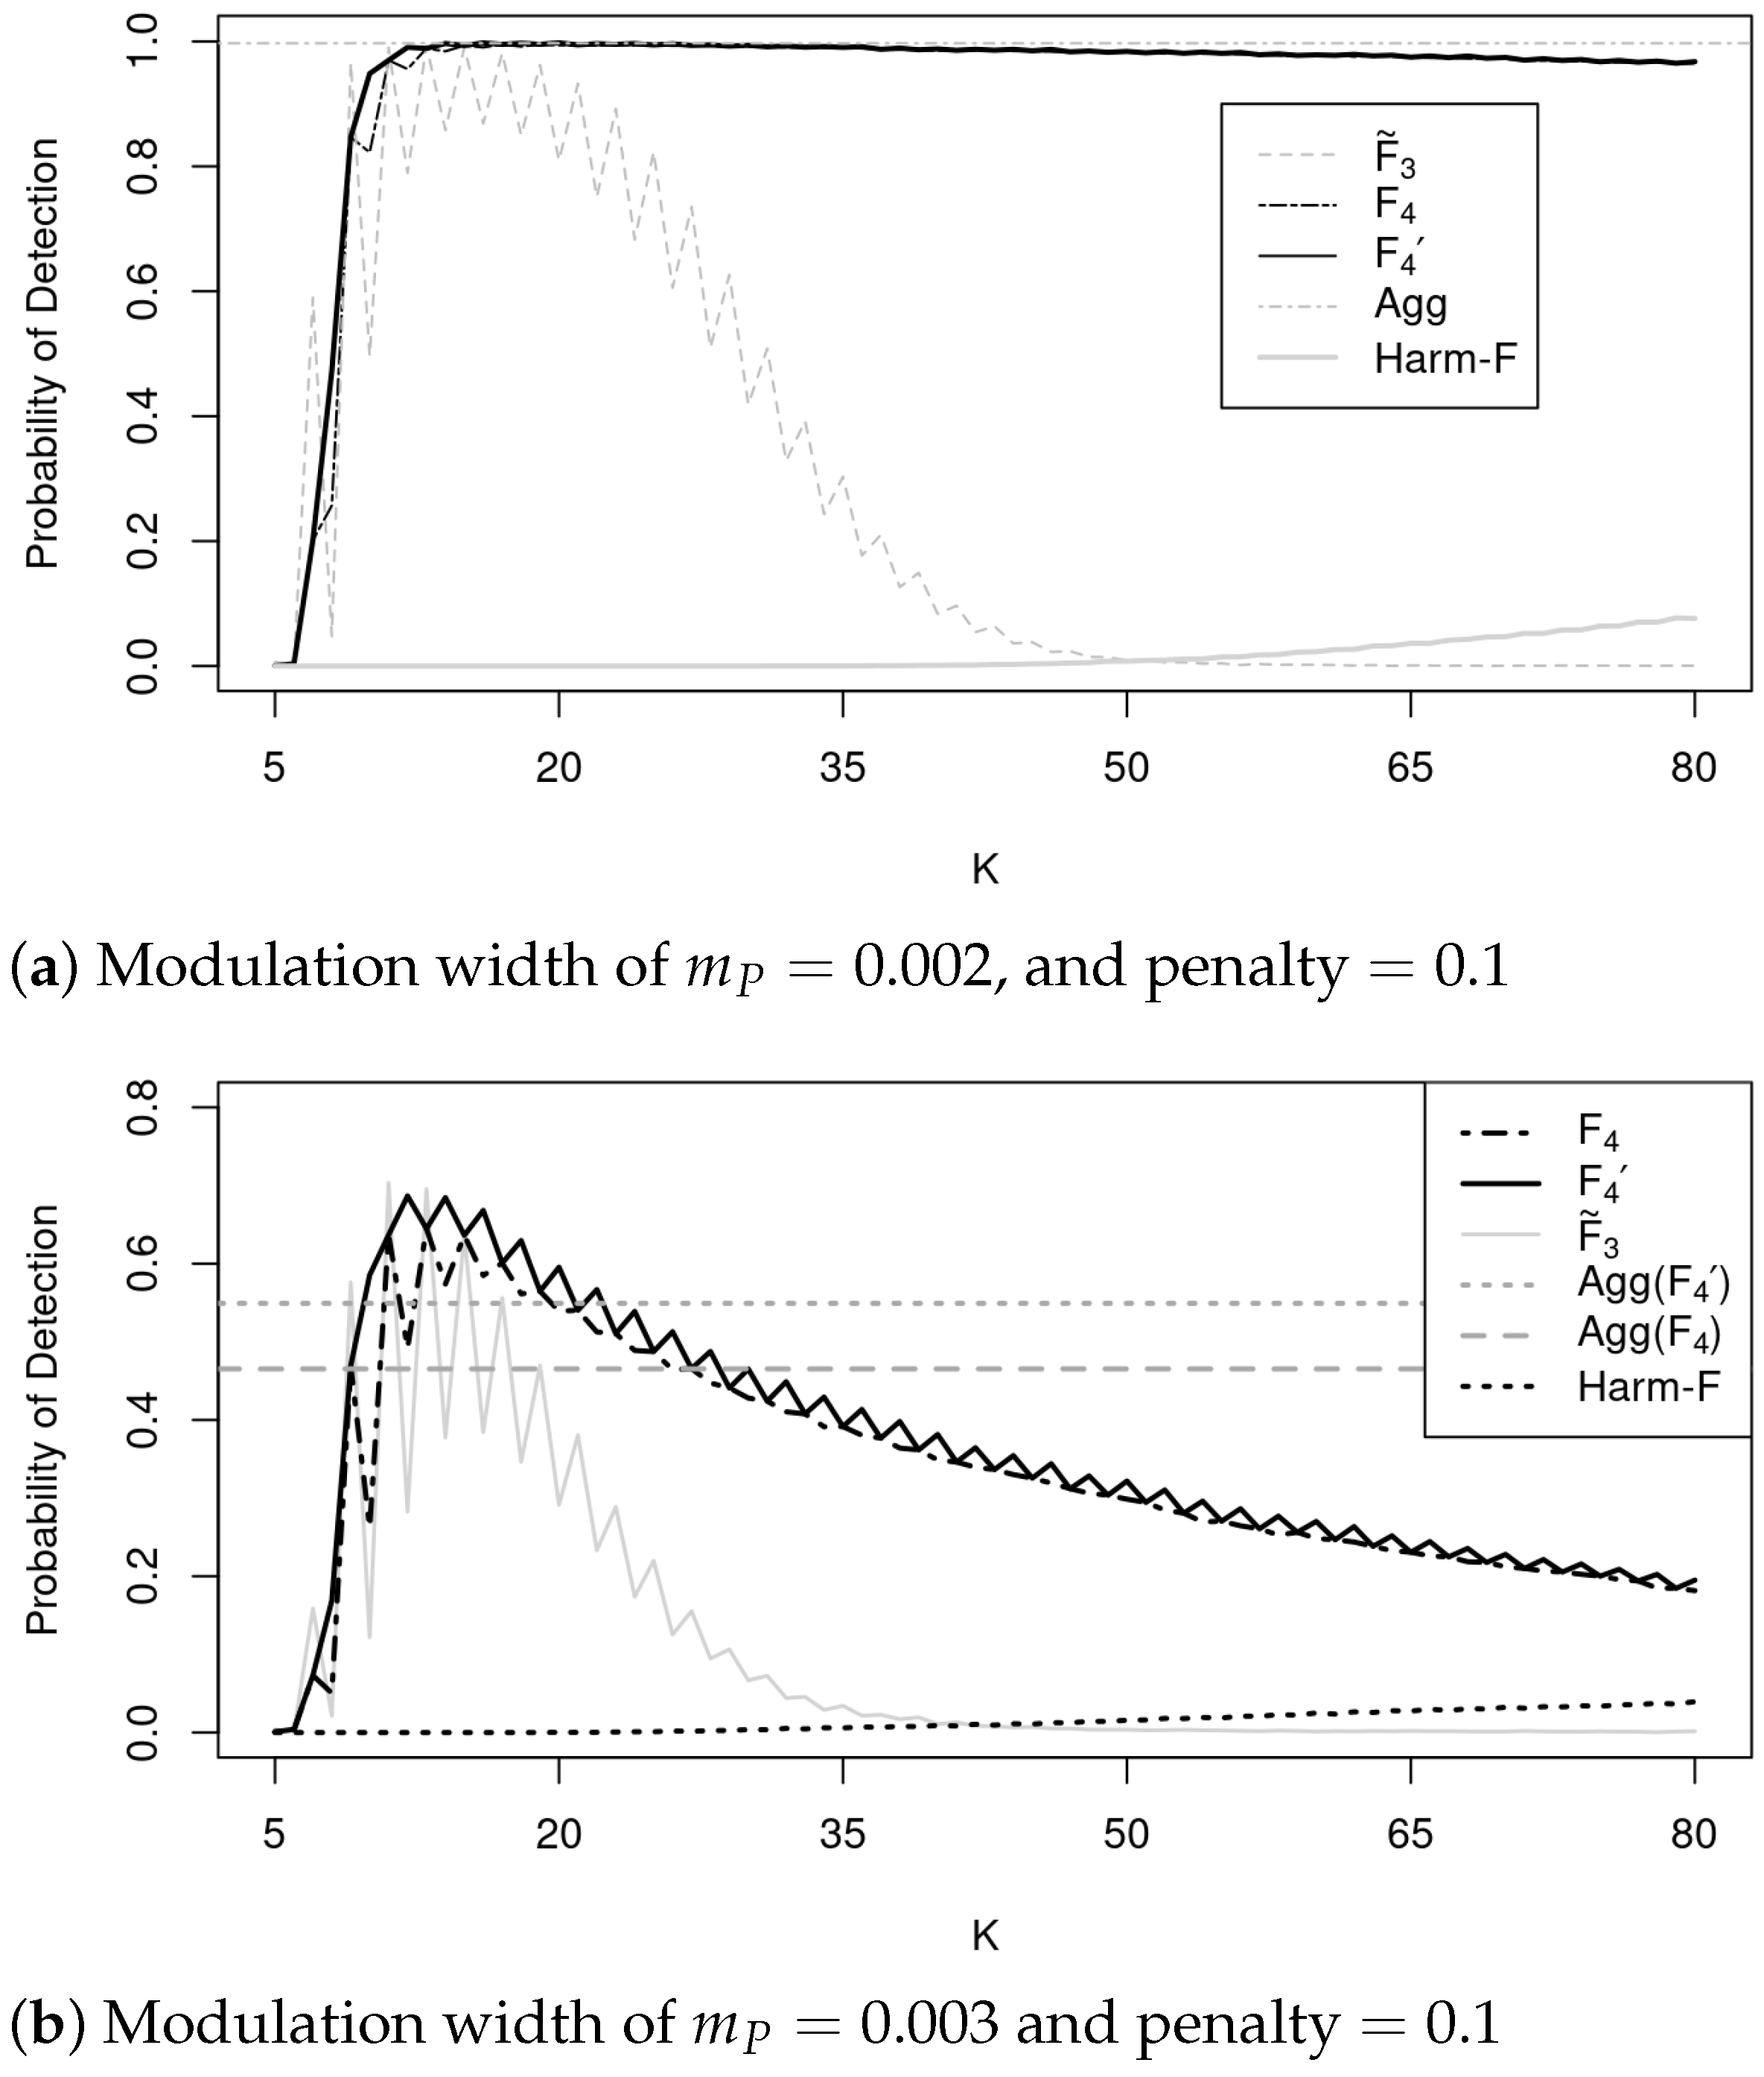
We consider two simulations under different types of noise and modulation bandwidths. First, Figure 3a, where the and tests perform at high levels for any K above 10. One can observe that the Aggregate test preforms strongly, in addition to not having to choose K, like in the and tests, which causes varied performance depending on the choice of K. Observing Figure 3b, the updated Aggregate test using has a large increase in detection probability compared to the Aggregate test in [7]. The Gumbel noise does cause a decrease in detection probability, although the test is still higher for a wide range of tapers. We believe the smaller probability of detection for the Aggregate test is due to the lower detection probability in the tests for higher K. In both figures, the Harmonic F-test is essentially unusable-for-purpose.
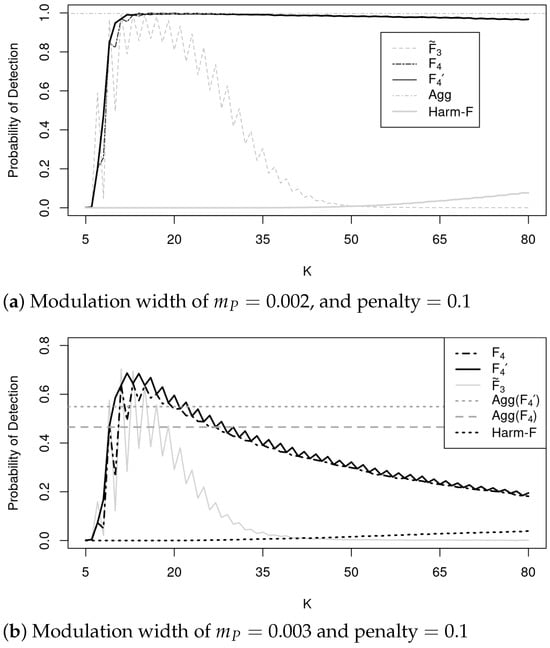
Figure 3.
With , 10,000 simulations of (Equation (1)) with amplitude 0.5, frequency 0.1, . was created using Gaussian white noise for (a) and for (b) was from an , with innovations from a zero mean Gumbel distribution.
5. SoHO GOLF Satellite Data Study
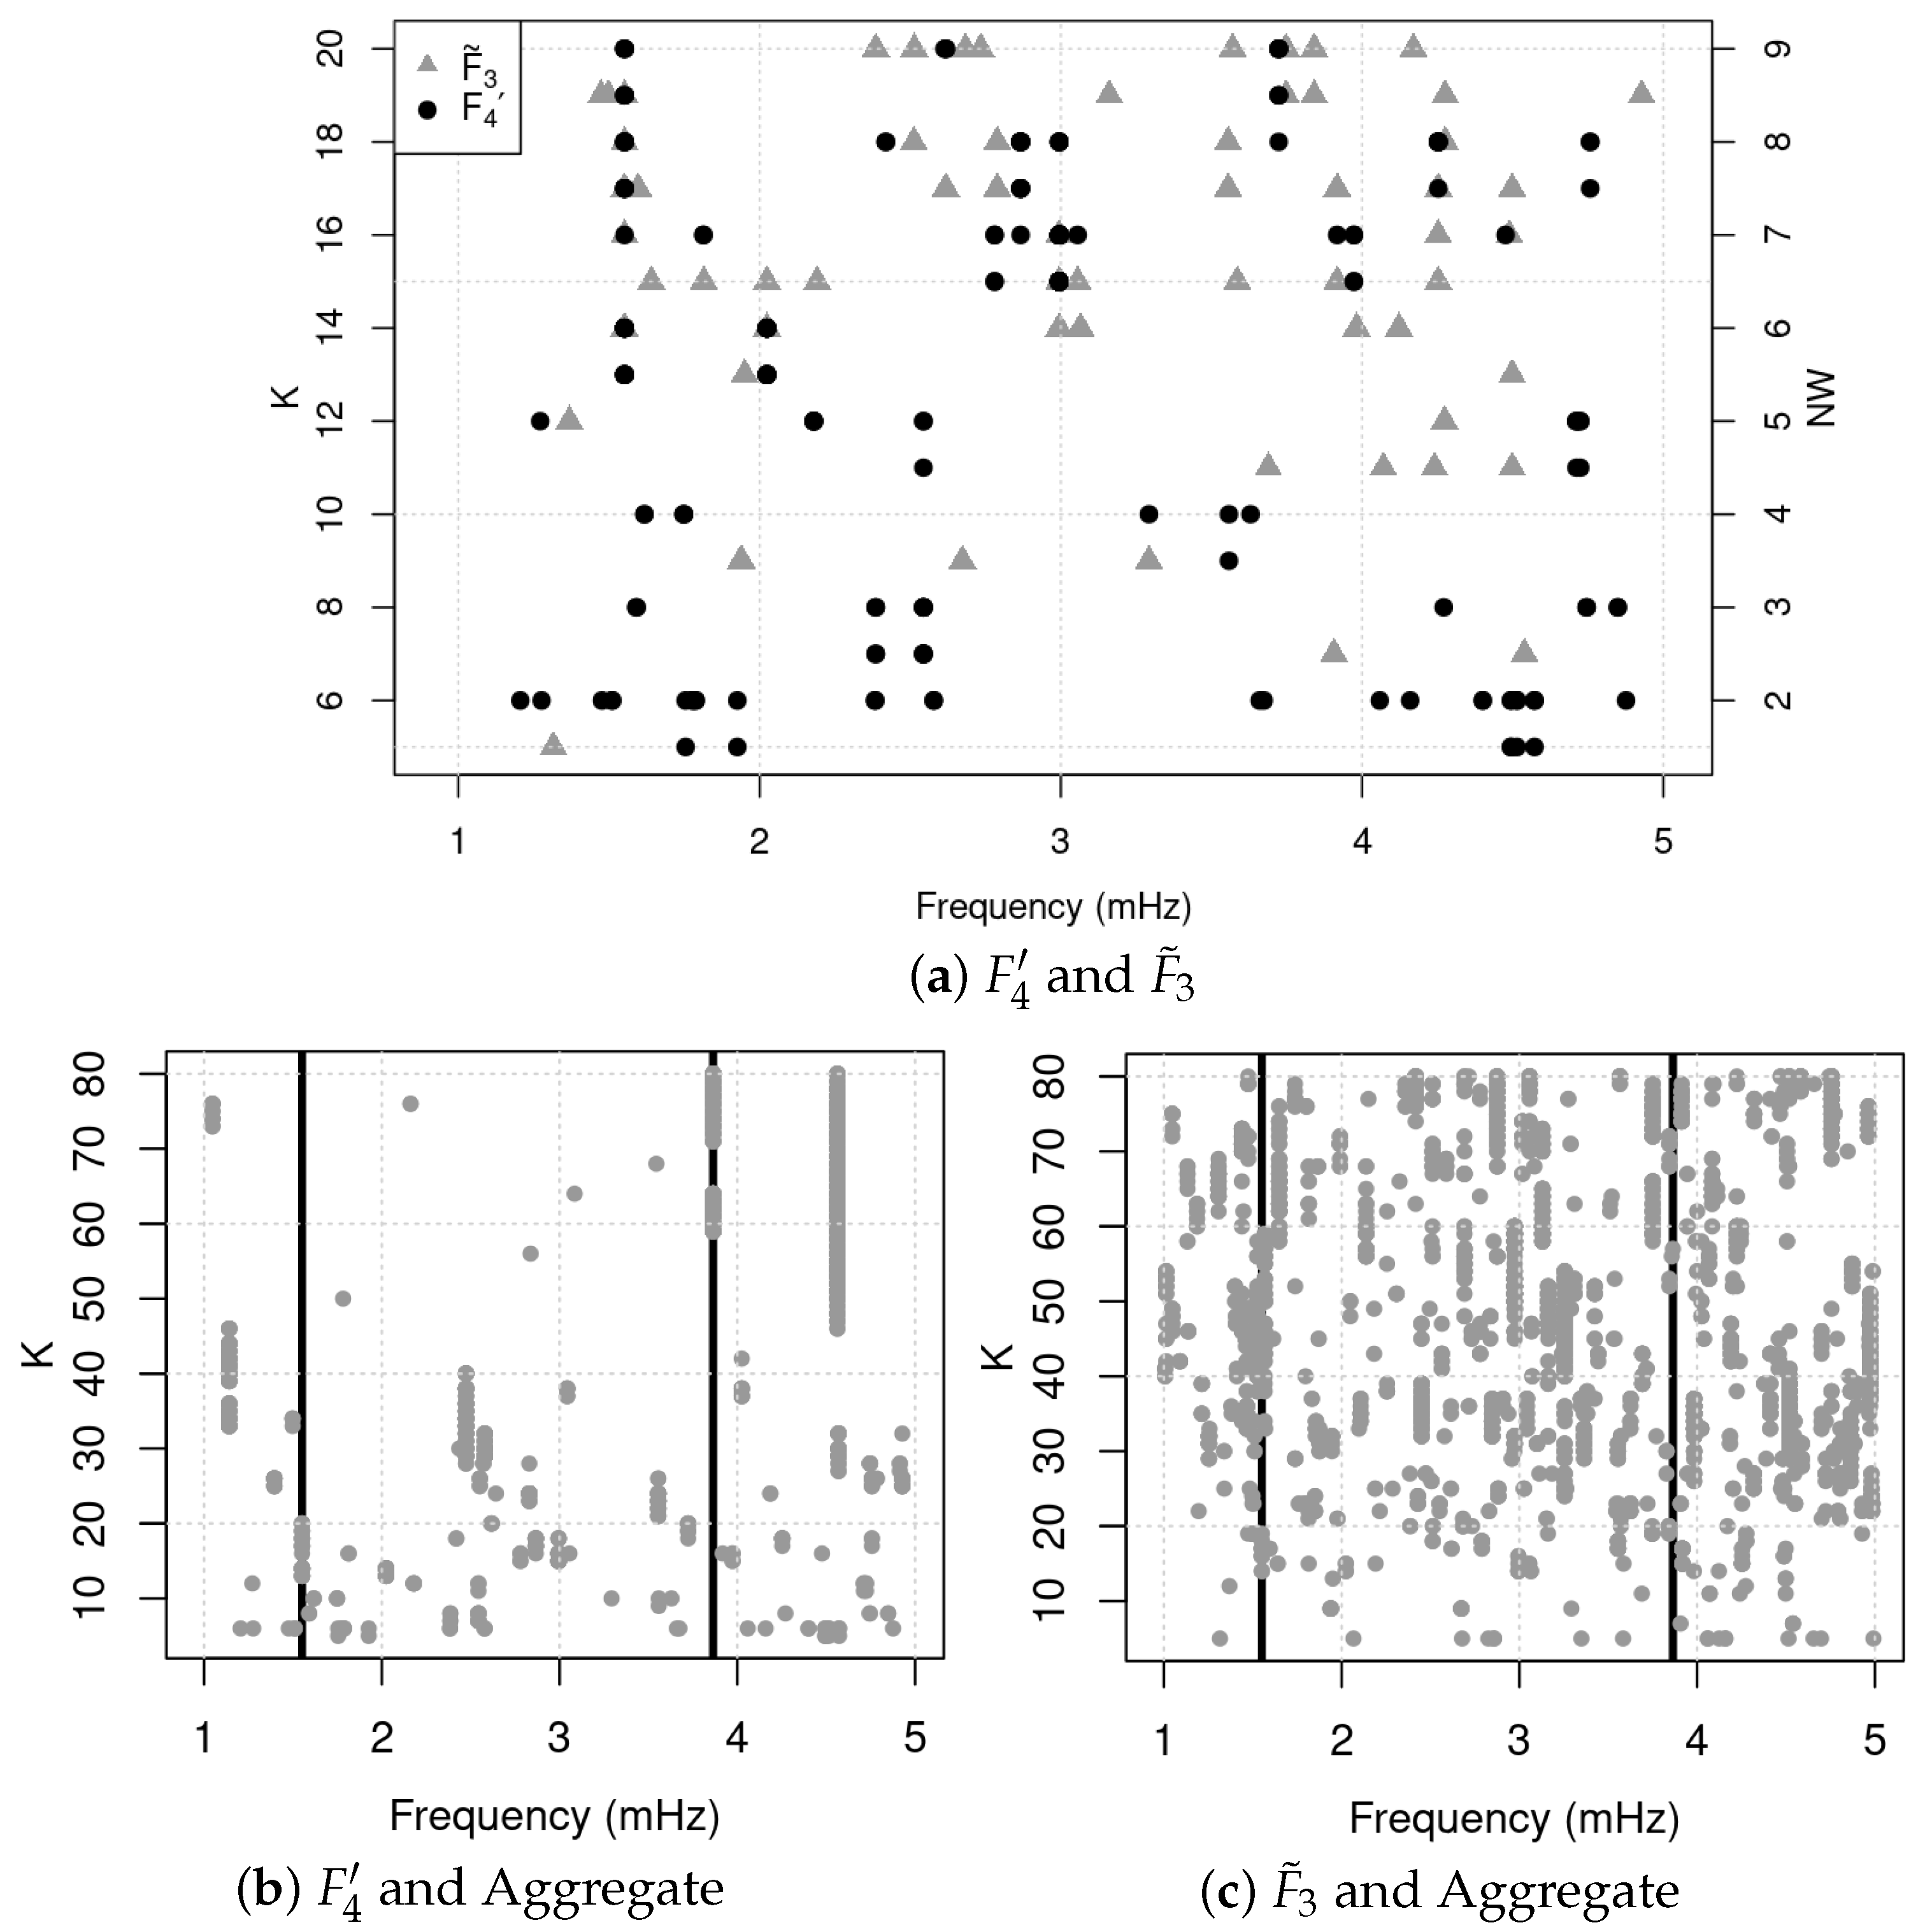
In order to examine the functionality of and the Aggregate test in real-world data, we examined our new test statistics in comparison to from [12]. These test statistics were applied to a one-year time series obtained by the Solar and Heliospheric Observatory, Global Oscillations at Low Frequencies (SoHO GOLF) instrument [13]. The data were pre-processed using the identical 5:1 decimation filter and high pass filter as [9], to ensure consistency in the results found. Figure 4a, which shows plotted on top of , demonstrates an increased number of significant frequencies for , which were not found with . Both test statistics detect a significant frequency around mHz, but fails to detect a significant frequency around mHz, and overall agreement is poor. One explanation can be found in Figure 4b,c: notice that for higher numbers of tapers, the test reduces the number of detections, but for the frequencies that are significant, they are consistent across many choices of tapers. is arguably more inconsistent across the tapers. If the modulation contained in the time series is slow, we would expect to only detect for high K, which is where the has a poor detection rate as seen in Figure 1. Also, we see that the Aggregate test only detects two significant frequencies. We believe that this is mainly due to the distribution upper bound being still too high. Through simulation, it was found to have a Type I error rate of , when it should be .
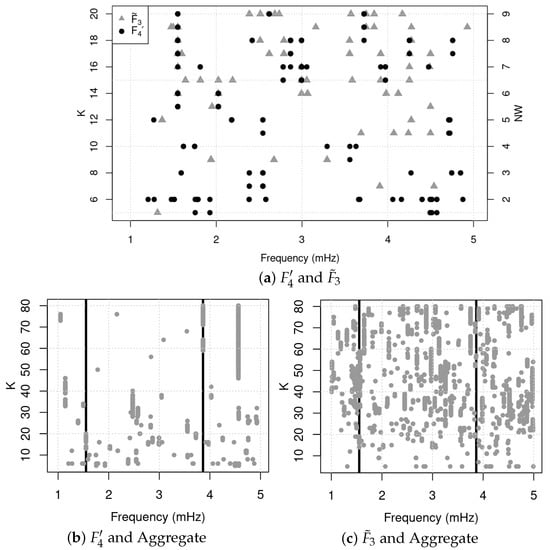
Figure 4.
(a) SoHO GOLF significant frequencies for in black and in gray at . (b) Expanded range of tapers for with Aggregate test results in black lines overlaid. (c) Expanded range of tapers for with Aggregate test results in black lines overlaid.
6. Conclusions
A new F-test was introduced, which increases the detection probability for even numbers of tapers. In addition, the Aggregate test has been improved through the use of the new statistic instead of the previous statistic. By introducing an upper bound for the Aggregate test distribution, the test has been improved. Through simulation, we have shown the increase in performance of these two tests. The new tests were also demonstrated on the SoHO GOLF time series, a previously used series, allowing for comparison of real-world frequency detections.
Author Contributions
Conceptualization, G.T. and W.S.B.; methodology, all; software, B.O.; resources, W.S.B. and G.T.; writing–original draft preparation, B.O.; writing–review and editing, all; supervision, G.T. and W.S.B. All authors have read and agreed to the published version of the manuscript.
Funding
Wesley Burr gratefully acknowledges funding from the National Science and Engineering Research Council, NSERC, Canada, grants RGPIN-2017-04741 and RGPIN-2024-04420. Glen Takahara similarly acknowledges NSERC grant RGPIN-2019-06751.
Institutional Review Board Statement
Not applicable.
Informed Consent Statement
Not applicable.
Data Availability Statement
No data was used, or created, for this study. The code for the simulations is available by request.
Conflicts of Interest
The authors declare no conflicts of interest.
References
- García, R.; Jiménez, A.; Mathur, S.; Ballot, J.; Eff-Darwich, A.; Jiménez-Reyes, S.; Pallé, P.; Provost, J.; Turck-Chièze, S. Update on g-mode research. Astron. Nachrichten Astron. Notes 2008, 329, 476–484. [Google Scholar] [CrossRef]
- Gloersen, P.; Huang, N. Comparison of interannual intrinsic modes in hemispheric sea ice covers and other geophysical parameters. IEEE Trans. Geosci. Remote Sens. 2003, 41, 1062–1074. [Google Scholar] [CrossRef]
- Guillaumin, A.P.; Sykulski, A.M.; Olhede, S.C.; Early, J.J.; Lilly, J.M. Analysis of non-stationary modulated time series with applications to oceanographic surface flow measurements. J. Time Ser. Anal. 2017, 38, 668–710. [Google Scholar] [CrossRef]
- Thomson, D.J. Spectra of MDI magnetograms. In Proceedings of the SOHO 14/GONG 2004 Workshop (ESA SP-559). Helio-and Asteroseismology: Towards a Golden Future, New Haven, CT, USA, 12–16 July 2004; Danesy, D., Ed.; Volume 559, p. 91. [Google Scholar]
- Schuster, A. On the investigation of hidden periodicities with application to a supposed 26 day period of meteorological phenonema. Terr. Magn. 1898, 3, 13–41. [Google Scholar]
- Thomson, D.J. Spectrum Estimation and Harmonic Analysis. Proc. IEEE 1982, 70, 1055–1096. [Google Scholar] [CrossRef]
- Ott, B.; Burr, W.S.; Takahara, G. An aggregate test for polynomial frequency modulation using multitaper methods. In Proceedings of the 64th ISI World Statistics Congress, Ottawa, ON, Canada, 12–16 July 2023; pp. 1–5. [Google Scholar]
- Ott, B. F-Tests for Frequency Modulated Time Series Using Multitaper Methods. Master’s Thesis, Queen’s University, Kingston, ON, Canada, 2023. [Google Scholar]
- Blanchette, K.; Burr, W.S.; Takahara, G. An F-test for polynomial frequency modulation. In Proceedings of the ICASSP, IEEE International Conference on Acoustics, Speech and Signal Processing—Proceedings, Toronto, ON, Canada, 6–11 June 2021; pp. 5010–5014. [Google Scholar] [CrossRef]
- Riedel, K.S.; Sidorenko, A. Minimum bias multiple taper spectral estimation. IEEE Trans. Signal Process. 1995, 43, 188–195. [Google Scholar] [CrossRef]
- Thomson, D.J. Inverse-constrained projection filters. In Proceedings of the Wavelets: Applications in Signal and Image Processing IX, San Diego, CA, USA, 30 July–1 August 2001; Volume 4478, pp. 172–183. [Google Scholar]
- Blanchette, K. Multitaper Statistical Tests for the Detection of Frequency-Modulated Signals. Master’s Thesis, Queen’s University, Kingston, ON, Canada, 2020. [Google Scholar]
- Boumier, P. GOLF SoHO: How to Access GOLF Data. Available online: https://www.ias.u-psud.fr/golf/templates/access.html (accessed on 8 May 2012).

Disclaimer/Publisher’s Note: The statements, opinions and data contained in all publications are solely those of the individual author(s) and contributor(s) and not of MDPI and/or the editor(s). MDPI and/or the editor(s) disclaim responsibility for any injury to people or property resulting from any ideas, methods, instructions or products referred to in the content. |
© 2024 by the authors. Licensee MDPI, Basel, Switzerland. This article is an open access article distributed under the terms and conditions of the Creative Commons Attribution (CC BY) license (https://creativecommons.org/licenses/by/4.0/).