Skip to Content
Engineering ProceedingsEngineering Proceedings
  • Proceeding Paper
  • Open Access

25 September 2023

Estimation of Technical Losses on Transmission Systems Using a Neural Network Prognosis Algorithm (NNPA) †

,
and
Department of Electrical Engineering, NED University of Engineering and Technology, Karachi 75270, Pakistan
*
Author to whom correspondence should be addressed.
Presented at the 8th International Electrical Engineering Conference, Karachi, Pakistan, 25–26 August 2023.

Abstract

Technical losses in transmission systems are crucial for short-term planning and decision-making, particularly in complex systems. Traditional deterministic methods like Newton–Raphson prove ineffective in handling systems with a large number of buses and intricate topologies. Consequently, there is a growing interest in employing heuristic and intelligent algorithms to achieve faster and more accurate technical loss estimations. This paper introduces the Neural Network Prognosis Algorithm (NNPA), a simple and robust technique that exclusively relies on technical parameters derived from a Newton–Raphson-based load flow analysis, specifically active and reactive power, for 22 buses. The algorithm demonstrates promising progress, exhibiting notable convergence toward the desired mean squared error and achieving a commendable correlation coefficient of 0.999. Despite incorporating randomized data points with Gaussian noise, the algorithm’s results present compelling evidence of its effectiveness and validation.

1. Introduction

Transmission system power losses in Pakistan have been a significant concern since 2010. According to reports from the World Bank and the International Energy Agency (IEA), transmission losses were reduced by five percent of the overall output capacity from 2008 to 2014 [1]. These changes will not only affect the overall capacity but also the distribution of losses across the system’s buses. Therefore, it is crucial to have advanced estimation and predictive tools for forecasting short-term technical distribution losses in the transmission system. Such predictive analyses can aid in load dispatch planning and identifying lossy circuit segments for long-term design diagnostics.
Transmission losses can be categorized as either non- technical losses or technical losses. Non-technical losses stem from factors unrelated to the operation, design, and planning of the system. Non-technical losses may arise from activities such as electricity theft, inefficient or faulty energy meters, meter tampering, and errors in accounting and energy data handling. Predicting non-technical errors in the transmission system is difficult due to their nonlinear nature and volatility. A. Y Kharal et al. have proposed an insightful method for identifying non-technical losses in developing countries [2].
On the other hand, technical losses in the transmission system are caused by inadequate operation, design, and planning [3,4]. These issues can result in problems with lines, joints, distribution transformers, cable connections, and termination. For example, poor design choices can lead to technical losses such as frequent high-impedance faults and unnecessary use of fuses [5]. Traditional methods, such as Newton–Raphson, Gauss-Seidel, and Fast Decoupled have been commonly used to calculate technical transmission losses. However, these deterministic approaches are computationally expensive when considering multiple future scenarios, particularly for such a prognosis [6].

3. Proposed Methodology

The proposed methodology primarily aims to address the weaknesses identified in previous studies [17,18], and it introduces improvements in four fundamental areas. Firstly, unlike the existing literature, the proposed methodology selects training data based solely on technical parameters. Secondly, a multivariate neural network-based approach was introduced to address the curse of dimensionality. Thirdly, Gaussian noise is introduced to the non-exact power flow values, which enables testing the robustness of the proposed methodology under real-world conditions. Lastly, the methodology improves upon previous techniques [17] by introducing randomized load variation cases.

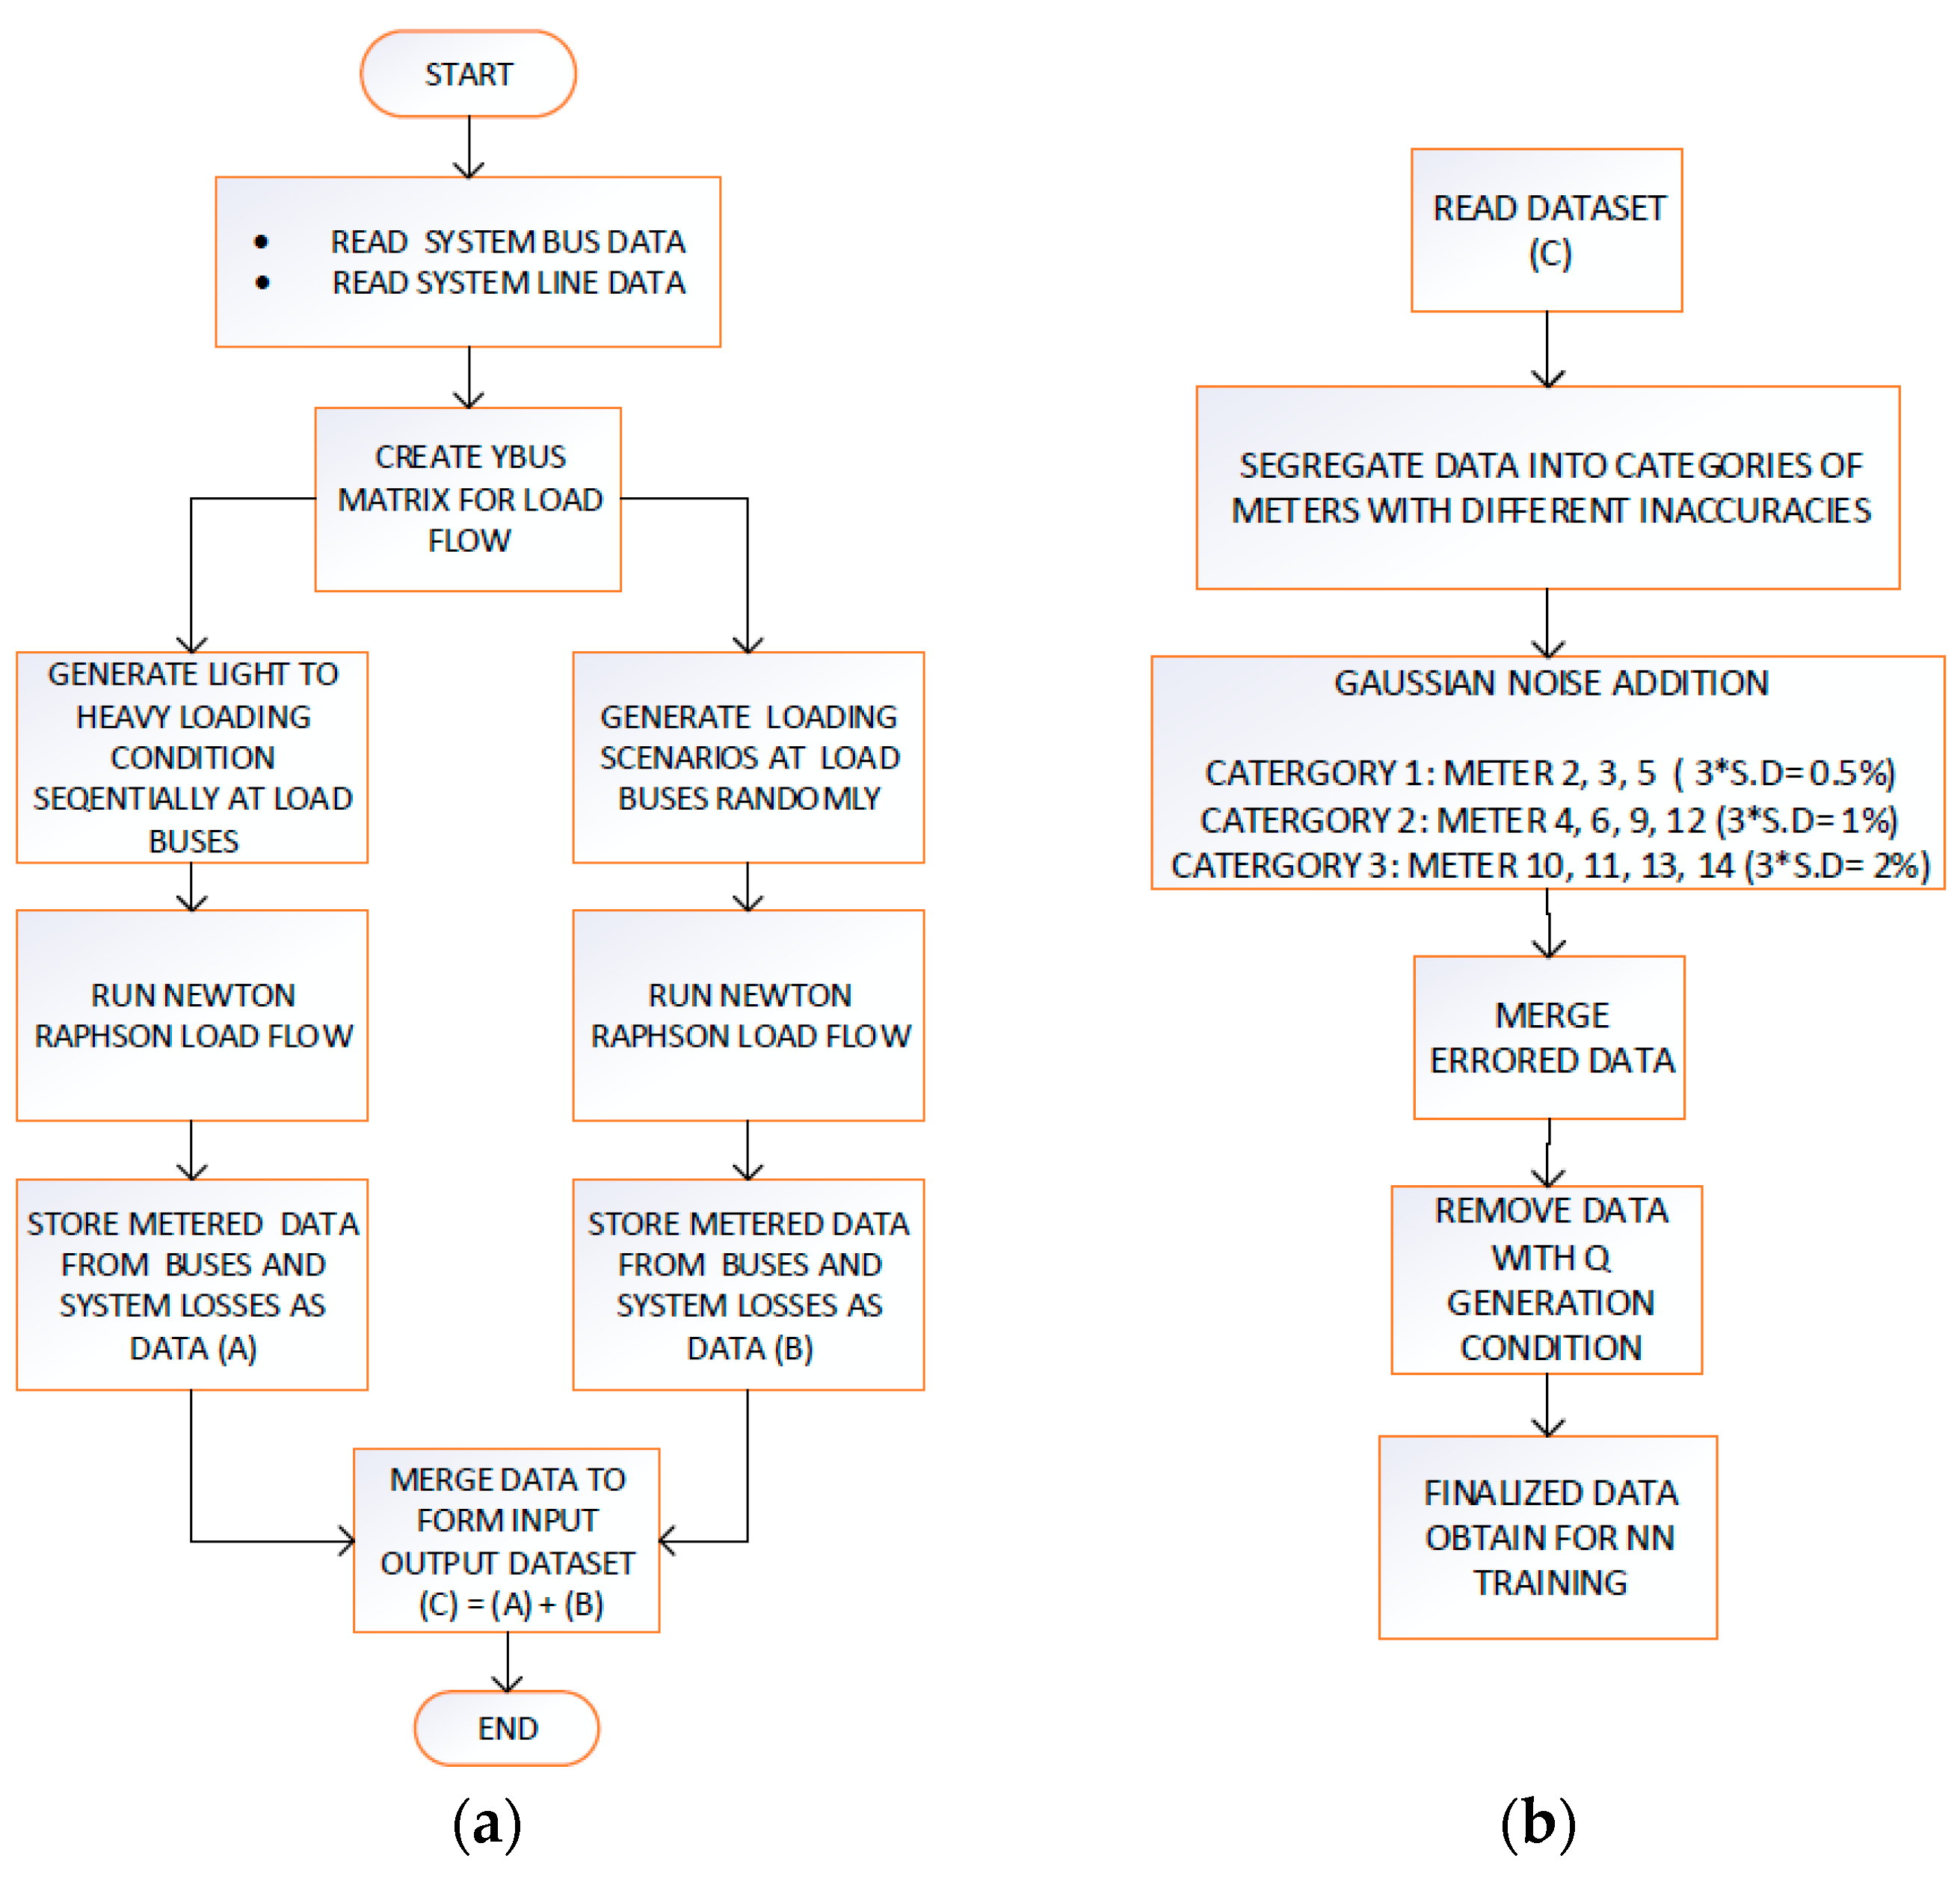
3.1. Test Case Simulations, Data Preprocessing, and Gaussian Noise Augmentation

The successful execution of the test case simulation for prognosis necessitated the utilization of a dependable dataset, which could be effectively employed alongside our algorithm based on neural networks for predicting power loss. To achieve this, we conducted a comprehensive analysis using a modified IEEE 14 bus system, employing the classical Newton–Raphson Technique (NRT) within the MATLAB (R2020a) environment for a power flow assessment.
To commence the load flow analysis utilizing the NRT, we initialized the Y-bus matrix by incorporating the line and bus data derived from the modified IEEE 14 bus system. This Y-bus matrix, which is crucial for load flow analysis, was developed to accommodate two distinct scenarios: varying from lightly to highly loaded conditions, as well as randomly loaded conditions, as shown in Figure 1a. In the case of the former scenario, the load conditions of the original Y-bus matrix were systematically adjusted from 10% to 120% with a step size of 0.25%, generating a dataset. Randomization samples were developed 10 times in number from a lightly loaded to a heavily loaded condition, as the probability of occurrence is for sure high. The cumulative dataset, encompassing both gradual and random variations, was subsequently consolidated for further analysis.
Figure 1. The schematic process flow diagram for the proposed methodology; (a) data preprocessing and batch selection; (b) Gaussian noise addition to the system.
In order to ensure data integrity, we conducted a meticulous data cleaning process, wherein null values and outlier conditions. As a result, a total of 12,383 samples were retained for subsequent analysis. Gaussian noise, characterized by different standard deviations ranging from 0.5% to 2%, was introduced randomly to the buses, as visually depicted in Figure 1b. This meticulous treatment of the cleaned dataset resulted in a manifestation of data that accurately reflects real-world conditions and could be effectively utilized in conjunction with NNPA for subsequent analysis and modeling.

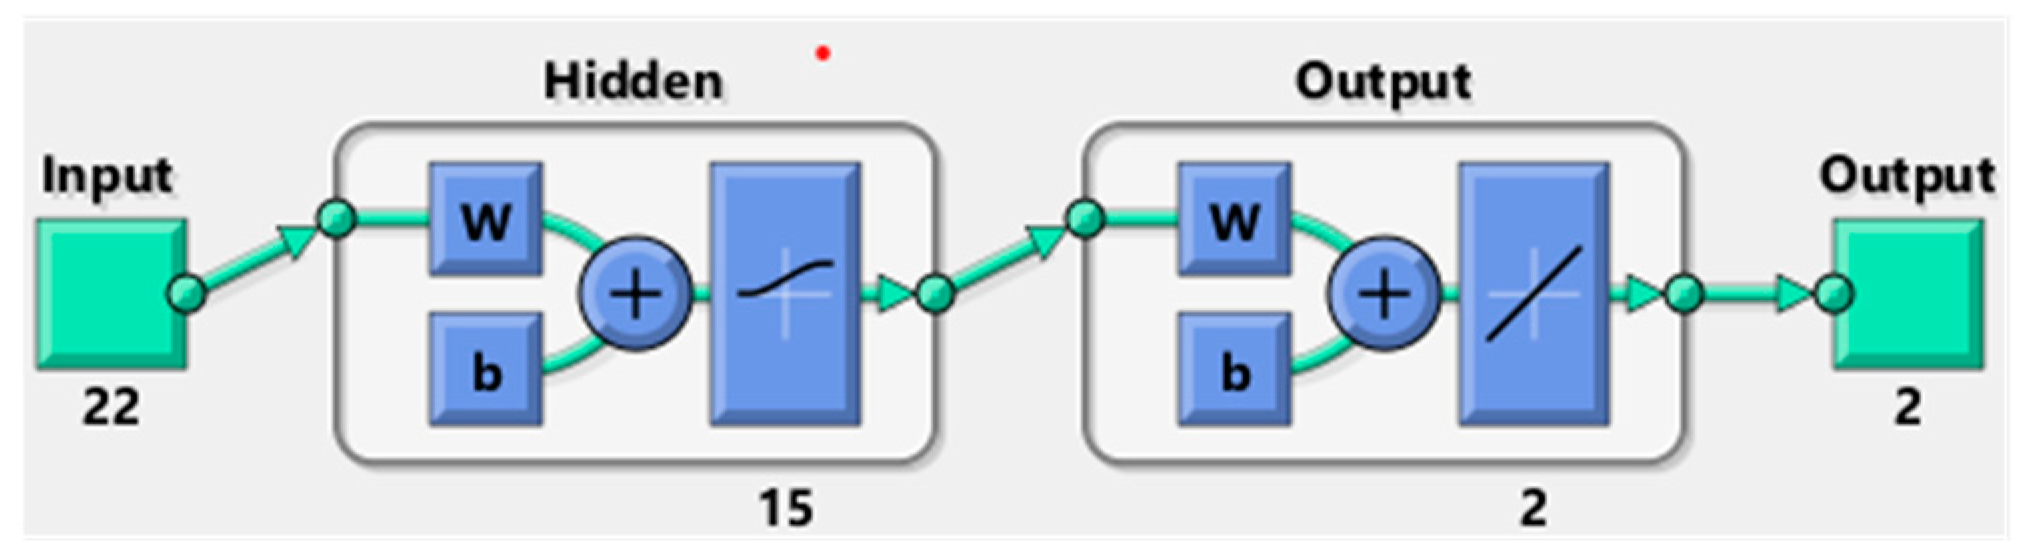
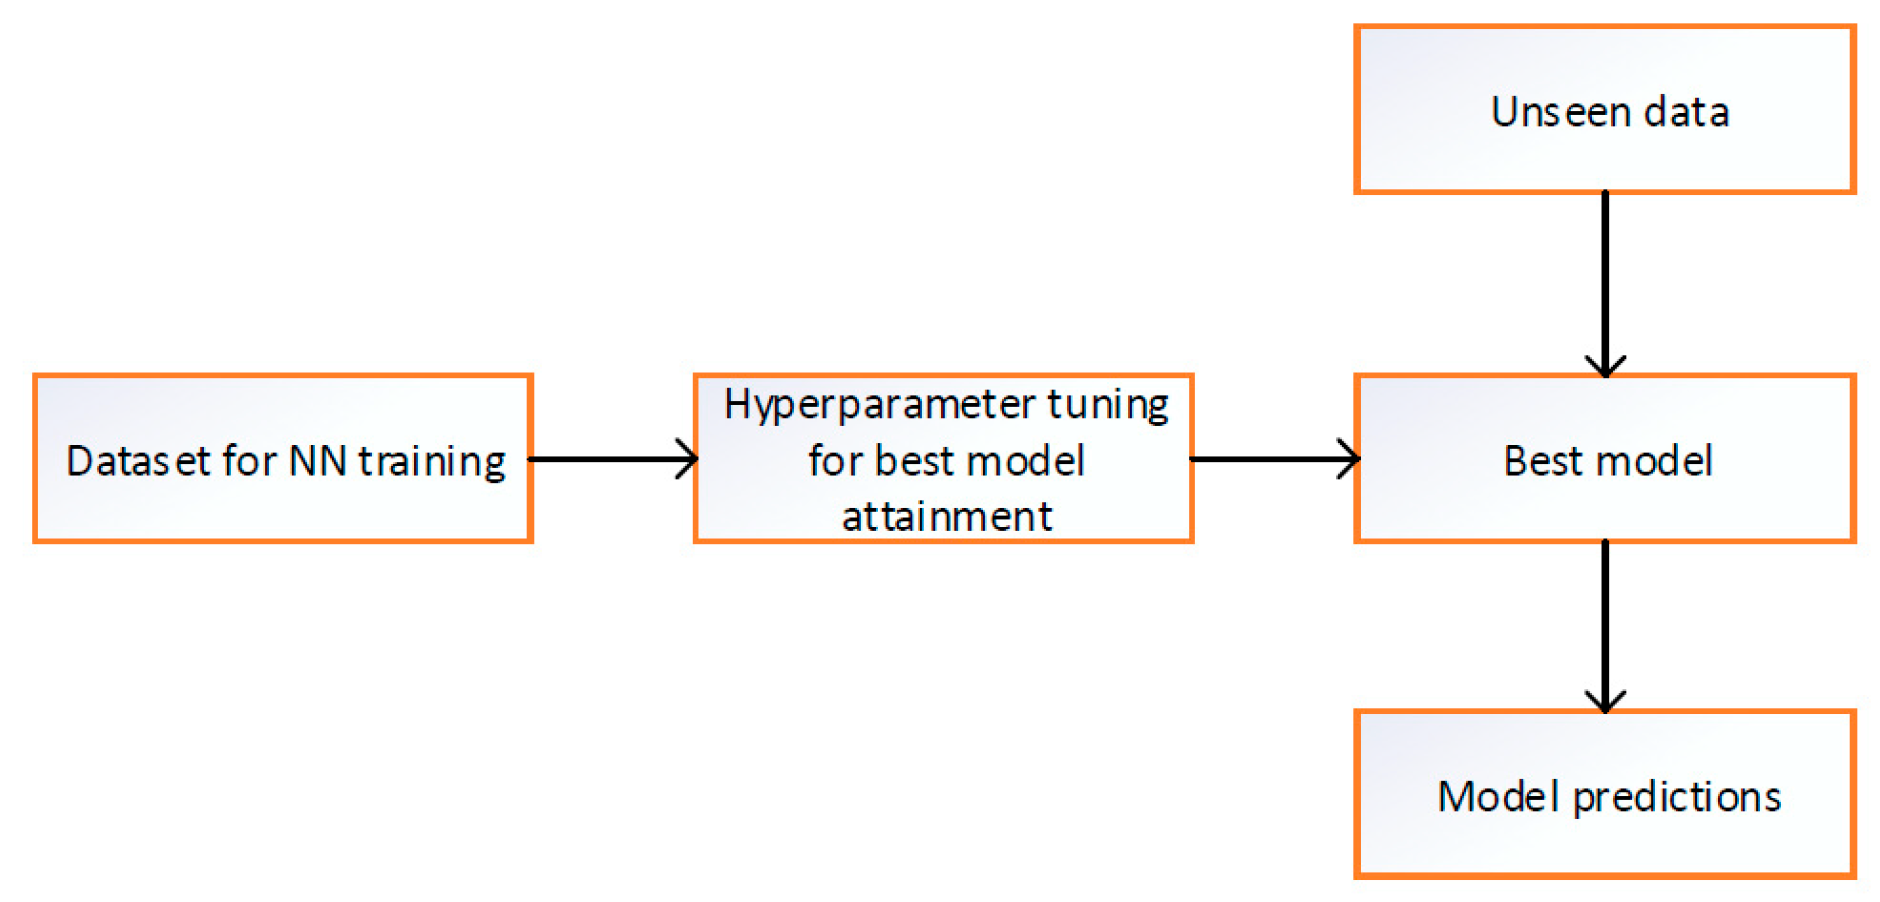
3.2. Multivariate Prediction Using Neural Network

The NNPA used for this prognosis was designed in MATLAB. It consists of 22 input features with a single dense layer of 15 neurons mapped against 2 outputs, as shown in Figure 2. Each neuron was trained and tested using logistic sigmoid-based multivariate regression. Logistic sigmoid functions are well-suited for scattered datasets where mean normalization is crucial for data quality. The Levenberg–Marquardt backpropagation algorithm, often implemented as the ‘trainlm’ function in MATLAB, was employed as the optimization function to fine-tune the weights and achieve convergence of the mean square error (MSE) to the order of 10−5.
Figure 2. Architecture of NNPA showing 22 input classes mapped against 2 predicted classes by means of a 15-neuron base single dense layer.
The methodology of the NNPA was designed with careful consideration. Firstly, the cleaned dataset was divided into batches for training. Hyper-parameterization was then performed to determine the optimal number of neurons in the dense layer, as depicted in Figure 3. The dataset was split into training, testing, and validation batches in proportions of 80%, 10%, and 10%, respectively. Over 500 epochs, simulations were conducted using different ranges and portion sizes of the dataset to find the optimal number of neurons. Based on the results, 15 neurons were chosen to yield optimal results with the least MSE. The best testing and validation outcomes for the NNPA were recorded at 498 epochs, surpassing the desired MSE threshold, as illustrated in Figure 4.
Figure 3. Process flow diagram training and validation.
Figure 4. Training and validation results for NNPA over 500 epochs.

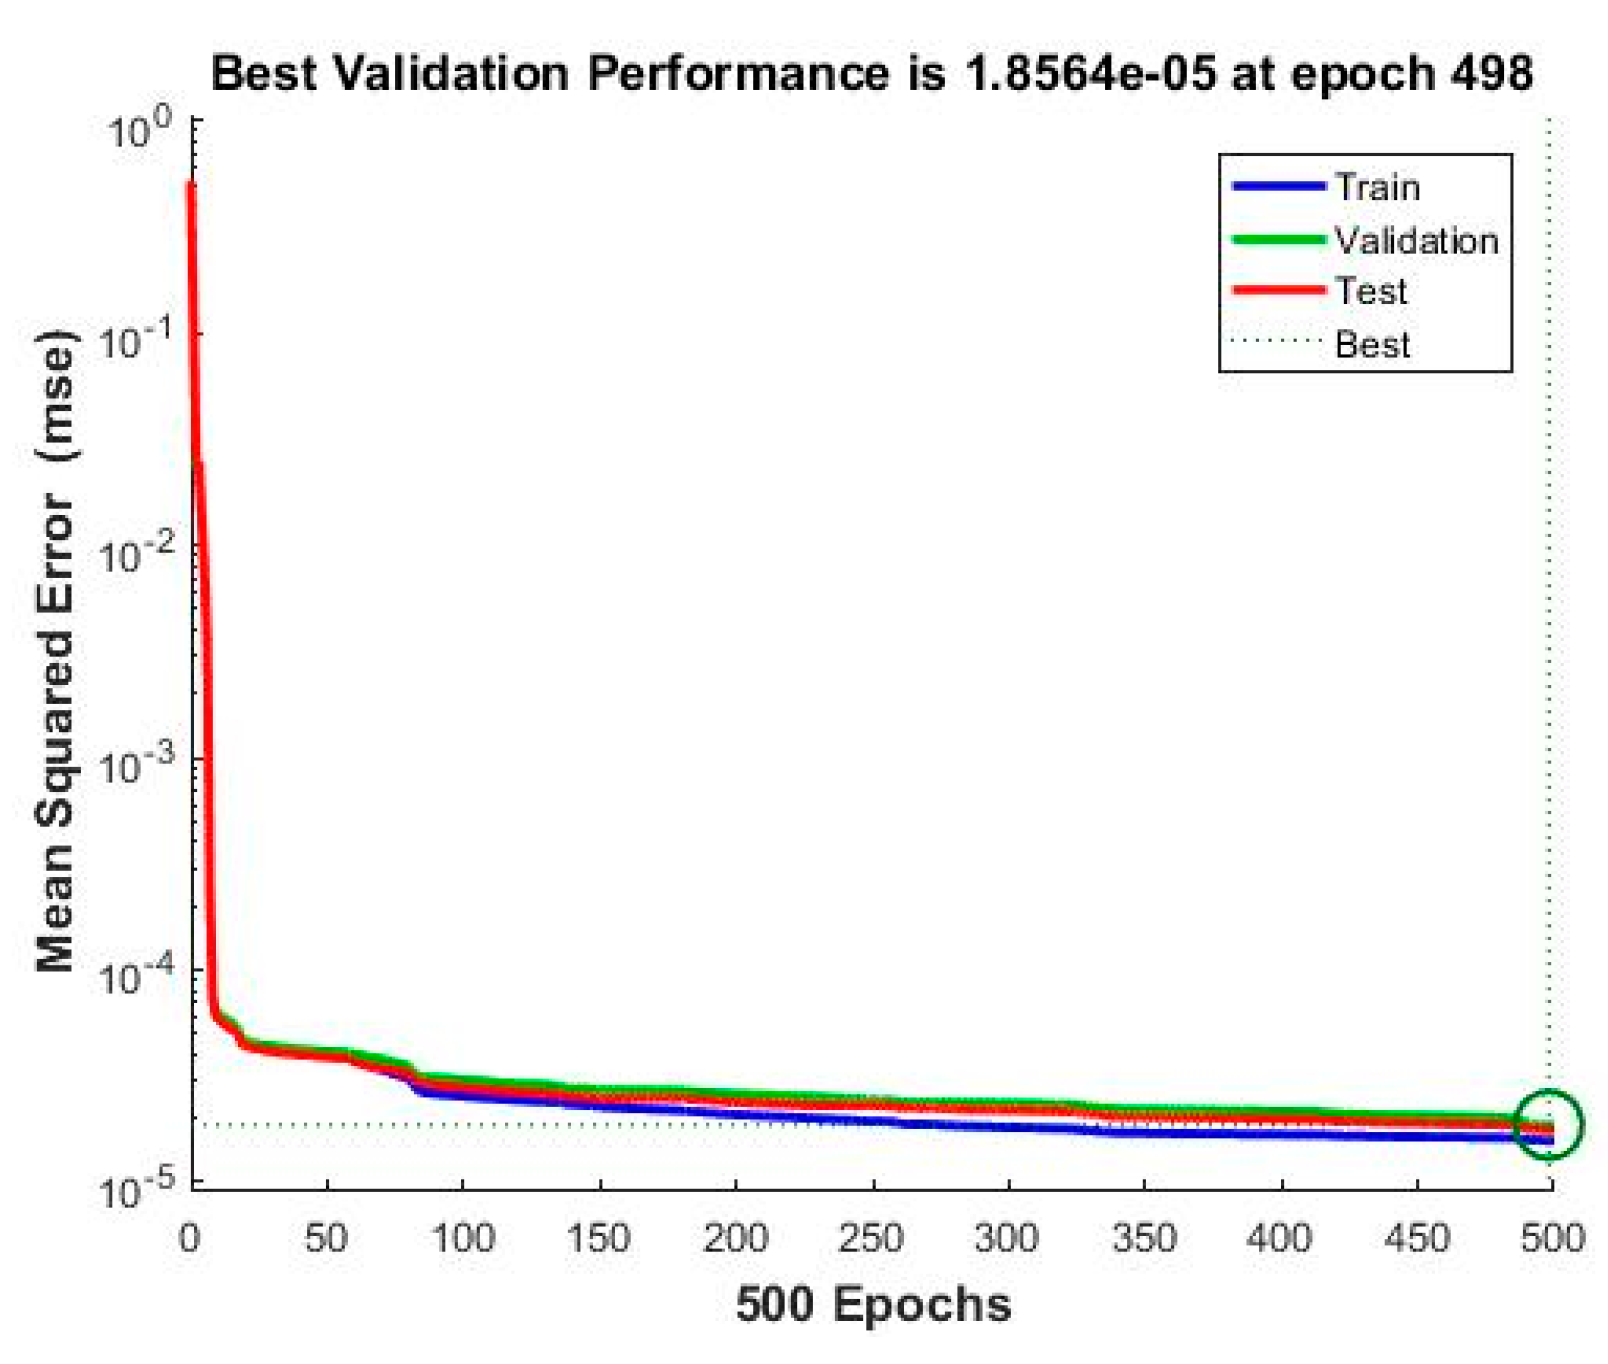
4. Validation of Results and Discussion

In Figure 5, the target fitting for both the testing and validation data is depicted. The algorithm demonstrates a strong fit to the training dataset, as indicated by an average R-score of 0.999 for both sets. Although the inclusion of Gaussian noise has some impact on the fitting, it is not significant. The combination of two different simulated cases, involving sequentially rising loading at buses and randomized loading at the buses, poses a challenging scenario for cross-validation. Nevertheless, the NNPA shows promising performance in this complex setting.
Figure 5. Testing and validation curve fitting to the training dataset.

5. Conclusions

The proposed algorithm shows encouraging progress with notable convergence toward the desired mean squared error, achieving a commendable R-factor of 0.999. Despite the incorporation of randomized data points with Gaussian noise, the results obtained from the algorithm serve as promising indicators of its effectiveness and validation. Notably, the proposed technique distinguishes itself from existing literature by offering several noteworthy features. Firstly, it exclusively employs technical learning parameters for predicting technical losses, ensuring a comprehensive technical focus. Additionally, the algorithm incorporates a multivariate scheme by incorporating randomized and sequential load variations. These findings highlight the algorithm’s robust performance in overcoming the challenges posed by the presence of randomized data and noise, reinforcing its credibility and potential for practical applications.

Author Contributions

Conceptualization S.S.; Methodology S.S.; Sofware S.S. and A.A.; writing-original draft preparation S.S. and A.A.; writing—review and editing, M.M.A.; supervision M.M.A. All authors have read and agreed to the published version of the manuscript.

Funding

This research received no external funding.

Institutional Review Board Statement

Not applicable.

Data Availability Statement

Can be provided via email contact.

Conflicts of Interest

The authors declare no conflict of interest.

References

  1. World Bank Open Data. Electric Power Transmission and Distribution Losses (% of Output)—Pakistan. Available online: https://data.worldbank.org/indicator/EG.ELC.LOSS.ZS?end=2014&locations=PK&start=1988 (accessed on 20 May 2023).
  2. Kharal; Yousaf, A.; Khalid, H.A.; Gastli, A.; Guerrero, J.M. A novel features-based multivariate Gaussian distribution method for the fraudulent consumers detection in the power utilities of developing countries. IEEE Access 2021, 9, 81057–81067. [Google Scholar] [CrossRef]
  3. Tanveer, A. Non-technical loss analysis and prevention using smart meters. Renew. Sustain. Energy Rev. 2017, 72, 573–589. [Google Scholar]
  4. Paria, J.; Arianpoo, N.; Leung, V.C.M. Electricity theft detection in AMI using customers’ consumption patterns. IEEE Trans. Smart Grid 2015, 7, 216–226. [Google Scholar]
  5. Amadi, H.N.; Okafor, E.N.C. The effects of technical and non-technical losses on power outages in Nigeria. Int. J. Sci. Eng. Res. 2015, 6, 45–49. [Google Scholar]
  6. Mohamed, E.; Kamel, S.; Jurado, F. Optimal power flow using recent optimization techniques. In Classical and Recent Aspects of Power System Optimization; Academic Press: Cambridge, MA, USA, 2018; pp. 157–183. [Google Scholar]
  7. Tomáš, N.; Benešová, Z. Comparison of Joule’s losses on transposed and non-transposed transmission line. In Proceedings of the 2015 16th International Scientific Conference on Electric Power Engineering (EPE), Kouty nad Desnou, Czech Republic, 20–22 May 2015; pp. 647–650. [Google Scholar]
  8. Kittipong, T.; Ratanabuntha, T. Comparison of power loss due to corona phenomena model with peek’s formula in high voltage 115 kV and 230 kV system. Procedia Comput. Sci. 2016, 86, 385–388. [Google Scholar]
  9. Peek, F. Laws of corona I, II, III. AIEE Trans. 1912, 30, 1889. [Google Scholar]
  10. Baran, I.; Costea, M.; Leonida, T. On the possibility of using weather forecast to predict corona losses. In Proceedings of the 8th International Symposium on Advanced Topics in Electrical Engineering, Bucharest, Romania, 23–25 May 2013; pp. 1–6. [Google Scholar]
  11. Ombua, A.; Labane, H.A. High voltage lines: Energy losses in insulators. Int. J. Eng. Sci. 2017, 6, 58–62. [Google Scholar]
  12. Ladislav, R. Software solution of technical losses of the transmission network system line. Trans. Electr. Eng. 2013, 2, 97–101. [Google Scholar]
  13. Ghaeth, F.; Muller, Z.; Straka, L.; Svec, J. FACTS devices influence on power losses in transmission systems. In Proceedings of the 2014 15th International Scientific Conference on Electric Power Engineering (EPE), Brno-Bystrc, Czech Republic, 12–14 May 2014; pp. 29–33. [Google Scholar]
  14. Gu, S.; Dang, J.; Tian, M.; Zhang, B. Compensation degree of controllable shunt reactor in EHV/UHV transmission line with series capacitor compensation considered. In Proceedings of the 2014 International Conference on Mechatronics, Control and Electronic Engineering (MCE-14), Shenyang, China, 29–31 August 2014; Atlantis Press: Amsterdam, The Netherlands, 2014; pp. 65–68. [Google Scholar]
  15. Burkov, V.D.; Mamedov, A.M.; Potapov, V.T.; Potapov, T.V.; Udalov, M.E. Fiber-optic sensor of electric field strength. Vestn. MGUL Lesn. Vestn. 2008, 4, 130–132. [Google Scholar]
  16. Djordjevic, A.R.; Zajic, A.G.; Tosic, D.V.; Hoang, T. A note on the modeling of transmission-line losses. IEEE Trans. Microw. Theory Tech. 2003, 51, 483–486. [Google Scholar] [CrossRef]
  17. Kashef, H.; Mahmoud, K.; Abdel-Nasser, M. Power loss estimation in smart grids using a neural network model. In Proceedings of the 2018 International Conference on Innovative Trends in Computer Engineering (ITCE), Aswan, Egypt, 19–21 February 2018; pp. 258–263. [Google Scholar]
  18. Yang, J.; Ren, G.; Luo, L.; Tan, B.; Xiao, X.; Yu, J. CNN-LSTM combined prediction algorithm for transmission line loss rate based on improved SSA. In Proceedings of the 2022 5th International Conference on Electronics and Electrical Engineering Technology (EEET), Beijing, China, 2–4 December 2022; pp. 83–89. [Google Scholar]
Disclaimer/Publisher’s Note: The statements, opinions and data contained in all publications are solely those of the individual author(s) and contributor(s) and not of MDPI and/or the editor(s). MDPI and/or the editor(s) disclaim responsibility for any injury to people or property resulting from any ideas, methods, instructions or products referred to in the content.

Article Metrics

Citations

Article Access Statistics

Multiple requests from the same IP address are counted as one view.