1. Introduction
The advent of electric flight marks a transformative shift in the aviation industry, creating new opportunities for innovation. Due to the shift away from fossil towards carbon neutral propulsion systems many technologies and processes are subject to change. This makes it easier to introduce improvements—in contrast to traditional propulsion systems. Digitalization still offers many opportunities for providing engineers a better foundation for their work in the design, production and service of new propulsion systems.
In this context the DIREKT project aims to develop digital twins along the life cycle of (hybrid) electrical propulsion systems to combine different data sources and to reduce the costs, effort and the time-to-market related to new products. One goal from the DIREKT project is to develop a digital twin for product design, enhancing the product creation process through an improved information supply and the connection of different data sources across various design tools. One key aspect of digital twins according to many definitions ([
1,
2]) is the digital shadow, which represents the current data that is fed back into the system for analysis and decision-making. Closing this feedback loop is one major issue which we want to address in this work. Our use case is about integrating production data feedback into the design process for utilization in the digital design twin. Leveraging an iterative feedback loop can lead to design improvements and a decrease in the development time in the highly iterative development process in the aviation sector.
In this paper, we present an approach to facilitate feedback from production to design. We outline a concept for capturing, storing, and processing data to provide designers with a clearer overview of the produced parts. Our focus is on the process of comparing the design with its corresponding manufactured parts, as well as the creation of a data foundation for machine learning models aimed at predicting potential shape deviations from specific production processes. This is demonstrated through a small use case involving an urban air mobility electric propulsion unit (EPU), where two distinct parts are printed using different additive manufacturing technologies for passing the deviations back to the design engineer.
2. State of the Art
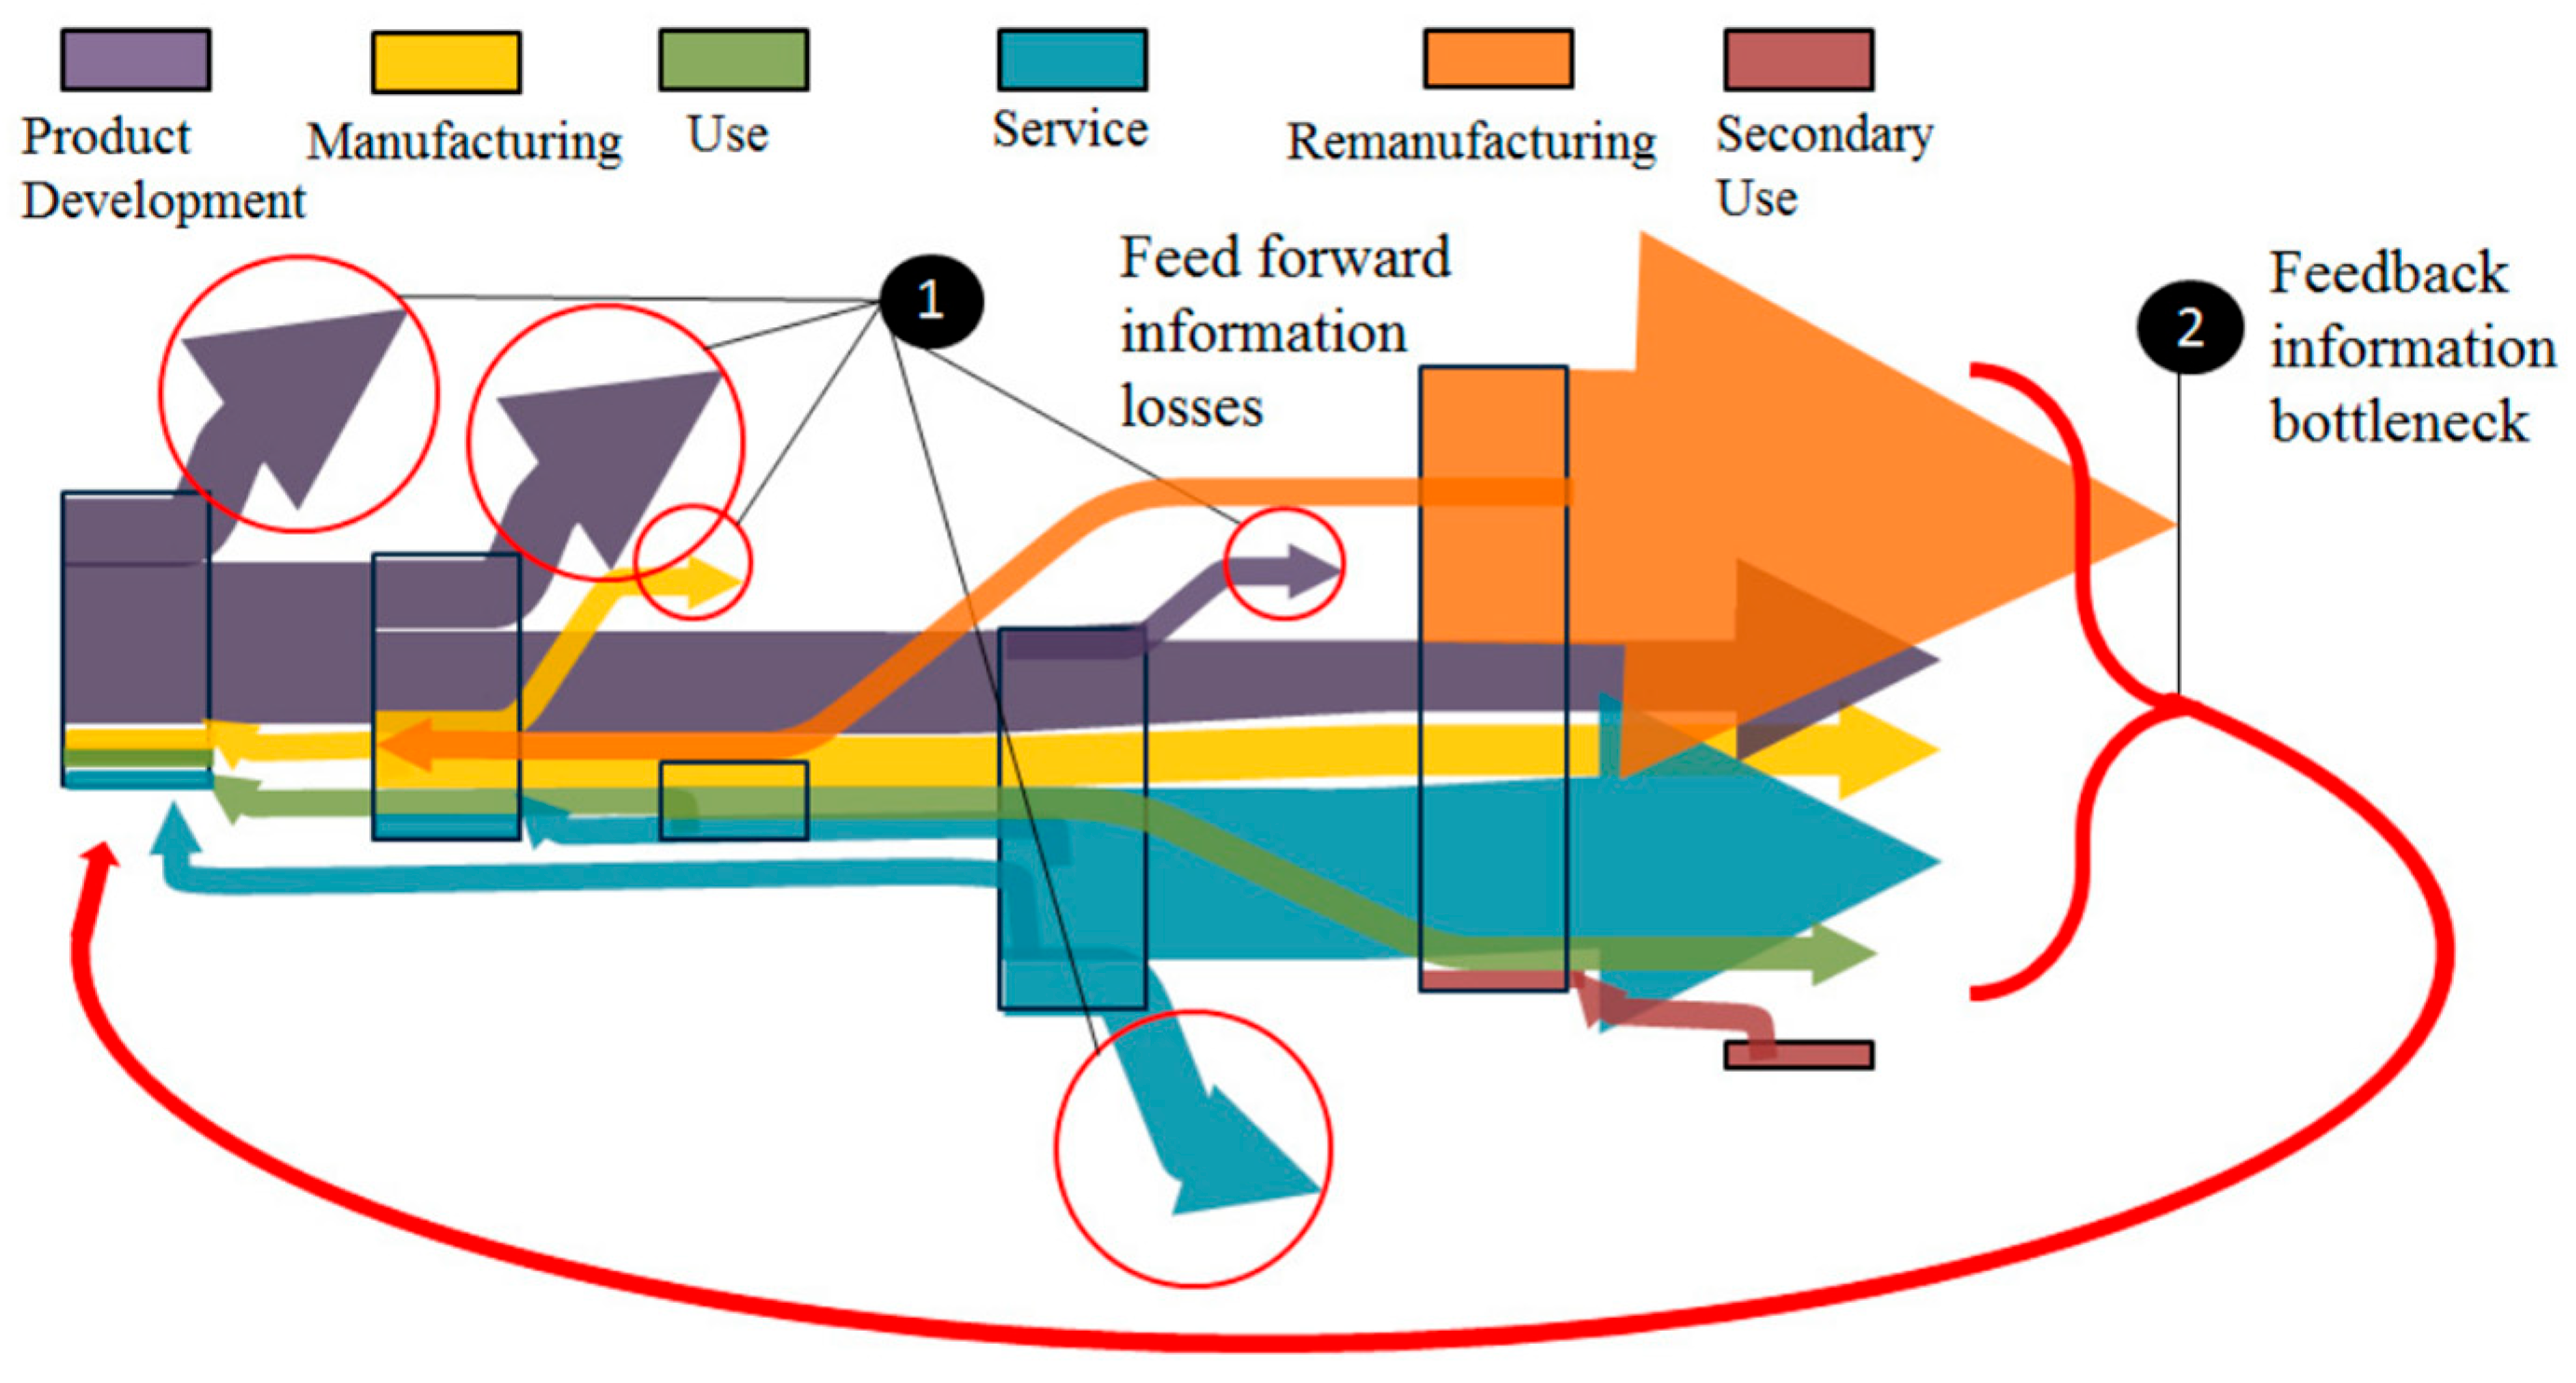
Kurilova-Palisaitiene et al. describe the loss of information for every life cycle phase, which is a major obstacle for remanufacturing. Those data losses could be passed back to the product design [
3]. However, these feedback loops are not only important for remanufacturing but can also be used generally to improve the next product generation or iteration (see
Figure 1).
Feedback is usually passed back from the usage phase of a product, like in the proposed knowledge-based feedback system in [
4]. Abramovici et al. further define relevant data for such a feedback, like machine parameters, environmental data, quality data, failures or maintenance information. Most of these data are not available in the production phase. Most approaches to utilizing data to improve design are focusing on usage data—as in the work of Igba et al. [
5] and another work by Abramovici which presents a “framework for the acquisition, aggregation and analysis of product use” [
6] for improving product design. Instead of data from the usage phase our approach will focus on utilizing information from production.
Comprehensive research has been conducted to compare 3D data and some, like the approach in the shipbuilding sector [
7], are focusing on comparing design CAD files to scan data. In the work of Lee et al. [
7], for instance, laser scans are used to retrieve the geometry of a ship hull. The comparisons are used here for quality control and, as in our approach, to identify shape deviations. In a remanufacturing use case, industrial spur gears are 3D laser-scanned and the surface point clouds are converted into optimized CAD models to restore nominal gear performance [
8]. Hamann et al. [
9] follow a similar approach by describing a method to capture and identify the deviations of sheet metal assemblies for quality engineers while our approach focuses more on improving the next design iteration.
CAD models are commonly exported in STL (StereoLithography) format, where objects are represented as triangulated surface meshes that approximate the geometry. STL files store, for each triangular facet, the coordinates of its three vertices and an outward normal vector that defines its orientation [
10]. However, as explained in what follows, it also can be beneficial to represent objects as point clouds by sampling points from the mesh surface. There are two practical reasons for this. First, meshes require a consistent surface representation (including vertex connectivity), whereas point clouds contain only point coordinates. The absence of point connectivity can be advantageous when data is missing or noisy in certain object regions. Another important consideration lies in the registration process between the CAD designs and manufactured parts. Many registration algorithms operate by establishing closest-point correspondences and minimizing the resulting distances (e.g., ICP (Iterative Closest Point) algorithm variants). Only after accurate registration can any subsequent tasks, such as anomaly detection or deviation analysis, be meaningfully performed [
11].
After alignment, the point clouds can be compared by statistical metrics, such as Root Mean Square Error, Median Absolute Deviation, or Hausdorff and Chamfer Distances, or by calculating the signed distances between the corresponding pairs of points, and used to produce deviation heatmaps. Additionally, based on their different features and task specifications, various 3D data machine learning problems have been proposed in manufacturing. Examples include using machine learning to forecast dimensional deviations (such as shrinkage, width, and volume) in parts [
12], predicting per-vertex deviations on simpler and symmetric mesh objects [
10], or applying neural networks on point-cloud representations of printed components to identify geometric defects [
13].
Although neither the comparison of manufactured components with their design nor the feedback of this information into product design is new, our approach is innovative in that it combines these elements in a digital twin for the design and uses this as a basis for collecting data for future machine learning approaches.
3. Concept and Implementation
Initially, user stories were created/developed based on interviews with experts from design and production in the development of an electric EPU for urban air mobility. The user stories aim to outline the requirements for the digital design twin and project its potential added value [
14]. Overall, nine user stories were collected in this process. One of them was selected for implementation due to its high priority rating: “As a structural design engineer, I want to have feedback about the manufactured geometric changes to the designed part in order to have an actual as manufactured imperfection and to improve future design iterations.” This user story is focused on analyzing the discrepancies between designed and manufactured parts. The comparison of these parts helps designers to anticipate tolerance exceedances and to understand how specific production methods may cause shape deviations, especially in a highly iterative design process.
3.1. Concept for Feedback from Production into Design
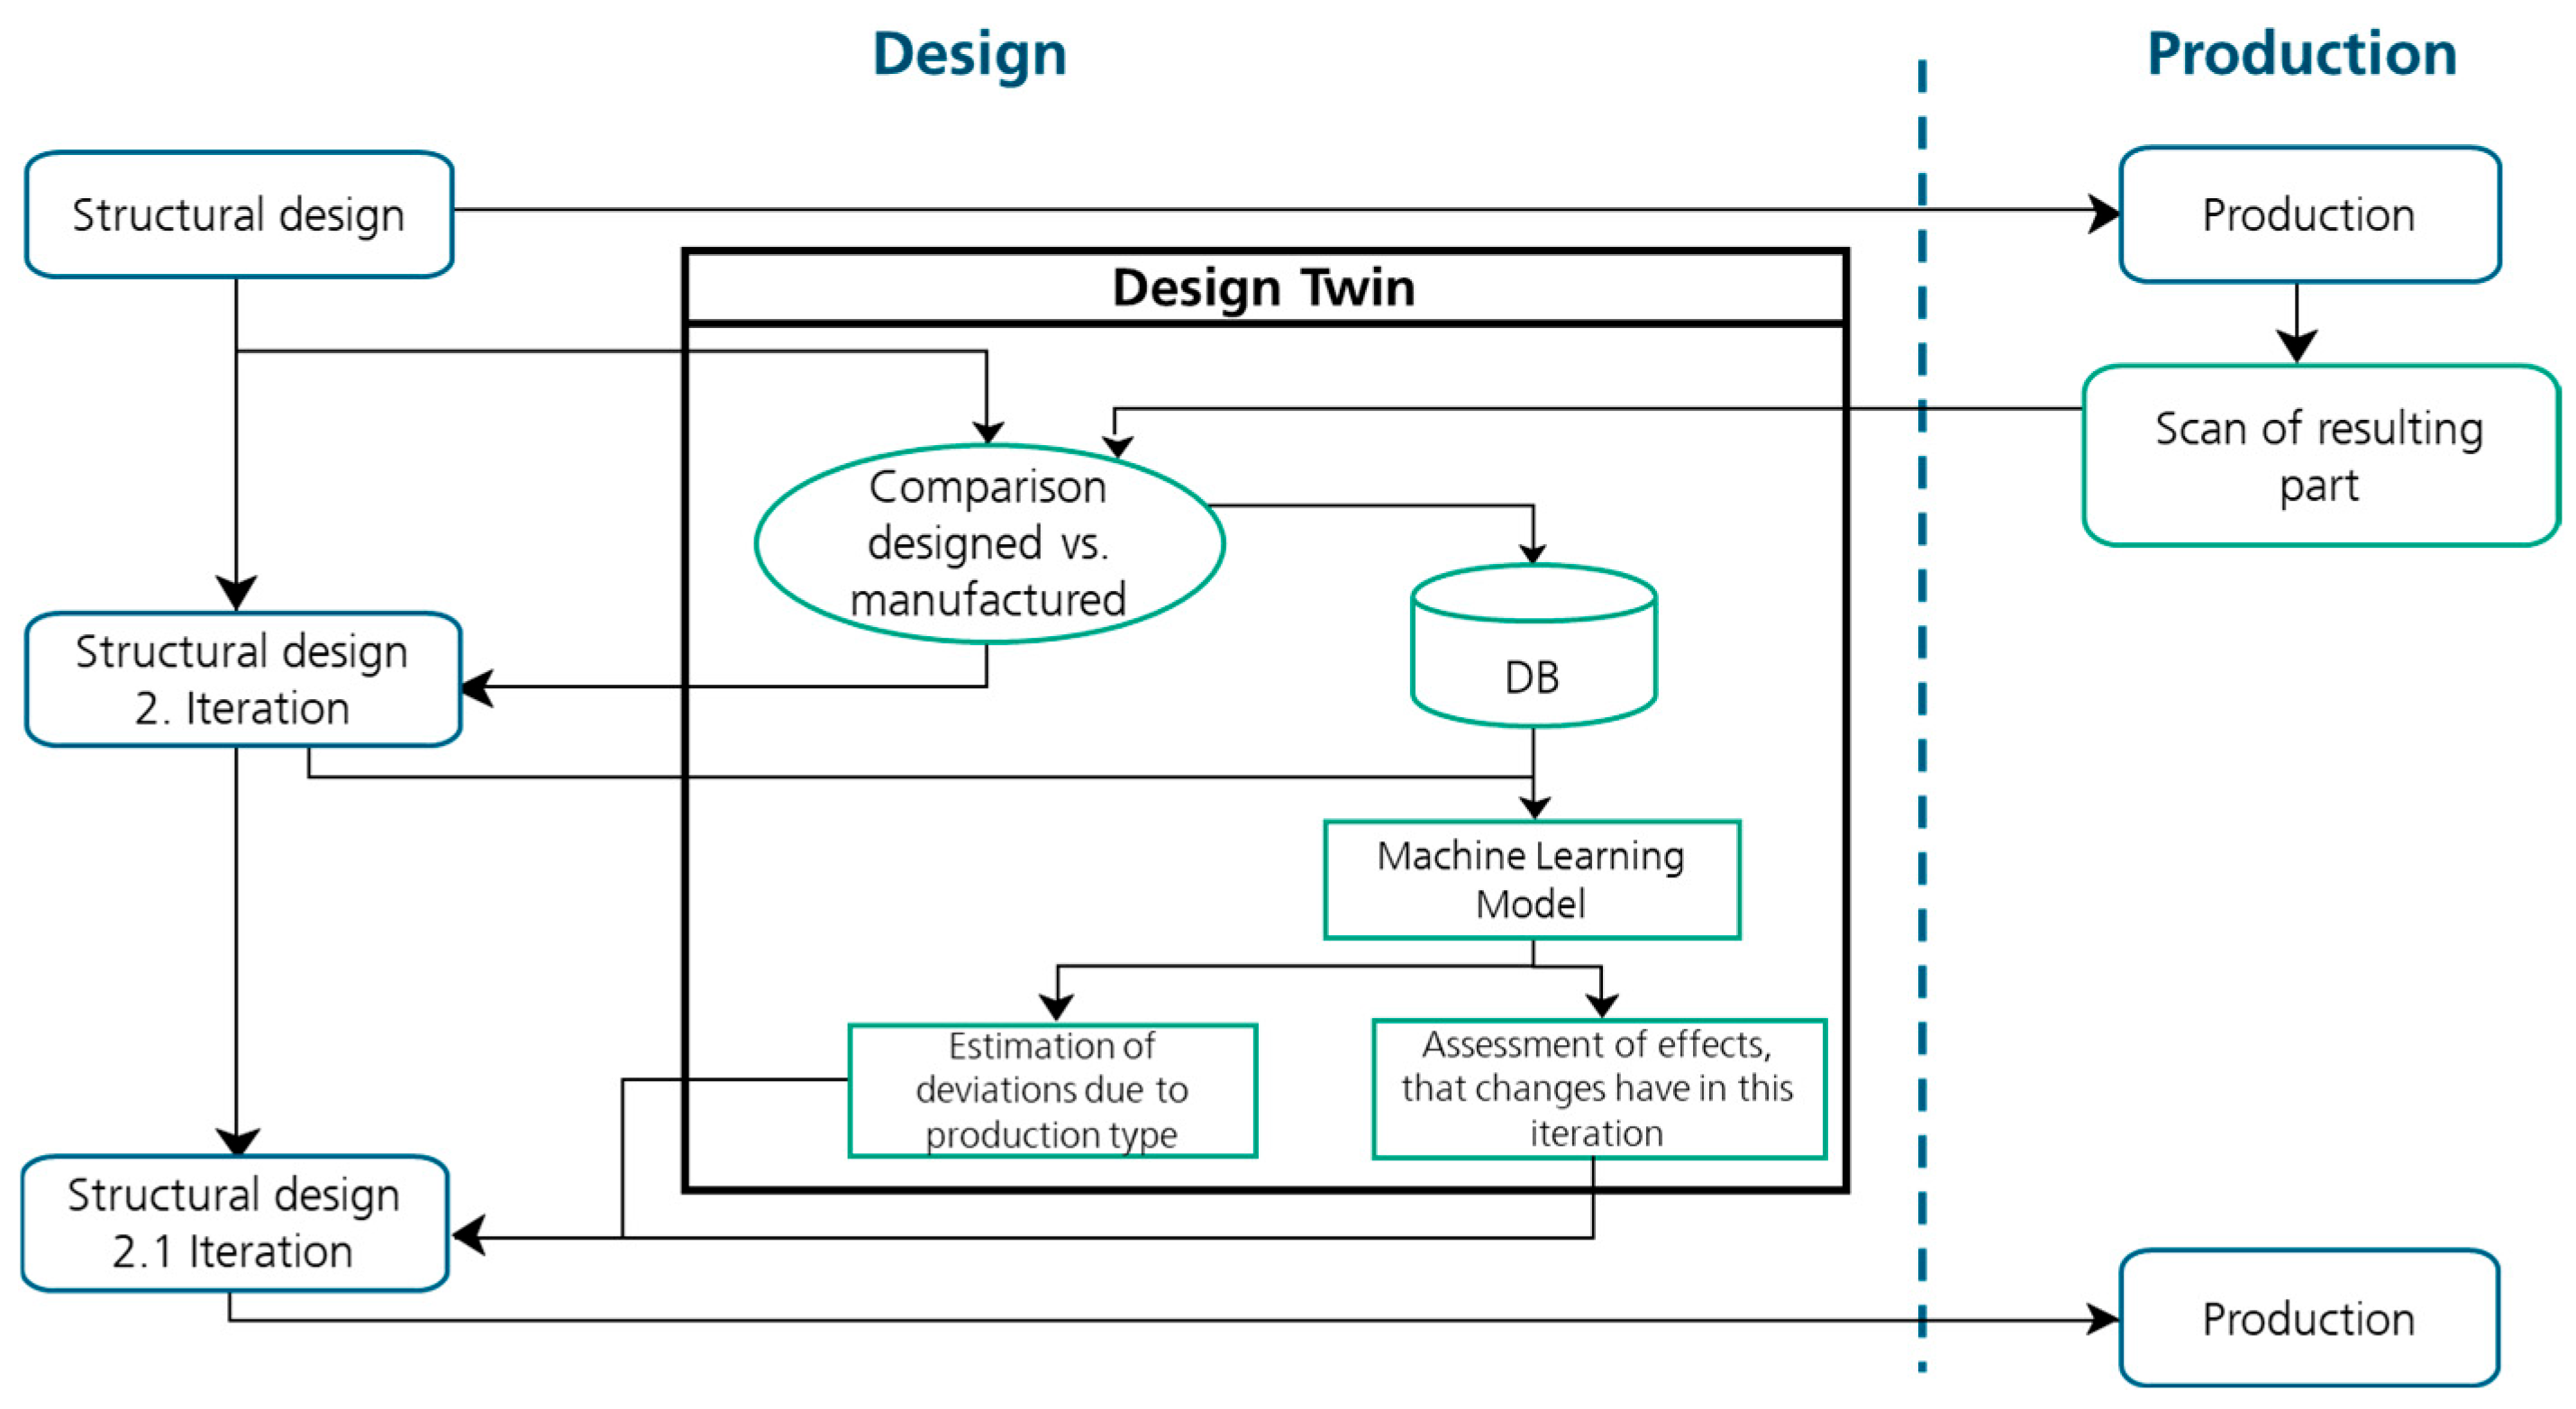
The first step was to draft a concept that fulfills the user story and provides useful feedback from production to design, as shown in
Figure 2. A structural design is created in the design phase and eventually produced. The geometry of the produced part is then captured. Both the structural design and the geometry of the manufactured part are compared in order to visualize the actual deviations. This shows the current state of the iteration and enables the next version of the design to be improved.
Additionally, the comparison data is stored in a database with some additional attributes regarding the technology used for manufacturing, the used material or even the specific machine used for production. Creating a solid database will enable the training of a machine learning model capable of predicting the expected tolerances depending on the manufacturing process.
3.2. Implementation Designed vs. Manufactured Comparison
Based on the concept described in
Section 3.1, this section describes the implementation of the designed vs. manufactured comparison.
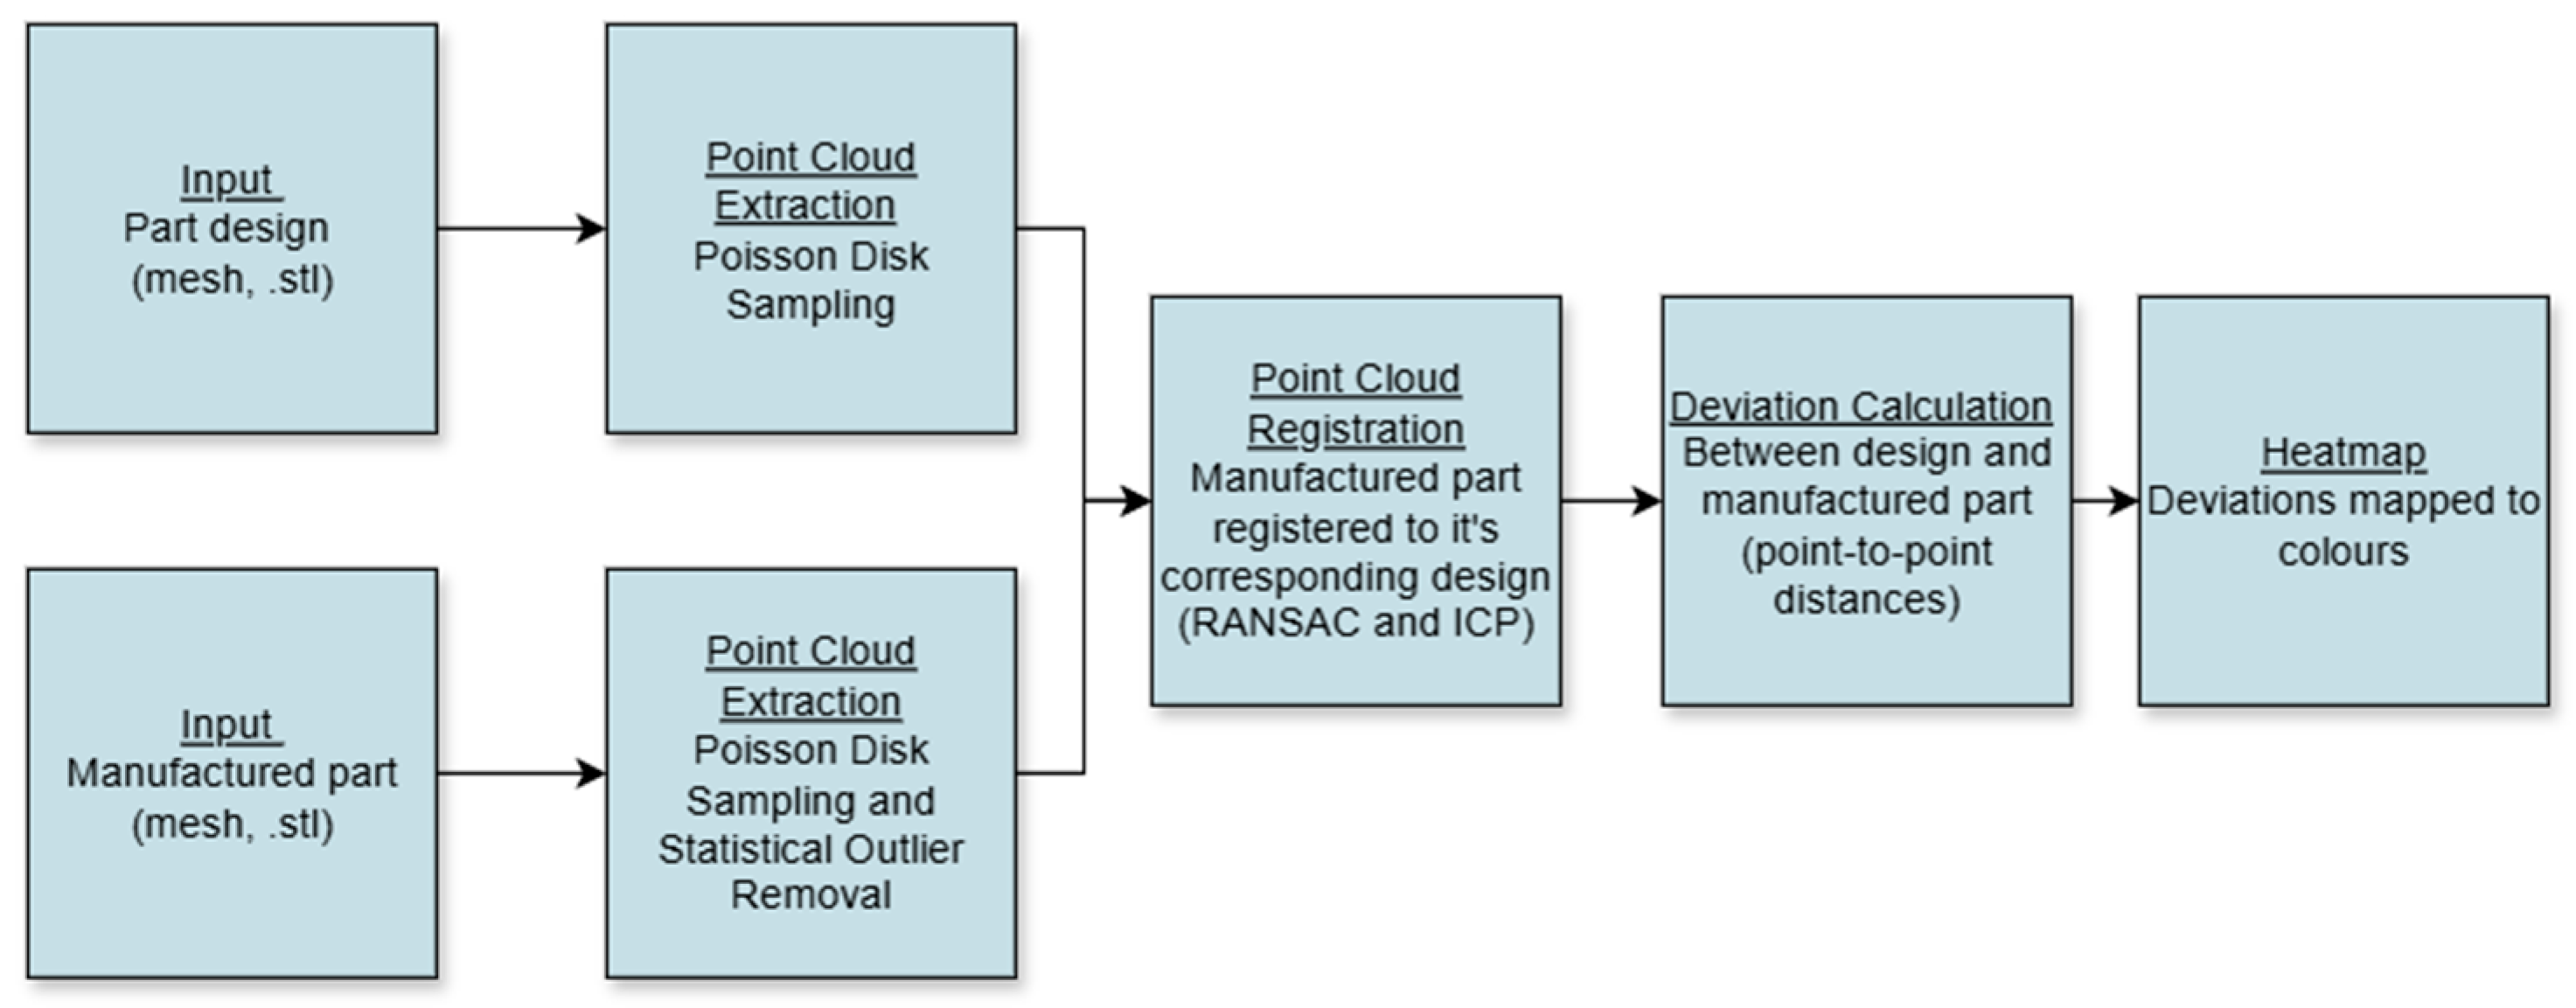
Figure 3 illustrates the respective workflow, which focuses on generating heatmaps that visualize signed deviations by mapping colors to nearest-neighbor point-to-point distances, following the registration of manufactured part scans to their corresponding design models. First, to enable the registration, the meshes are converted to point clouds. The scans of manufactured parts in the form of CT meshes contain irregularities and noise, have vertex counts that differ from design STL files, and lack node-to-node correspondences. Additionally, the remeshing of point clouds was unreliable due to the complex geometries of the analyzed data. Therefore, the designed vs. manufactured comparison is based on point clouds.
Two steps are involved in the conversion of meshes to point clouds. Poisson Disk Sampling is employed to sample a surface with 100,000 well-distributed points with an almost constant spacing, improving the manufacture-to-design point-cloud correspondence [
15]. Then a statistical outlier removal algorithm is applied, removing points whose mean distance to their 200 nearest neighbors exceeds the overall average by more than two standard deviations.
To obtain the alignment of the point clouds, they are first centered at (0, 0, 0) and registered using the global RANSAC (Random Sample Consensus) algorithm, followed by local refinement with ICP. RANSAC explores a wide range of transformations by randomly selecting subsets of points at each iteration and estimating the transformations by registering them to the reference point cloud. This transformation is then evaluated by checking how many other points from the registered point cloud align within an accepted threshold, which are then counted as correspondences (inliers). The process is repeated until an iteration of 100,000 is reached or a confidence level of 0.999 for a correct alignment is achieved. After that, the transformation with the highest number of correspondences is chosen as the final alignment [
16]. In contrast, ICP requires a good initial alignment and iteratively refines the transformation by minimizing squared point-to-plane distances between corresponding points. The iterations are performed until the Root Mean Square Error falls below 10
−6 or a maximum of 30 iterations is reached.
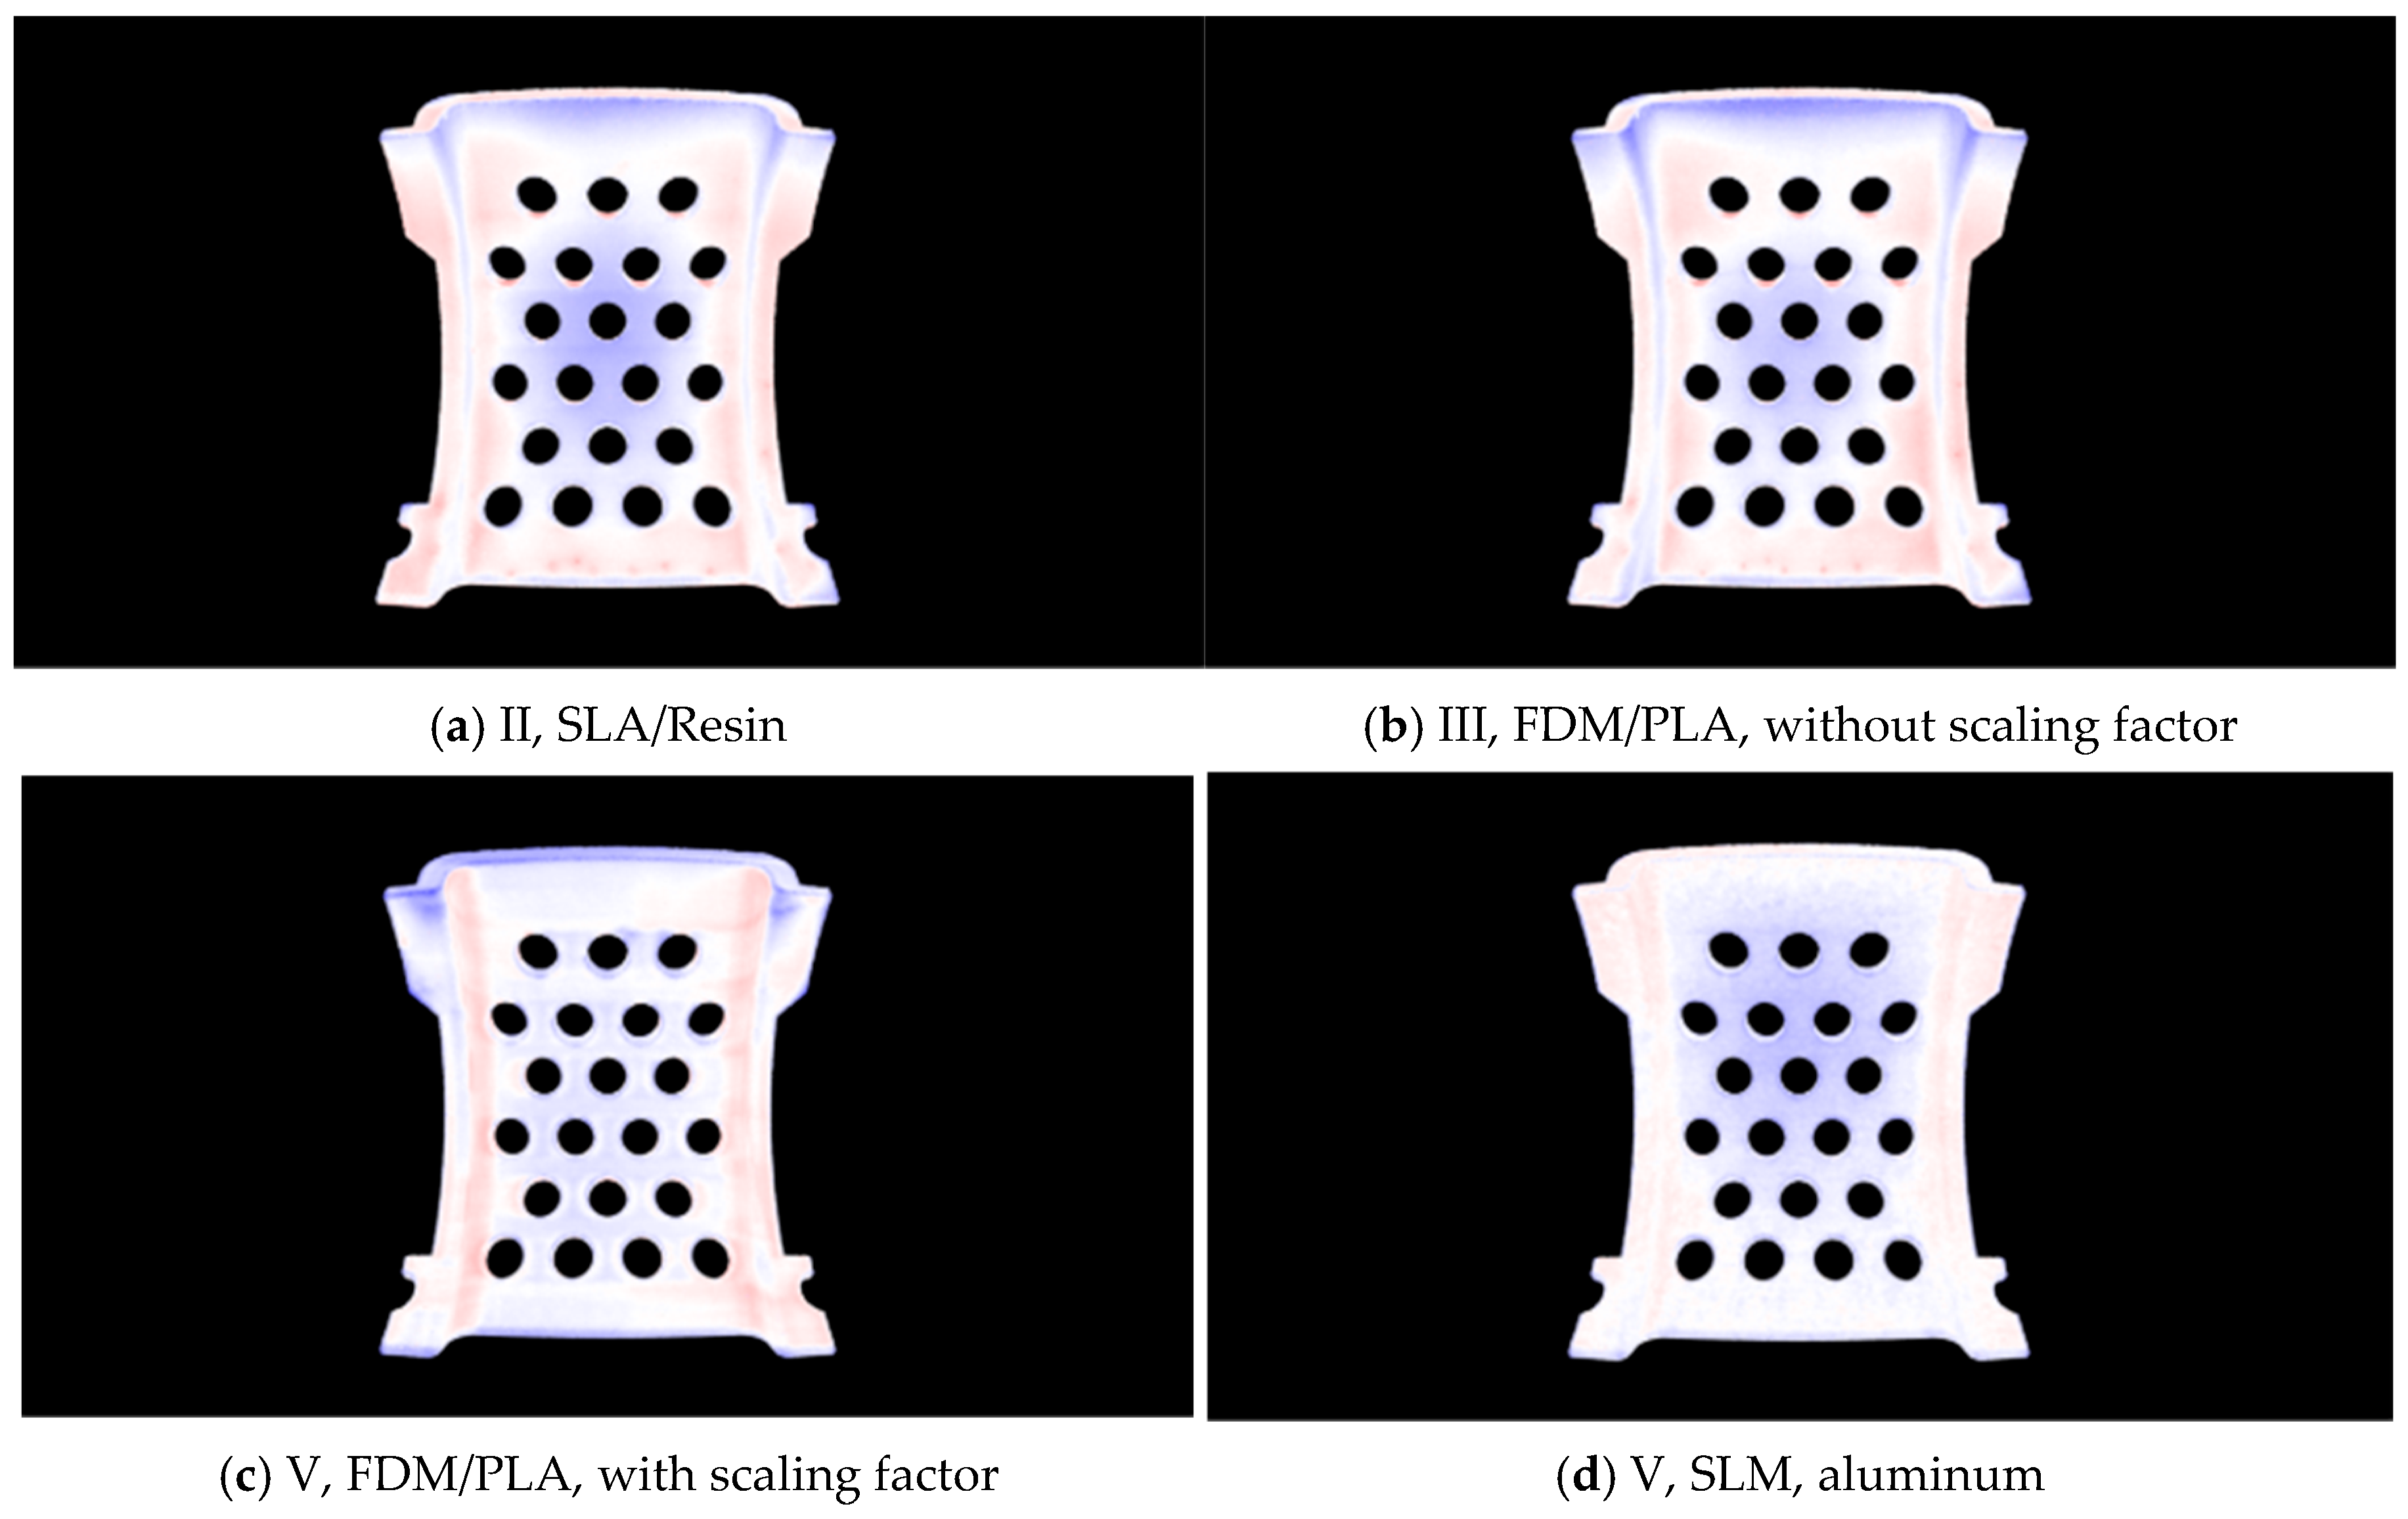
Lastly, to create a heatmap of deviations between the manufactured and design point clouds, point-to-point distances are computed based on the closest-neighbor correspondences. These distances serve as the basis for a scaled color mapping, where blue indicates a lack of material and red indicates excess material. Most deviations fall within the (−0.9, 0.9) range. The heatmap color scale was adjusted accordingly, using a blue-white-red color map. It is centered at zero to depict negative deviations (blue), no deviation (white), and positive (red) deviations.
3.3. Implementation into Digital Design Twin
Having established the overall concept (
Section 3.1) and implemented the comparison (
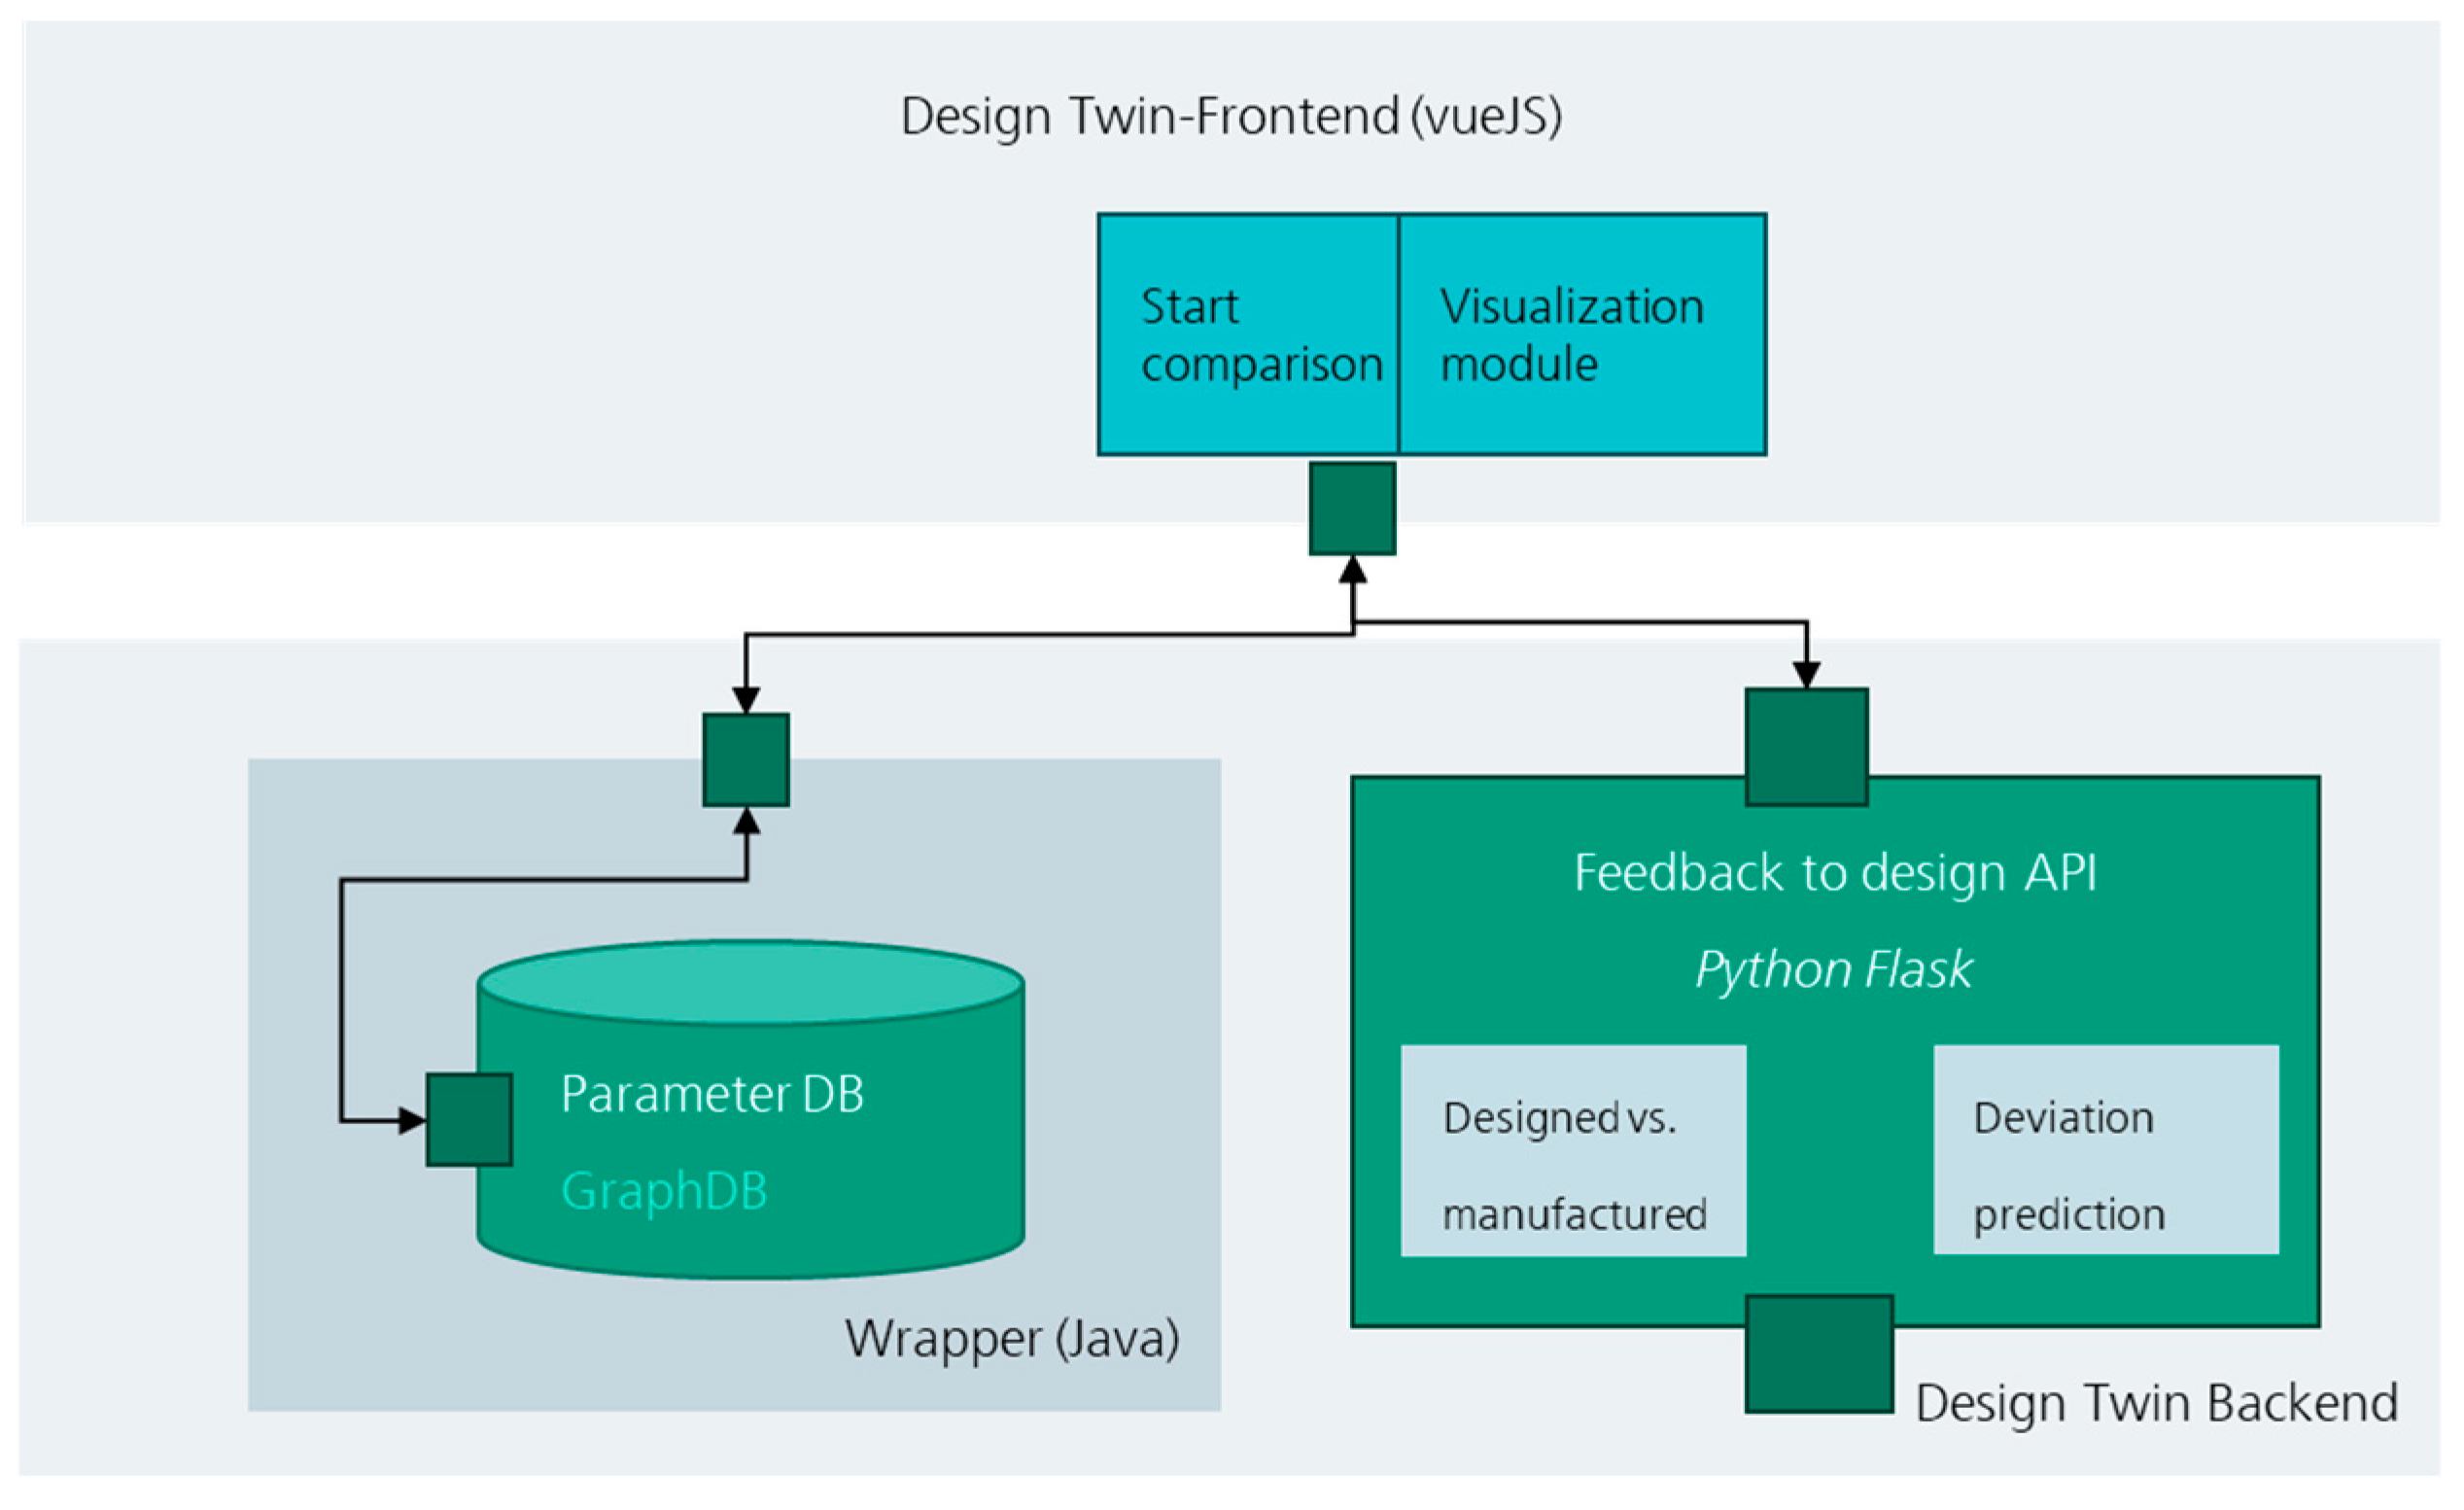
Section 3.2), we now integrate both into the digital design twin. The system (see
Figure 4) for the designed vs. manufactured comparison consists of three different modules:
The design twin frontend, which is a web application based on VueJS.
The feedback to design API in Python Flask 3.1.0, which is responsible for the comparison and the preprocessing. This is intended to host a machine learning model which should predict the expected deviations.
A graph-database that stores comparison data, which is the 3D data of the compared parts and the production-related attributes. It is wrapped in a Java REST-API for easier access.
The frontend initiates the comparison process, visualizes the results and acts as a controller for the use case. The user specifies the design and the scan file of the manufactured part and enters additional manufacturing information into a form. After that, the frontend saves files and manufacturing information in the database, and passes the file paths to the feedback to design API. The preprocessing, registration and comparison are executed there. The result is returned to the frontend and displayed to the user.
4. Experiments and Results
For validation of our system, one part was chosen for this study. The brackets are an assembly of two smaller parts. The choice was based on the geometric features and variety of shapes;
Table 1 shows all printed batches. Fabrication using three methods was chosen for the following parts:
Selective Laser Melting (SLM). Material: aluminum–magnesium alloy. Printer: EOS 290 (EOS GmbH, Munich, Germany). Brackets were produced using this method.
Photopolymer or stereolithography (SLA) printing from PLA, printer: FORMLABS Form 4L MSLA (Formlabs, Somerville, MA, USA), material: Generic Black Resin V4.1. Printing layer height 0.012 mm. Brackets were produced using this method as well.
Fused Deposition Modeling (FDM). Printer: PRUSA MK4 enclosed (Prusa Research a.s., Prague, Czech Republic), material—PLA. Layer height 0.14 mm; wall thickness 5 contours; filling density 25%. We consider it important to note that the FDM Printer was additionally calibrated to increase the accuracy of the printed part dimensions in the vs. batch.
Parts were fixtured and scanned on a Yxlon FF35 (FXT-225.48, high-power mode, Comet Yxlon GmbH, Hamburg, Germany). For metal parts, a 1.2 mm Cu pre-filter was applied; plastic parts were scanned without a pre-filter. The source operated at 115 kV tube voltage and 170 µA tube current (19.6 W), with 3 × 3 detector binning and 33.3 ms exposure per projection. A total of 720 projections were acquired over 360° using a circular cone–beam trajectory. Reconstruction (CERA 6.1.1, FDK) included beam-hardening correction (steel model) and metal-artifact reduction (MAR) for metal parts only; for plastic parts, beam-hardening correction and MAR were disabled, while truncation and bad-pixel corrections were enabled for all scans.
Figure 5 shows four examples of one of the two parts of the bracket. Those parts were printed according to the information from
Table 1 and scanned as described above. Subsequently, the scans are compared via our comparison algorithm and the deviations are visualized, with red and blue colors indicating a positive or negative deviation. Furthermore, the aggregated distances within a manufacturing subtype is displayed in the table.
5. Discussion and Conclusions
The validation of the system using the exemplary test data proved that the system meets the initially defined requirements. Based on the results shown in
Figure 5, a designer can easily spot the actual deviations between the designed and the manufactured part. Especially high deviations can be identified at one glance with this comparison. Overall, the initial user story is fulfilled by our approach. Furthermore, it is possible to visualize the differences between different means of production or even different parameters of production. For instance, the deviations are slightly higher for the FDM print without a scale factor (b) and with a scale factor (c). Furthermore, the deviations on the edges seem to be lower for STL (d) in comparison to all other additive manufacturing technologies which we compared in this study. That information can allow engineers to adapt their design decisions in the next iteration. One downside of our system is that the calculation time for the comparison algorithm itself can take quite a while. The current system exhibits a computational time of up to one minute—from a user’s perspective, this might not be satisfactory due to the unnecessary waiting time. This could be prevented in a more mature version of the process when the scan is uploaded directly after it is done, and the comparison algorithm could be executed subsequently. This would frontload the calculation time and the design engineer would not have to wait.
The next step of our research is to use the gathered comparison data from our concept to train a machine learning model that predicts the deviation of different production technologies of a current design based on random forest models and on Pointnet++. In parallel, we want to evaluate how users employ this feedback mechanism.



 ,
,