Abstract
This study presents an approach for predicting the hysteresis behavior of shape memory alloys (SMAs) based on automated machine learning (AutoML) integrated with explainable artificial intelligence (XAI). Experimental data from cyclic tests of NiTi wire under loading frequencies of 0.3, 0.5, 1, and 5 Hz were used for model development. The AutoML framework PyCaret enabled automated model selection, hyperparameter optimization, and performance comparison of regression algorithms. The highest prediction accuracy was achieved by the LightGBM model (for 0.3 Hz and 1 Hz) and the CatBoost model (for 0.5 Hz and 5 Hz), both demonstrating a coefficient of determination R2 > 0.997 and low MSE, MAE, and MAPE values. Integration of XAI through the SHAP method provided both global and local interpretability of the model’s behavior. The analysis revealed the dominant influence of the Stress parameter, the physically meaningful role of the loading or unloading stage (UpDown), and a gradual increase in the contribution of the Cycle parameter in later cycles, reflecting fatigue accumulation effects. The obtained results confirm the high accuracy, interpretability, and physical consistency of the developed models.
1. Introduction
Shape memory alloys (SMAs) belong to a class of smart materials characterized by unique properties—namely, the shape memory effect and superelasticity. These phenomena arise from reversible martensitic–austenitic phase transformations. The shape memory effect refers to the ability of the alloy to recover its original geometry after plastic deformation in the low-temperature martensitic state. In this condition, the alloy can be easily deformed; upon heating above the austenite finish temperature (Af), a reverse transformation from martensite to austenite occurs, restoring the initial shape. Superelasticity, in turn, is observed at temperatures above Af, when the material exists in a stable austenitic phase. Under mechanical loading, a stress-induced, detwinned martensitic structure forms, which reverts to austenite upon unloading. Owing to this property, the material can withstand substantial reversible strains (up to 8–10%) and fully recover its original shape after unloading. The combination of the shape memory effect and superelasticity has led to the widespread use of SMAs across various fields, including medicine [1], aerospace engineering [2,3], robotics [4], automation systems [5], the automotive industry [6], and civil engineering [7].
Under cyclic loading and unloading, reversible phase transformations between martensite and austenite produce a characteristic hysteresis loop that reflects the material’s nonlinear behavior. Reproducing and predicting this behavior is crucial for assessing the durability of structures; however, traditional analytical models often fail to provide sufficient accuracy. This limitation underscores the importance of applying modern machine learning methods, which can improve prediction accuracy and achieve a better alignment with experimental data.
Machine learning is widely applied across various fields of science and engineering. In medicine, artificial intelligence methods are utilized for disease diagnosis and prediction of treatment outcomes [8,9]. In the automotive industry, machine learning plays a crucial role in the development of autonomous vehicles and driver-assistance systems [10,11]. In materials science, it is employed to predict material properties and uncover relationships between composition, structure, and mechanical characteristics [12,13,14]. In the financial sector, algorithms aid in detecting fraud and forecasting market trends [15,16], while in cybersecurity, they are utilized to identify and prevent attacks through the analysis of network traffic and behavioral patterns [17,18].
Particular attention has been devoted to the application of machine learning methods for modeling and predicting the behavior of SMAs [19,20,21]. Such approaches enable the capture of complex, nonlinear relationships among stress, strain, and loading cycles that govern phase transitions between martensite and austenite. Unlike traditional analytical models [22], machine learning algorithms can automatically detect hidden patterns within large experimental datasets and generate highly accurate predictions [23,24]. To improve the efficiency of model development, automated machine learning (AutoML) techniques are increasingly employed [25], allowing for the automatic selection of optimal algorithms, hyperparameters, and model architectures. This automation accelerates the modeling process, enhances result reproducibility, and reduces the influence of human bias in building high-precision ML models. The integration of explainable artificial intelligence (XAI) methods provides interpretability of ML model decisions [26]. Approaches such as SHapley Additive exPlanations (SHAP) [27] and Local Interpretable Model-agnostic Explanations (LIME) [28] enable quantitative assessment of individual feature contributions to model predictions and allow the comparison of model outcomes with known physical mechanisms of phase transformations in SMAs.
The aim of this study is to develop and evaluate models constructed using the AutoML approach integrated with XAI methods for predicting the hysteresis behavior of SMAs. The work focuses on improving strain prediction accuracy, reducing errors, and achieving results that are consistent with the physical nature of martensitic–austenitic phase transformations.
2. Materials and Methods
For this study, experimental data were obtained from low-cycle fatigue tests of a wire specimen with a diameter of 1.5 mm and a length of 210 mm, made of a Ni55.8Ti44.2 SMA. In the austenitic state, the material exhibited an elastic modulus of EA = 52.7 GPa. The onset of the forward phase transformation from austenite to martensite occurred at a stress of σAM = 338 MPa [29,30].
The experiments were conducted at room temperature using an STM-100 servo-hydraulic testing machine. Uniaxial tensile tests were performed under sinusoidal cyclic loading with stress control. The tests were carried out at several loading frequencies with a constant stress ratio of Rσ = 0.1 in all cases. During the tests, the applied load and displacement were recorded using an inductive displacement sensor (Bi-02-313), while the longitudinal strain was measured with an extensometer (Bi-06-308). Stress and strain values were calculated from the data acquired through the Test Builder software version 5.3. The general view of the specimen mounted in the grips of the testing machine is shown in Figure 1.
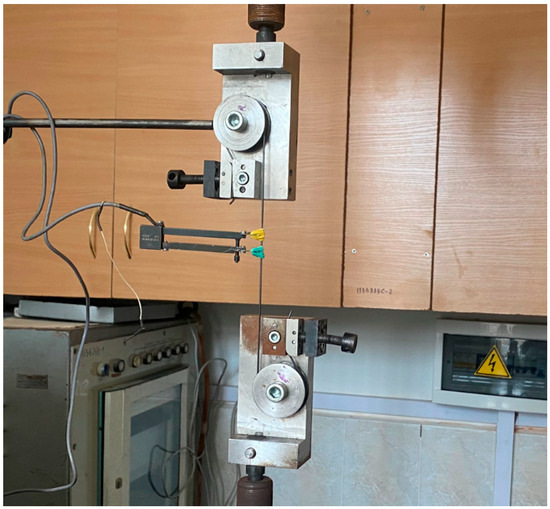
Figure 1.
The test sample fixed in the grippers.
The experimental setup ensured the acquisition of reliable data, which served as the basis for subsequent analysis and prediction of the hysteresis behavior of SMAs under cyclic loading at different frequencies. Based on the experimental results, a dataset was constructed for training and testing the machine learning models.
The input features included:
- stress σ (Mpa);
- number of the loading and unloading cycle N;
- the indicator of the loading or unloading stage (UpDown).
The output (target) variable was the material strain ε (%), which characterizes the response of the NiTi alloy to the applied load under different loading frequencies f (Hz) equal to 0.3, 0.5, 1, and 5 Hz.
The constructed dataset reflected the nonlinear hysteresis behavior of the SMA material. To develop the machine learning models, experimentally obtained data from 100 to 250 loading–unloading cycles of the SMA were used. The number of records in the dataset varied with loading frequency as follows: 16,912 entries at 0.3 Hz, 3051 at 0.5 Hz, 16,006 at 1 Hz, and 14,949 at 5 Hz.
To create the training and testing subsets, the GroupShuffleSplit method was applied. This approach enables a random division of data into training and test subsets while accounting for the group affiliation of observations. The cycle number (Cycle) served as the grouping index, preventing data from the same loading cycle from simultaneously appearing in both the training and testing sets. In this study, the data were divided into an 80:20 ratio, with 80% used for model training and 20% for independent testing. To automate the machine learning model development process, the PyCaret framework (version 3.3.2) in Python (version 3.9) [30] was employed, implementing the AutoML concept. Within this study, PyCaret was used for the automatic selection of the most effective regression models based on their performance in predicting the strain of the SMA. To evaluate the performance of the machine learning models, the following statistical metrics were employed: the coefficient of determination (R2), root mean square error (RMSE), mean squared error (MSE), root mean squared logarithmic error (RMSLE), and mean absolute percentage error (MAPE). To interpret the decisions of the machine learning models, the SHAP method was employed in this study. This approach is based on the concept of Shapley values from cooperative game theory and allows for a quantitative assessment of each input feature’s contribution to the model’s prediction. The use of SHAP enabled the construction of both global and local explanations, allowing the determination of overall feature importance across the entire dataset, as well as the analysis of individual feature effects on specific predictions. SHAP computes local explanations for individual predictions, which can be consistently aggregated across samples to derive global feature importance measures. This made it possible to verify the consistency of the model’s results with the physically grounded patterns of phase transformations in SMAs and to increase confidence in the obtained predictions.
3. Results and Discussion
In this study, the AutoML framework PyCaret enabled automated construction and optimization of the data processing pipeline, as well as the selection of the most effective model for network traffic classification.
The results of the best-performing machine learning model selection are presented in Figure 2.
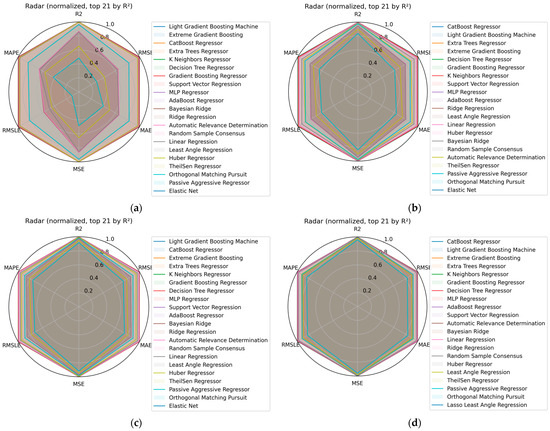
Figure 2.
Radar charts comparing AutoML models based on normalized accuracy metrics for different loading frequencies as follows: 0.3 Hz (a), 0.5 Hz (b), 1 Hz (c), and 5 Hz (d).
The input variables Stress and Cycle were treated as numerical features, while UpDown was a binary indicator encoded as 0/1. Data preprocessing was performed automatically within the PyCaret pipeline and included missing-value imputation for numerical variables (SimpleImputer, strategy = “mean”), followed by feature scaling using StandardScaler. Since UpDown was provided as a numeric binary variable, no additional categorical encoding was applied.
For loading frequencies of 0.3 Hz and 1 Hz, the LightGBM [31] model achieved the best results. In contrast, for frequencies of 0.5 Hz and 5 Hz, the CatBoost [32] model provided the highest prediction accuracy.
A tuning stage was performed for the best-performing model to further enhance its accuracy. The optimization was conducted using the MSE criterion, allowing the identification of a hyperparameter combination that ensured the best agreement between predicted and experimental values. After tuning, the model was finalized by retraining it on the complete training dataset to maximize the use of available data and then applied for prediction on the test set.
In the PyCaret AutoML framework, each algorithm is initialized with the default hyperparameters of the corresponding library. During the tuning stage, these parameters are modified only if an improvement in the selected performance metric is achieved.
The final hyperparameter configurations of the selected optimal models are reported in Table 1.

Table 1.
Final hyperparameters of the optimal models selected by AutoML.
The performance of the developed model was evaluated using standard regression analysis metrics. The accuracy indicators were calculated for the test subset formed within the training cycles (100–250) and for independent experimental cycles (251, 260, and 300), which were not used during training or testing. The results of the model accuracy evaluation are presented in Table 2.
Table 2.
Results of model accuracy evaluation.
The developed models successfully reproduced the hysteresis behavior of SMAs under cyclic loading. Figure 3 shows the modeled hysteresis loops for cycles 251, 260, and 300 at a loading frequency of 0.5 Hz.
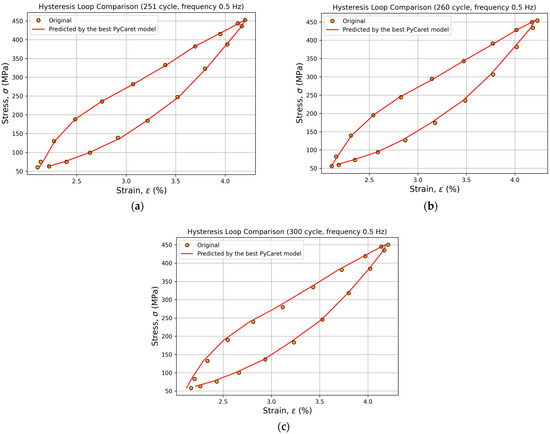
Figure 3.
Comparison of experimental and predicted hysteresis loops: 251st cycle (a), 260th cycle (b), and 300th cycle (c).
Experimental and corresponding predicted hysteresis loops were also constructed for the remaining loading frequencies.
To interpret the behavior of the models, the SHAP method was applied. The analysis was performed using the KernelExplainer. To reduce computational complexity, the sample was limited to a subset of 500 background data points generated from the training examples. The evaluation was carried out for the feature set comprising Stress, Cycle, and UpDown. The global interpretation is provided through SHAP summary plots, which visualize the distribution of local SHAP values across all samples (Figure 4).
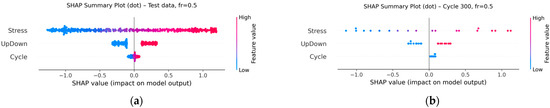
Figure 4.
SHAP summary plots for the test dataset (a) and for cycle 300 (b) at a loading frequency of 0.5 Hz.
The parameter Stress has the greatest influence on the predicted strain value, reflecting its dominant role in shaping the model’s output. High stress values (shown in red) increase the model output, whereas low values (shown in blue) decrease the predicted strain. The UpDown feature, representing the loading or unloading phase, has a secondary but significant effect, with its contribution changing sign depending on the phase of the cycle. The Cycle parameter has a minimal yet physically meaningful influence. In cycle 300, an increase in its contribution is observed, indicating the manifestation of fatigue accumulation effects and confirming the model’s ability to accurately predict these physical phenomena.
Figure 5 shows the local SHAP analysis results for sample #9 in cycle 300 at a loading frequency of 0.5 Hz.
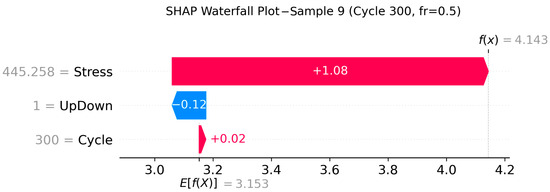
Figure 5.
Local SHAP analysis for sample #9 of cycle 300 at a loading frequency of 0.5 Hz.
The model’s base value is 3.153, corresponding to the average predicted strain level for the dataset. The main contribution to the increase in the predicted value comes from the Stress parameter (+1.08), which significantly raises the model output. The UpDown feature decreases the prediction by −0.12, while the Cycle parameter has a minor positive influence (+0.02). The resulting predicted value is 4.143, illustrating the predominant impact of stress on the material’s strain response.
The results of both the global and local SHAP analyses confirm the model’s ability to provide a physically grounded interpretation of its predictions and to maintain consistency with the known mechanisms of martensitic–austenitic phase transformations in SMAs. For the other loading frequencies (0.3, 1, and 5 Hz), analogous SHAP plots were also constructed and demonstrated a similar structure of input feature contributions.
4. Conclusions
This study confirms the effectiveness of the AutoML (PyCaret) approach for developing regression models to predict the hysteresis behavior of shape memory alloys. The best results were achieved by the LightGBM model for the 0.3 Hz and 1 Hz frequency and the CatBoost model for 0.5 Hz and 5 Hz, as confirmed by high R2 values and low RMSE, MSE, and MAPE across both the test dataset (cycles 100–250) and independent cycles (251, 260, and 300). The models accurately reproduced complete σ–ε hysteresis loops, showing strong agreement with experimental data.
The integration of XAI using the SHAP method provided both global and local explanations of the model behavior. The analysis revealed a dominant influence of the Stress parameter, a physically meaningful role of the loading and unloading phase (UpDown), and a gradual increase in the contribution of the Cycle parameter at later cycles, reflecting the accumulation of material fatigue effects. The obtained SHAP results enhance trust in the model predictions and confirm the physical consistency of the proposed models.
Author Contributions
Conceptualization, O.Y. and D.T.; methodology, D.T. and O.Y.; software, D.T.; validation, D.T.; formal analysis, O.Y.; writing—original draft preparation, D.T.; writing—review and editing, D.T. and O.Y.; visualization, D.T.; supervision, O.Y. All authors have read and agreed to the published version of the manuscript.
Funding
This research received no external funding.
Institutional Review Board Statement
Not applicable.
Informed Consent Statement
Not applicable.
Data Availability Statement
The raw data supporting the conclusions of this article will be made available by the authors on request.
Conflicts of Interest
The authors declare that they have no conflicts of interest.
References
- Abitha, H.; Kavitha, V.; Gomathi, B.; Ramachandran, B. A recent investigation on shape memory alloys and polymers based materials on bio artificial implants-hip and knee joint. Mater. Today Proc. 2020, 33, 4458–4466. [Google Scholar] [CrossRef]
- Quan, D.; Hai, X. Shape memory alloy in various aviation field. Procedia Eng. 2015, 99, 1241–1246. [Google Scholar] [CrossRef]
- Costanza, G.; Tata, M.E. Shape memory alloys for aerospace, recent developments, and new applications: A short review. Materials 2020, 13, 1856. [Google Scholar] [CrossRef] [PubMed]
- Teodoriu, A.P.; Pricop, B.; Lohan, N.-M.; Popa, M.; Comăneci, R.I.; Doroftei, I.; Bujoreanu, L.-G. Designing a robotic gripper based on the actuating capacity of niti-based shape memory wires. Actuators 2024, 13, 319. [Google Scholar] [CrossRef]
- Schmelter, T.; Bade, L.; Kuhlenkötter, B. A two-finger gripper actuated by shape memory alloy for applications in automation technology with minimized installation space. Actuators 2024, 13, 425. [Google Scholar] [CrossRef]
- Turabimana, P.; Sohn, J.W.; Choi, S.-B. Design and control of a shape memory alloy-based idle air control actuator for a mid-size passenger vehicle application. Appl. Sci. 2024, 14, 4784. [Google Scholar] [CrossRef]
- Higazey, M.; Alshannag, M.; Alqarni, A. Numerical investigation on the performance of exterior beam–column joints reinforced with shape memory alloys. Buildings 2023, 13, 1801. [Google Scholar] [CrossRef]
- Dong, T.; Oronti, I.B.; Sinha, S.; Freitas, A.; Zhai, B.; Chan, J.; Fudulu, D.P.; Caputo, M.; Angelini, G.D. Enhancing cardiovascular risk prediction: Development of an advanced xgboost model with hospital-level random effects. Bioengineering 2024, 11, 1039. [Google Scholar] [CrossRef]
- Tonti, E.; Tonti, S.; Mancini, F.; Bonini, C.; Spadea, L.; D’Esposito, F.; Gagliano, C.; Musa, M.; Zeppieri, M. Artificial intelligence and advanced technology in glaucoma: A review. J. Pers. Med. 2024, 14, 1062. [Google Scholar] [CrossRef]
- Navarro, P.; Fernández, C.; Borraz, R.; Alonso, D. A Machine Learning Approach to Pedestrian Detection for Autonomous Vehicles Using High-Definition 3D Range Data. Sensors 2016, 17, 18. [Google Scholar] [CrossRef]
- Yang, Q.; Fu, S.; Wang, H.; Fang, H. Machine-Learning-Enabled Cooperative Perception for Connected Autonomous Vehicles: Challenges and Opportunities. IEEE Netw. 2021, 35, 96–101. [Google Scholar] [CrossRef]
- Stukhliak, P.; Martsenyuk, V.; Totosko, O.; Stukhlyak, D.; Didych, I. The Use of Neural Networks for Modeling the Thermophysical Characteristics of Epoxy Composites Treated with Electric Spark Water Hammer. CEUR Workshop Proc. 2024, 3742, 13–24. [Google Scholar]
- Tymoshchuk, D.; Didych, I.; Maruschak, P.; Yasniy, O.; Mykytyshyn, A.; Mytnyk, M. Machine Learning Approaches for Classification of Composite Materials. Modelling 2025, 6, 118. [Google Scholar] [CrossRef]
- Stukhliak, P.; Totosko, O.; Vynokurova, O.; Stukhlyak, D. Investigation of Tribotechnical Characteristics of Epoxy Composites Using Neural Networks. CEUR Workshop Proc. 2024, 3842, 157–170. [Google Scholar]
- Li, Y.; Stasinakis, C.; Yeo, W.M. A hybrid xgboost-mlp model for credit risk assessment on digital supply chain finance. Forecasting 2022, 4, 184–207. [Google Scholar] [CrossRef]
- Park, J.; Shin, M. An approach for variable selection and prediction model for estimating the risk-based capital (RBC) based on machine learning algorithms. Risks 2022, 10, 13. [Google Scholar] [CrossRef]
- Petliak, N.; Klots, Y.; Karpinski, M.; Titova, V.; Tymoshchuk, D. Hybrid System for Detecting Abnormal Traffic in IoT. CEUR Workshop Proc. 2025, 4057, 21–36. [Google Scholar]
- Klots, Y.; Titova, V.; Petliak, N.; Tymoshchuk, D.; Zagorodna, N. Intelligent Data Monitoring Anomaly Detection System Based on Statistical and Machine Learning Approaches. CEUR Workshop Proc. 2025, 4042, 80–89. [Google Scholar]
- Hmede, R.; Chapelle, F.; Lapusta, Y. Review of neural network modeling of shape memory alloys. Sensors 2022, 22, 5610. [Google Scholar] [CrossRef]
- Liu, H.-X.; Yan, H.-L.; Jia, N.; Yang, B.; Li, Z.; Zhao, X.; Zuo, L. Machine learning-assisted discovery of empirical rule for martensite transition temperature of shape memory alloys. Materials 2025, 18, 2226. [Google Scholar] [CrossRef]
- Tymoshchuk, D.; Yasniy, O.; Maruschak, P.; Iasnii, V.; Didych, I. Loading frequency classification in shape memory alloys: A machine learning approach. Computers 2024, 13, 339. [Google Scholar] [CrossRef]
- Łastowska, O.; Polishchuk, V.; Poznanskyi, A. Thermomechanical Parameters Modelling of Spring Force Elements Made of Shape Memory Alloys. Materials 2025, 18, 3055. [Google Scholar] [CrossRef] [PubMed]
- Gao, Y.; Hu, Y.; Zhao, X.; Liu, Y.; Huang, H.; Su, Y. Machine-Learning-Driven design of high-elastocaloric NiTi-based shape memory alloys. Metals 2024, 14, 1193. [Google Scholar] [CrossRef]
- Lenzen, N.; Altay, O. Machine learning enhanced dynamic response modelling of superelastic shape memory alloy wires. Materials 2022, 15, 304. [Google Scholar] [CrossRef]
- Automated Machine Learning (AutoML). Google for Developers. Available online: https://developers.google.com/machine-learning/crash-course/automl (accessed on 5 November 2025).
- IBM. What is Explainable AI (XAI)? IBM. Available online: https://www.ibm.com/think/topics/explainable-ai (accessed on 6 October 2025).
- A Game Theoretic Approach to Explain the Output of Any Machine Learning Model. GitHub. Available online: https://github.com/shap/shap (accessed on 14 October 2025).
- Lime: Explaining the Predictions of Any Machine Learning Classifier. GitHub. Available online: https://github.com/marcotcr/lime (accessed on 5 November 2025).
- Iasnii, V.; Bykiv, N.; Yasniy, O.; Budz, V. Methodology and some results of studying the influence of frequency on functional properties of pseudoelastic SMA. Sci. J. Ternopil Natl. Tech. Univ. 2022, 107, 45–50. [Google Scholar] [CrossRef]
- Iasnii, V.P.; Junga, R. Phase Transformations and Mechanical Properties of the Nitinol Alloy with Shape Memory. Mater. Sci. 2018, 54, 406–411. [Google Scholar] [CrossRef]
- LightGBM Documentation. Available online: https://lightgbm.readthedocs.io/en/stable/ (accessed on 27 December 2025).
- CatBoost. GitHub. Available online: https://github.com/catboost/catboost (accessed on 27 December 2025).


Disclaimer/Publisher’s Note: The statements, opinions and data contained in all publications are solely those of the individual author(s) and contributor(s) and not of MDPI and/or the editor(s). MDPI and/or the editor(s) disclaim responsibility for any injury to people or property resulting from any ideas, methods, instructions or products referred to in the content. |
© 2026 by the authors. Licensee MDPI, Basel, Switzerland. This article is an open access article distributed under the terms and conditions of the Creative Commons Attribution (CC BY) license.