Abstract
The field deployment of low-cost air quality sensor systems enables enhanced spatial resolution in air quality monitoring. Although these sensor systems cannot achieve the same accuracy as regulatory monitoring stations, they can attain acceptable levels of confidence and provide Indicative Measurements as regulated by Ambient Air Quality EU Directive. The integration of an anemometer into a system can provide additional information for the classification of the measurement area, the identification of potential sources of pollutant emissions, and the assessment of the device’s operating conditions during measurement. In this study, the measurement capabilities of an Airbox, a low-cost air quality sensor system, were extended through the integration of a DW6410 anemometer (Davis Instruments). The Airbox, designed to transmit data in real-time or near real-time to servers and IoT platforms, was deployed for a duration of 4 months, from October 2021 to February 2022, within the airport area of Grottaglie (Southern Italy). The anemometric measurements and particulate concentration data (PM2.5 and PM10, measured by NextPM sensor, Tera Sensor) were integrated and compared to meteorological open data and data from a regulatory regional air quality control network located in the area around the airport.
1. Introduction
The environment and public health are daily exposed to the aggressive action of polluting agents, leading to serious risks of the onset of pathologies that can evolve dramatically over time, particularly in vulnerable people. Air pollution is one of the recognized causes [1]. Following shared regulatory guidelines [2,3], many countries have designed, installed and currently maintain local networks of Air Quality Monitoring Stations (AQMSs), fulfilling rigorous standards to accurately record the concentration levels of pollutants. However, AQMSs have a high cost of management and maintenance, and they are not uniformly and widely distributed spatially.
Low-Cost Sensor Systems (LCSSs) for air quality can supplement regulatory monitoring networks and provide Indicative Measurements [3], thereby enhancing the understanding of pollution levels and dispersion. The LCSSs constitute an additional contribution to air pollution monitoring. In fact, they are receiving growing attention [4,5], and an increasing number of studies are evaluating their application [6,7,8,9].
The United Nations has directed attention to pollution control in general, and air pollution in particular, by explicitly including ‘Mortality rate attributed to household and ambient air pollution’ (Indicator 3.9.1) and ‘Annual mean levels of fine particulate matter (e.g., PM2.5 and PM10) in cities (population weighted)’ (Indicator 11.6.2) among the indicators of the 17 Sustainable Development Goals (SDGs) for 2030 [10].
Moreover, pollution is closely linked to meteorological conditions, with particularly severe implications associated with heat [11], and knowledge of the anemometric conditions at measurement sites provides valuable information both for forecasting systems and for assessing the potential quality of the measurements.
This work presents the field experience of an LCSS developed by ENEA, the Airbox [12,13,14], in which anemometric measurements supplement particulate matter data (PM2.5 and PM10). The Airbox, installed in the airport area of Grottaglie (Southern Italy), approximately 15 km east of Taranto—a city characterized by significant industrial activity (i.e., steel and cement plants, petrochemical refinery)—enabled a combined analysis of air pollution and wind-related parameters, providing an integrated view of the environmental conditions at the measurement site.
2. Methods
2.1. The Low-Cost Sensor System for Air Quality Measurements: Airbox
The activities presented in this work refer to field measurements performed using the Airbox, a custom-built LCSS based on a Raspberry Pi single-board computer, which, due to its compact size, processing power, and extensive availability of I/O interfaces, enables the connection of various sensor types and the management of their measurement data (Figure 1). In the design of the Airbox, the Raspberry Pi 2 was selected over subsequent Raspberry Pi generations due to its lower power consumption and reduced heat generation. The Airbox allows real-time transmission of measurement data to a remote server via mobile network connection for remote data consultation and functionality checks. Additionally, the data are stored locally on a microSD card to handle potential mobile network interruptions. A compact UPS integrates with the Airbox auxiliary systems to buffer sudden power supply interruptions.
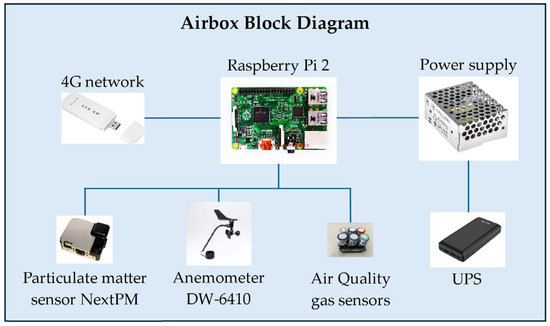
Figure 1.
Block diagram of the LCSS Airbox.
The integrated sensors within the Airbox for the objectives of this work consist of a NextPM optical particulate sensor (TERA Sensor, Rousset, France) for PM2.5 and PM10 measurements and a cup anemometer with a wind vane DW-6410 (Davis Instruments, Hayward, CA, USA) for measurements of the horizontal components of wind speed and wind direction. The NextPM optical particulate sensor also provides measurements of PM1; however, these measurements are not considered in the present work.
Key parameters of the LCSS Airbox and its measurement sensors are summarized in Table 1.

Table 1.
Parameters of the LCSS Airbox.
2.2. In-Field Positioning of the Instrumentation
The Airbox was installed in the Taranto–Grottaglie “Marcello Arlotta” airport area, close to the airport control tower (Latitude 40°30′52.7″ N, Longitude 17°23′59.3″ E), on a balcony at an approximate height of 12 m above ground level. The airport is located near the town of Grottaglie and approximately 15 km from the city of Taranto, which features a large industrial area that negatively impacts air quality in terms of pollution.
The Airbox, together with the anemometer, was mounted on a pole secured to the ground using concrete blocks (Figure 2). The anemometer head was installed at an elevation greater than 3 m above the balcony floor level.
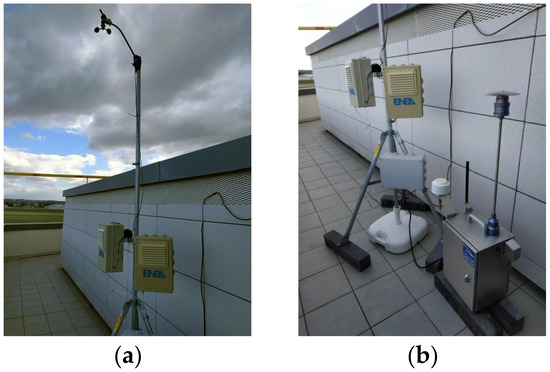
Figure 2.
In-field positioning of the Airbox sensors. (a) Airbox sensors and head of the DW-6410 anemometer; (b) Airbox sensors and reference instrumentation for particulate matter measurement.
Simultaneously, reference instrumentation for particulate matter, the APM-2 monitor (Comde-Derenda GmbH, Stahnsdorf, Germany), was positioned at approximately 1 m. Both the suction head of reference instrumentation and Airbox inlet were at the same height (approx. 1 m) from the floor.
The installation point of the Airbox features, to the East, the high-strength steel structure of the control tower, and immediately to the South, a wall that does not obstruct the anemometer.
The measurement campaign was initiated on 5 October 2021 and spanned a duration exceeding 125 calendar days, concluding on 8 February 2022. Access to the instrumentation was restricted during the measurement campaign period according to a predefined schedule, due both to airport access policies and to limitations imposed by the COVID-19 emergency. Consequently, it was not possible to carry out interventions to assess operational anomalies reported by the Airbox control system software outside the previously agreed schedule.
2.3. Open Data Sources for Comparative Measurement Analysis
In order to establish reference terms for the anemometric measurements, access was made to the open data provided by Open-Meteo [15], which offers Application Programming Interfaces (APIs) [16] for retrieving historical meteorological data. The Historical Weather API generates historical meteorological data by combining observations from global weather stations, satellite inputs, and advanced numerical models [17,18,19]. The API reconstructs past weather conditions and provides hourly or daily data on meteorological variables, including wind speed and direction at 10 m above ground level.
The data obtained from Open-Meteo are related to the specific temporal period and the precise coordinates of the instrumentation’s deployment.
Open data from 13 of the 14 fixed monitoring stations in the Air Quality Monitoring Network of the Regional Environmental Protection Agency of Apulia, ARPA Puglia [20], located in the area surrounding Grottaglie Airport, were used for comparison with PM2.5 and PM10 sensor measurements. Characteristics of the ARPA Puglia selected stations are shown in Appendix A.
2.4. Analysis and Comparison of Measurement Data
The Airbox acquired data at a frequency of one record every 10 s. From the raw data, hourly average values were computed for hours containing at least 75% valid raw data, and daily average values were calculated for days with at least 75% valid hourly data.
The aggregated meteorological data provide maximum wind speed values, which, in the case of the Airbox, were determined as the highest of the mean wind speed values recorded over the reference period (daily or hourly), calculated using 10 min intervals (, commonly adopted for forecasting purposes [21]) and 2 min intervals (, i.e., as used for services for air navigation [22]).
The computation of wind direction averages was carried out following [23].
The daily mean values were compared with open data using Pearson coefficient (), the coefficient of determination (), the mean absolute difference (), and the root mean square difference (), and they were statistically summarized as a function of wind direction. The definition of the metrics is provided in Appendix B.
To account for the effects of air movements on the transport and dispersion of particulate matter, the calculation of the daily pollutant flux was employed, defined as the product of the hourly mean wind speed and the pollutant concentration hourly mean values :
in which the subscript i denotes the values corresponding to the i-th hour of the day and the daily value was corrected using a factor accounting for the number of hours in the day with valid hourly averages. This assumption corresponds to assigning the hours with invalid or missing data a contribution equivalent to the mean of the hours with valid data.
Daily mean values of particulate matter flux were calculated for each wind direction sector.
3. Results
The Airbox enabled validation of daily average measurements for 113 out of 125 operational days, corresponding to 90.4% of the monitoring period: the days for which validated daily data are unavailable correspond almost exclusively to acquisition failures due to power supply interruptions.
Regarding anemometric measurements, Figure 3 displays the daily wind speed values (top panel) and the maximum wind speed values (bottom panel), where the daily maximum wind speed for the Airbox was determined as the highest recorded value among the non-overlapping 2 min average wind speed intervals . The mean wind speed during the measurement period was 2.6 m/s, while the maximum of the sustained wind speed peaks () reached a value of 17.9 m/s. The comparison with Open-Meteo data produced metrics that are summarized in Table 2.
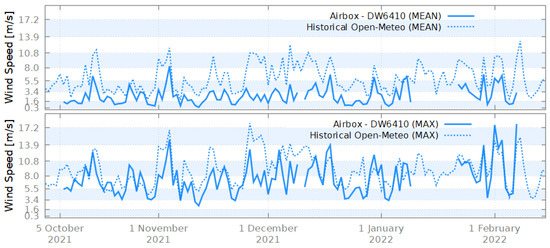
Figure 3.
Daily wind speed values (top panel) and maximum sustained wind speed values (bottom panel); horizontal shaded areas differentiate the wind speed classes in accordance with the Beaufort scale definition [21].
Table 2.
Metrics referring to the comparison between daily mean wind speed from measurements and reference data.
With regard to particulate measurements, the comparison with reference instrumentation indicated [24], for PM10, a good agreement with R2 values equal to 0.877, whereas for PM2.5, the R2 value was 0.504.
During the 113 days of validated measurements (Figure 4), PM2.5 values in 72 days (63.7%) and PM10 values in 112 days (99.1%) fell within the ‘Good’ classification level (green color in Figure 4) of the Air Quality Index (AQI) [25], while the remaining days were confined to the ‘Moderate’ level (yellow color) of the AQI.
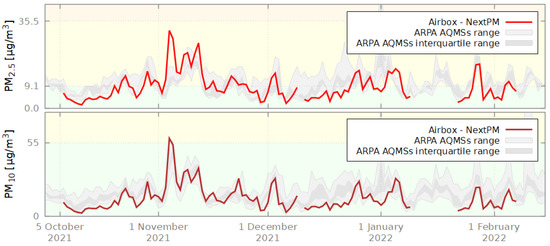
Figure 4.
Daily concentration values of PM2.5 (top panel) and PM10 (bottom panel); the shaded gray bands indicate the range of variation between the minimum and maximum values and interquartile range, recorded by the regulatory stations of the ARPA Puglia AQMSs (4 stations for PM10 and 13 stations for PM2.5); background colors indicate the AQI classification levels according to [25].
The mean concentrations during the measurement period were 8.7 µg/m3 for PM2.5 and 13 µg/m3 for PM10, while the maximum daily concentrations reached values of 31.7 µg/m3 for PM2.5 and 58 µg/m3 for PM10.
The final time series, shown in Figure 5, displays the calculated data of particulate fluxes. The profiles of the two particulate classifications exhibit variations of differing magnitudes, compared to those shown in Figure 4, due to the scaling factor associated with the intensity of air movements. In particular, a distinct peak is observed—the only one to exceed the graph scale—on 4 November 2021. On this day, the combination of relatively elevated concentrations and above-average wind speeds resulted in a calculated flux peak of 263.1 µg/m2/s for PM2.5 and 483.1 µg/m2/s for PM10. This value is considerably higher than the averages over the measurement period, calculated as 21.5 µg/m2/s and 34.7 µg/m2/s, and could reasonably be classified as an outlier in the context of different types of analyses.
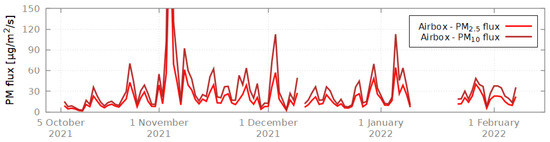
Figure 5.
Daily mean values of PM2.5 and PM10 particulate matter fluxes.
A summary of the statistics related to the time series is provided in Appendix C.
The statistical classification based on wind direction sectors is summarized in Figure 6, and the aggregated values show prevailing components of the wind direction during the period that do not significantly deviate from the airport runway alignment, i.e., 170/350 degrees clockwise from north.
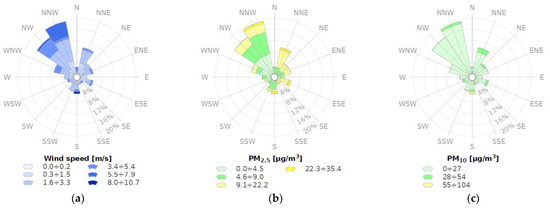
Figure 6.
Wind rose plot of daily average values measured by the Airbox for wind speed (a), PM2.5 concentration (b), and PM10 concentration (c). In panel (a), different color shades correspond to the Beaufort wind speed classes [21], whereas in panels (b,c), distinct colors represent categories of the Air Quality Index (AQI) [25].
For each sector, average values of wind speed and particulate matter concentrations were calculated, as shown in Figure 7, along with the particulate fluxes derived from Equation (1). In this case as well, the previously identified day, 4 November 2021, marked by a peak in particulate matter fluxes, has a significant influence on the statistics for the wind source sector, as can also be observed in panel (c) of Figure 7.
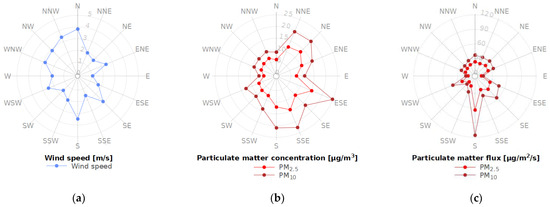
Figure 7.
Polar plot of daily average values measured by the Airbox for wind speed (a), particulate matter concentration (b), and particulate matter flux (c) calculated accordingly to Equation (1).
4. Discussion and Conclusions
The integration of an anemometer into the LCSS Airbox enabled a more comprehensive assessment of environmental conditions, and the wind speed measurements showed good agreement when compared with Open-Meteo historical reanalysis data.
A discrepancy was to be expected, given that the measurement point was not optimally positioned from an anemometric standpoint, being located on the edge of a building and exposed to turbulence caused by nearby structures. This is, however, a condition commonly encountered in urban and semi-urban environments, which characterizes many environmental measurements.
The combination of anemometric data and pollutant measurements highlights the importance of an integrated perspective, as even moderate concentration levels, when coupled with significant wind speeds, can result in substantial pollutant fluxes.
While in some cases, air movements can dilute pollutant concentrations, in other situations, they may exacerbate conditions, for instance, during desert dust advection events [13]. Moreover, sustained wind speeds can affect the quality and reliability of measurements, particularly in the case of low-cost systems, due to both sensor characteristics and system architecture.
The measurement campaign with the Airbox demonstrated the importance of combined measurements in identifying factors that may interfere with data quality and in providing a more comprehensive understanding of environmental conditions.
The Airbox demonstrates the capability to communicate in real-time with dedicated servers and is well-suited for integration into the IoT ecosystem for information sharing.
Future work aims to enhance the combined analysis of measurements and the dissemination of their summaries through approaches that facilitate understanding for non-expert individuals.
Author Contributions
Conceptualization, V.P.; data curation, V.P. and M.P. (Mario Prato); formal analysis, V.P.; funding acquisition, M.P. (Michele Penza); investigation, V.P. and M.P. (Mario Prato); methodology, V.P.; project administration, V.P. and M.P. (Michele Penza); resources, V.P. and M.P. (Mario Prato); software, V.P. and M.P. (Mario Prato); supervision, V.P. and M.P. (Michele Penza); validation, V.P.; visualization, V.P.; writing—original draft preparation, V.P. and M.P. (Michele Penza); writing—review and editing, V.P., M.P. (Mario Prato), and M.P. (Michele Penza). All authors have read and agreed to the published version of the manuscript.
Funding
This work was financially supported by the Italian project RPASinAir—Integration of Remotely Piloted Aircraft Systems in unsegregated airspace for services—under the PON ARS01_00820 funding grant of the Italian Ministry of Education, University and Research (MIUR).
Institutional Review Board Statement
Not applicable.
Informed Consent Statement
Not applicable.
Data Availability Statement
Dataset is available on request from the authors. Open data from ARPA Puglia is available online: http://old.arpa.puglia.it/web/guest/qariainq2 (in Italian) (accessed on 12 August 2025). Historical weather open data from Open-Meteo is available online: https://open-meteo.com/en/docs/historical-weather-api (accessed on 12 August 2025).
Acknowledgments
The authors wish to thank ENAC and AdP (Aeroporti di Puglia) for access to Taranto–Grottaglie “Marcello Arlotta” Airport and DTA for in-airport escort and logistic support services.
Conflicts of Interest
The authors declare no conflicts of interest. The funders had no role in the design of the study; in the collection, analyses, or interpretation of data; in the writing of the manuscript; or in the decision to publish the results.
Appendix A
Table A1.
Characteristics of the ARPA Puglia air quality monitoring stations in the region surrounding Grottaglie Airport during the measurement campaign.
Table A1.
Characteristics of the ARPA Puglia air quality monitoring stations in the region surrounding Grottaglie Airport during the measurement campaign.
| Station | Line-of-Sight Distance [km] | Azimuth * [°] | Relative Geographical Location in Relation to the Airport | Type | Pollutants of Interest for This Work ** | |
|---|---|---|---|---|---|---|
| PM10 | PM2.5 | |||||
| Grottaglie | 3.3 | 38.0 | NE | Urban Background | + | - |
| Ceglie Messapica | 17.7 | 32.5 | NNE | Urban Background | + | + |
| Francavilla Fontana | 16.0 | 84.0 | E | Urban Traffic | - | - |
| Taranto–Talsano | 15.1 | 220.5 | SW | Urban Background | + | - |
| Taranto–San Vito | 17.9 | 235.5 | SW | Urban Background | + | - |
| Taranto–Alto Adige | 13.0 | 242.5 | WSW | Urban Traffic | + | + |
| Taranto–Machiavelli | 15.0 | 259.0 | W | Industrial | + | + |
| Taranto–Archimede | 14.3 | 261.0 | W | Industrial | + | + |
| Taranto–CISI | 12.4 | 273.0 | W | Industrial | + | + |
| Statte–Ponte Wind | 19.2 | 274.0 | W | Industrial | + | - |
| Statte–Sorgenti | 17.4 | 288.0 | WNW | Industrial | + | - |
| Massafra | 25.5 | 290.0 | WNW | Industrial | + | - |
| Martina Franca | 21.5 | 344.5 | NNW | Urban Traffic | + | - |
| Cisternino | 25.4 | 3.0 | N | Urban Background | + | - |
* Angular distance from North, measured clockwise. ** Symbols list: ‘+’ Data available; ‘-’ Data not available.
Appendix B
This section provides the definitions of the metrics employed in this study, where denotes the series of measurements, denotes the reference data used for comparison and and are their respective mean values.
Mean Absolute Difference ():
Root Mean Square Difference ():
Pearson Correlation Coefficient ():
Coefficient of Determination ():
Appendix C
Table A2.
Statistics on the daily values of the parameters measured or calculated during the four-month measurement campaign conducted with the LCSS Airbox at Grottaglie Airport.
Table A2.
Statistics on the daily values of the parameters measured or calculated during the four-month measurement campaign conducted with the LCSS Airbox at Grottaglie Airport.
| Daily Parameter | Mean | Minimum | 1st Quartile | Median | 3rd Quartile | Maximum |
|---|---|---|---|---|---|---|
| Wind speed [m/s] | 2.6 | 0.4 | 1.3 | 2.2 | 3.4 | 8.3 |
| Sustained speed V120 [m/s] | 7.6 | 2.3 | 5.2 | 6.9 | 9.7 | 17.9 |
| Sustained speed V600 [m/s] | 6.6 | 1.6 | 4.4 | 6.2 | 8.5 | 15.5 |
| PM2.5 [µg/m3] | 8.7 | 1.4 | 4.3 | 7.0 | 11.0 | 31.7 |
| PM10 [µg/m3] | 13 | 2 | 7 | 11 | 17 | 58 |
| PM2.5 flux [µg/m2/s] | 21.5 | 1.6 | 9.8 | 16.1 | 25.4 | 263.1 |
| PM10 flux [µg/m2/s] | 34.7 | 2.7 | 14.2 | 23.4 | 38.4 | 483.1 |
References
- World Health Organization. Air Pollution Data Portal. Available online: https://www.who.int/data/gho/data/themes/air-pollution (accessed on 12 August 2025).
- World Health Organization. WHO Global Air Quality Guidelines: Particulate Matter (PM2.5 and PM10), Ozone, Nitrogen Dioxide, Sulfur Dioxide and Carbon Monoxide; WHO: Geneva, Switzerland, 2021; Available online: https://iris.who.int/handle/10665/345329 (accessed on 12 August 2025).
- European Union. Directive (EU) 2024/2881 of the European Parliament and of the Council of 23 October 2024 on ambient air quality and cleaner air for Europe. Official Journal of the European Union, L 2024/2881, 2024. Available online: https://eur-lex.europa.eu/legal-content/EN/TXT/?uri=OJ:L_202402881 (accessed on 12 August 2025).
- World Meteorological Organization (WMO). Integrating Low-Cost Sensor Systems and Networks to Enhance Air Quality Applications; GAW Report No. 293; WMO: Geneva, Switzerland, 2024. [Google Scholar]
- UNEP. Monitoring Air Quality. United Nations Environment Programme. Available online: https://www.unep.org/topics/air/monitoring-air-quality/monitoring-air-quality (accessed on 12 August 2025).
- Mead, M.I.; Popoola, O.A.M.; Stewart, G.B.; Landshoff, P.; Calleja, M.; Hayes, M.; Baldovi, J.J.; McLeod, M.W.; Hodgson, T.F.; Dicks, J.; et al. The Use of Electrochemical Sensors for Monitoring Urban Air Quality in Low-Cost, High-Density Networks. Atmos. Environ. 2013, 70, 186–203. [Google Scholar] [CrossRef]
- Borrego, C.; Costa, A.M.; Ginja, J.; Amorim, M.; Coutinho, M.; Karatzas, K.; Sioumis, T.; Katsifarakis, N.; Konstantinidis, K.; De Vito, S.; et al. Assessment of air quality microsensors versus reference methods: The EuNetAir joint exercise. Atmos. Environ. 2016, 147, 246–263. [Google Scholar] [CrossRef]
- Castell, N.; Dauge, F.R.; Schneider, P.; Vogt, M.; Lerner, U.; Fishbain, B.; Broday, D.; Bartonova, A. Can commercial low-cost sensor platforms contribute to air quality monitoring and exposure estimates? Environ. Int. 2017, 99, 293–302. [Google Scholar] [CrossRef] [PubMed]
- Motlagh, N.H.; Lagerspetz, E.; Nurmi, P.; Li, X.; Varjonen, S.; Mineraud, J.; Siekkinen, M.; Rebeiro-Hargrave, A.; Hussein, T.; Petäjä, T.; et al. Toward Massive Scale Air Quality Monitoring. IEEE Commun. Mag. 2020, 58, 54–59. [Google Scholar] [CrossRef]
- United Nations. The 17 Goals|Sustainable Development. Available online: https://sdgs.un.org/goals (accessed on 12 August 2025).
- Stafoggia, M.; Michelozzi, P.; Schneider, A.; Armstrong, B.; Scortichini, M.; Rai, M.; Achilleos, S.; Alahmad, B.; Analitis, A.; Åström, C.; et al. Joint effect of heat and air pollution on mortality in 620 cities of 36 countries. Environ. Int. 2023, 181, 108258. [Google Scholar] [CrossRef] [PubMed]
- Penza, M.; Suriano, D.; Pfister, V.; Prato, M.; Cassano, G. Urban air quality monitoring with networked low-cost sensor-systems. Proceedings 2017, 1, 573. [Google Scholar] [CrossRef]
- Penza, M.; Suriano, D.; Pfister, V.; Prato, M.; Cassano, G. Wireless Sensors Network Monitoring of Saharan Dust Events in Bari, Italy. Proceedings 2018, 2, 898. [Google Scholar] [CrossRef]
- Penza, M.; Pfister, V.; Suriano, D.; Dipinto, S.; Prato, M.; Cassano, G. Application of Low-Cost Sensors in Stationary and Mobile Nodes for Urban Air Quality Index Monitoring. Eng. Proc. 2023, 48, 62. [Google Scholar] [CrossRef]
- Open-Meteo. Free Open-Source Weather API. Available online: https://open-meteo.com/ (accessed on 12 August 2025).
- Zippenfenig, P. Open-Meteo.com Weather API, version 1.4.0; Zenodo, 2023. Available online: https://zenodo.org/records/14582479 (accessed on 12 August 2025).
- Muñoz, S. ERA5-Land Hourly Data from 2001 to Present; Copernicus Climate Change Service (C3S) Climate Data Store (CDS); European Centre for Medium-Range Weather Forecasts (ECMWF): Reading, UK, 2019. [Google Scholar] [CrossRef]
- Schimanke, S.; Ridal, M.; Le Moigne, P.; Berggren, L.; Undén, P.; Randriamampianina, R.; Andrea, U.; Bazile, E.; Bertelsen, A.; Brousseau, P.; et al. CERRA Sub-Daily Regional Reanalysis Data for Europe on Single Levels from 1984 to Present; Copernicus Climate Change Service (C3S) Climate Data Store (CDS); European Centre for Medium-Range Weather Forecasts (ECMWF): Reading, UK, 2021. [Google Scholar] [CrossRef]
- Hersbach, H.; Bell, B.; Berrisford, P.; Biavati, G.; Horányi, A.; Muñoz Sabater, J.; Nicolas, J.; Peubey, C.; Radu, R.; Rozum, I.; et al. ERA5 Hourly Data on Single Levels from 1940 to Present; Copernicus Climate Change Service (C3S) Climate Data Store (CDS); European Centre for Medium-Range Weather Forecasts (ECMWF): Reading, UK, 2023. [Google Scholar] [CrossRef]
- ARPA Puglia, Regional Environmental Protection Agency of Apulia. Available online: https://www.arpa.puglia.it/ (accessed on 12 August 2025). (In Italian).
- World Meteorological Organization (WMO). Guide to Instruments and Methods of Observation. Volume I—Measurement of Meteorological Variables, 2024 Edition; WMO-No. 8; WMO: Geneva, Switzerland, 2024. [Google Scholar]
- World Meteorological Organization (WMO). Technical Regulations, Volume II—Meteorological Service for International Air Navigation, 2018 Edition; WMO-No. 49; Basic Documents No. 2; Updated in 2021; WMO: Geneva, Switzerland, 2021. [Google Scholar]
- Mori, Y. Methods for Estimating the Mean and the Standard Deviation of Wind Direction. J. Appl. Meteorol. Climatol. 1987, 26, 1282–1284. [Google Scholar] [CrossRef]
- Pfister, V.; Prato, M.; Penza, M. Field Performance Evaluation of Air Quality Low-Cost Sensors Deployed in a Near-City Space-Airport. Eng. Proc. 2023, 48, 27. [Google Scholar] [CrossRef]
- United States Environmental Protection Agency. EPA-454/B-24-002—Technical Assistance Document for the Reporting of Daily Air Quality—The Air Quality Index (AQI); United States EPA-Environmental Protection Agency Office of Air Quality Planning and Standards: Durham, NC, USA, 2024.


Disclaimer/Publisher’s Note: The statements, opinions and data contained in all publications are solely those of the individual author(s) and contributor(s) and not of MDPI and/or the editor(s). MDPI and/or the editor(s) disclaim responsibility for any injury to people or property resulting from any ideas, methods, instructions or products referred to in the content. |
© 2025 by the authors. Licensee MDPI, Basel, Switzerland. This article is an open access article distributed under the terms and conditions of the Creative Commons Attribution (CC BY) license (https://creativecommons.org/licenses/by/4.0/).