Proceeding Paper

On the Developing Network of Adiabatic Shear Bands During High Strain-Rate Forging Process: A Parametric Study on the Effect of Specimen Aspect Ratio †

by
Konstantina D. Karantza
* and
Dimitrios E. Manolakos
Laboratory of Manufacturing Technology, School of Mechanical Engineering, National Technical University of Athens, Heroon Polytechniou 9, 15780 Athens, Greece
*
Author to whom correspondence should be addressed.
Presented at the 8th International Conference of Engineering Against Failure (ICEAF VIII), Kalamata, Greece, 22–25 June 2025.
Eng. Proc. 2025, 119(1), 36; https://doi.org/10.3390/engproc2025119036
Published: 23 December 2025
(This article belongs to the Proceedings of The 8th International Conference of Engineering Against Failure)

Abstract

The present work studies the developing network of adiabatic shear bands (ASBs) during dynamic plane strain compression of orthogonal AISI 1045 steel billets, aiming to investigate the ASB trajectories and their evolution mechanism. This paper conducts a finite element (FE) numerical analysis in LS-DYNA software, developing a doubly coupled analysis by combining both structural–thermal and structural–damage couplings. The Modified Johnson–Cook (MJC) formulas are considered for modeling both the material plasticity and damage law, implementing thermo-viscoplastic numerical approaches, while a critical temperature for material failure is further adjusted. Finally, the case study relates to a parametric analysis of specimen aspect ratio, aiming to reveal its effect on the developing ASB network and its propagating characteristics.

1. Introduction

During high-speed metal forming, the dynamic deformation conditions under high strain rates activate unstable mechanisms that are strongly conjugated to the dynamic and catastrophic fracture. Adiabatic shear banding (ASB) is such an unstable mechanism occurring at high strain rates and high strain levels, leading to uncontrollable strain evolution and rapid failure. The mechanism initially is manifested by severe shear localization along narrow bands, reacting to intense strain energy density due to narrowly localized high shear strain magnitude. Almost 90% of that plastic work is converted to internal heat according to the Taylor–Quinney coefficient, although Rittel et al. [1] have indicated its value depends on material, strain level, and loading condition. So, the high strain rate does not allow enough time for thermal diffusion, providing adiabatic conditions, and in that way, the produced heat remains trapped inside the ASB, resulting in significant temperature increase and thermal softening. Therefore, the damage evolution is facilitated, leading to dynamic failure. For this reason, ASB has been described as thermo-mechanical shearing instability [2,3].
The ASB formation during dynamic plane strain compression has attracted an important amount of research interest. Specifically, Harren et al. [4] studied Al-3%wt Cu alloy under plane strain compression, showing that ASB initiation occurs at the instability point or slightly later, while damage softening is not necessarily a prerequisite for ASB genesis. Coarse slip was found to precede ASB, expanding through entire grains in case of single crystals, and along grain boundaries in polycrystals where the texture softening of single crystals, and along grain boundaries in polycrystals where the texture softening was indicated as the main cause of instability. Also, Anand and Spitzig [5] investigated the shear band genesis of aged maraging steel subjected to plane strain compression. A shear banding orientation was captured, while their work provided a theoretical ~55° shear banding orientation was captured, while their work provided a theoretical expression for the critical strain needed to initiate shear localization. However, experimental tests provided deviations compared to the analytic relations regarding the ASB genesis point. In addition, Prakash et al. [6] worked on the formation of macroscopic ASBs (MASBs) in aluminum alloys under plane strain compression at different temperatures of 298 and 573 K. The results showed that the low Al series did not form MASBs in contrast to the Al-6%wt Mg alloy, which formed diagonal MASBs at 20% strain and 573 K, revealing high hardness and misorientation with elongated and fragmented grains. However, the conducted simulations underestimated the critical strain, showing an earlier ASB initiation. Tang et al. [7] studied the ASB formation in Inconel 718 superalloy during both plane strain and uniaxial axisymmetric compression, revealing more intense shear bands under plane strain conditions, whose propagating paths attributed to them an X-shape or an S-shape. In fact, X-shaped bands exhibited at lower strain and higher temperature, while the formation of S-shaped bands required more severe deformation conditions.
The present work studies the ASB developing characteristics of AISI 1045 steel orthogonal billets during high-strain-rate and plane-strain compression. A FE numerical analysis is carried out in LS-DYNA software, developing a doubly coupled FE analysis by implementing both structural–thermal and structural–damage couplings. The Modified Johnson–Cook (MJC) plasticity flow rule and damage law are implemented, allowing for a thermo-viscoplastic approach for both the material model and damage evolution, while a temperature-dependent damage criterion is also adjusted, introducing a critical temperature for material failure. The doubly coupled analysis allows for initially capturing the influence of both thermal and damage-softening mechanisms, which are the most dominant ones on ASB genesis and evolution, while further, the numerical interaction between them due to the double coupling also allows for evaluating their impact level during their competition. Finally, a parametric study on the specimen aspect ratio is conducted, aiming to analyze its effect on the developing ASB network, focusing on their formation and their shape, as well as the size and expanding characteristics, like their width, spacing, and length.

2. Materials and Methods

FE Modeling

The case study of this work contains the numerical simulations of the dynamic plane strain compression of AISI 1045 steel specimens. Different specimen aspect ratios (height-to-base ratio) are examined, with the specimen height remaining constant at 5 mm. The examined aspect ratio values are 0.75–1–1.25. In each case, a constant compressing velocity of 20 m/s is considered, providing an initial strain rate of 4000 s−1.
The numerical simulations in this study are conducted in the LS-DYNA software (Livermore Software Technology Corporation, Livermore, CA, USA) through an FE analysis, employing LS-PrePost-4.3 for modeling development and post analysis purposes. The 2D physical plane of the problem is simulated due to plane strain conditions, and so a 2D Lagrangian-type solid element mesh of 4-node quadrilateral elements is generated with an initial size of 10 µm and 250,000 elements. The r-adaptive remeshing technique is applied to prevent instability caused by the massive mesh distortion due to severe shear deformation. Also, the Flanagan–Belytschko stiffness formula is adjusted to control the hourglass element deformation, avoiding computational instabilities and zero-energy deformation modes [8].
In order to prevent the penetration between the interacting surfaces, contact algorithms are utilized for applying the necessary boundary conditions. Thus, a 2D surface-to-surface algorithm is adjusted to avoid any penetration between the steel specimen and the compressing plates, while a 2D single-surface algorithm is implemented for preventing the self-penetration of the steel sample in the case of the interacting cracking edges inside the material microstructure during the damage evolution and the failure progress. The applied boundary conditions were related to kinematic and strain constraints, enforcing the specimen’s bottom end to be clamped and the upper end to be constantly compressed by the load adjustment. Finally, the plain strain computations were adjusted, constraining the normal deformation to the cross-section.
For modeling the material plasticity, the MJC model is considered, offering a thermo-viscoplastic approach for the computation of plastic flow stress σ from Equation (1). The MJC relation consists of the strain-hardening term, depending on damage-equivalent strain r, the strain rate hardening term, depending on the normalized damage-equivalent strain rate r ˙ expressed in Equation (2) with respect to the damage-equivalent strain rate r ˙ and the reference strain rate ε ˙ 0 ; and the thermal softening term, depending on the homologous temperature T*, as defined in Equation (3). A, B, C, m, and n are the MJC material parameters, while T* provides a dimensionless temperature value about the material temperature T, the melting point Tm, and the room temperature Tr.
σ = ( A + B · r n ) · 1 + r ˙ C · ( 1 T m )
r ˙ = r ˙ ε ˙ 0
T = T T r T m T r
In fact, r and r ˙ refer to the damage-equivalent strain and strain rate fields computed by the equivalent plastic strain ε ¯ p and strain rate ε ¯ ˙ p in Equations (4) and (5), together with the damage evolution D and the damage-coupling parameter β, which is set to 1 for full damage coupling. In addition, the MJC damage model calculates the plastic strain failure εf as described in Equation (6), with respect to a thermo-viscoplastic approach, again depending on the stress triaxiality σ , the normalized strain rate ε ˙ , and the homologous temperature. Specifically, σ is computed as the ratio between the hydrostatic pressure σH and the equivalent Mises stress σeq, as shown in Equation (7), while ε ˙ is defined in Equation (8).
r = ε ¯ p ( 1 β · D )
r ˙ = ε ¯ ˙ p ( 1 β · D )
ε f = ( D 1 + D 2 · e x p ( D 3 σ ) ) · 1 + ε ˙ D 4 · ( 1 + D 5 Τ )
σ = σ H σ e q
ε ˙ = ε ¯ ˙ p ε ˙ 0
Therefore, the D-parameter is computed via the equivalent plastic strain field with respect to the strain failure in Equation (9), reflecting the damage evolution. In fact, the failure condition is considered to be exhibited when the D-parameter becomes equal to D c =   1, or the material temperature reaches a critical value equal to Tm, resulting in element erosion. Moreover, the damage computational part calculates a damage-equivalent Mises stress σ ~ e q , as expressed in Equation (10), reflecting the stress increase due to damage softening. Following, Equation (11) provides the relation for the produced plastic work rate W ˙ p , which reacts to the temperature increase rate T / t computed via the heat conduction equation by neglecting the diffusion term due to adiabatic condition, as shown in Equation (12), with ρ and Cp being the material density and specific heat, respectively, and χ the Taylor–Quinney coefficient for work-to-heat energy conversion.
Δ D = D c Δ ε ¯ p ε f
σ ~ e q = σ e q ( 1 β · D )
W ˙ p = r ˙ σ ~ e q = ε ¯ ˙ p σ e q
T t = χ W ˙ p ρ C p
Therefore, Figure 1 depicts the schematic of the doubly coupled analysis, revealing that the coupling between the structural and thermal computational fields comes from the fact that the structural part computes the plastic strain energy, which is converted to heat via the Taylor–Quinney coefficient and is fed to the thermal part, which in turn calculates the temperature increase and feeds it back to the structural part for computing the temperature effect on the plastic flow stress and strain failure. On the other hand, the coupling between the structural and the damage fields comes from the fact that the structural part computes the damage evolution via strain failure and damage extent, while the damage part feeds back the damage-equivalent stress and strain fields. Finally, Table 1 summarizes the material mechanical properties and MJC parameters for the constitutive relation and damage law.

3. Modeling Validation

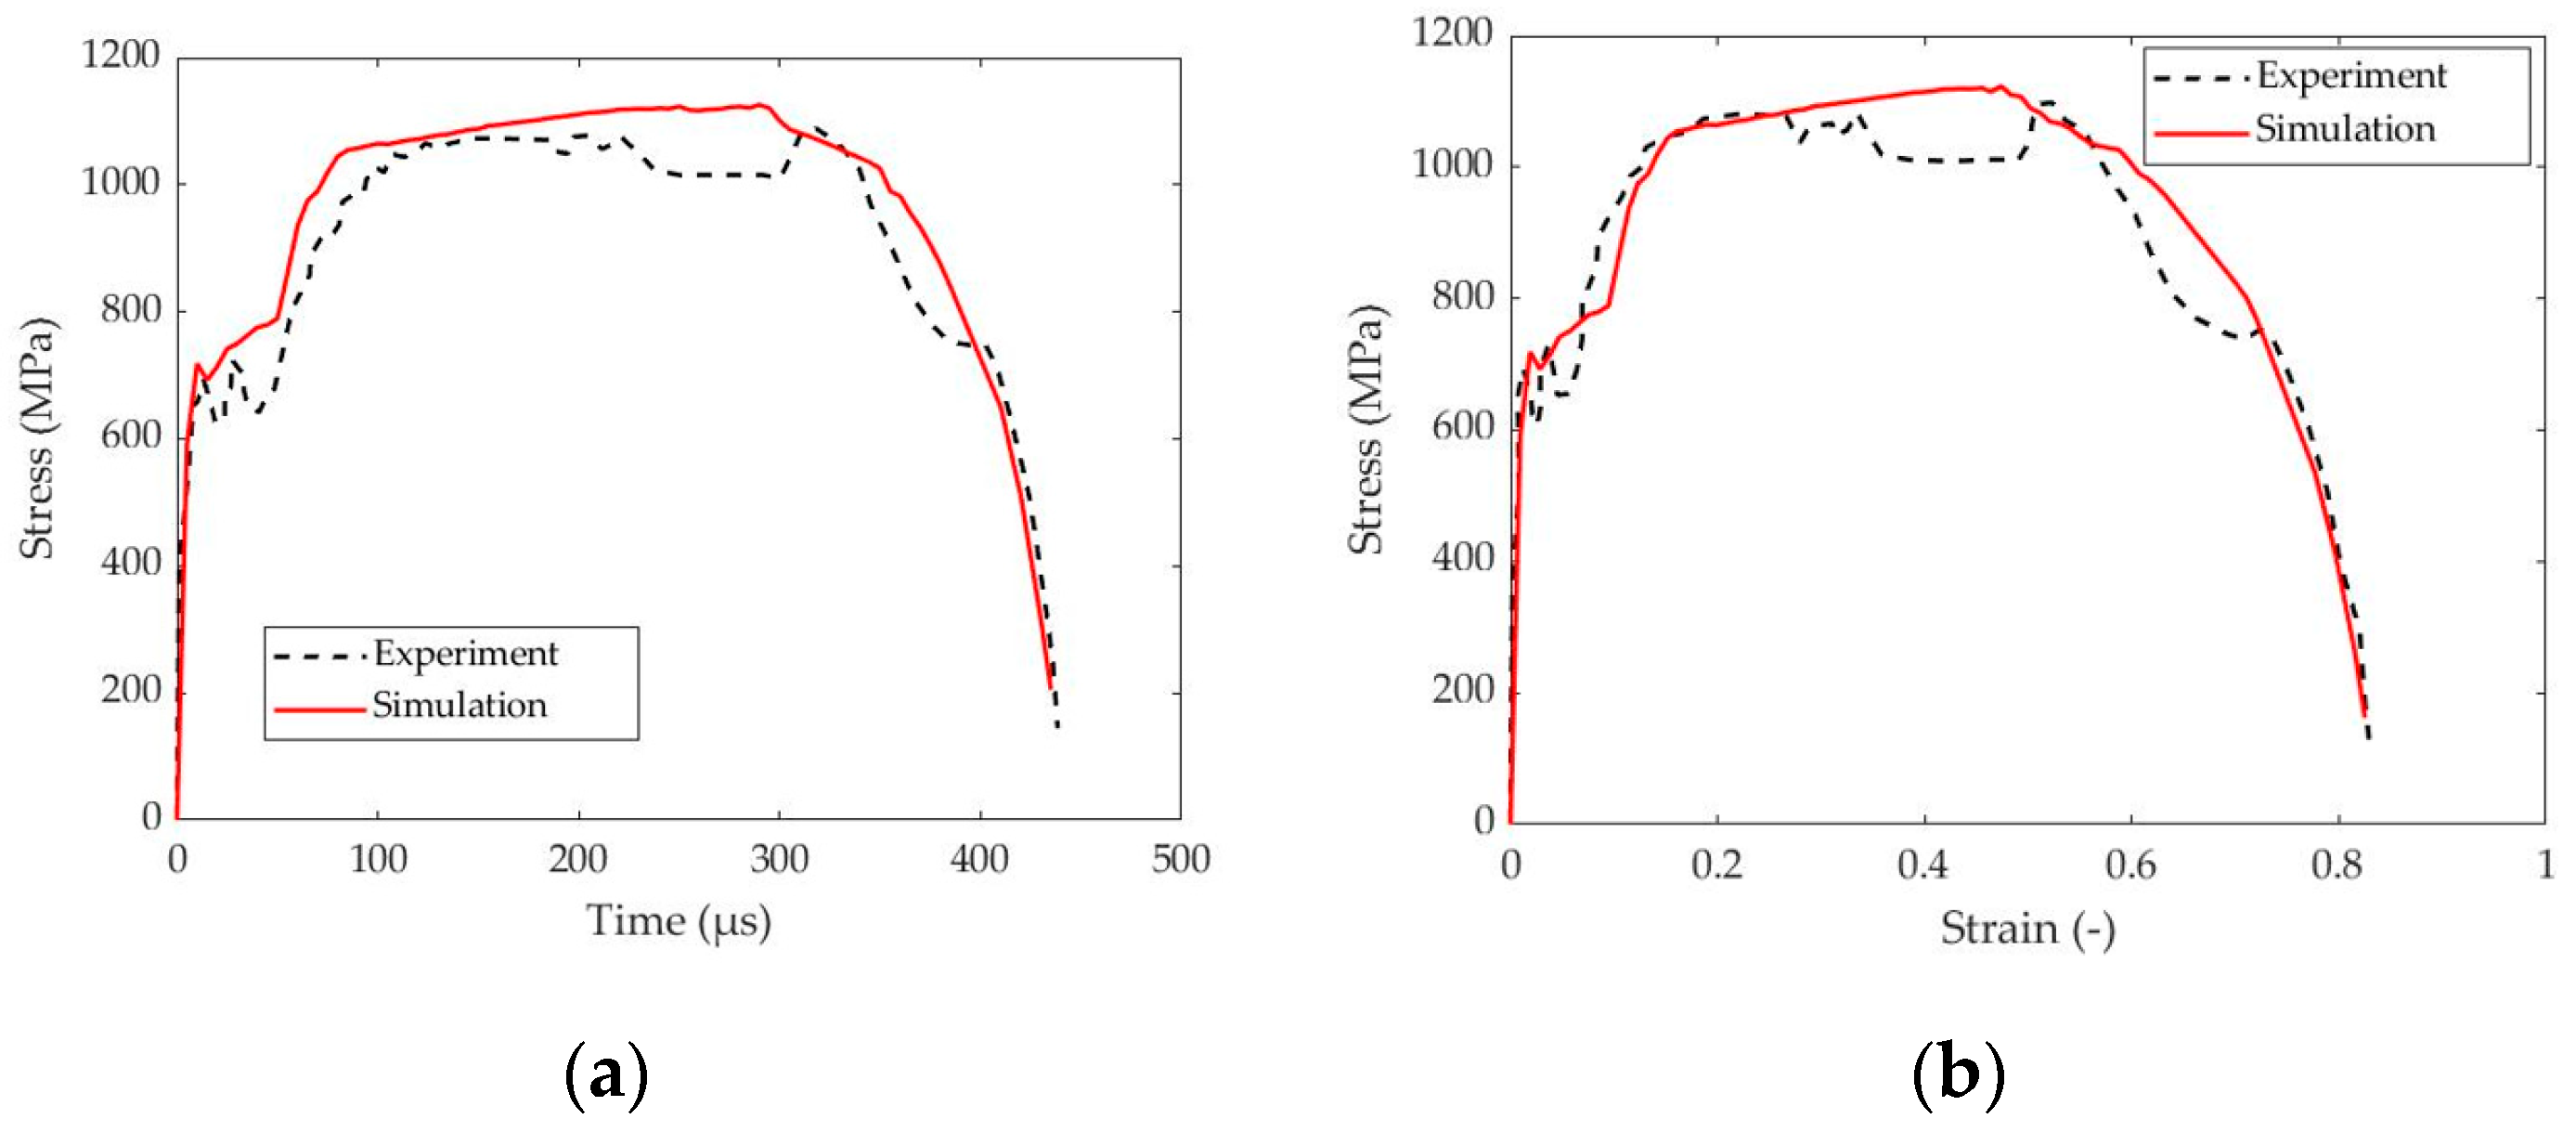
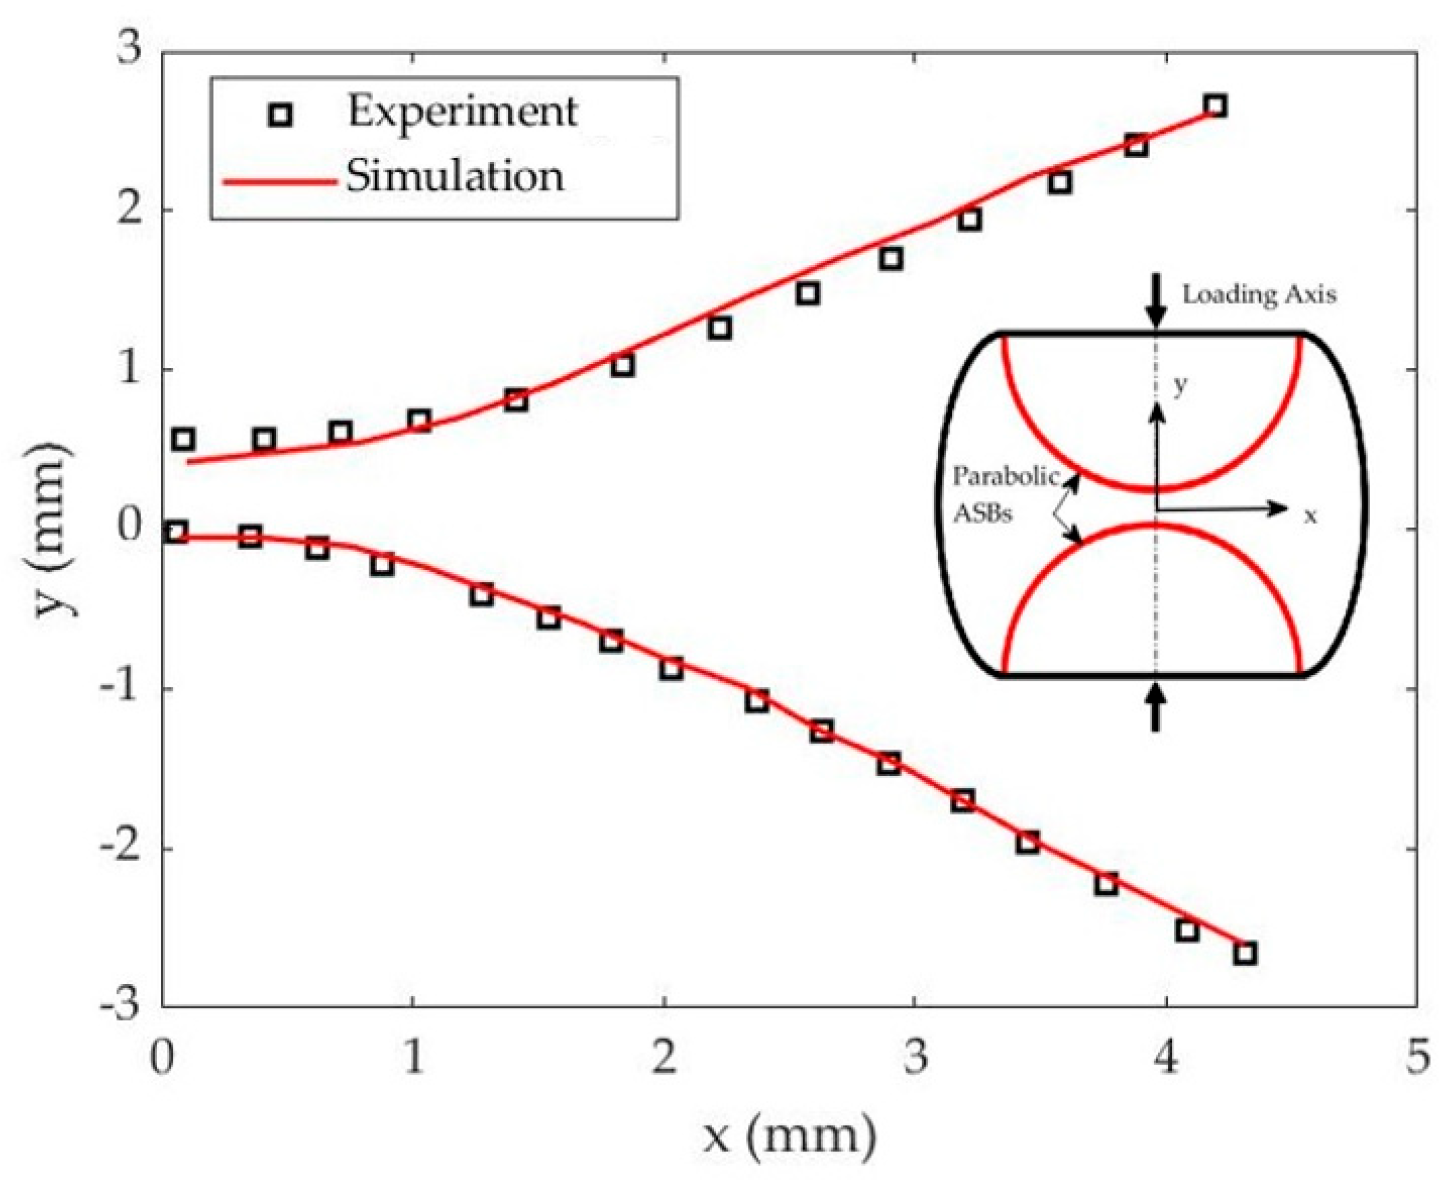
The developed FE-modeling approach is validated against experimental tests from Odeshi et al. [9] regarding the dynamically compressed AISI 4340 stainless steel cylindrical specimen of 9.55 mm   ×   9.55 mm. The test was conducted at a Split Hopkinson Pressure Bar system at a 1900 s−1 strain rate. For the validation, a similar FE model was constructed in the same geometry, material, and loading conditions as the experiment. Figure 2a,b compares the experimental and the numerical stress–time and stress–strain curves, showing similar tendency and sufficient accuracy in both peak instability timing point and critical strain for ASB initiation, with errors below 7%, as Table 2 summarizes. Also, the yield and peak stresses are predicted sufficiently, showing errors of about 1% and 2%. Finally, Figure 3 shows that both experiment and simulation agree on the formation of two parabolic and semi-conical ASBs, while their trajectories are sufficiently captured by the simulation.

4. Results and Discussion

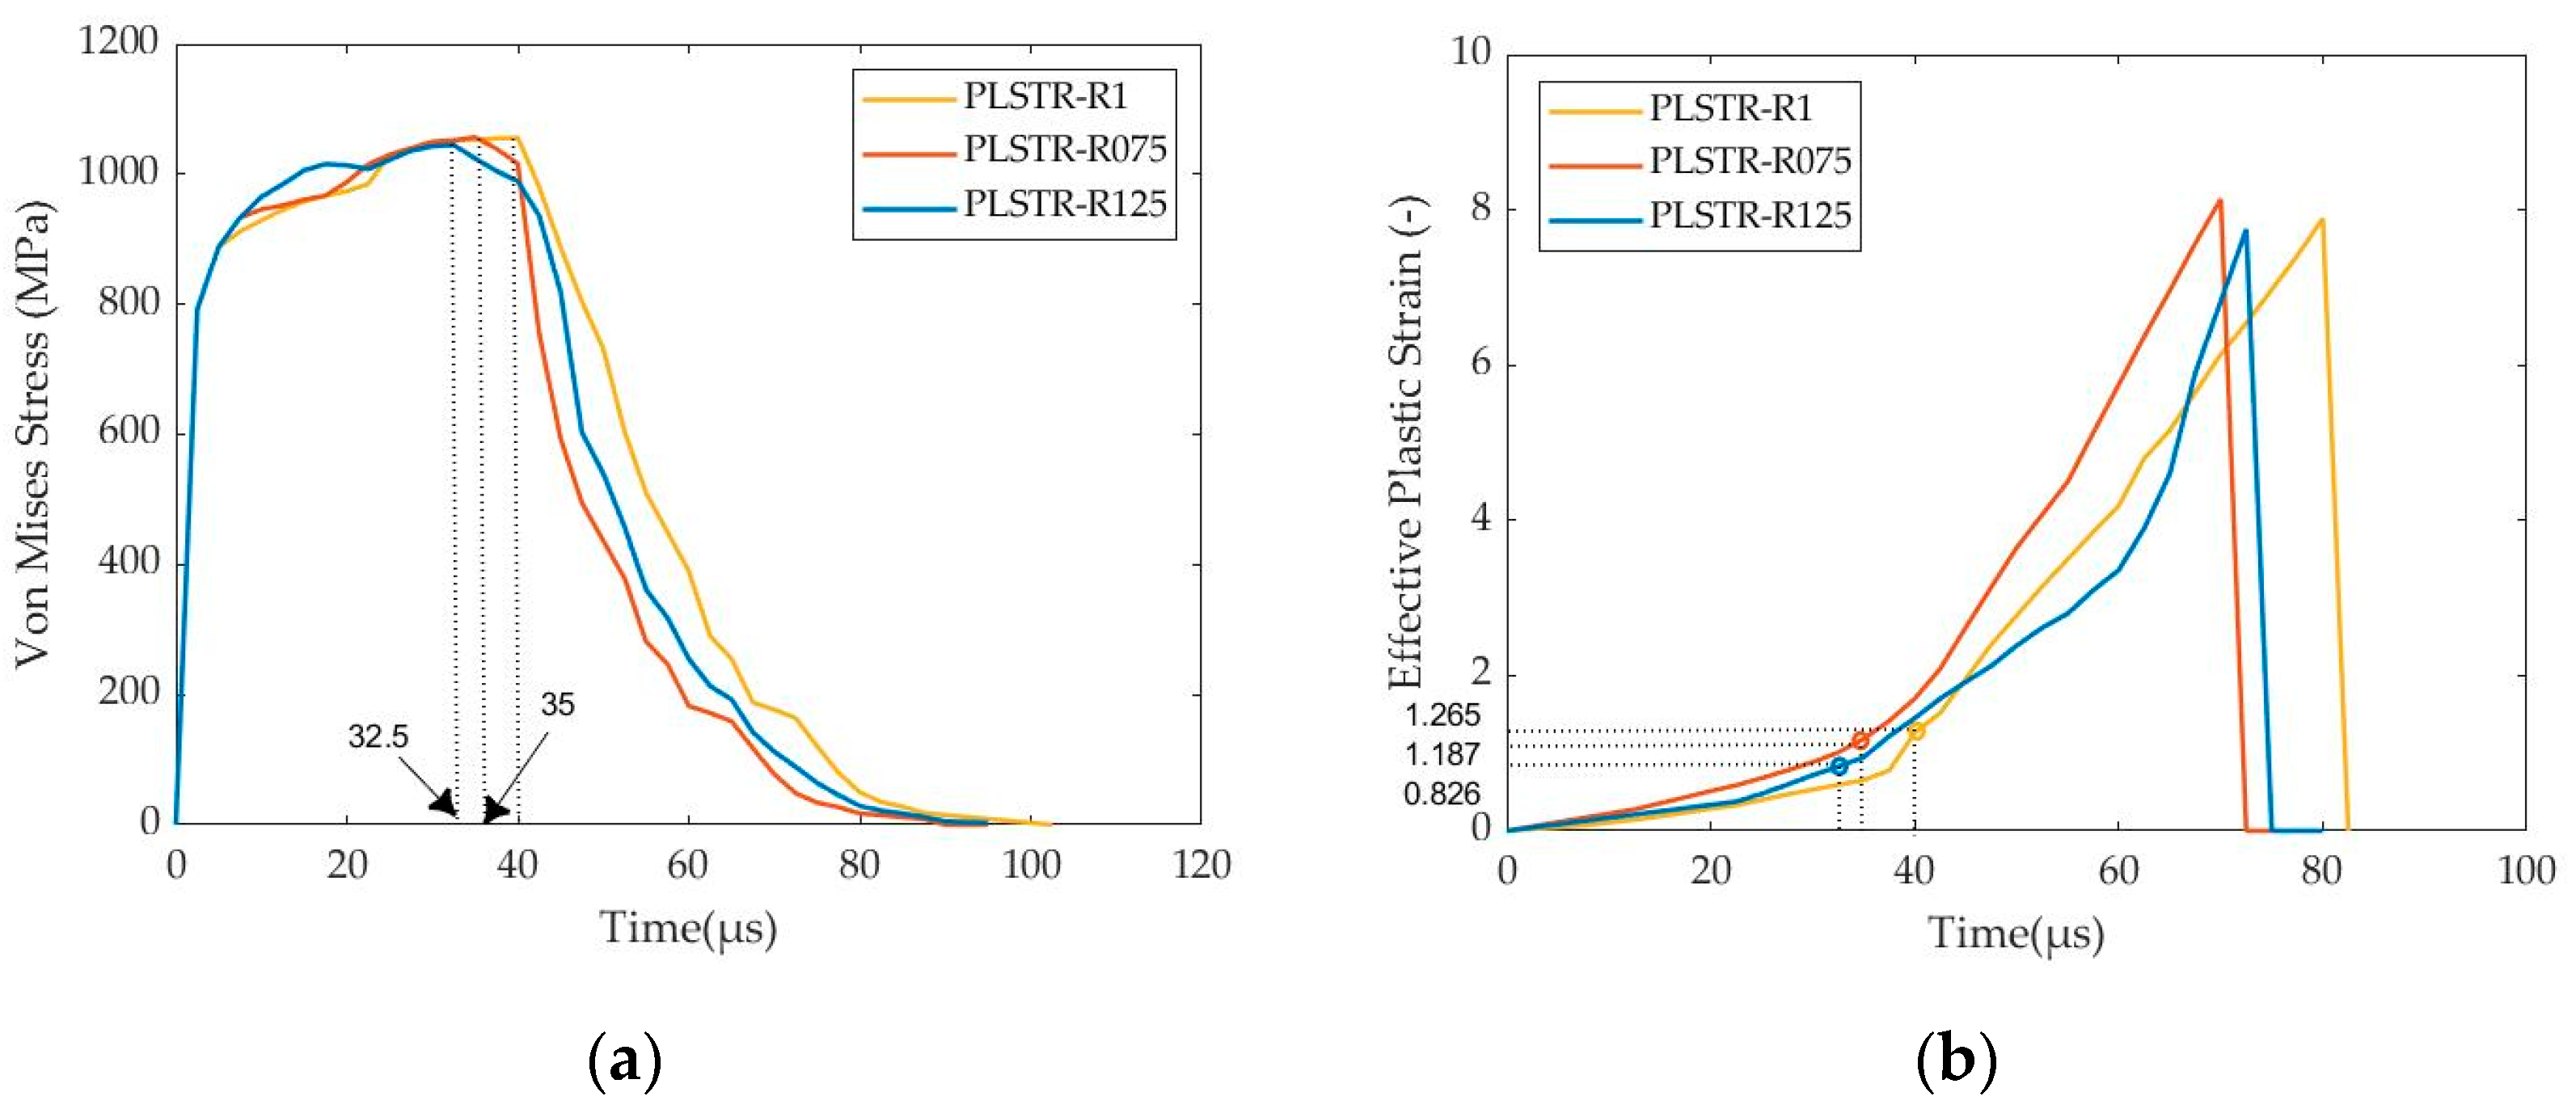
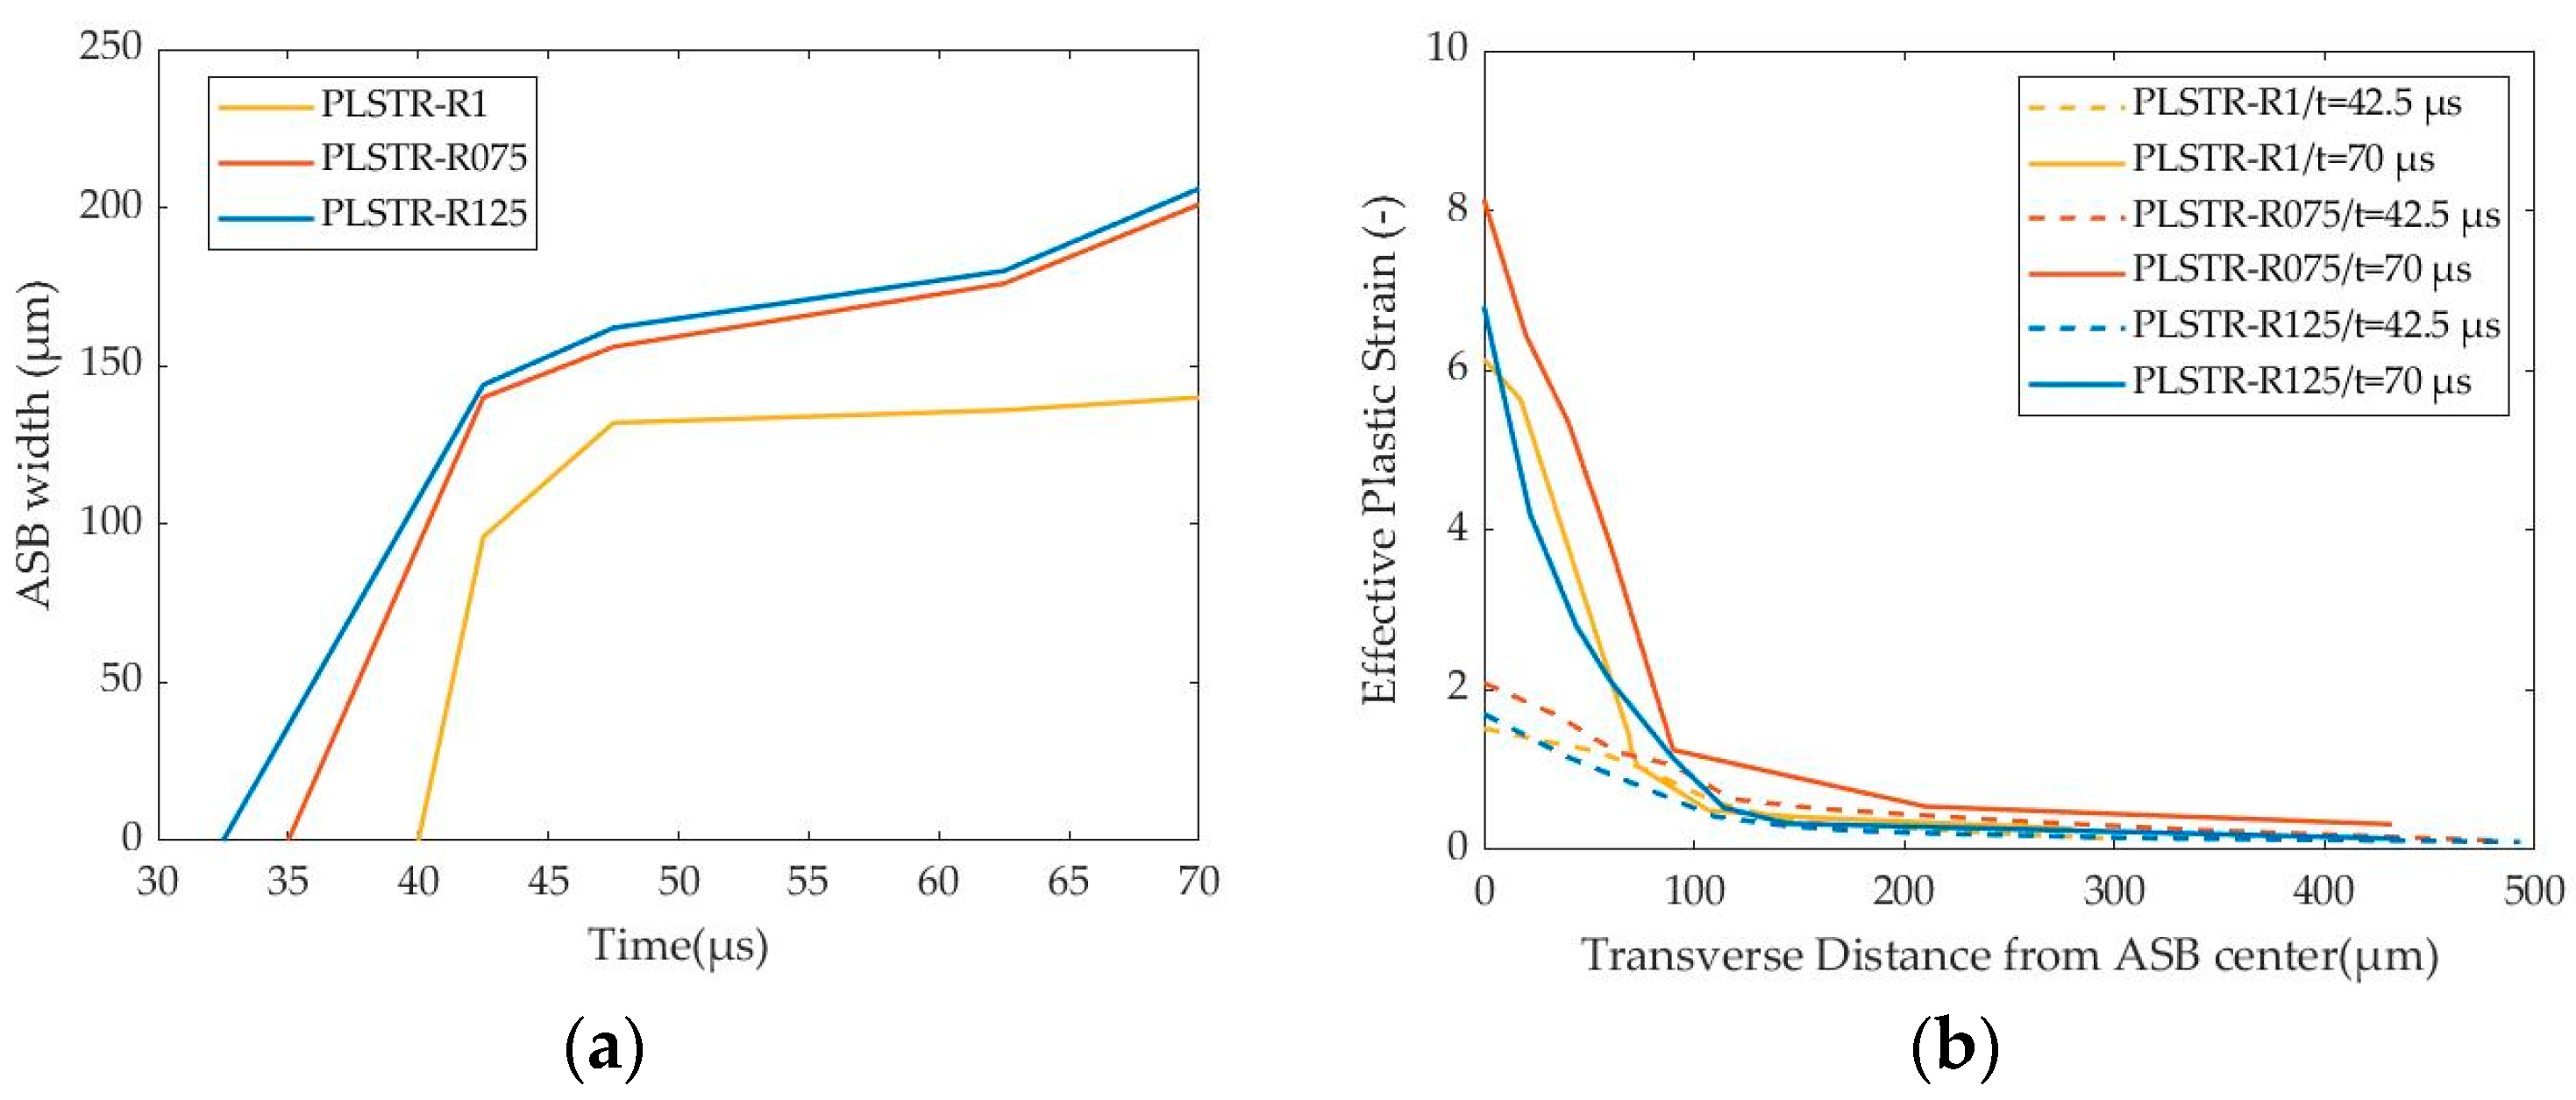
For the case study simulations, a parametric study of the specimen’s aspect ratio is conducted, examining the values of 0.75 and 1.25. In each case, the ASB initiation was considered to coincide with the instability point, revealing a critical strain for ASB generation. Therefore, a lower critical strain describes a higher susceptibility to ASB formation. As Figure 4a,b shows, the squared geometry of aspect ratio equal to 1 provides a later instability point and delays the ASB initiation. So, the squared geometry provides the highest critical strain, revealing ASB generation at about 17.5% compressive true strain, while the case of aspect ratio higher than 1 seems to accelerate the ASB formation, giving the lowest critical strain. By obtaining the previously critical effective plastic strain for ASB generation and through its transverse distribution, ASB width can be determined from a mechanistic point of view by capturing the lateral extent with effective strain higher than the critical value. In that way, the squared geometry provides narrower bands of 140 μm, instead of 205 μm in the case of an aspect ratio greater than 1, as presented in Figure 5a. Finally, the lower ASB width seems to concentrate lower strain energy from Figure 5b, leading to lower peak temperature inside the ASB core in the case of the squared geometry.
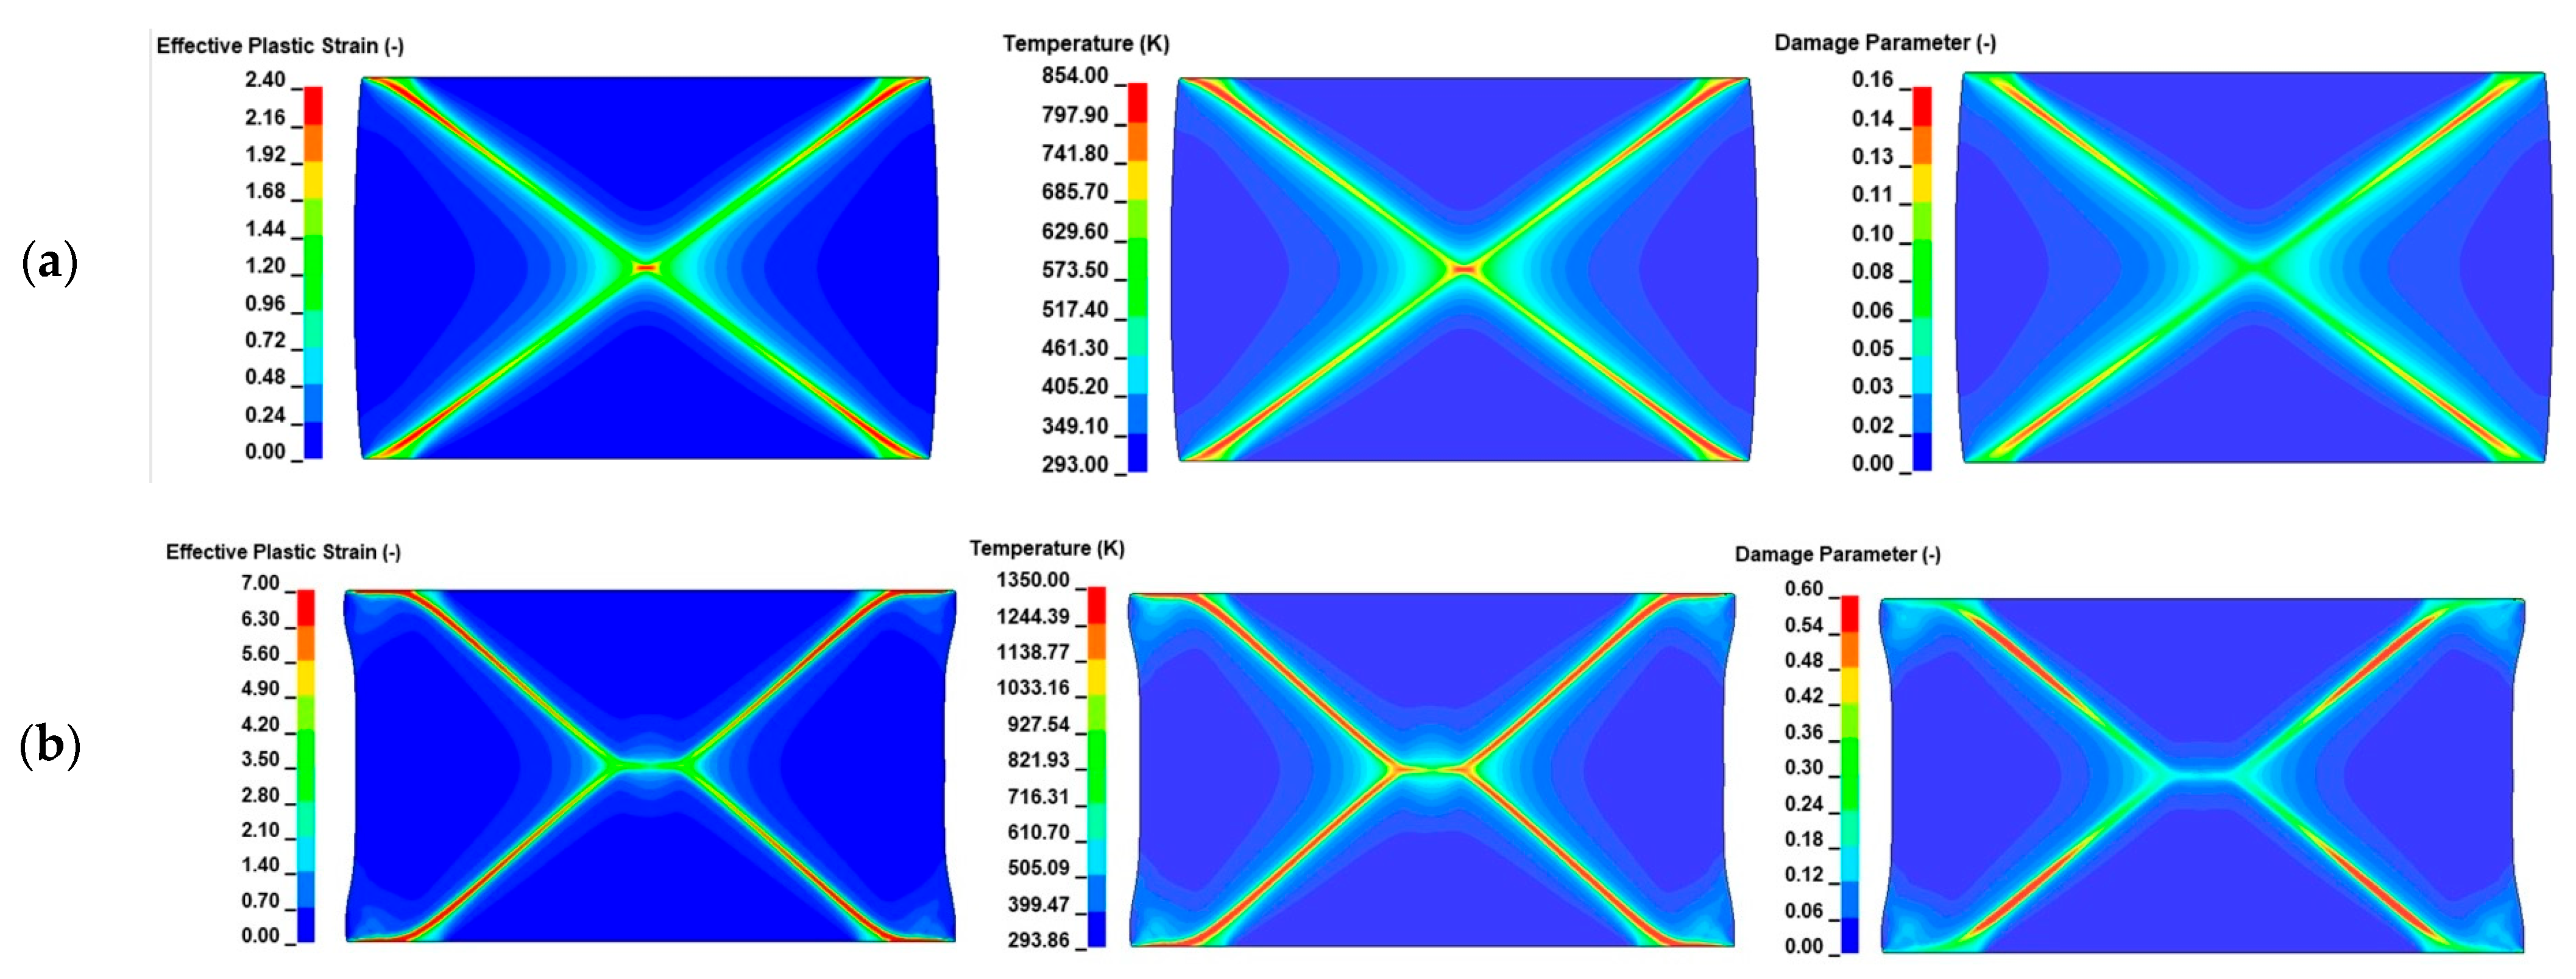
As revealed in Figure 6, the ASBs form an X-type shape at early stages (Figure 6a), while at later stages, they are converted into S-shaped bands (Figure 6b). Finally, the damage path seems to follow the ASB trajectory due to its thermally softened structure, which facilitates damage evolution.
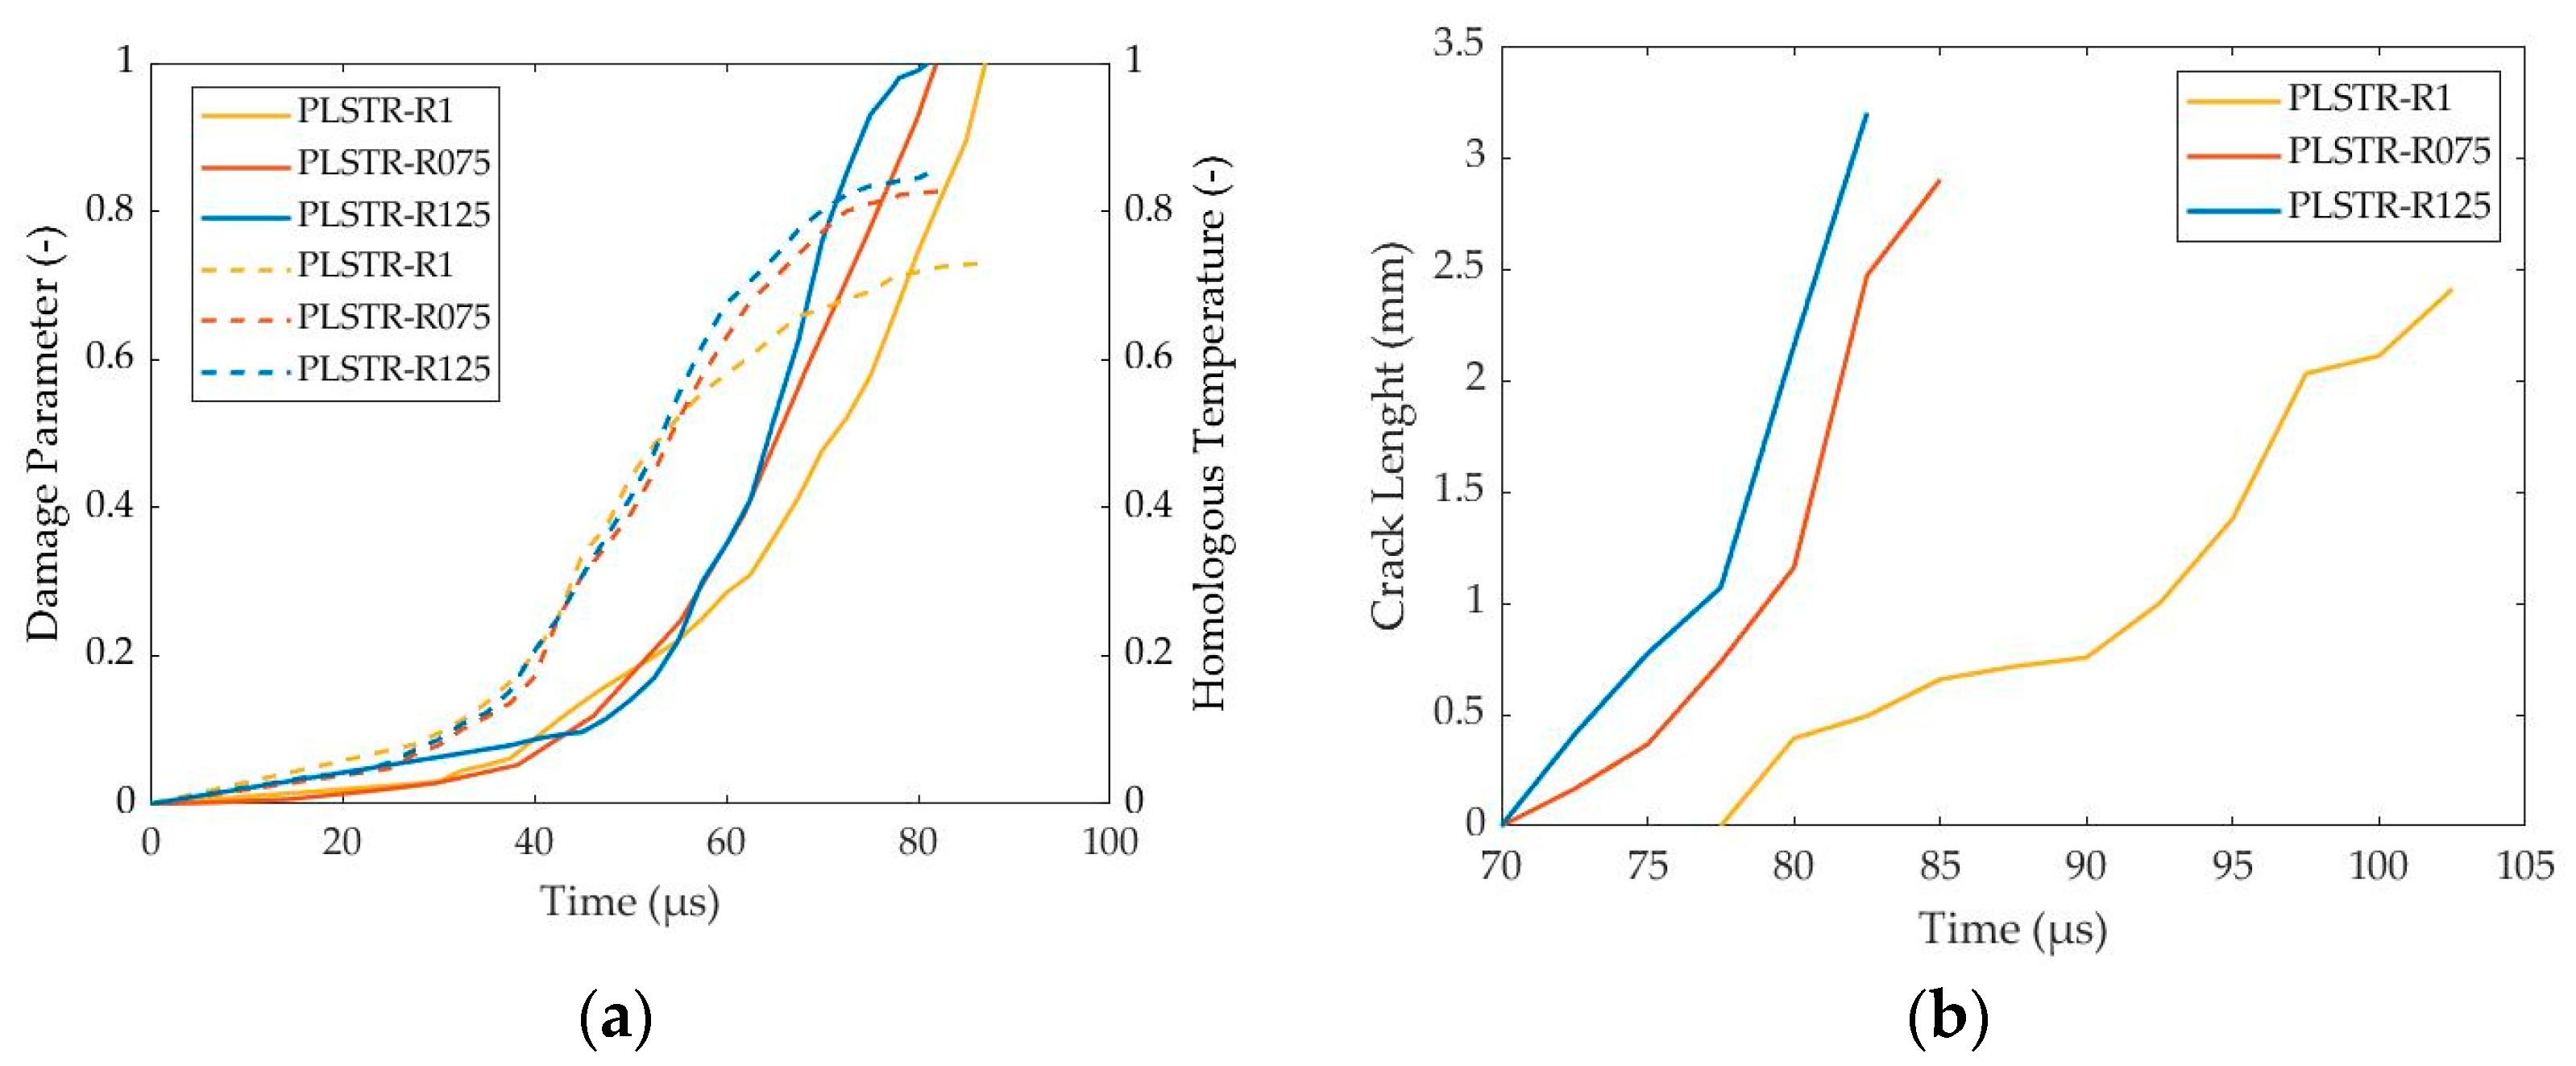
Eventually, Figure 7a indicates that the thermal softening mechanism precedes the damage softening, and in that way, the ASB initiation is attributed to the thermal softening caused by the temperature increase, while the ASB evolution and its transition to fracture are driven by the damage softening. Figure 7b ensures that the delayed ASB decelerates the cracking initiation and final fracture in the case of squared geometry.

5. Conclusions

Concluding, all aspect ratios revealed initially X-shaped shear bands, which eventually converted to S-shaped bands at higher strains. Also, the thermal softening was found to appear earlier than the damage softening, being responsible for the ASB initiation, while the damage softening was mainly responsible for the final ASB evolution stages and fracture. In addition, the squared geometry showed the highest critical strain, delaying the ASB and the fracture, while in narrower bands decreased peak temperature was detected. Finally, the next step of the research will include a wider range of the examined aspect ratios, aiming to reveal different ASB-propagating networks with more complex trajectories, which will affect the forging load according to the Upper-Bound Method.

Author Contributions

Conceptualization, K.D.K. and D.E.M.; methodology, K.D.K.; software, K.D.K.; validation, K.D.K.; formal analysis, K.D.K.; investigation, K.D.K.; resources, K.D.K. and D.E.M.; data curation, K.D.K.; writing—original draft preparation, K.D.K.; writing—review and editing, K.D.K.; visualization, K.D.K.; supervision, D.E.M.; project administration, D.E.M.; funding acquisition, D.E.M. All authors have read and agreed to the published version of the manuscript.

Funding

The research work was supported by the Hellenic Foundation for Research and Innovation (HFRI) under the 4th Call for HFRI PhD Fellowships (Fellowship Number: 10838).

Institutional Review Board Statement

Not applicable.

Informed Consent Statement

Not applicable.

Data Availability Statement

The data can be made available upon reasonable request to the corresponding author.

Conflicts of Interest

The authors declare no conflicts of interest.

References

  1. Rittel, D.; Zhang, L.; Osovski, S. The Dependence of the Taylor–Quinney Coefficient on the Dynamic Loading Mode. J. Mech. Phys. Solids 2017, 107, 96–114. [Google Scholar] [CrossRef]
  2. Karantza, K.D.; Manolakos, D.E. A Review on the Adiabatic Shear Banding Mechanism in Metals and Alloys Considering Microstructural Characteristics, Morphology and Fracture. Metals 2023, 13, 1988. [Google Scholar] [CrossRef]
  3. Karantza, K.D.; Manolakos, D.E. A summary on the microstructural characteristics of adiabatic shear bands and their experimental observation methods. In Proceedings of the 39th Danubia-Adria Symposium on Advances in Experimental Mechanics (39th DAS), Siofok, Hungary, 26–29 September 2023. [Google Scholar]
  4. Harren, S.V.; Dève, H.E.; Asaro, R.J. Shear Band Formation in Plane Strain Compression. Acta Metall. 1988, 36, 2435–2480. [Google Scholar] [CrossRef]
  5. Anand, L.; Spitzig, W.A. Initiation of Localized Shear Bands in Plane Strain. J. Mech. Phys. Solids 1980, 28, 113–128. [Google Scholar] [CrossRef]
  6. Prakash, A.; Tak, T.N.; Pai, N.N.; Seekala, H.; Murty, S.V.S.N.; Phani, P.S.; Mahesh, S.; Guruprasad, P.J.; Samajdar, I. Inception of Macroscopic Shear Bands during Hot Working of Aluminum Alloys. Int. J. Plast. 2023, 166, 103632. [Google Scholar] [CrossRef]
  7. Tang, B.; Xiang, L.; Cheng, L.; Liu, D.; Kou, H.; Li, J. The Formation and Evolution of Shear Bands in Plane Strain Compressed Nickel-Base Superalloy. Metals 2018, 8, 141. [Google Scholar] [CrossRef]
  8. Karantza, K.D.; Papaefthymiou, S.A.; Vaxevanidis, N.M.; Manolakos, D.E. Numerical Investigation of the Damage Effect on the Evolution of Adiabatic Shear Banding and Its Transition to Fracture during High-Speed Blanking of 304 Stainless Steel Sheets. Materials 2024, 17, 1471. [Google Scholar] [CrossRef] [PubMed]
  9. Odeshi, A.G.; Bassim, M.N.; Al-Ameeri, S.; Li, Q. Dynamic Shear Band Propagation and Failure in AISI 4340 Steel. J. Mater. Process. Technol. 2005, 169, 150–155. [Google Scholar] [CrossRef]
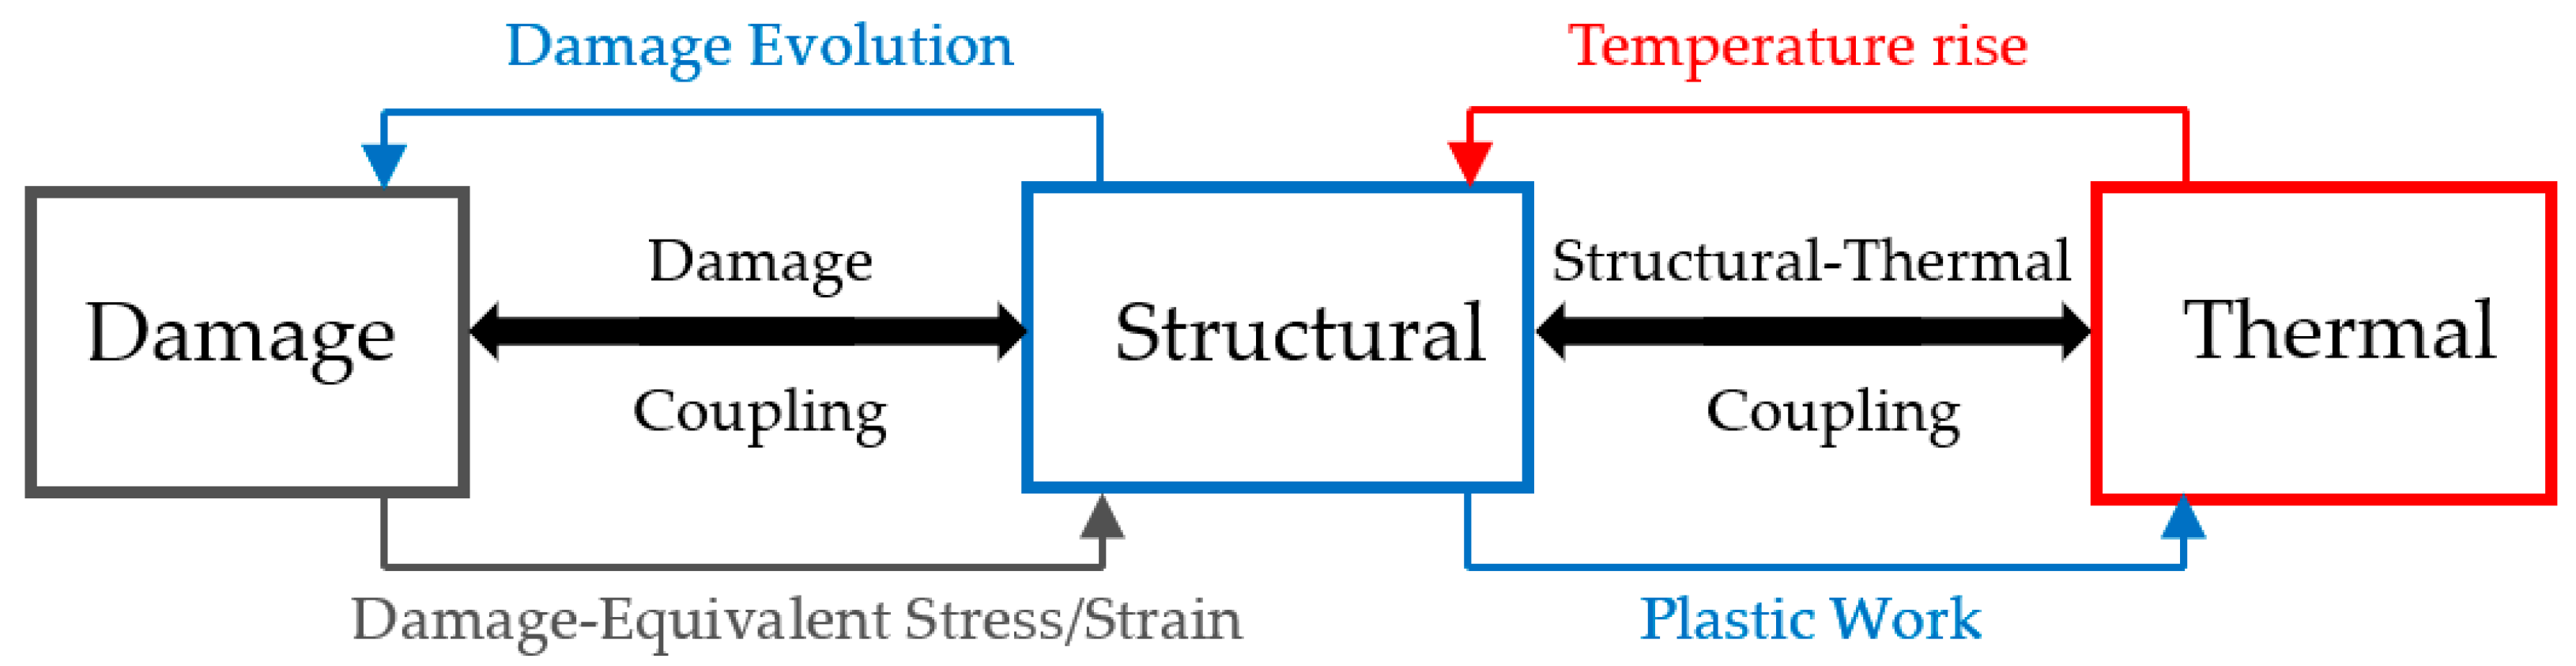
Figure 1. Structural–thermal–damage double coupling.
Engproc 119 00036 g001
Figure 2. Stress curve validation: (a) stress–time curve; (b) stress–strain curve.
Engproc 119 00036 g002
Figure 3. ASB trajectories through the longitudinal section in simulation and experiment.
Engproc 119 00036 g003
Figure 4. Flow stress and effective plastic strain fluctuation with time for the plane strain models of different ratios: (a) flow stress–time curves; (b) effective plastic strain–time curves.
Engproc 119 00036 g004
Figure 5. ASB width evolution and transverse distribution of effective plastic strain with time for the plane strain models of different ratios: (a) ASB width evolution with time; (b) comparative strain transverse distributions at 42.5 and 70 μs.
Engproc 119 00036 g005
Figure 6. Effective plastic strain, temperature, and damage fields for plane strain (PLSTR-R1) at different times: (a) PLSTR-R1 model at 47.5 μs; (b) PLSTR-R1 model at 75 μs.
Engproc 119 00036 g006
Figure 7. (a) Evolution of damage (solid lines) and homologous temperature (dashed lines) with time; (b) cracking-length evolution with time.
Engproc 119 00036 g007
Table 1. Material properties and MJC parameters for AISI 1045 steel.
Material PropertiesMJC Constitutive RelationMJC Damage Rule
χ (-)0.9ρ (kg/m3)7800A (MPa)553.1m (-)1D1 (-)0.06D4 (-)0.0018
Cp (J/kgK)432.6E (GPa)200B (MPa)600.8 ε ˙ 0 (1/s)1D2 (-)3.31D5 (-)0.58
α (μm/m°C)11ν (-)0.3n (-)0.234Tm (K)1733D3 (-)−1.96Dc (-)1
C (-)0.0122Tr (K)293
Table 2. Comparison between experimental and numerical results for 4340 steel.
DescriptionExperiment [9]SimulationRelative Error (%)
Maximum stress (MPa)110011232.09
Yield stress (MPa)700692.71.04
Instability point timing (μs)3182966.92
Critical strain (-)0.5180.4836.75
ASB shapesemi-conical/parabolicsemi-conical/parabolic-
Disclaimer/Publisher’s Note: The statements, opinions and data contained in all publications are solely those of the individual author(s) and contributor(s) and not of MDPI and/or the editor(s). MDPI and/or the editor(s) disclaim responsibility for any injury to people or property resulting from any ideas, methods, instructions or products referred to in the content.