Highlights
What are the main findings?
- Diabetic kidney disease (DKD) is one of the major risk factors for all-cause mortality and cardiovascular disease in patients living with diabetes mellitus. Different phenotypes of diabetic kidney disease have been described.
- The DKD phenotype is independently associated with all-cause mortality, with non-albuminuric diabetic kidney disease (NA-DKD) associated with a higher risk compared to no DKD or albuminuria without decreased eGFR. However, no statistically significant difference in all-cause mortality was noted between the NA-DKD group and patients with albuminuria and decreased eGFR (DKD 3).
- The neutrophil–lymphocyte ratio (NLR) and HbA1c variability were statistically lower in those with no DKD when compared to the albuminuric phenotypes and were independently associated with all-cause mortality. No statistically significant difference was noted between the NA-DKD group and patients with albuminuria and decreased eGFR.
What are the implications of main finding?
- Clinicians should integrate blood markers such as NLR and HbA1c variability as independent mortality predictors alongside the DKD phenotype, refining risk stratification models.
- Endorsing renal phenotypes beyond traditional albuminuria measures may improve clinical risk assessment and guide more personalized patient management in DKD.
Abstract
Background and Hypothesis: Diabetic kidney disease (DKD) is one of the major risk factors for all-cause mortality and cardiovascular disease in patients with diabetes mellitus. Different phenotypes have been described. In view of their different pathophysiology, these subtypes may behave differently. Methods: In this retrospective study, patients with type 2 diabetes mellitus (T2DM) were followed up for a maximum of 10 years or until death, whichever came first. Subjects were categorized into four DKD phenotypes: no DKD (no albuminuria or decreased estimated glomerular filtration rate (eGFR)), albuminuria without decreased eGFR (DKD 1), decreased eGFR without albuminuria (DKD 2 or non-albuminuric DKD), and decreased eGFR with albuminuria (DKD 3). Data on laboratory results, hospitalization, and mortality were obtained through electronic patient records. Univariate analyses were performed and the variables that were significant were entered as covariates in multivariate logistic regression models to estimate the risks of death, hospitalization for CAD, HF, and CrVD, and CKD progression. Results: Among 778 patients, 53.3% had no DKD, 31.2% had DKD 1, 5.4% had DKD 2, and 10% had DKD 3. Patients with DKD 2 exhibited the highest odds of mortality compared to those with no DKD (odds ratio (OR) of 6.7 [95% CI 2.8–16.0], p < 0.001). Pairwise comparisons using the log-rank test showed a significant difference in mortality between DKD 1 and DKD 2 (p < 0.001) and DKD 1 and DKD 3 (p < 0.001). However, no statistically significant difference in mortality was found between DKD 2 and DKD 3. Additionally, the greater variability in HbA1c and higher neutrophil–lymphocyte ratio (NLR) independently predicted all-cause mortality as well as hospitalization for heart failure. Conclusions: This contemporary T2DM cohort demonstrated that the DKD phenotype, HbA1c variability, and elevated NLR are linked to increased mortality. These factors may improve existing risk stratification models by enabling better identification of high-risk DKD patients and guide more personalized management.
1. Introduction
1.1. Background
Diabetic kidney disease (DKD) is one of the major risk factors for all-cause mortality and cardiovascular disease in patients with diabetes mellitus (DM) [1]. It is also the leading cause of end-stage kidney disease (ESKD) worldwide [2].
Classically, albuminuria was believed to be the first indicator of DKD. Albuminuria has also been identified as an independent risk factor for both mortality and the progression of renal disease in these patients [3]. However, it is now recognized that a significant number of patients with diabetes have no detectable albuminuria despite impaired renal function: the so-called non-albuminuric DKD (NA-DKD) or non-classical diabetic nephropathy group [4]. This subtype has been associated with the use of angiotensin-converting enzyme inhibitors (ACE-I) or angiotensin receptor blockers (ARBs) and newer diabetic medications, such as sodium-glucose cotransporter 2 (SGLT2) inhibitors [5,6]. It has been associated with increased macrovascular disease when compared to the albuminuric subtype [4,5]. Kidney biopsies also corroborate this difference, with NA-DKD showing interstitial and vascular changes in contrast to the glomerular changes found in patients with albuminuric DKD [7,8].
In view of their different pathophysiology, these subtypes may behave differently. Additionally, while the risk factors for albuminuria are well-known [9], less is known about NA-DKD.
1.2. Objectives
This study aims to investigate whether the non-albuminuric DKD phenotype confers a different risk of adverse outcomes including all-cause mortality, hospitalization for coronary artery disease (CAD), heart failure (HF) and cerebrovascular disease (CrVD), and CKD progression, compared to the albuminuric DKD phenotype. Additionally, the study seeks to evaluate whether variability in glycated hemoglobin (HbA1c) levels and the neutrophil–lymphocyte ratio (NLR) further influence or amplify these risks, potentially serving as important prognostic markers in different DKD phenotypes.
2. Methodology
This study followed the STROBE (Strengthening the Reporting of Observational Studies in Epidemiology) guidelines for cross-sectional research [10] (Supplementary File S1).
2.1. Study Design and Participants
In this retrospective study, all patients with type 2 diabetes mellitus attending diabetes clinics across the Maltese Islands, both community clinics and the central national health hospital (Mater Dei Hospital, Msida, Malta), who had paired urine albumin creatinine ratio (uACR) and renal profile tests performed on the same day between January and December 2010, were identified. Participants were followed up until December 2020 or until death, whichever came first. Patients who were less than 18 years of age, had a cause for chronic kidney disease other than diabetic nephropathy, had end-stage kidney disease requiring dialysis, or had a history of renal replacement therapy, were excluded. Data was collected by reviewing electronic patient records. No patients were contacted or approached during the study, and no identifying patient information was collected. This study was approved by the Mater Dei Hospital Data Protection Committee on 10 February 2024.
2.2. Variables and Data Collection Tools
Diabetic kidney disease (DKD) was defined as per the Kidney Disease: Improving Global Outcomes (KDIGO) guidelines [11], namely albuminuria (≥30 mg/g) with no other identifiable cause of CKD and/or decreased eGFR (<60 mL/min/1.73 m2 as calculated using the Modification of Diet in Renal Disease (MDRD) formula). Participants were categorized into 4 DKD phenotypes: no DKD (no albuminuria or decreased eGFR), albuminuria without decreased eGFR (DKD 1), decreased eGFR without albuminuria (DKD 2), and decreased eGFR with albuminuria (DKD 3). Patients with decreased eGFR without albuminuria (DKD 2) constituted the non-albuminuric group (NA-DKD) while the albuminuric group (A-DKD) consisted of those with albuminuria without decreased eGFR and those with albuminuria and decreased eGFR (DKD 1 and 3).
Baseline characteristics were recorded including demographics, past medical history, medication history, and laboratory investigations. Yearly laboratory measurements were recorded for 10 years or until death, whichever came first.
The endpoints of this study were all-cause mortality, hospitalization for HF, CAD or CrVD, and CKD progression. CAD was defined as hospitalization for acute coronary syndromes, percutaneous coronary intervention, or coronary artery bypass graft. CrVD encompassed the occurrence of ischemic stroke, transient ischemic attack, and hemorrhagic stroke. PVD was defined as the occurrence of amputation, gangrene, or peripheral revascularization. CKD progression was determined by a drop in eGFR category accompanied by a 25% or greater drop in eGFR from the baseline (KDIGO) [11] using at least 2 values for eGFR measured during the follow-up period.
All patients who had a complete blood count taken on the same day of the paired uACR and renal profile were included in the evaluation of the relationship between the NLR and the five end-points. On the other hand, patients who had at least 4 HbA1c measurements during the follow-up period were included in the evaluation of the impact of HbA1c variability and the five end-points. For each patient, the intrapersonal mean, standard deviation (SD), and coefficient of variation (CV = SD-HbA1c/[0.1 × mean HbA1c]) of HbA1c were calculated. The SD-HbA1c and CV were considered measures of glycaemic variability. According to Kilpatrick et al., since the number of HbA1c measurements might influence SD-HbA1c, the adjusted SD of HbA1c (adjSD-HbA1c) was calculated by dividing the SD of HbA1c by [n/(n − 1)], where n is the number of HbA1c measurements) [12].
2.3. Statistical Analysis
Continuous variables are expressed as medians with interquartile ranges (IQRs). Frequencies are presented as percentages (%). The Kolmogorov–Smirnov test was carried out to determine whether data were normally distributed and consequently, non-parametric assessments were used. Univariate analysis of categorical variables was performed using the χ2 test, while the Mann–Whitney U-test and Kruskall–Wallis test were used for the analysis of continuous variables. Spearman’s correlation analysis was used to investigate the relationship between continuous variables. Variables found to be significant in univariate analysis were further evaluated using multiple logistic regression with a backward conditional approach to identify independent predictors of all-cause mortality, coronary artery disease (CAD), heart failure (HF), cardiovascular disease (CrVD), and chronic kidney disease (CKD) progression. The area under the receiver operating characteristic curve (AUC) was calculated for each model to assess predictive performance, with values above 0.8 indicating good performance. Survival analysis was conducted using the Kaplan–Meier method to estimate survival probabilities over time. Differences in survival between DKD phenotype groups were compared using the log-rank test. p-values of <0.05 were considered statistically significant. We included all eligible patients; therefore, a priori statistical power estimation was not performed. All statistical analyses were performed using IBM SPSS version 28.0 for Windows.
3. Results
3.1. Characteristics of the Study Population
A total of 778 patients were included in the study. The majority, 57.5% (n = 447), were male; the median age was 63.3 years (IQR = 56.2–70.4). The median follow-up period from the first visit was 131 months (IQR = 119–131) and no patients were lost to follow-up. The frequencies of the different DKD phenotypes were as follows: 53.3% (n = 415) had no DKD, 31.2% (n = 243) had a normal eGFR with albuminuria, 5.4% (n = 42) had a decreased eGFR without albuminuria, and 10% (n = 78) had a decreased eGFR with albuminuria. The baseline characteristics of the different DKD phenotypes are shown in Table 1.

Table 1.
Summary of the baseline characteristics of the different DKD phenotypes.
3.2. DKD Phenotype and All-Cause Mortality
During the follow-up period, 230 patients (29.6%) passed away. A statistically significant difference was noted between all-cause mortality and the DKD phenotype (p < 0.001). All-cause mortality was especially high in patients with decreased eGFR with and without albuminuria at 65.4% and 64.3%, respectively, followed by those with albuminuria and normal eGFR (DKD 1) at 31.3% (Figure 1). Variables found to be significant with all-cause mortality in univariate analysis are detailed in Supplementary Tables S1 and S2.
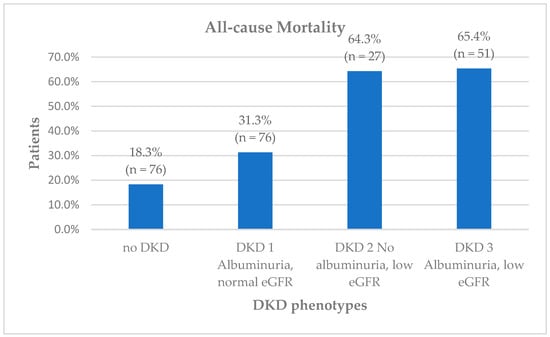
Figure 1.
Diabetic kidney disease (DKD) phenotypes and all-cause mortality.
After adjusting for potential confounders, including age and comorbidities, the DKD phenotype remained an independent predictor for all-cause mortality in the multiple logistic regression model. The predictive model demonstrated good discrimination, with an area under the receiver operating characteristic curve (AUC) of 0.804. Notably, those with decreased eGFR without albuminuria (DKD 2) had the highest odds of mortality compared to the reference group (odds ratio (OR) 6.7 [95% CI 2.8–16.0], p < 0.001) followed by those with albuminuria and decreased eGFR (DKD 3) (OR 5.4 [95% CI 2.7–10.9], p < 0.001) (Table 2). Pairwise comparisons using the log-rank test showed a significant difference in mortality between DKD 1 and DKD 2 (p < 0.001) and DKD 1 and DKD 3 (p < 0.001). However, no statistically significant difference in mortality was found between DKD 2 and DKD 3. Figure 2 shows Kaplan–Meier survival curves showing all-cause mortality across the 4 DKD phenotypes accompanied by p-values from the log-rank test evaluating differences between these groups.
Table 2.
Predictors of 10-year all-cause mortality identified by multivariate logistic regression.
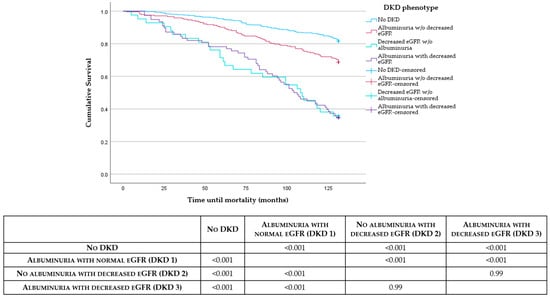
Figure 2.
Kaplan–Meier survival curves showing all-cause mortality across the 4 DKD phenotypes accompanied by p-values from the log-rank test evaluating differences between these groups.
3.3. DKD Phenotype and Risk of Hospitalization for CAD, HF, and CrVD
During the follow-up period, 122 patients (15.7%) were hospitalized for CAD, 140 patients (18%) for HF, and 55 patients (7.1%) for CrVD. In univariate analysis, a statistically significant association was observed between the DKD phenotype and hospitalization for CAD (p = 0.005), HF (p < 0.001), and CrVD (p = 0.02). Patients with non-albuminuric DKD (DKD 2) had a lower rate of hospitalization for ACS at 7.1% than the other DKD phenotypes (DKD 1 at 19.8% and DKD 3 at 24.4%). Those with albuminuria and decreased eGFR (DKD 3) had a higher rate of hospitalization for CHF and CrVD at 42.3% and 14.1%, respectively, when compared to the other groups. In multivariable logistic regression analysis after accounting for possible confounders, the DKD phenotype remained an independent predictor for hospitalization for heart failure, with DKD 3 conferring the highest odds of 3.5 [95% CI 1.9–6.4] (p < 0.001) when compared to the reference group. Regarding CAD hospitalization, the DKD phenotype demonstrated a marginal association (p = 0.038), although no single phenotype category reached statistical significance on its own (Table 3).
Table 3.
Predictors of hospitalization for CAD, HF, and CrVD identified by multivariate logistic regression.
3.4. DKD Phenotype and CKD Progression
Three hundred and thirty patients (42.4%) reached the CKD progression outcome by the end of the follow-up period. A statistically significant difference was noted between DKD phenotype and CKD progression (p < 0.001). Those with albuminuria and a normal eGFR (DKD 1) had a higher rate of CKD progression at 63.4%, followed by those with no DKD at 58.4%, non-albuminuric DKD (DKD 2) at 47.6%, and those with albuminuria and decreased eGFR at 43.6%. The DKD phenotype remained as an independent predictor of CKD progression in multivariate logistic regression, after adjusting for confounding variables (p < 0.001). Notably, those with albuminuria with and without decreased eGFR (DKD 3 and DKD 1) demonstrated approximately twofold higher odds compared to the reference group (DKD 3, OR 2.5 [95% CI 1.5–4.3] (p < 0.001); DKD 1, OR 2.0 [95% CI 1.4–2.8] (p < 0.001)) (Table 4).
Table 4.
Predictors of CKD progression identified by multivariate logistic regression.
3.5. DKD Phenotype, NLR, and HBA1c Variability
When analyzing blood indices, the DKD phenotype demonstrated a statistically significant association with NLR (p < 0.001) (Table 1). When applying the Bonferroni correction, NLR was statistically significantly lower in those with no DKD when compared to the albuminuric phenotypes (no DKD vs. DKD 1 p = 0.017; no DKD vs. DKD 3 p = 0.000) (Supplementary Table S3). The median NLR for the no DKD group was 1.97 [IQR 1.58–2.62] compared to 2.23 [IQR 1.72–2.82] in DKD 1, 2.18 [IQR 1.93–3.13] in DKD 2 and 2.47 [IQR 1.85–3.29] in DKD 3. However, no statistically significant difference was noted between the non-albuminuric (DKD 2) and albuminuric (DKD 1 and 3) groups. NLR also showed a statistically significant association with all-cause mortality (p < 0.001), hospitalization for heart failure (p < 0.001) and CKD progression (p = 0.005). After adjusting for age, comorbidities and DKD phenotype, NLR remained an independent predictor of mortality (OR 1.2 [95% CI 1.004–1.3] (p = 0.04)) (Table 2).
A statistically significant difference was noted between the different DKD phenotypes and baseline HbA1c (p < 0.001) and mean HbA1c (p < 0.001) (Table 1). In our cohort, 457 patients had at least 4 HbA1c measurements during the follow-up period. DKD phenotype also demonstrated a statistically significant association with markers of HbA1c variability, namely the adjSD-HbA1c (p = 0.001) and HbA1c CV (p = 0.003). The adjSD-HbA1c and HbA1c CV were significantly lower in those with no DKD when compared to those with albuminuria with or without decreased eGFR (no DKD vs. DKD 3: adjSD-HbA1c p = 0.026, HbA1c CV p = 0.017; no DKD vs. DKD 1 adjSD-HbA1c p < 0.001, HbA1c CV p < 0.001). However, no statistically significant difference was noted between the non-albuminuric (DKD 2) and albuminuric (DKD 1 and 3) groups (Supplementary Table S3). The median adjusted SDHbA1c for the no DKD group was 0.5 [IQR 0.3–1.0] compared to 0.7 [IQR 0.4–1.2] in DKD 1 and 0.7 [IQR 0.5–1.3] in DKD 3. The median HbA1c CV for the no DKD group was 8.5 [IQR 5.2–14.5] compared to 11.4 [IQR 7.2–15.9] in DKD 1 and 11.9 [IQR 8.3–16.6]. After adjusting for age and comorbidities, the adjSD-HbA1c remained significant predictor of all-cause mortality (OR 2.5 [95% CI 1.5–4.3] (p < 0.001)). The predictive model demonstrated good discrimination, with an area under the receiver operating characteristic curve (AUC) of 0.82.
4. Discussion
In a contemporary real-world cohort, we investigated the outcomes and potential risk factors for patients with different DKD phenotypes, focusing on both non-albuminuric and albuminuric DKD. We report that the prevalence of NA-DKD in our group was 5.4%. Prevalence rates reported in the literature are highly variable, ranging from 5% [13] to 60% [14]. This difference may be attributable to different genetic and metabolic parameters in participants between the different centres. Rate of use renin–angiotensin–aldosterone system blockade in the background population might also contribute to the difference in view of the strong anti-proteinuric effects of these therapies [15]. Of note, use of SGLT2s, which could also affect the degree of albuminuria in these patients, was very limited in our country during the study period, and thus it is unlikely that these medications contributed in any way to this finding.
4.1. All-Cause Mortality
In our study, the DKD phenotype was identified as an independent predictor of all-cause mortality, with patients with NA-DKD having the highest overall risk compared to patients with no DKD and those with albuminuria but normal eGFR (DKD 1). Notably, we did not observe a significant difference in mortality risk between the NA-DKD group and patients with albuminuria and decreased eGFR (DKD 3), possibly due to small numbers in these subgroups. This contrasts the findings from the RIACE (Renal Insufficiency and Cardiovascular Events) trial which reported higher mortality rates in the non-albuminuric DKD group compared to both the albuminuric with normal or reduced eGFR groups [16]. Conversely, in a secondary analysis of the ACCORD (Action to Control Cardiovascular Risk in Diabetes) data, Buyadaa et al. reported that the highest mortality was in albuminuric DKD group [17].
The reasons for these differences are unclear, but differences in selection criteria may be involved. Our study included all patients with DKD irrespective whether they were cared for in primary, secondary, tertiary care or a combination of these. The RIACE study recruited patients from tertiary referral diabetes clinics only. On the other hand, the inclusion criteria in the ACCORD study were age 40–79 years, high risk of having a cardiovascular event, and HbA1c ≥ 7.5% [17]. Other possible reasons include population differences and secular changes over time.
NA-DKD is believed to be associated with macrovascular disease, compared to the classical microvascular changes identified in the albuminuric subtype [4,5]. In fact, our patients with NA-DKD had a higher prevalence of PVD compared to all other phenotypes, and a higher prevalence of CAD and cerebrovascular disease when compared to patients with albuminuria but a normal eGFR. Multiple mechanisms have been proposed to explain the increased risk of macrovascular disease, including ACS and stroke associated with CKD. These include increased atherosclerotic burden, increased vascular calcification and possibly reduced-dose treatment options in these patients [18,19,20], all of which may result in a different risk profile and subsequently different treatment targets in patients with NA-DKD compared to patients with albuminuric and predominantly microvascular disease.
4.2. Neutrophil–Leukocyte Ratio (NLR)
Consistent with other authors [21,22], the NLR was identified as an independent risk factor for increased 10-year all-cause mortality, with patients without DKD having the lowest NLRs and the lowest mortality rates. An elevated NLR is associated with high levels of systemic inflammation and reactive oxygen species [23]. It also reflects increased endothelial dysfunction and arteriolar stiffness [24], all of which are common in patients with advanced stages of CKD, including DKD [25,26,27]. These factors play a key role in the pathogenesis of cardiovascular disease [28]. A high NLR has also been linked with increased mortality in the general population [21].
In our population, NLR was significantly associated with the DKD phenotype, with the lowest value recorded in patients without DKD. Of note, this group also had the lowest mortality rates among all phenotypes, further reflecting the importance of NLR as a potential marker of inflammation and mortality. Although no statistically significant difference in NLR was noted when comparing the albuminuric and non-albuminuric subtypes, both albuminuria and a reduced eGFR appear to predict mortality with comparable statistical strength. However, larger population studies may be needed to validate these findings and confirm any differences between albuminuric and non-albuminuric subtypes. NLR is thought to reflect both innate (neutrophil) and adaptive (lymphocyte) immunity and thus is less likely to be affected by changes in physical and physiological states [29], further increasing its applicability as a potential marker.
4.3. HbA1c Variability
In our cohort, increased HbA1c variability was independently associated with a higher risk of 10-year all-cause mortality. HbA1c variability was also significantly associated with the DKD phenotype, being lower in patients without DKD, suggesting a lower risk of microvascular complications in these patients.
Various authors report a significant association between high HbA1c variability and all-cause mortality [30,31], persisting despite adjustment for comorbidities, mean fasting glucose and severe hypoglycemic episodes [32]. High HbA1c variability has also been linked to an increased risk of microvascular diabetes-related complications, cardiovascular disease, and all-cause mortality [33]. Multiple underlying mechanisms have been suggested, but it is predominantly believed to be due to increased oxidative stress, which is higher with intermittent rather than sustained hyperglycemia [34]. This can in turn lead to decreased plaque stability [35] and increased atherosclerosis [36], thus resulting in vascular injury.
The link between glycemic variability, both short-term (same day or day-to-day) and long term (months to years), and diabetes-related complications has yet to be fully defined [37]. Short-term fluctuations in glycemic control have been shown to affect overall mortality risk, with a reduction in post-prandial hyperglycemia being associated with improvement in arterial intimal thickness [38]. However, long-term glycemic variability may have an even more notable effect on diabetes-related complications when compared to short-term differences [39].
4.4. CKD Progression and Hospitalization for HF
In our cohort, the DKD phenotype was identified as an independent risk factor for CKD progression, with the albuminuric phenotypes (DKD 1 and DKD 3) showing higher odds compared to patients without DKD. Albuminuria has long been recognized as a major risk factor for mortality and CrVD and CKD progression in patients with DKD [18,40], and urinary ACR (uACR) is itself a marker of systemic inflammation [41] and of end-organ damage [42]. The higher rate of CKD progression in the A-DKD groups may be due that the fact that albuminuria itself causes renal injury [43] through activation of inflammatory and pro-fibrotic pathways and RAAS activation by increased protein trafficking [44,45].
The DKD phenotype was also found to be an independent predictor for hospitalization for HF, with the albuminuric DKD 3 group conferring the highest risk. A marginal association between the DKD phenotype and hospitalization for CAD was also reported, although this did not achieve statistical significance. Albuminuria- and hyperglycemia-induced RAAS activation not only leads to renal injury but also to hypertension and cardiac injury [46]. This is further exacerbated by the atherosclerotic complications of longstanding diabetes. The development of HF itself will also increase RAAS activation via the sympathetic nervous system, further worsening the disease cycle [47].
5. Strengths and Limitations
One major strength of the study is that we included all patients with type 2 diabetes irrespective of where they were cared for, unlike other previous studies that either recruited patients from tertiary centres or were secondary analyses of data from randomized controlled studies with strict inclusion and exclusion criteria. Therefore, our cohort is more likely to be representative of the type 2 diabetes population. Another strength is that we could access robust databases (the laboratory information system, mortality register, and hospital admission records). A further strength is that no patients were lost to follow-up.
This was a retrospective observational study, with all the limitations inherent to this study design. All eligible patients available during the study period were included, and therefore no formal power calculation was used to guide the sample size. No data regarding SGLT2 inhibitors could be included in this study since they were not widely available during the study period. Additionally, the lack of data on cardiovascular-specific mortality prevented us from analyzing this outcome. Nevertheless, we focused on all-cause mortality, a more comprehensive and robust endpoint, which adds greater significance to our findings.
Kidney biopsies were not required to distinguish between the different DKD phenotypes, which could have led to patients with atherosclerotic disease being incorrectly classified as having NA-DKD. However, not only can both disease mechanisms overlap, but histological findings in patients with NA-DKD have shown significant vascular and interstitial damage [7] similar to atherosclerotic disease. Furthermore, kidney biopsies are not routinely performed in all patients with DKD. Therefore, similar to other authors [16,17], we sought to base this distinction between phenotypes on clinical and biochemical parameters that can more easily be replicated in clinical practice.
6. Conclusions
In our study, the DKD phenotype, HbA1c variability, and elevated NLR were independently associated with increased mortality. Although no statistically significant differences were observed between NA-DKD and the albuminuric and decreased eGFR subtype (DKD 3), these two easily available and inexpensive parameters can help clinicians identify patients who are at increased risk and who might benefit from more aggressive management.
We suggest that future studies are needed to investigate whether high-risk patients, as identified by a high neutrophil–lymphocyte ratio or increased HbA1c variability, would benefit from receiving cardioprotective medications, such as sodium-glucose co-transporter inhibitors, glucagon-like peptide 1 receptor antagonists, or finerenone. There is also very little data on which factors contribute to HbA1c variability. Possibilities include seasonal or other temporal changes in behavior (diet and/or exercise) and clinical inertia leading to a delay in intensifying anti-hyperglycemic therapy, and thereby to the yo-yoing of glycaemic control, as proposed by Del Prato et al. [48].
Supplementary Materials
The following supporting information can be downloaded at: https://www.mdpi.com/article/10.3390/diabetology7010004/s1, Supplementary File S1: STROBE (Strengthening the Reporting of Observational Studies in Epidemiology) guidelines for cross-sectional research; Supplementary Table S1: Significant baseline variables associated with 10-year all-cause mortality, hospitalization for CAD, hospitalisation for HF, hospitalization for CrVD and CKD Progression (analysed using Chi-squared test); Supplementary Table S2: Significant baseline variables associated with 10-year all-cause mortality, hospitalization for CAD, hospitalisation for HF, hospitalization for CrVD and CKD Progression (analysed using Mann-Whitney U-test); Supplementary Table S3: Pairwise comparisons between the different DKD phenotypes showing Bonferroni correction adjusted p-values for Kruskal-Wallis test. The asterisk (*) denotes those variables that remained statistically significant after correction for multiple testing.
Author Contributions
S.M.A.: Conception of Study; Data Curation, Writing—Original Draft, Approval of Final Draft; J.M.: Conception of Study; Statistical analysis, Writing—Original Draft; Approval of Final Draft; S.F.: Conception of Study; Writing—Original Draft; Approval of Final Draft. All authors have read and agreed to the published version of the manuscript.
Funding
This research received no external funding.
Institutional Review Board Statement
This study was conducted in accordance with the Declaration of Helsinki and approved by the Mater Dei Data Protection Officer. There was no patient contact or intervention.
Informed Consent Statement
Not applicable as there was no patient contact or intervention.
Data Availability Statement
The raw data supporting the conclusions of this article will be made available by the authors on request.
Conflicts of Interest
The authors declare no conflict of interest.
References
- Afkarian, M.; Sachs, M.C.; Kestenbaum, B.; Hirsch, I.B.; Tuttle, K.R.; Himmelfarb, J.; De Boer, I.H. Kidney disease and increased mortality risk in type 2 diabetes. J. Am. Soc. Nephrol. 2013, 24, 302–308. [Google Scholar] [CrossRef] [PubMed]
- Molitch, M.E.; Adler, A.I.; Flyvbjerg, A.; Nelson, R.G.; So, W.-Y.; Wanner, C.; Kasiske, B.L.; Wheeler, D.C.; de Zeeuw, D.; Mogensen, C.E. Diabetic kidney disease: A clinical update from Kidney Disease: Improving Global Outcomes. Kidney Int. 2015, 87, 20–30. [Google Scholar] [CrossRef] [PubMed]
- Astor, B.C.; Matsushita, K.; Gansevoort, R.T.; van der Velde, M.; Woodward, M.; Levey, A.S.; de Jong, P.E.; Coresh, J. Lower estimated glomerular filtration rate and higher albuminuria are associated with mortality and end-stage renal disease. A collaborative meta-analysis of kidney disease population cohorts. Kidney Int. 2011, 79, 1331–1340. [Google Scholar] [CrossRef]
- Penno, G.; Solini, A.; Bonora, E.; Fondelli, C.; Orsi, E.; Zerbini, G.; Trevisan, R.; Vedovato, M.; Gruden, G.; Renal Insufficiency And Cardiovascular Events (RIACE) Study Group; et al. Clinical significance of nonalbuminuric renal impairment in type 2 diabetes. J. Hypertens. 2011, 29, 1802–1809. [Google Scholar] [CrossRef]
- Yokoyama, H.; Araki, S.-I.; Kawai, K.; Yamazaki, K.; Shirabe, S.-I.; Sugimoto, H.; Minami, M.; Miyazawa, I.; Maegawa, H. The Prognosis of Patients with Type 2 Diabetes and Nonalbuminuric Diabetic Kidney Disease Is Not Always Poor: Implication of the Effects of Coexisting Macrovascular Complications (JDDM 54). Diabetes Care 2020, 43, 1102–1110. [Google Scholar] [CrossRef]
- Klimontov, V.V.; Korbut, A.I. Albuminuric and non-albuminuric patterns of chronic kidney disease in type 2 diabetes. Diabetes Metab. Syndr. Clin. Res. Rev. 2019, 13, 474–479. [Google Scholar] [CrossRef]
- Pugliese, G. Updating the natural history of diabetic nephropathy. Acta Diabetol. 2014, 51, 905–915. [Google Scholar] [CrossRef]
- Ekinci, E.I.; Jerums, G.; Skene, A.; Crammer, P.; Power, D.; Cheong, K.Y.; Panagiotopoulos, S.; McNeil, K.; Baker, S.T.; Fioretto, P.; et al. Renal structure in normoalbuminuric and albuminuric patients with type 2 diabetes and impaired renal function. Diabetes Care 2013, 36, 3620–3626. [Google Scholar] [CrossRef]
- Afghahi, H.; Cederholm, J.; Eliasson, B.; Zethelius, B.; Gudbjörnsdottir, S.; Hadimeri, H.; Svensson, M.K. Risk factors for the development of albuminuria and renal impairment in type 2 diabetes—The Swedish National Diabetes Register (NDR). Nephrol. Dial. Transplant. 2011, 26, 1236–1243. [Google Scholar] [CrossRef]
- Von Elm, E.; Altman, D.G.; Egger, M.; Pocock, S.J.; Gøtzsche, P.C.; Vandenbroucke, J.P. The Strengthening the Reporting of Observational Studies in Epidemiology (STROBE) statement: Guidelines for reporting observational studies. J. Clin. Epidemiol. 2008, 61, 344–349. [Google Scholar] [CrossRef] [PubMed]
- Kidney Disease: Improving Global Outcomes (KDIGO) Diabetes Work Group. KDIGO 2022 Clinical Practice Guideline for Diabetes Management in Chronic Kidney Disease (CKD). Kidney Int. 2022, 102, S1–S127. [Google Scholar] [CrossRef]
- Kilpatrick, E.S.; Rigby, A.S.; Atkin, S.L. A1C variability and the risk of microvascular complications in type 1 diabetes: Data from the Diabetes Control and Complications Trial. Diabetes Care 2008, 31, 2198–2202. [Google Scholar] [CrossRef] [PubMed]
- Jin, Q.; Luk, A.O.; Lau, E.S.H.; Tam, C.H.T.; Ozaki, R.; Lim, C.K.P.; Wu, H.; Jiang, G.; Chow, E.Y.K.; Hong Kong Diabetes Biobank Study Group; et al. Nonalbuminuric Diabetic Kidney Disease and Risk of All-Cause Mortality and Cardiovascular and Kidney Outcomes in Type 2 Diabetes: Findings from the Hong Kong Diabetes Biobank. Am. J. Kidney Dis. 2022, 80, 196–206.e1. [Google Scholar] [CrossRef]
- Laranjinha, I.; Matias, P.; Mateus, S.; Aguiar, F.; Pereira, P.; Santos, M.P.; Costa, R.; Lourenço, A.; Guia, J.; Barata, J.D.; et al. Diabetic kidney disease: Is there a non-albuminuric phenotype in type 2 diabetic patients? Nefrologia 2016, 36, 503–509, (In English, Spanish). [Google Scholar] [CrossRef]
- Singhania, N.; Bansal, S.; Mohandas, S.; Nimmatoori, D.P.; Ejaz, A.A.; Singhania, G. Role of renin–angiotensin–aldosterone system inhibitors in heart failure and chronic kidney disease. Drugs Context 2020, 9, 2020-7-3. [Google Scholar] [CrossRef]
- Penno, G.; Solini, A.; Orsi, E.; Bonora, E.; Fondelli, C.; Trevisan, R.; Vedovato, M.; Cavalot, F.; Lamacchia, O.; Renal Insufficiency And Cardiovascular Events (RIACE) Study Group; et al. Non-albuminuric renal impairment is a strong predictor of mortality in individuals with type 2 diabetes: The Renal Insufficiency And Cardiovascular Events (RIACE) Italian multicentre study. Diabetologia 2018, 61, 2277–2289. [Google Scholar] [CrossRef]
- Buyadaa, O.; Magliano, D.J.; Salim, A.; Koye, D.N.; Shaw, J.E. Risk of Rapid Kidney Function Decline, All-Cause Mortality, and Major Cardiovascular Events in Nonalbuminuric Chronic Kidney Disease in Type 2 Diabetes. Diabetes Care 2020, 43, 122–129. [Google Scholar] [CrossRef]
- Marenzi, G.; Cabiati, A.; Assanelli, E. Chronic kidney disease in acute coronary syndromes. World J. Nephrol. 2012, 1, 134–145. [Google Scholar] [CrossRef]
- Nayak-Rao, S.; Shenoy, M. Stroke in Patients with Chronic Kidney Disease: How do we Approach and Manage it? Indian J. Nephrol. 2017, 27, 167–171. [Google Scholar] [CrossRef] [PubMed]
- Go, A.S.; Chertow, G.M.; Fan, D.; McCulloch, C.E.; Hsu, C.-Y. Chronic kidney disease and the risks of death, cardiovascular events, and hospitalization. N. Engl. J. Med. 2004, 351, 1296–1305, Erratum in N. Engl. J. Med. 2008, 18, 4. [Google Scholar] [CrossRef] [PubMed]
- Song, M.; Graubard, B.I.; Rabkin, C.S.; Engels, E.A. Neutrophil-to-lymphocyte ratio and mortality in the United States general population. Sci. Rep. 2021, 11, 464. [Google Scholar] [CrossRef] [PubMed]
- Gurmu, M.Z.; Genet, S.; Gizaw, S.T.; Feyisa, T.O.; Gnanasekaran, N. Neutrophil–lymphocyte ratio as an inflammatory biomarker of diabetic nephropathy among type 2 diabetes mellitus patients: A comparative cross-sectional study. SAGE Open Med. 2022, 10, 20503121221140231. [Google Scholar] [CrossRef]
- Mortaz, E.; Alipoor, S.D.; Adcock, I.M.; Mumby, S.; Koenderman, L. Update on Neutrophil Function in Severe Inflammation. Front. Immunol. 2018, 9, 2171. [Google Scholar] [CrossRef]
- Wang, R.-T.; Zhang, J.-R.; Li, Y.; Liu, T.; Yu, K.-J. Neutrophil–Lymphocyte ratio is associated with arterial stiffness in diabetic retinopathy in type 2 diabetes. J. Diabetes Its Complicat. 2015, 29, 245–249. [Google Scholar] [CrossRef]
- Liu, C.; Ji, B.; Liang, Y.; Shi, J.; Wang, Y.; Ke, T.; Li, L.; Zhao, D.; Dai, Y.; Dong, Q.; et al. Cumulative blood pressure load as a predictor of arterial stiffness progression and incident diabetic kidney disease: A multicenter longitudinal study. Cardiovasc Diabetol. 2025, 24, 225. [Google Scholar] [CrossRef] [PubMed] [PubMed Central]
- Rayego-Mateos, S.; Rodrigues-Diez, R.R.; Fernandez-Fernandez, B.; Mora-Fernández, C.; Marchant, V.; Donate-Correa, J.; Navarro-González, J.F.; Ortiz, A.; Ruiz-Ortega, M. Targeting inflammation to treat diabetic kidney disease: The road to 2030. Kidney Int. 2023, 103, 282–296. [Google Scholar] [CrossRef] [PubMed]
- Jha, J.C.; Banal, C.; Chow, B.S.; Cooper, M.E.; Jandeleit-Dahm, K. Diabetes and Kidney Disease: Role of Oxidative Stress. Antioxid. Redox Signal. 2016, 25, 657–684. [Google Scholar] [CrossRef]
- Rakesh, B.; Pradeep, N.; Nischal, G. Correlation Between Neutrophil to Lymphocyte Ratio and Urine Albumin to Creatinine Ratio in Diabetic Nephropathy Patients: A Cross-sectional Study. J. Clin. Diagn. Res. 2024, 18, 33–37. [Google Scholar] [CrossRef]
- Wan, H.; Wang, Y.; Fang, S.; Chen, Y.; Zhang, W.; Xia, F.; Wang, N.; Lu, Y. Associations Between the Neutrophil-to-Lymphocyte Ratio and Diabetic Complications in Adults with Diabetes: A Cross-Sectional Study. J. Diabetes Res. 2020, 2020, 6219545. [Google Scholar] [CrossRef] [PubMed]
- Gorst, C.; Kwok, C.S.; Aslam, S.; Buchan, I.; Kontopantelis, E.; Myint, P.K.; Heatlie, G.; Loke, Y.; Rutter, M.K.; Mamas, M.A. Long-term Glycemic Variability and Risk of Adverse Outcomes: A Systematic Review and Meta-analysis. Diabetes Care 2015, 38, 2354–2369. [Google Scholar] [CrossRef]
- Sheng, C.-S.; Tian, J.; Miao, Y.; Cheng, Y.; Yang, Y.; Reaven, P.D.; Bloomgarden, Z.T.; Ning, G. Prognostic Significance of Long-term HbA1c Variability for All-Cause Mortality in the ACCORD Trial. Diabetes Care 2020, 43, 1185–1190. [Google Scholar] [CrossRef]
- Zhou, J.J.; Koska, J.; Bahn, G.; Reaven, P. Glycaemic variation is a predictor of all-cause mortality in the Veteran Affairs Diabetes Trial. Diabetes Vasc. Dis. Res. 2019, 16, 178–185. [Google Scholar] [CrossRef] [PubMed]
- Li, S.; Nemeth, I.; Donnelly, L.; Hapca, S.; Zhou, K.; Pearson, E.R. Visit-to-Visit HbA1c Variability Is Associated with Cardiovascular Disease and Microvascular Complications in Patients with Newly Diagnosed Type 2 Diabetes. Diabetes Care 2020, 43, 426–432. [Google Scholar] [CrossRef]
- Papachristoforou, E.; Lambadiari, V.; Maratou, E.; Makrilakis, K. Association of Glycemic Indices (Hyperglycemia, Glucose Variability, and Hypoglycemia) with Oxidative Stress and Diabetic Complications. J. Diabetes Res. 2020, 2020, 7489795. [Google Scholar] [CrossRef] [PubMed]
- Gohbara, M.; Hibi, K.; Mitsuhashi, T.; Maejima, N.; Iwahashi, N.; Kataoka, S.; Akiyama, E.; Tsukahara, K.; Kosuge, M.; Ebina, T.; et al. Glycemic Variability on Continuous Glucose Monitoring System Correlates with Non-Culprit Vessel Coronary Plaque Vulnerability in Patients with First-Episode Acute Coronary Syndrome—Optical Coherence Tomography Study. Circ. J. 2016, 80, 202–210. [Google Scholar] [CrossRef] [PubMed]
- Yang, H.K.; Kang, B.; Lee, S.-H.; Yoon, K.-H.; Hwang, B.-H.; Chang, K.; Han, K.; Kang, G.; Cho, J.H. Association between hemoglobin A1c variability and subclinical coronary atherosclerosis in subjects with type 2 diabetes. J. Diabetes Complicat. 2015, 29, 776–782. [Google Scholar] [CrossRef]
- Hirsch, I.B. Glycemic Variability and Diabetes Complications: Does It Matter? Of Course It Does! Diabetes Care 2015, 38, 1610–1614. [Google Scholar] [CrossRef]
- Esposito, K.; Giugliano, D.; Nappo, F.; Marfella, R.; Campanian Postprandial Hyperglycemia Study Group. Regression of carotid atherosclerosis by control of postprandial hyperglycemia in type 2 diabetes mellitus. Circulation 2004, 110, 214–219. [Google Scholar] [CrossRef]
- Kilpatrick, E.S.; Rigby, A.S.; Atkin, S.L. The effect of glucose variability on the risk of microvascular complications in type 1 diabetes. Diabetes Care 2006, 29, 1486–1490. [Google Scholar] [CrossRef]
- Koye, D.N.; Magliano, D.J.; Reid, C.M.; Jepson, C.; Feldman, H.I.; Herman, W.H.; Shaw, J.E. Risk of Progression of Nonalbuminuric CKD to End-Stage Kidney Disease in People with Diabetes: The CRIC (Chronic Renal Insufficiency Cohort) Study. Am. J. Kidney Dis. 2018, 72, 653–661. [Google Scholar] [CrossRef]
- Qin, Z.; Li, H.; Wang, L.; Geng, J.; Yang, Q.; Su, B.; Liao, R. Systemic Immune-Inflammation Index Is Associated with Increased Urinary Albumin Excretion: A Population-Based Study. Front. Immunol. 2022, 13, 863640. [Google Scholar] [CrossRef]
- Pontremoli, R. Microalbuminuria is an early marker of target organ damage in essential hypertension. Am. J. Hypertens. 1998, 11, 430–438. [Google Scholar] [CrossRef]
- Magri, C.J.; Fava, S. The role of tubular injury in diabetic nephropathy. Eur. J. Intern. Med. 2009, 20, 551–555. [Google Scholar] [CrossRef]
- Tang, S.; Leung, J.C.; Abe, K.; Chan, K.W.; Chan, L.Y.; Chan, T.M.; Lai, K.N. Albumin stimulates interleukin-8 expression in proximal tubular epithelial cells in vitro and in vivo. J. Clin. Investig. 2003, 111, 515–527. [Google Scholar] [CrossRef] [PubMed]
- Sánchez-Lozada, L.G.; Tapia, E.; Johnson, R.J.; Rodríguez-Iturbe, B.; Herrera-Acosta, J. Glomerular hemodynamic changes associated with arteriolar lesions and tubulointerstitial inflammation. Kidney Int. 2003, 64, S9–S14. [Google Scholar] [CrossRef] [PubMed]
- Lawson, C.A.; Seidu, S.; Zaccardi, F.; McCann, G.; Kadam, U.T.; Davies, M.J.; Lam, C.S.; Heerspink, H.L.; Khunti, K. Outcome trends in people with heart failure, type 2 diabetes mellitus and chronic kidney disease in the UK over twenty years. eClinicalMedicine 2021, 32, 100739. [Google Scholar] [CrossRef]
- Braunwald, E. Diabetes, heart failure, and renal dysfunction: The vicious circles. Prog. Cardiovasc. Dis. 2019, 62, 298–302. [Google Scholar] [CrossRef] [PubMed]
- Del Prato, S.; Felton, A.-M.; Munro, N.; Nesto, R.; Zimmet, P.; Zinman, B.; Global Partnership for Effective Diabetes Management. Improving glucose management: Ten steps to get more patients with type 2 diabetes to glycaemic goal. Int. J. Clin. Pract. 2005, 59, 1345–1355. [Google Scholar] [CrossRef]
Disclaimer/Publisher’s Note: The statements, opinions and data contained in all publications are solely those of the individual author(s) and contributor(s) and not of MDPI and/or the editor(s). MDPI and/or the editor(s) disclaim responsibility for any injury to people or property resulting from any ideas, methods, instructions or products referred to in the content. |
© 2026 by the authors. Licensee MDPI, Basel, Switzerland. This article is an open access article distributed under the terms and conditions of the Creative Commons Attribution (CC BY) license.