Abstract
This study explores a multi-resource approach for extracting and characterizing l-rhamnose-rich polysaccharides from nine natural biomasses, including green macroalgae (Ulva spp.), sumac species (Rhus spp.), and agro-industrial by-products such as sea buckthorn and sesame cakes. Hot-water and alkaline extractions were performed by biomass type, and the resulting fractions were analyzed using biochemical assays, monosaccharide profiling (HPAEC/PAD and GC/MS-EI), FTIR, and antioxidant activity tests. Extraction yields ranged from <1% in sea buckthorn residues to 15.48% in Ulva spp., which showed the highest recovery. l-rhamnose enrichment varied across biomasses: the highest proportions were found in Ulva extracts and Rhus semialata galls (PRS), reaching up to 44% of total sugars by HPAEC/PAD and 58% by GC/MS-EI. Antioxidant activities also differed markedly. In DPPH assays, the most active extracts were those from sea buckthorn berry cake (PTBA), Rhus coriaria seeds (PRC), and commercial sea buckthorn powder (PPA), with IC50 values of 32, 43, and 42 µg/mL, respectively. Hydroxyl-radical inhibition was also substantial, reaching 83.0% for PTBA, 79.4% for PRC, and 79.9% for Ulva lactuca at 1 g/L, compared with 97.5% for ascorbic acid. These results highlight specific biomasses as promising dual sources of l-rhamnose and natural antioxidants for valorization within a circular bioeconomy.
Keywords:
l-rhamnose; polysaccharides; Ulva; Rhus; sea buckthorn; sesame cake; antioxidant activity; extraction; characterization 1. Introduction
In the context of the transition toward a circular bioeconomy, the identification of new sources of naturally derived bioactive compounds has become a major scientific and industrial challenge. Among these, l-rhamnose (l-Rha), a rare deoxyhexose naturally found in certain plants, algae, and microorganisms, has emerged as a compound of strategic interest [1,2]. Frequently integrated into structural polysaccharides (PS), such as pectins (RG-I and RG-II) [3], ulvans [4], rhamnans [5], and bacterial exopolysaccharides [6], l-Rha represents a key target for developing innovative and sustainable production routes. This growing interest is reflected in the expansion of the global rhamnose market, valued at USD 320.75 million in 2024 and projected to reach USD 520.45 million by 2032, with a compound annual growth rate (CAGR) of 6.25% between 2025 and 2032 [7]. These figures highlight its increasing economic and industrial relevance.
l-Rha is widely used in the cosmetic, pharmaceutical, and nutraceutical industries, owing to its antioxidant [8], prebiotic [9], anti-inflammatory, and anti-aging properties [10,11,12]. For instance, it enhances dermal fibroblast regeneration and is incorporated into several high-end skincare formulations [10]. Moreover, l-Rha serves as an immunologically relevant saccharide motif, notably acting as an epitope in glycoconjugate vaccines and targeted therapeutic systems [13,14]. Despite its broad applications, industrial-scale production of l-Rha remains limited and costly, with analytical-grade l-Rha priced up to EUR 1500 per kilogram [15]. This high cost arises partly from the technical challenges of conventional production methods. Although chemical synthesis from precursors such as d-glucose or d-mannose is feasible, it involves multiple complex reaction steps requiring stereoselective control and often fails to yield the natural l-configuration, instead producing mixtures or d-epimer-dominant products [16,17]. These processes may generate toxic or aromatic by-products and typically require harsh reaction conditions and specialized purification procedures. In parallel, biotechnological approaches to l-Rha production face major obstacles, particularly the limited availability of l-specific biocatalysts. The engineering of key enzymes, such as l-Rha synthase (E.C. 1.1.1.133) [18] and/or rhamnosyltransferases (E.C. 2.4.1.XX) [19], remains challenging due to the complexity of the metabolic pathway [1,20], representing a major bottleneck to efficient and competitive enzymatic production routes.
From this perspective, the RAh project (ANR-23-CE43-0011) was initiated to develop a sustainable l-Rha production pathway by combining rational biomass selection, eco-friendly extraction, and enzymatic bioconversion. Its originality lies in a multi-resource valorization strategy, exploiting diverse biomasses, including green algae (Ulva rigida, Ulva lactuca), sumac species (Rhus coriaria, Rhus typhina, Rhus semialata), and agro-industrial by-products including sesame cake and sea buckthorn residues. This study, conducted as part of the project’s exploratory phase, addresses three complementary objectives: (i) to evaluate the extraction yield and biochemical composition of PS obtained from nine distinct biomasses; (ii) to characterize their monosaccharide profiles, with a particular emphasis on l-Rha content; (iii) to assess their antioxidant potential to support functional valorization.
2. Materials and Methods
2.1. Biological Materials
All biological raw materials were provided by GreenTech (Saint-Beauzire, France). Dried samples of U. rigida (Lot BUR.0823.4) and U. lactuca (Lot SUL.0121.4) were delivered as received, with no prior treatment. Seeds of R. coriaria (Lot T27018) and galls of R. semialata (Lot 230708) were ground into a fine, homogenized powder prior to extraction. Other biomasses, including R. typhina seeds (Lot 230815), commercial sea buckthorn powder, and cakes derived from sea buckthorn (Hippophae rhamnoides, berries (Lot SB B P 01) and seeds (Lot SB S P 01), and sesame (Sesamum indicum), were provided as dry powders. All materials were stored at ambient temperature in sealed containers until extraction.
2.2. Polysaccharide Extraction Protocols
2.2.1. Ulva lactuca and Ulva rigida
The extraction protocol was adapted from Fávero Massocato et al. [21]. Briefly, 50 g of dried algal material were subjected to successive extractions (4×) with 1 L of absolute ethanol under continuous magnetic stirring (1200 rpm) for 2 h at room temperature. Centrifugation was performed at 7440× g for 15 min at room temperature after each cycle. The residual biomass was then suspended in 1 L of ultrapure water and heated at 80 °C for 2 h under agitation (1200 rpm). The supernatant was collected after centrifugation (7440× g for 15 min at room temperature), and this aqueous extraction step was repeated once to ensure maximum recovery. Supernatants were pooled, and three volumes of cold ethanol (−20 °C) were added to precipitate the PS. After 12 h at 4 °C, the precipitate was recovered by centrifugation (7440× g for 15 min at room temperature), washed with acetone, and dried at 55 °C to constant weight. The resulting polysaccharide extracts were labeled PUR (U. rigida) and PUL (U. lactuca).
2.2.2. Sea Buckthorn (Commercial Powder, Berries, and Seed Cake)
This procedure was based on Li et al. [22] with minor modifications. Briefly, 50 g of each powdered form were defatted under reflux with 125 mL of 96% ethanol at 70 °C for 4 h (solid-to-liquid ratio = 1:2.5). After vacuum filtration, the residue was extracted in 2 L of ultrapure water (solid-to-liquid ratio = 1:40) at 90 °C under reflux for 4 h. The supernatant was recovered by centrifugation (3000× g for 10 min at room temperature), then concentrated under reduced pressure at 45 °C to 1/8 of its original volume. Proteins were removed using the Sevag method (chloroform: n-butanol, 4:1, v/v), with iterative extractions (20 min agitation and centrifugation at 5000× g for 10 min at room temperature) repeated four times for seed cake and berry cake, and three times for commercial powder. PS were precipitated by adding 750 mL of cold 96% ethanol (−20 °C) and incubated at 4 °C for 12 h. After centrifugation (8000× g for 20 min at 10 °C), the pellet was lyophilized. The resulting polysaccharide extracts were labeled PTGA (seed cake), PTBA (berry cake), and PPA (commercial powder).
2.2.3. Sesame Cake
Following Li et al. [23], 50 g of sesame cake were extracted with 1.25 L of 5% KOH at 75 °C under reflux for 4 h. The suspension was filtered through sintered glass (16 μm), and the filtrate was adjusted to pH 5.5 using HCl (10 mol/L). After centrifugation (5180× g for 35 min at room temperature), the supernatant was concentrated under vacuum at 45 °C to one-tenth of its volume. Proteins were removed using Sevag reagent (1:1, v/v), followed by ethanol precipitation (375 mL, 96%, −20 °C, 12 h). The resulting precipitate was centrifuged (5000× g for 10 min at room temperature), dialyzed (MWCO = 3000 Da) against ultrapure water for 10 days until the conductivity reached approximately 500 µS/cm, and finally lyophilized. The extract was designated PTS.
2.2.4. Rhus spp. (R. typhina, R. coriaria, R. semialata)
The method was derived from Hu et al. [24]. Powdered material (50 g) was extracted with 2 L of ultrapure water under gentle agitation (600 rpm) at 90 °C for 2 h. The supernatant was recovered by centrifugation (11,000× g for 15 min at room temperature) and PS were precipitated with cold 96% ethanol (3:1, v/v), then incubated at 4 °C for 12 h. The precipitate was recovered by centrifugation (14,880× g for 15 min at room temperature), redissolved in ultrapure water, and lyophilized. Extracts were labeled PRC (R. coriaria), PRS (R. semialata), and PRT (R. typhina).
2.3. Physicochemical and Biochemical Characterization
2.3.1. Conductivity Measurement
The conductivity of aqueous extracts was determined using a sensION™+ EC7 conductometer (HACH, Derio, Spain) prior to lyophilization. Diafiltration was performed when conductivity exceeded 1 mS/cm and stopped once it reached approximately 1 mS/cm, a practical compromise between effective salt removal and filtration time.
2.3.2. Total Sugar Content
Total carbohydrate content was measured using the phenol–sulfuric acid assay [25]. Briefly, 500 µL of sample or d-glucose standard (0–0.1 g/L) were mixed with 500 µL of 5% (w/v) phenol and 2.5 mL of concentrated sulfuric acid. Tubes were incubated for 10 min at room temperature, followed by 30 min at 35 °C. Absorbance was recorded at 483 nm on a UV–visible spectrophotometer (JASCO V-730, JAPAN Spectroscopy Corporation, Tokyo, Japan).
2.3.3. Neutral Sugar and Uronic Acid Content
Neutral and uronic sugars were quantified using two complementary colorimetric assays. Neutral sugars were determined using the resorcinol–sulfuric acid method [26]. In each assay, 200 µL of sample were mixed with 200 µL of resorcinol solution (6 g/L), followed by the addition of 1 mL of 80% (v/v) sulfuric acid. After vortexing, the tubes were incubated at 90 °C for 30 min in a water bath. After cooling in the dark for 30 min, 1.4 mL of ultrapure water were added, and absorbance at 450 nm was measured on a UV–visible spectrophotometer (JASCO V-730, Japan).
Uronic acids were quantified according to Blumenkrantz and Asboe-Hansen [27]. Briefly, 200 µL of sample were mixed with 1 mL of 0.12 M sodium tetraborate in concentrated sulfuric acid, vortexed, and incubated at 90 °C for 1 h. After heating, 200 µL of meta-hydroxydiphenyl reagent (100 g/L) were added, followed by a second incubation at 90 °C for 2 min. Samples were cooled to room temperature, and absorbance was measured at 520 nm.
To correct for potential interferences between neutral and acidic sugars, the Montreuil and Spik [28] corrective equations were used (Equations (1) and (2)).
where [NS] is the neutral sugar concentration; [UA] is the uronic acid concentration; Aresorcinol is the absorbance at 450 nm from the resorcinol assay; AmHDP is the absorbance at 520 nm from the mHDP assay; α is the slope of the neutral sugar standard curve in resorcinol assay; β is the slope of the uronic acid standard curve in resorcinol assay, α′ is the slope of the neutral sugar standard curve in mHDP assay, and β′ is the slope of the uronic acid standard curve in mHDP assay.
2.3.4. Sulfate Content
Sulfate content was measured using a turbidimetric method based on precipitation of sulfate ions with barium chloride (BaCl2) in the presence of gelatin [29]. For each sample, 10 mg of dry matter were hydrolyzed with 250 µL of 2 M hydrochloric acid and heated at 100 °C for 2 h. After cooling, the tubes were centrifuged at 13,000× g for 30 min at room temperature. For analysis, 100 µL of the supernatant were mixed with 900 µL of ultrapure water, 100 µL of 0.5 M HCl, and 50 µL of BaCl2/gelatin reagent. After vortexing, the mixture was left to stand at room temperature for 30 min. A final vortex was performed before measuring the absorbance at 550 nm using a UV–visible spectrophotometer (JASCO V-730, Japan).
2.3.5. Protein Content
Protein levels were determined using the Bradford assay [30] with bovine serum albumin (BSA) as standard. Briefly, 200 µL of samples were mixed with 600 µL ultrapure water and 200 µL of Bradford reagent and incubated for 15 min at room temperature. Absorbance at 595 nm was determined with a UV–visible spectrophotometer (JASCO V-730, Japan). A BSA standard curve (0–1 g/L) was prepared using the same procedure.
2.3.6. Total Phenolic Content
Total phenolic compounds were quantified according to the Folin–Ciocalteu method [31]. For each assay, 100 µL of sample were mixed with 4.9 mL of ultrapure water and 500 µL of Folin–Ciocalteu reagent. After 3 min, 1 mL of 35% (w/v) sodium carbonate was added, followed by 3.5 mL of ultrapure water. The reaction mixture was incubated in the dark at room temperature for 30 min before measuring absorbance at 765 nm using a UV–visible spectrophotometer (JASCO V-730, Japan). Gallic acid was used as the reference compound.
2.4. Structural Characterization
2.4.1. FTIR Spectroscopy
Fourier-Transform Infrared (FT-IR) measurements were carried out using a VERTEX 70 spectrometer (Bruker, Ettlingen, Germany). PS samples were analyzed by attenuated total reflectance (ATR) using a diamond A225 crystal. For each sample, air was recorded as the background spectrum prior to measurement. Spectra were collected at room temperature, over 400–5000 cm−1, with 50 scans accumulated per spectrum. Data processing and spectral interpretation were performed using OPUS 7.2 software, and spectra were plotted using OriginPro 2024 (version 10.1.0.170, OriginLab Corporation, Northampton, MA, USA).
2.4.2. HPAEC-PAD Analysis
Monosaccharide composition was determined after acid hydrolysis followed by High-Performance Anion-Exchange Chromatography with Pulsed Amperometric Detection (HPAEC-PAD). For hydrolysis, 10 mg of polysaccharide were mixed with 1 mL of 2 M trifluoroacetic acid (TFA) in glass tubes and incubated for 90 min at 120 °C in a dry bath. After hydrolysis, samples were rapidly cooled to room temperature to stop the reaction, and neutralized to pH 7 using 35% (w/v) ammonium hydroxide. The mixture was centrifuged at 14,000× g for 15 min at room temperature. Supernatants were diluted (1:10 and 1:100) and filtered through nylon syringe filters (0.22 μm pore size, 4 mm diameter) before injection.
Analysis was performed using a Dionex ICS-3000 system (Thermo Fisher Scientific, Sunnyvale, CA, USA) equipped with a gradient pump (SP), a platinum working electrode, an Ag/AgCl reference electrode, and an electrochemical detector (ED) operated in pulsed amperometric detection (PAD) mode. Eluents were helium-sparged for 30 min prior to use. Separation was carried out on a CarboPac PA-1 analytical column (4 mm × 250 mm) coupled to a CarboPac PA-1 guard column (4 mm × 50 mm, Dionex), thermostated at 25 °C, using an isocratic elution with 18 mM NaOH for 30 min, followed by a linear gradient of sodium acetate in 200 mM NaOH (up to 100% 1 M sodium acetate) for 20 min. Finally, the column was then washed with 200 mM NaOH for 15 min and re-equilibrated with 18 mM NaOH for 7 min. A 25 μL volume of each sample was injected at 1 mL/min with the column thermostated at 25 °C. Monosaccharides (l-arabinose, l-rhamnose, d-glucose, d-mannose, d-galactose, d-glucuronic acid, d-galacturonic acid, l-fucose, and d-xylose) were identified by comparing retention times with those of commercial standards. Data were processed using Chromeleon software (version 6.8).
2.4.3. GC/MS-EI Analysis
Monosaccharide composition was also determined by Gas Chromatography/Mass Spectrometry with Electron Ionization (GC/MS-EI) following derivatization. Ten milligrams of polysaccharide were hydrolyzed with 1 mL of 2 M trifluoroacetic acid (TFA) for 90 min at 120 °C under stirring (1000 rpm). The hydrolysate was evaporated under nitrogen at 60 °C and washed three times with 1 mL of methanol, each wash being followed by evaporation. Derivatization was carried out using a 1:1 (v/v) mixture of pyridine and BSTFA at room temperature for 2 h, according to a procedure adapted from Pierre et al. [32,33]. The derivatized residues were dissolved in dichloromethane (10 g/L) prior to analysis. Standard monosaccharides (l-arabinose, l-rhamnose, d-glucose, d-mannose, d-galactose, d-glucuronic acid, d-galacturonic acid, l-fucose, d-xylose, and d-ribose) were derivatized in the same way for identification and quantification.
GC/MS-EI analyses were performed on a Shimadzu Nexis GC-2030 (Kyoto, Tokyo) coupled to a QP2020NX detector, using an OPTIMA-1MS Accent column (30 m × 0.25 mm × 0.25 μm, Macherey-Nagel, Düren, Germany). Hydrogen was used as carrier gas (1.75 mL/min linear velocity, 54.0 kPa pressure, split ratio 50:1). The oven temperature program was 100 °C (2.75 min), 8.40 °C/min to 200 °C, then 5.20 °C/min to 215 °C (hold 0.95 min). EI was applied at 70 eV, with a trap temperature of 150 °C and m/z 40–800. Data were processed using LabSolutions GCMS Solution, version 4.50 SP1 (Shimadzu Corporation, Kyoto, Japan).
2.5. Antioxidant Activity
2.5.1. DPPH Radical Scavenging Activity
The antioxidant activity of the PS was evaluated by scavenging of DPPH (2,2-diphenyl-1-picrylhydrazyl) free radicals [34]. Briefly, 500 µL of each polysaccharide solution (0–1 g/L) were mixed with 500 µL of a 0.1 mM DPPH solution in absolute ethanol. The mixture was vortexed and incubated for 30 min at room temperature in the dark. Absorbance was measured at 517 nm using a UV–visible spectrophotometer (JASCO V-730, Japan). The radical scavenging activity was calculated using the following equation (Equation (3)):
where Asample is the absorbance of the sample + DPPH mixture, Acontrol is the absorbance of ultrapure water + DPPH, and A0 is the absorbance of the sample + ethanol mixture.
Antioxidant activity was expressed as percentages of DPPH inhibition, from which IC50 values were determined based on the mean inhibition and estimated by linear interpolation using R (version 4.5.1). Ascorbic acid (0–1 g/L) served as a positive control.
2.5.2. Hydroxyl Radical Scavenging Activity
The hydroxyl radical scavenging activity was determined following a modified protocol from Delattre et al. [34]. For each assay, 200 µL of sample solution (0 to 1 g/L) were mixed with 200 µL of 5 mM aqueous FeSO4 solution, followed by brief mixing and the addition of 200 µL of 1% (v/v) hydrogen peroxide (H2O2) solution. Hydroxyl radicals were generated via the Fenton reaction (Fe2+ and H2O2). The mixture was incubated at room temperature for 60 min in the dark. Then, 1 mL of ultrapure water was added to stop the reaction. Absorbance was measured at 510 nm using a UV–visible spectrophotometer (JASCO V-730, Japan). A decrease in absorbance indicates OH• scavenging. The percentage inhibition was calculated (Equation (4)):
where Asample is the absorbance of the sample + FeSO4 + H2O2 mixture, and Acontrol is the absorbance of the control mixture (ultrapure water instead of sample). Ascorbic acid (0–1 g/L) was used as a reference antioxidant.
2.6. Statistical Analysis
Statistical analyses were performed for antioxidant activity measurements using Minitab Statistical Software (version 20.3, 64-bit; © 2021 Minitab, LLC, State College, PA, USA). The normality of residuals was assessed using the Ryan–Joiner test. For each concentration tested, differences among extracts were evaluated using a one-way analysis of variance (ANOVA). When the factor effect was significant (p < 0.05), multiple pairwise comparisons were performed using Tukey’s test (95% confidence level). All data are expressed as mean ± standard deviation (n = 3).
3. Results and Discussion
3.1. Extraction Yields and Chemical Compositions
The extraction yields and biochemical compositions of PS varied considerably depending on the biomass source, as summarized in Table 1. Beyond botanical origin, part of this variability arose from the methodological adjustments required for certain biomasses. Highly soluble matrices such as Ulva were extracted under mild aqueous conditions, whereas more recalcitrant materials (Rhus, sea buckthorn, sesame) required prolonged heating or, in specific cases, mild alkaline conditions. These differences could influence polysaccharide solubilization, co-extraction of proteins or phenolics, and potential heat-induced fragmentation.

Table 1.
Extraction yields and biochemical characterization of polysaccharides.
The green algae U. lactuca (PUL) and U. rigida (PUR) exhibited the highest yields (15.48% and 10.96%, respectively), consistent with their known richness in water-soluble ulvans and the relatively low lignification of their cell walls. Although these values are lower than the maximum yields reported for more intensive extraction protocols (38%), they remain notably high considering the mild aqueous conditions applied, without any chemical pretreatment.
Conversely, sea buckthorn by-products (PTBA, PTGA, PPA) yielded less than 1%, likely due to prior industrial processing that depleted the water-soluble fraction and/or to rigid cell wall structures limiting polysaccharide accessibility [35]. These results are consistent with the known difficulty of recovering high-molecular-weight PS from fruit residues after juice or oil extraction, where soluble compounds are largely removed during processing [36]. Intermediate yields were obtained from the Rhus species (PRS, PRC, PRT), ranging from 1.86% to 2.86%, and from sesame cake (PTS, 1.96%). These moderate values may reflect the high content of tannins and polyphenols in Rhus materials, which can complex with PS and reduce their extractability [37]. Despite their relatively high yield, the PUR and PUL extracts contained only moderate total sugar levels (32–36%), in agreement with previous studies on ulvans [38,39]. Slight differences were observed between the total sugar content and the sum of neutral sugars and uronic acids across the extracts. Such discrepancies are common in colorimetric assays and arise primarily from the use of glucose as a standard, which is not always the predominant monosaccharide. Because several extracts contain sugars with different colorimetric response factors, such as rhamnose, xylose, or uronic acids, as well as interferences from contaminants (proteins, polyphenols, salts, etc.), slight under- or overestimation may occur [40]. The high residual conductivity measured after diafiltration (around 800 µS/cm) indicates the presence of salts or low-molecular-weight non-carbohydrate compounds that are undetectable by conventional biochemical assays but contribute to the overall extract mass. The sulfate content (around 15%) confirmed the presence of sulfated ulvans, characteristic of Ulva cell walls [41,42]. The PTBA extract, despite its low yield, also showed a moderate sugar content (34.66%), comparable to that of the Ulva extracts. Similar observations have been reported by Shi et al. [43] and Liu et al. [44]. The PPA extract revealed a more complex composition, with sugars (32.1%), proteins (5.12%), and phenolic compounds (4.18%), reflecting the inherent heterogeneity of the sea buckthorn biomass. PTGA displayed the lowest sugar content (20.1%) and negligible protein levels, consistent with the strong recalcitrance of lignified seed cell walls. The Rhus extracts displayed sugar contents between 21% and 27%, consistent with their structurally complex polyphenol-rich matrices [45]. PRC exhibited a notably high uronic acid content (11.27%), suggesting the presence of acidic pectic PS, while PRS showed an unusually elevated sulfate content (9.55%). This latter observation could be due either to natural sulfation, a feature rarely reported in terrestrial plant PS, or to partial retention of inorganic sulfate ions during purification. The PRT extract contained substantial proteins (12.27%), indicating the possible co-extraction of glycoproteins. Finally, the PTS extract was characterized by a high protein content (14.66%), consistent with the protein-rich nature of sesame residues [46], and may contain soluble proteins or glycoprotein complexes. Its sugar content (20.93%) remained moderate.
Overall, the variability in yields and composition reflects the combined effects of botanical origin, cell wall architecture, and prior industrial treatments. The inclusion of underexplored biomasses such as Rhus species is particularly noteworthy, as this study provides one of the first comparative biochemical profiles of their polysaccharide fractions. This diversity supports the multi-resource strategy adopted here and establishes a solid foundation for subsequent structural and functional analyses.
3.2. FTIR Analysis of Polysaccharide Extracts
The infrared spectra obtained for all polysaccharide extracts (Figure 1) showed characteristic absorption bands typical of carbohydrate structures.

Figure 1.
FTIR spectra of polysaccharide extracts. PTGA (sea buckthorn seed cake) (a), PTBA (sea buckthorn berry cake) (b), PPA (commercial sea buckthorn powder) (c), PRS (R. semialata galls) (d), PRT (R. typhina seeds) (e), PRC (R. coriaria seeds) (f), PTS (sesame seed cake) (g), PUL (U. lactuca) (h), and PUR (U. rigida) (i).
A broad band between 3200 and 3400 cm−1 was assigned to the stretching vibrations of hydroxyl groups (-OH), indicative of extensive hydrogen bonding typical of PS. A distinct absorption around 1600–1650 cm−1 corresponded to C=O stretching of uronic acids, consistent with the presence of these residues as revealed by biochemical analyses. Additional signals at 1400–1450 cm−1 and 1550–1610 cm−1 were attributed to the symmetric and asymmetric vibrations of carboxylate groups (COO−), while bands in the 1000–1150 cm−1 region were assigned to C–O–C and C–O vibrations, confirming the polysaccharide backbone. These assignments are consistent with FTIR profiles previously reported for PS from various natural sources [42,47,48,49].
Beyond these common features, specific structural differences were observed among the extracts. The spectral region between 1150 and 750 cm−1, often described as the fingerprint region [50], was informative. In this range, the spectra of PUR and PUL displayed intense bands at 1250–1270 cm−1 and 820–850 cm−1, corresponding respectively to S=O and C–O–S stretching vibrations. Such bands are characteristic of sulfated PS and closely mirror the spectral profiles reported for ulvans [42,51,52,53], in agreement with the high sulfate content determined in these two extracts. Additional C–O–S stretching bands were also detected in PPA and PRS, supporting the presence of sulfate groups in these matrices and corroborating recent reports highlighting their structural heterogeneity [54,55]. The PRC spectrum showed a distinct signal at 1250–1270 cm−1, consistent with moderate sulfation, as reported for other Rhus species [56]. In contrast, PRT and PTS did not present bands typically associated with sulfation. Instead, bands assigned to N–H vibrations (3200–3400 cm−1) and an amide band around 1500 cm−1 were observed, suggesting the presence of residual protein fractions. These results align with previous studies on sea buckthorn PS [55] and sesame [57]. Overall, FTIR analysis confirmed the polysaccharide nature of all extracts and revealed structural features that varied depending on their biological origin. The consistency between the obtained spectra and those previously reported for algal and plant-derived PS confirms the band assignments and provides a preliminary level of structural characterization, to be further refined through chromatographic analyses.
3.3. Monosaccharide Composition
The monosaccharide composition of the PS extracts was analyzed using two complementary analytical techniques: HPAEC-PAD and GC/MS-EI. These methods rely on distinct physicochemical principles: HPAEC-PAD enables rapid, direct detection of sugars without derivatization by separating their ionized forms in the aqueous phase, whereas GC/MS-EI requires silylation of monosaccharides, thereby enhancing the detection of neutral and deoxy sugars [58,59,60,61]. Combining both approaches provides a comprehensive overview of the saccharide composition, allowing the quantification of both highly ionizable sugars (uronic acids) and less abundant sugars (l-Rha, l-fucose, d-ribose).
The HPAEC-PAD profiles (Table 2) revealed pronounced inter-sample variability, particularly for l-Rha, which ranged from less than 1% to more than 50% of total sugars. The corresponding chromatographic profiles, shown in Figure S1, clearly illustrate these differences visually, with the characteristic l-Rha peak appearing at 8.8 min in the enriched samples.
Table 2.
Monosaccharide compositions determined by HPAEC-PAD.
The PRS, PUL, and PUR extracts were clearly distinguished by their enrichment in l-Rha (50.09%, 47.70%, and 44.68%, respectively), accompanied by notable amounts of uronic acids (20–33%), mainly d-glucuronic acid. Such compositions indicate the presence of complex heteropolysaccharides dominated by rhamnosylated and uronic units, typical of sulfated ulvans in Ulvophyceae [62,63], but unusual in Rhus species, where l-Rha is generally minor (<3%) [64,65]. Few studies have described the composition of PS extracted from R. semialata galls, although some have reported the occurrence of l-Rha within their phenolic-rich fractions [66]. In these extracts, d-glucose remained low (12–13%), reinforcing the hypothesis of a non-glucanic, rhamno-uronic backbone that may be highly substituted. Terrestrial plant extracts displayed more heterogeneous saccharide signatures. PRT was dominated by d-xylose (46.05%) and l-arabinose (22.94%), with negligible l-Rha (0.89%), a configuration typical of arabinoxylans, the main constituents of secondary plant cell walls [67,68]. PTS followed a similar pattern, characterized by neutral sugars, particularly l-arabinose (31.77%) and d-xylose (18.26%), consistent with arabinoxylan-type hemicelluloses commonly found in oilseed residues [69,70,71]. Extracts from sea buckthorn (PTBA, PTGA, PPA) displayed intermediate profiles: weakly rhamnosylated (<3%), they contained mainly D-glucose (29–33%), D-galactose (10–13%), and D-galacturonic acid (16–36%), suggesting the presence of lightly branched pectins or glucans associated with acidic PS from the pericarp or seed coat [67]. PRC (R. coriaria) and PTGA were further distinguished by their high galacturonic acid contents (39.29% and 36.38%) and diverse neutral sugars (d-glucose, d-galactose, l-arabinose), indicative of complex pectic matrices where l-Rha plays a secondary role [72].
The GC/MS-EI results (Table 3, Figure S2) confirmed these overall trends while revealing quantitative differences attributable to derivatization efficiency and the intrinsic sensitivity of gas-phase detection.
Table 3.
Monosaccharide compositions determined by GC-MS.
Consistent with the HPAEC-PAD data, PRS, PUL, and PUR exhibited the highest levels of l-Rha (71.51%, 74.12%, and 58.84%), confirming their highly rhamnosylated nature. The relative overestimation of l-Rha by GC/MS compared with HPAEC values is consistent with earlier reports showing more efficient derivatization of deoxy sugars during silylation, whereas uronic acids are only partially derivatized, leading to their underrepresentation [60,61]. Nevertheless, both techniques converge on the same compositional pattern dominated by l-Rha- and d-glucuronate-rich polymers. Sea buckthorn extracts (PTGA, PTBA, PPA) also showed strong consistency between both methods. PTGA displayed a balanced distribution of d-glucose (29.20%), D-galactose (27.28%), and d-galacturonic acid (24.32%). PTBA and PPA showed similar ratios, with d-galacturonic acid (19–37%) predominating alongside d-glucose and l-arabinose, characteristic of pectic or arabinogalactan networks typically found in fruit tissues [67]. These findings are in good agreement with the HPAEC-PAD data, confirming the acidic nature and low l-Rha content of these PS. The PRT and PTS profiles further corroborated the predominance of arabinoxylans. PRT contained 42.58% d-xylose and 32.66% l-arabinose, while PTS combined similar proportions of arabinose (33.85%) and xylose (9.27%) with moderate d-glucose levels (18.59%). Interestingly, GC/MS-EI also detected small amounts of d-ribose (0.34–0.84%), absent from the HPAEC-PAD profiles, highlighting the higher sensitivity of GC/MS for certain volatile pentoses [73]. Finally, PRC, rich in d-galacturonic acid (48.77%), d-galactose (13.80%), d-glucose (10.40%), and l-arabinose (17.51%), presented a high proportion of uronic acids, confirming the pectic nature of its major PS.
The comparison between the two analytical approaches highlights their strong complementarity. HPAEC-PAD is better suited for accurate quantification of uronic acids and hydrophilic sugars, owing to the direct detection of their ionized forms, whereas GC/MS-EI provides a more detailed view of neutral and deoxy sugars, which are more efficiently revealed after silylation [58,59]. However, the absence of mass detection in HPAEC-PAD may lead to co-elution phenomena between closely eluting monosaccharides, particularly among hexoses and deoxy sugars, thereby complicating their unambiguous identification [58,59,60,74]. The variations observed in relative proportions (notably for l-Rha and d-galacturonic acid) mainly arise from these analytical contrasts: variable volatility, limited derivatization efficiency of uronic acids, co-elution of sugars, and derivatization yield differences. Beyond these general differences, the systematically higher l-Rha values obtained by GC/MS-EI reflect the specific behavior of deoxy sugars during sample preparation. As demonstrated by Pico et al. [74], silylation produces highly stable and efficiently volatilized derivatives for deoxyhexoses, improving both recovery and detector response. In contrast, deoxy sugars are more susceptible to partial degradation during acid hydrolysis and often display weaker anodic responses in PAD detection, which can lead to underestimation. Despite these methodological discrepancies, both techniques yielded a consistent classification of the samples: (i) highly rhamnosylated extracts (PRS, PUL, PUR), characterized by PS rich in l-Rha; (ii) pectic or mixed extracts (PRC, PTGA, PTBA, PPA), dominated by d-galacturonic acid and d-galactose; and (iii) arabinoxylan-type extracts (PRT, PTS) primarily composed of neutral sugars.
3.4. Evaluation of the l-Rha Valorization Potential from the Studied Biomasses
The combined estimation of the amount of l-Rha obtained per kilogram of biomass and the associated extraction costs provided a relevant basis for comparing the practical interest of the studied resources in a valorization perspective (Figure 2). Although U. lactuca (PUL) and U. rigida (PUR) exhibited the highest l-Rha contents (27.0 and 15.9 g/kg, respectively), their extraction relied on solvent-intensive hot extraction steps, resulting in particularly high processing costs (6426 USD/kg). Under these conditions, the theoretical commercial value of the recovered l-Rha (24–41 USD/kg, based on 1.5 USD/g) remained far below the production cost, making these processes non-competitive in their current state, despite the biochemical potential of these algal biomasses.
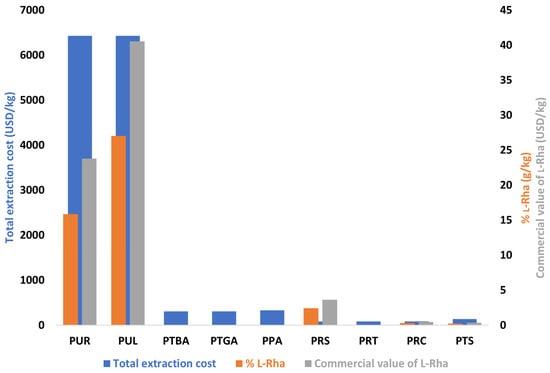
Figure 2.
Production and economic valuation of l-Rha extracted from various biomasses. Total extraction cost includes raw material and solvents (left axis), yield (g/kg of biomass), and estimated commercial value of the recovered l-Rha (right axis) regardless of the downstream processes for separating and/or purifying it. Biomass acquisition prices were provided by the Greentech supplier. Solvent costs correspond to average Sigma-Aldrich prices [75]. Calculations assume an 80% recovery of ethanol and acetone; expenses related to electricity, water, and miscellaneous consumables were not included. The commercial value was estimated by multiplying the L-Rha yield by a unit price of 1.5 USD/g [75]. PUR (U. rigida), PUL (U. lactuca), PTBA (sea buckthorn berry cake), PTGA (sea buckthorn seed cake), PPA (commercial sea buckthorn powder), PRS (R. semialata galls), PRT (R. typhina seeds), PRC (R. coriaria seeds), and PTS (sesame seed cake).
In contrast, R. semialata (PRS) offered a more balanced profile: although its l-Rha content was more moderate (2.42 g/kg), the total extraction process was significantly less costly (85 USD/kg), which greatly narrowed the gap between production cost and potential commercial value. PRS thus emerged as the most promising biomass among those studied, not because it provided the highest l-Rha yield, but because it offered the best compromise between yield, cost, and operational simplicity. The other biomasses (R coriaria, R typhina, sea buckthorn, and sesame) fell into less favorable zones, either due to insufficient l-Rha content or because processing costs remained disproportionate relative to the extractable amount. This analysis demonstrates that l-Rha content alone is not sufficient to evaluate the feasibility of a valorization pathway: economic viability depends on the combined consideration of biochemical composition, extraction conditions, and cost structure. In the present case, the production cost largely exceeds the market value of the recovered l-Rha, indicating that the process can only become competitive if optimizations are implemented. Relevant improvement strategies include reducing solvent volumes (e.g., process intensification, assisted extraction, or pre-concentration under reduced pressure before precipitation), integrating continuous extraction steps, or employing lower-cost solvent systems.
3.5. Antioxidant Activities
3.5.1. DPPH Radical Scavenging Activity
The antioxidant activity of the PS extracts was first assessed using the DPPH radical-scavenging assay, which was based on the ability of antioxidants to donate a hydrogen atom or an electron to neutralize the stable DPPH radical. As illustrated in Figure 3, scavenging efficiency varied significantly depending on the biomass origin and the concentration of the extract (Tukey-HSD test, p < 0.05). The most active extracts, PTBA, PPA, PRC, and PRS, exhibited IC50 values of 32.0 mg/L, 42 mg/L, 43.0 mg/L, and 49.0 mg/L, respectively (Figure 3c). At 1 g/L, their inhibition rates approached that of ascorbic acid (97.03%), with respective values of 97.4%, 91.3%, 94.3%, and 78.89% (Figure 3b). These results exceeded those reported for other plant-derived PS, such as sea buckthorn (IC50 of 280 mg/L [55]) and Ramulus mori (75 mg/L [76]), while remaining lower than those of citrus peel PS (0.38 mg/L [77]). The high antioxidant activity of PRC can be attributed to its richness in d-galactose and l-arabinose, which are involved in the formation of branched structures that increase the density of hydroxyl groups and thus the potential radical-scavenging sites. Similarly, the abundance of uronic acids in PRS, together with moderate sulfation, enhances activity by facilitating proton donation and stabilizing radical species [78]. PTBA and PPA, containing d-xylose, d-glucose, and d-galacturonic acid and measurable phenolic compounds, benefit from synergistic interactions that strengthen antioxidant performance [79]. These efficiencies can be further rationalized by considering functional groups capable of stabilizing radicals: hydroxyl (-OH) and carboxyl (-COOH) groups donate protons, amino (-NH) groups participate via hydrogen bonding, and sulfate moieties (-S=O, C-O-S) promote proton transfer and stabilize radical intermediates. Together, sugar composition, molecular branching, and these chemical features appear critical in determining DPPH scavenging efficiency [78,80]. Moderately active extracts, PRT, PUL, PTS, and PTGA, showed IC50 values of 81.0 mg/L, 90.0 mg/L, 128.0 mg/L, and 152.0 mg/L, respectively. PRT, although rich in d-xylose and l-arabinose but poor in uronic acids, indicates the importance of sugar diversity and chain organization in DPPH radical scavenging [81]. The activity of PUL may result from the presence of sulfate groups, known to activate the hydrogen of the anomeric carbon and thus enhance the ability of PS to donate hydrogen atoms [82]. PTS, despite its low uronic acid content, showed intermediate activity, likely enhanced by its protein content, which could stabilize active sites and amplify radical-scavenging effects, as reported by Liu et al. [83]. PTGA showed the lowest antioxidant efficiency within this group.
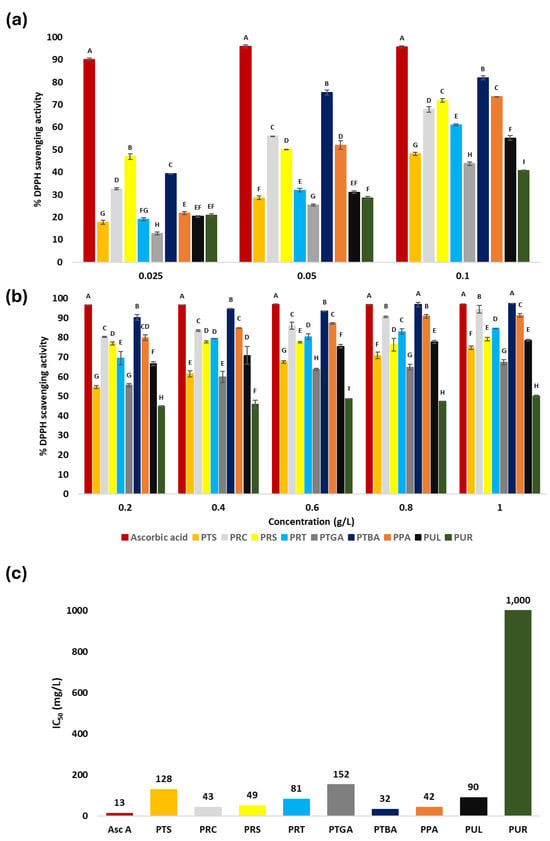
Figure 3.
Antioxidant activity of the extracts: (a) DPPH radical scavenging (%) at low concentrations (0.025, 0.05, 0.1 g/L); (b) DPPH radical scavenging (%) at high concentrations (0.2, 0.4, 0.6, 0.8, 1 g/L); (c) IC50 values of the extracts. Ascorbic acid was used as the reference antioxidant. PTS (sesame seed cake), PRC (R. coriaria seeds), PRS (R. semialata galls), PRT (R. typhina seeds), PTGA (sea buckthorn seed cake), PTBA (sea buckthorn berry cake), PPA (commercial sea buckthorn powder), PUL (U. lactuca), and PUR (U. rigida). The letters (A–I) indicate significant differences in DPPH inhibition between extracts at each tested concentration according to Tukey’s HSD test (p < 0.05). Extracts sharing the same letter are not significantly different.
Finally, PUR showed very weak activity (IC50 = 1000 mg/L), despite being rich in l-Rha (>44%) and sulfates (>14%). Compared to PUL, this limited efficiency suggests that structural features, such as three-dimensional conformation or sulfate group positioning, may hinder hydroxyl-site accessibility to DPPH radicals [81,84,85].
3.5.2. Hydroxyl Radical Scavenging Activity
The hydroxyl radical (OH•) is one of the most reactive and cytotoxic Reactive Oxygen Species (ROS). Due to its high reactivity, it can initiate chain reactions leading to irreversible damage of essential cellular components, including membrane lipids, proteins, and DNA [86]. Its neutralization therefore represents a key strategy to mitigate oxidative stress and prevent associated biological damage.
The evaluation of antioxidant activity against hydroxyl radicals (Figure 4), generated through the Fenton reaction, revealed a ranking distinct from that observed with DPPH. Statistical analysis (Tukey-HSD test, p < 0.05) confirmed the significant differences in OH• scavenging efficiency among the extracts at each tested concentration.
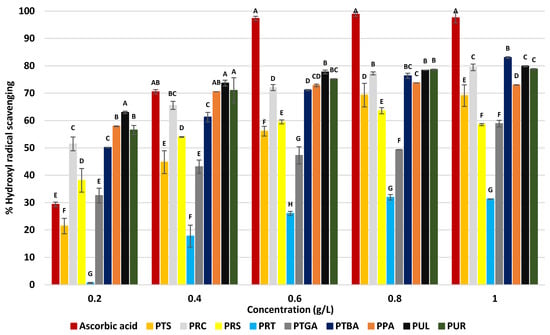
Figure 4.
Hydroxyl radical scavenging activity (%) of the extracts at various concentrations. Ascorbic acid was used as the reference antioxidant. PTS (sesame seed cake), PRC (R. coriaria seeds), PRS (R. semialata galls), PRT (R. typhina seeds), PTGA (sea buckthorn seed cake), PTBA (sea buckthorn berry cake), PPA (commercial sea buckthorn powder), PUL (U. lactuca), and PUR (U. rigida). The letters (A–H) indicate significant differences between treatments at each concentration using the Tukey-HSD test (p < 0.05). Treatments sharing the same letter are not significantly different.
The most effective extracts were those obtained from green seaweed (PUL and PUR) as well as PTBA and PRC, showing inhibition values ranging from 78.8% to 83.0% at 1 g/L. These results are higher than previously reported for PS from Ulva pertusa (30% at 1 g/L [87]), Camellia sinensis (40% at 1 g/L [88]), and Oryza sativa (36.9% at 2 g/L [89]), and were comparable to those of Nardostachys jatamansi (75% at 1 g/L [90]), thereby confirming the antioxidant potential of the studied extracts. At the lowest tested concentration (0.2 g/L), these extracts already displayed higher inhibition (PUL 61.9%, PUR 57.2%, PTBA 50.1%, PRC 51.2%) than ascorbic acid (28.7%), highlighting their selective efficiency against this radical. The observed efficiency relies on two complementary mechanisms: direct scavenging of OH• and chelation of ferrous ions involved in the Fenton reaction. Anionic substituents, particularly sulfate groups and uronic acids, play a central role in enhancing the latter mechanism by binding Fe2+ and thus limiting hydroxyl radical generation [91,92,93]. This phenomenon accounts for the strong activity of Ulva extracts, which are rich in ionizable functional groups. A second group of extracts (PPA, PTGA, PRS, PTS) showed moderate inhibition (58.5–73.0% at 1 g/L). The case of PPA was noteworthy: although among the most active in the DPPH assay, it showed lower efficiency here, suggesting a predominance of electron-transfer mechanisms rather than iron chelation. Similarly, the relatively weak performance of PRS (58.5% at 1 g/L) compared with its DPPH activity may result from molecular conformations limiting the chelating site accessibility. Finally, the least active extract, PRT, reached only 32% inhibition (at 1 g/L), consistent with its composition dominated by neutral sugars and low levels of ionizable groups.
It should be emphasized that the three-dimensional conformation of PS strongly influences their reactivity. Compact or helical organizations can restrict the exposure of functional sites and thereby limit their interaction with OH•, regardless of chemical composition [85]. This structural effect has been demonstrated for several marine PS, where branching degree, sulfation level, and molecular weight are key determinants of antioxidant efficiency [81].
4. Conclusions
In this study, PS extracted from nine biomasses (PUL, PUR, PRC, PRT, PRS, PTBA, PTGA, PPA, PTS) were biochemically and structurally characterized (FTIR, HPAEC-PAD, GC/MS). Extracts from Ulva (PUL, PUR) and R. semialata (PRS) were distinguished by their particularly high l-Rha content, highlighting their potential as sources of this rare sugar. However, the comparative cost analysis showed that high l-Rha content alone is not sufficient for practical valorization. The extraction of Ulva-derived PS currently remains economically unfavorable due to solvent-intensive processing. In contrast, R. semialata exhibited a more advantageous balance between l-Rha yield and cost, making it a more viable candidate for targeted recovery under optimized conditions. In parallel, PTBA, PRC, and PUL demonstrated strong antioxidant activity, sometimes exceeding that of ascorbic acid, suggesting synergistic contributions from various compounds (uronic acids, sulfated groups, phenolics).
This work thus underscores the relevance of combining a multi-resource approach with cross-analytical methods to identify and valorize novel natural matrices. The findings open clear perspectives for the selective recovery of l-Rha through tailored enzymatic processes and physical separation steps, the rational design of bioactive ingredients, and the integrated valorization of these biomasses within a circular bioeconomy framework. Nevertheless, further investigations remain necessary to optimize extraction conditions, particularly by reducing solvent consumption, in order to significantly lower the production cost of l-Rha, elucidate structure–function relationships where needed (e.g., via NMR and SEC-MALS), and validate product performance under realistic application conditions.
Supplementary Materials
The following supporting information can be downloaded at: https://www.mdpi.com/article/10.3390/polysaccharides7010004/s1, Figure S1: HPAEC-PAD chromatograms of PS extracts (a–i). PUR (U. rigida) (a), PUL (U. lactuca) (b), PTBA (sea buckthorn berry cake) (c), PTGA (sea buckthorn seed cake) (d), PPA (commercial sea buckthorn powder) (e), PRC (R. coriaria seeds) (f), PRS (R. semialata galls) (g), PRT (R. typhina seeds) (h), and PTS (sesame seed cake) (i). Figure S2: GC-MS chromatograms of PS extracts (a–i). PUR (U. rigida) (a), PUL (U. lactuca) (b), PTBA (sea buckthorn berry cake) (c), PTGA (sea buckthorn seed cake) (d), PPA (commercial sea buckthorn powder) (e), PRC (R. coriaria seeds) (f), PRS (R. semialata galls) (g), PRT (R. typhina seeds) (h), and PTS (sesame seed cake) (i).
Author Contributions
Conceptualization, G.P. and P.M.; methodology, M.A., C.G., P.D., A.-V.U., L.C. and S.A.; validation, G.P., P.M., S.A., L.C. and J.-Y.B.; formal analysis, M.A., P.M., T.F., C.G., G.C., P.D. and A.-V.U.; investigation, M.A., P.M., T.F., G.C., P.D., A.-V.U. and G.P.; writing—original draft preparation, M.A.; writing—review and editing, G.P., P.M., S.A., L.C. and J.-Y.B.; supervision, G.P. and P.M.; project administration, G.P.; funding acquisition, G.P. and J.-Y.B. All authors have read and agreed to the published version of the manuscript.
Funding
This research was funded by the Agence Nationale de la Recherche (ANR) through the RAh project (ANR-23-CE43-0011) and by the Institut Universitaire de France (IUF, France) (Junior Innovation Chair 2023-28).
Institutional Review Board Statement
Not applicable.
Data Availability Statement
The data presented in this study are available on request from the corresponding author, the data are not publicly available due to privacy or ethical restrictions.
Conflicts of Interest
Authors Laurent Chaisemartin and Jean-Yves Berthon were employed by Greentech. The remaining authors declare that the research was conducted in the absence of any commercial or financial relationships that could be construed as a potential conflict of interest.
Abbreviations
The following abbreviations are used in this manuscript:
| FTIR | Fourier Transform Infrared spectroscopy |
| GC/MS-EI | Gas chromatography coupled with electron impact mass spectrometry |
| HPAEC-PAD | High-performance anion-exchange chromatography coupled with pulsed amperometric detection |
| l-Rha | l-rhamnose |
| PPA | PS extract from commercial sea buckthorn powder |
| PRC | PS extract from R. coriaria seeds |
| PRS | PS extract from R. semialata galls |
| PRT | PS extract from R. typhina seeds |
| PS | Polysaccharides |
| PTBA | PS extract from sea buckthorn berry cake |
| PTGA | PS extract from sea buckthorn seed cake |
| PTS | PS extract from sesame cake |
| PUL | PS extract from U. lactuca |
| PUR | PS extract from U. rigida |
References
- Giraud, M.-F.; Naismith, J.H. The Rhamnose Pathway. Curr. Opin. Struct. Biol. 2000, 10, 687–696. [Google Scholar] [CrossRef]
- Li, S.; Chen, F.; Li, Y.; Wang, L.; Li, H.; Gu, G.; Li, E. Rhamnose-Containing Compounds: Biosynthesis and Applications. Molecules 2022, 27, 5315. [Google Scholar] [CrossRef]
- Jiang, N.; Dillon, F.M.; Silva, A.; Gomez-Cano, L.; Grotewold, E. Rhamnose in Plants—from Biosynthesis to Diverse Functions. Plant Sci. 2021, 302, 110687. [Google Scholar] [CrossRef]
- Li, C.; Tang, T.; Du, Y.; Jiang, L.; Yao, Z.; Ning, L.; Zhu, B. Ulvan and Ulva Oligosaccharides: A Systematic Review of Structure, Preparation, Biological Activities and Applications. Bioresour. Bioprocess. 2023, 10, 66. [Google Scholar] [CrossRef]
- Rocchetta, H.L.; Burrows, L.L.; Pacan, J.C.; Lam, J.S. Three Rhamnosyltransferases Responsible for Assembly of the A-Band D-Rhamnan Polysaccharide in Pseudomonas Aeruginosa: A Fourth Transferase, WbpL, Is Required for the Initiation of Both A-Band and B-Band Lipopolysaccharide Synthesis. Mol. Microbiol. 1998, 28, 1103–1119. [Google Scholar] [CrossRef] [PubMed]
- Balzaretti, S.; Taverniti, V.; Guglielmetti, S.; Fiore, W.; Minuzzo, M.; Ngo, H.N.; Ngere, J.B.; Sadiq, S.; Humphreys, P.N.; Laws, A.P. A Novel Rhamnose-Rich Hetero-Exopolysaccharide Isolated from Lactobacillus paracasei DG Activates THP-1 Human Monocytic Cells. Appl. Environ. Microbiol. 2017, 83, e02702-16. [Google Scholar] [CrossRef] [PubMed]
- Future Market Report. Rhamnose Market Size, Share & Industry Analysis, by Type, Application, End-User Industry, Form, 678 Product Type, and Regional Forecast to 2032. Available online: https://www.futuremarketreport.com/industry-679report/rhamnose-market/ (accessed on 11 September 2025).
- Seedevi, P. Antioxidant and Anticoagulant Activity of Crude Polysaccharide and α-L-Rhamnose from Grateloupia lithophila. Biomass Conv. Bioref. 2024, 14, 15587–15595. [Google Scholar] [CrossRef]
- Vogt, J.A.; Pencharz, P.B.; Wolever, T.M.S. L-Rhamnose Increases Serum Propionate in Humans. Am. J. Clin. Nutr. 2004, 80, 89–94. [Google Scholar] [CrossRef]
- Andrès, E.; Molinari, J.; Péterszegi, G.; Mariko, B.; Ruszova, E.; Velebny, V.; Faury, G.; Robert, L. Pharmacological Properties of Rhamnose-Rich Polysaccharides, Potential Interest in Age-Dependent Alterations of Connectives Tissues. Pathol. Biol. 2006, 54, 420–425. [Google Scholar] [CrossRef] [PubMed]
- Novotná, R.; Škařupová, D.; Hanyk, J.; Ulrichová, J.; Křen, V.; Bojarová, P.; Brodsky, K.; Vostálová, J.; Franková, J. Hesperidin, Hesperetin, Rutinose, and Rhamnose Act as Skin Anti-Aging Agents. Molecules 2023, 28, 1728. [Google Scholar] [CrossRef]
- Pageon, H.; Azouaoui, A.; Zucchi, H.; Ricois, S.; Tran, C.; Asselineau, D. Potentially Beneficial Effects of Rhamnose on Skin Ageing: An in Vitro and in Vivo Study. Int. J. Cosmet. Sci. 2019, 41, 213–220. [Google Scholar] [CrossRef]
- Sheridan, R.T.C.; Hudon, J.; Hank, J.A.; Sondel, P.M.; Kiessling, L.L. Rhamnose Glycoconjugates for the Recruitment of Endogenous Anti-Carbohydrate Antibodies to Tumor Cells. ChemBioChem 2014, 15, 1393–1398. [Google Scholar] [CrossRef]
- Hossain, M.K.; Vartak, A.; Karmakar, P.; Sucheck, S.J.; Wall, K.A. Augmenting Vaccine Immunogenicity through the Use of Natural Human Anti-Rhamnose Antibodies. ACS Chem. Biol. 2018, 13, 2130–2142. [Google Scholar] [CrossRef]
- Merck Life Science. L-Rhamnose Monohydrate, ≥99% (Product Number: R3875). Sigma-Aldrich Product Page. Available online: https://www.sigmaaldrich.com/TN/en/product/sigma/r3875 (accessed on 11 September 2025).
- El Ashry, E.S.H.; Rashed, N.; Ibrahim, E.S.I. Challenges in the Stereocontrolled Syntheses of β-Rhamnosides. Tetrahedron 2008, 64, 10631–10648. [Google Scholar] [CrossRef]
- Zorbach, W.; Tio, C. Notes- A New Synthesis of D-Rhamnose (6-Deoxy-D-Mannose). J. Org. Chem. 1961, 26, 3543–3545. [Google Scholar] [CrossRef]
- ExplorEnz: The Enzyme Database. EC 1.1.1.133—dTDP-4-dehydrorhamnose Reductase. Available online: https://www.enzyme-database.org/query.php?ec=1.1.1.133 (accessed on 28 October 2025).
- ExPASy ENZYME Database. EC 2.4.1.236—Flavanone 7-O-glucoside 2″-O-β-L-rhamnosyltransferase. Available online: https://enzyme.expasy.org/EC/2.4.1.236 (accessed on 28 October 2025).
- Lu, L.; Liu, Q.; Jin, L.; Yin, Z.; Xu, L.; Xiao, M. Enzymatic Synthesis of Rhamnose Containing Chemicals by Reverse Hydrolysis. PLoS ONE 2015, 10, e0140531. [Google Scholar] [CrossRef]
- Fávero Massocato, T.; Robles-Carnero, V.; Rodrigues Moreira, B.; Castro-Varela, P.; Bonomi-Barufi, J.; Abdala-Díaz, R.; Rubi Rörig, L.; López Figueroa, F.D. Characterization and Biological Activities of the Ulvan Polysaccharide-Rich Fraction Obtained from Ulva rigida and Ulva pseudorotundata and Their Potential for Pharmaceutical Application. Mar. Biotechnol. 2024, 26, 324–337. [Google Scholar] [CrossRef] [PubMed]
- Li, Q.; Dou, Z.; Duan, Q.; Chen, C.; Liu, R.; Jiang, Y.; Yang, B.; Fu, X. A Comparison Study on Structure-Function Relationship of Polysaccharides Obtained from Sea Buckthorn Berries Using Different Methods: Antioxidant and Bile Acid-Binding Capacity. Food Sci. Hum. Wellness 2024, 13, 494–505. [Google Scholar] [CrossRef]
- Li, Y.-R.; Xu, S.; Zhang, R.-Y.; Yang, M.-X.; Liu, H.-M.; Wang, X.-D. Structural Characterization of Polysaccharides in Waste Liquor Produced by Wet Decortication of Sesame Seeds. Front. Nutr. 2022, 9, 940442. [Google Scholar] [CrossRef] [PubMed]
- Hu, J.; Gao, J.; Zhao, Z.; Yang, X. Response Surface Optimization of Polysaccharide Extraction from Galla Chinensis and Determination of Its Antioxidant Activity in Vitro. Food Sci. Technol. 2020, 41, 188–194. [Google Scholar] [CrossRef]
- Dubois, M.; Gilles, K.; Hamilton, J.K.; Rebers, P.A.; Smith, F. A Colorimetric Method for the Determination of Sugars. Nature 1951, 168, 167. [Google Scholar] [CrossRef]
- Monsigny, M.; Petit, C.; Roche, A.-C. Colorimetric Determination of Neutral Sugars by a Resorcinol Sulfuric Acid Micromethod. Anal. Biochem. 1988, 175, 525–530. [Google Scholar] [CrossRef]
- Blumenkrantz, N.; Asboe-Hansen, G. New Method for Quantitative Determination of Uronic Acids. Anal. Biochem. 1973, 54, 484–489. [Google Scholar] [CrossRef] [PubMed]
- Montreuil, J.; Spik, G.; Chosson, A.; Segard, E.; Scheppler, N. Methods of Study of the Structure of Glycoproteins. J. Pharm. Belg. 1963, 18, 529–546. [Google Scholar]
- Dodgson, K.S.; Price, R.G. A Note on the Determination of the Ester Sulphate Content of Sulphated Polysaccharides. Biochem. J. 1962, 84, 106–110. [Google Scholar] [CrossRef] [PubMed]
- Bradford, M.M. A Rapid and Sensitive Method for the Quantitation of Microgram Quantities of Protein Utilizing the Principle of Protein-Dye Binding. Anal. Biochem. 1976, 72, 248–254. [Google Scholar] [CrossRef]
- Singleton, V. Analysis of Total Phenols and Other Oxidation Substrates and Antioxidants by Means of Folin-Ciocalteu Reagent. Methods Enzymol. 1999, 299, 152–178. [Google Scholar]
- Pierre, G.; Zhao, J.-M.; Orvain, F.; Dupuy, C.; Klein, G.L.; Graber, M.; Maugard, T. Seasonal Dynamics of Extracellular Polymeric Substances (EPS) in Surface Sediments of a Diatom-Dominated Intertidal Mudflat (Marennes–Oléron, France). J. Sea Res. 2014, 92, 26–35. [Google Scholar] [CrossRef]
- Pierre, G.; Graber, M.; Rafiliposon, B.A.; Dupuy, C.; Orvain, F.; De Crignis, M.; Maugard, T. Biochemical Composition and Changes of Extracellular Polysaccharides (ECPS) Produced during Microphytobenthic Biofilm Development (Marennes-Oléron, France). Microb. Ecol. 2012, 63, 157–169. [Google Scholar] [CrossRef] [PubMed]
- Delattre, C.; Pierre, G.; Gardarin, C.; Traikia, M.; Elboutachfaiti, R.; Isogai, A.; Michaud, P. Antioxidant Activities of a Polyglucuronic Acid Sodium Salt Obtained from TEMPO-Mediated Oxidation of Xanthan. Carbohydr. Polym. 2015, 116, 34–41. [Google Scholar] [CrossRef]
- Kaminskytė, G.; Jagelavičiūtė, J.; Bašinskienė, L.; Syrpas, M.; Čižeikienė, D. Effect of Modification Methods on Composition and Technological Properties of Sea Buckthorn (Hippophae rhamnoides L.) Pomace. Appl. Sci. 2025, 15, 8722. [Google Scholar] [CrossRef]
- Hilz, H.; Bakx, E.J.; Schols, H.A.; Voragen, A.G.j. Cell Wall Polysaccharides in Black Currants and Bilberries—Characterisation in Berries, Juice, and Press Cake. Carbohydr. Polym. 2005, 59, 219–226. [Google Scholar] [CrossRef]
- He, H.; Crabbe, M.J.C.; Ren, Z. Genome-Wide Identification and Characterization of the Chemosensory Relative Protein Genes in Rhus Gall Aphid Schlechtendalia Chinensis. BMC Genom. 2023, 24, 222. [Google Scholar] [CrossRef] [PubMed]
- Costa, C.; Alves, A.; Pinto, P.R.; Sousa, R.A.; Borges Da Silva, E.A.; Reis, R.L.; Rodrigues, A.E. Characterization of Ulvan Extracts to Assess the Effect of Different Steps in the Extraction Procedure. Carbohydr. Polym. 2012, 88, 537–546. [Google Scholar] [CrossRef]
- Yaich, H.; Garna, H.; Besbes, S.; Paquot, M.; Blecker, C.; Attia, H. Effect of Extraction Conditions on the Yield and Purity of Ulvan Extracted from Ulva lactuca. Food Hydrocoll. 2013, 31, 375–382. [Google Scholar] [CrossRef]
- Yue, F.; Zhang, J.; Xu, J.; Niu, T.; Lü, X.; Liu, M. Effects of Monosaccharide Composition on Quantitative Analysis of Total Sugar Content by Phenol-Sulfuric Acid Method. Front. Nutr. 2022, 9, 963318. [Google Scholar] [CrossRef]
- Guidara, M.; Yaich, H.; Amor, I.B.; Fakhfakh, J.; Gargouri, J.; Lassoued, S.; Blecker, C.; Richel, A.; Attia, H.; Garna, H. Effect of Extraction Procedures on the Chemical Structure, Antitumor and Anticoagulant Properties of Ulvan from Ulva lactuca of Tunisia Coast. Carbohydr. Polym. 2021, 253, 117283. [Google Scholar] [CrossRef]
- Barakat, K.M.; Ismail, M.M.; Abou El Hassayeb, H.E.; El Sersy, N.A.; Elshobary, M.E. Chemical Characterization and Biological Activities of Ulvan Extracted from Ulva fasciata (Chlorophyta). Rend. Fis. Acc. Lincei 2022, 33, 829–841. [Google Scholar] [CrossRef]
- Shi, S.; Wu, R.; Han, Z.; Sun, Y.; Li, P.; Ren, F.; Shang, N. Prospects of Sea Buckthorn (Hippophae rhamnoides L.) Polysaccharides: Preparation, Structural Characterization, and Bioactivities Diversity. Food Sci. Hum. Wellness 2025, 14, 9250001. [Google Scholar] [CrossRef]
- Liu, H.; Zhang, W.; Dong, S.; Song, L.; Zhao, S.; Wu, C.; Wang, X.; Liu, F.; Xie, J.; Wang, J.; et al. Protective Effects of Sea Buckthorn Polysaccharide Extracts against LPS/d-GalN-Induced Acute Liver Failure in Mice via Suppressing TLR4-NF-κB Signaling. J. Ethnopharmacol. 2015, 176, 69–78. [Google Scholar] [CrossRef]
- Sakhr, K.; Khatib, S.E. Physiochemical Properties and Medicinal, Nutritional and Industrial Applications of Lebanese Sumac (Syrian Sumac—Rhus Coriaria): A Review. Heliyon 2020, 6, e03207. [Google Scholar] [CrossRef] [PubMed]
- Wei, P.; Zhao, F.; Wang, Z.; Wang, Q.; Chai, X.; Hou, G.; Meng, Q. Sesame (Sesamum indicum L.): A Comprehensive Review of Nutritional Value, Phytochemical Composition, Health Benefits, Development of Food, and Industrial Applications. Nutrients 2022, 14, 4079. [Google Scholar] [CrossRef] [PubMed]
- Xu, R.-B.; Yang, X.; Wang, J.; Zhao, H.-T.; Lu, W.-H.; Cui, J.; Cheng, C.-L.; Zou, P.; Huang, W.-W.; Wang, P.; et al. Chemical Composition and Antioxidant Activities of Three Polysaccharide Fractions from Pine Cones. Int. J. Mol. Sci. 2012, 13, 14262–14277. [Google Scholar] [CrossRef] [PubMed]
- Zhu, Z.; Chen, J.; Chen, Y.; Ma, Y.; Yang, Q.; Fan, Y.; Fu, C.; Limsila, B.; Li, R.; Liao, W. Extraction, Structural Characterization and Antioxidant Activity of Turmeric Polysaccharides. LWT 2022, 154, 112805. [Google Scholar] [CrossRef]
- Wang, S.; Li, G.; Zhang, X.; Wang, Y.; Qiang, Y.; Wang, B.; Zou, J.; Niu, J.; Wang, Z. Structural Characterization and Antioxidant Activity of Polygonatum sibiricum Polysaccharides. Carbohydr. Polym. 2022, 291, 119524. [Google Scholar] [CrossRef]
- Figueira, T.A.; Silva, A.J.; Enrich-Prast, A.; Yoneshigue-Valentin, Y.; Oliveira, V.P. Structural Characterization of Ulvan Polysaccharide from Cultivated and Collected Ulva fasciata (Chlorophyta). Adv. Biosci. Biotechnol. 2020, 11, 206–216. [Google Scholar] [CrossRef]
- Ibrahim, M.I.A.; Amer, M.S.; Ibrahim, H.A.H.; Zaghloul, E.H. Considerable Production of Ulvan from Ulva lactuca with Special Emphasis on Its Antimicrobial and Anti-Fouling Properties. Appl. Biochem. Biotechnol. 2022, 194, 3097–3118. [Google Scholar] [CrossRef]
- Robic, A.; Bertrand, D.; Sassi, J.-F.; Lerat, Y.; Lahaye, M. Determination of the Chemical Composition of Ulvan, a Cell Wall Polysaccharide from Ulva spp. (Ulvales, Chlorophyta) by FT-IR and Chemometrics. J. Appl. Phycol. 2009, 21, 451–456. [Google Scholar] [CrossRef]
- Castro, R.; Piazzon, M.C.; Zarra, I.; Leiro, J.; Noya, M.; Lamas, J. Stimulation of Turbot Phagocytes by Ulva rigida C. Agardh Polysaccharides. Aquaculture 2006, 254, 9–20. [Google Scholar] [CrossRef]
- Xie, X.; Song, Y.; Bi, X.; Liu, X.; Xing, Y.; Che, Z. Characterization of Sea Buckthorn Polysaccharides and the Analysis of Its Regulatory Effect on the Gut Microbiota Imbalance Induced by Cefixime in Mice. J. Funct. Foods 2023, 104, 105511. [Google Scholar] [CrossRef]
- Wen, J.; Huang, R.; Li, S.; Jiang, L.; Shao, L.; Zhang, Q.; Shan, C. Polysaccharides from Sea Buckthorn—Ultrasound-Assisted Enzymatic Extraction, Purification, Structural Characterization, and Antioxidant Activity Analysis. Food Chem. X 2025, 26, 102265. [Google Scholar] [CrossRef]
- Yang, J.; Du, Y.; Wen, Y.; Li, T.; Hu, L. Sulfation of Chinese Lacquer Polysaccharides in Different Solvents. Carbohydr. Polym. 2003, 52, 397–403. [Google Scholar] [CrossRef]
- Karim, M.M.; Karim, S.F.E.; Rana, A.A.; Masum, S.M.; Mondol, A.; Israt, S.S. ATR-FTIR Spectroscopy and Chemometric Techniques for the Identification of Edible Vegetable Oils. Bangladesh J. Sci. Ind. Res. 2015, 50, 233–240. [Google Scholar] [CrossRef]
- Willför, S.; Pranovich, A.; Tamminen, T.; Puls, J.; Laine, C.; Suurnäkki, A.; Saake, B.; Uotila, K.; Simolin, H.; Hemming, J.; et al. Carbohydrate Analysis of Plant Materials with Uronic Acid-Containing Polysaccharides-A Comparison between Different Hydrolysis and Subsequent Chromatographic Analytical Techniques. Ind. Crops Prod. 2009, 29, 571–580. [Google Scholar] [CrossRef]
- Xia, Y.-G.; Sun, H.-M.; Wang, T.-L.; Liang, J.; Yang, B.-Y.; Kuang, H.-X. A Modified GC-MS Analytical Procedure for Separation and Detection of Multiple Classes of Carbohydrates. Molecules 2018, 23, 1284. [Google Scholar] [CrossRef]
- Quintero, E.; Ishida, K.; Gordon, G.; Geesey, G. Comparison of Reduction Methods for Gas Chromatographic—Mass Spectrometric Identification and Quantitation of Uronic Acids in Acidic Polysaccharides. J. Microbiol. Methods 1989, 9, 309–322. [Google Scholar] [CrossRef]
- Gaignard, C.; Laroche, C.; Pierre, G.; Dubessay, P.; Delattre, C.; Gardarin, C.; Gourvil, P.; Probert, I.; Dubuffet, A.; Michaud, P. Screening of Marine Microalgae: Investigation of New Exopolysaccharide Producers. Algal Res. 2019, 44, 101711. [Google Scholar] [CrossRef]
- Jiao, G.; Yu, G.; Zhang, J.; Ewart, H.S. Chemical Structures and Bioactivities of Sulfated Polysaccharides from Marine Algae. Mar. Drugs 2011, 9, 196–223. [Google Scholar] [CrossRef] [PubMed]
- Quemener, B.; Lahaye, M.; Bobin-Dubigeon, C. Sugar Determination in Ulvans by a Chemical-Enzymatic Method Coupled to High Performance Anion Exchange Chromatography. J. Appl. Phycol. 1997, 9, 179–188. [Google Scholar] [CrossRef]
- Oshima, R.; Kumanotani, J. Structural Studies of Plant Gum from Sap of the Lac Tree, Rhus vernicifera. Carbohydr. Res. 1984, 127, 43–57. [Google Scholar] [CrossRef]
- Lu, R.; Hattori, K.; Xia, Z.; Yoshida, T.; Yang, J.; Zhang, L.; Du, Y.; Miyakoshi, T.; Uryu, T. Structural Analysis of Polysaccharides in Chinese Lacquer by NMR Spectroscopy. Sen’i gakkaishi 1999, 55, 47–56. [Google Scholar] [CrossRef]
- Sissi, H.E.; Ishak, M.S.; Wahid, M.S.A.E.; Ansari, M.A.E. The gallotannins of Rhus coriaria and Mangifera indica. Planta Med. 2009, 19, 342–351. [Google Scholar] [CrossRef]
- Ray, S.; Paynel, F.; Morvan, C.; Lerouge, P.; Driouich, A.; Ray, B. Characterization of Mucilage Polysaccharides, Arabinogalactanproteins and Cell-Wall Hemicellulosic Polysaccharides Isolated from Flax Seed Meal: A Wealth of Structural Moieties. Carbohydr. Polym. 2013, 93, 651–660. [Google Scholar] [CrossRef]
- Holloway, W.D.; Tasman-Jones, C.; Bell, E. The Hemicellulose Component of Dietary Fiber. Am. J. Clin. Nutr. 1980, 33, 260–263. [Google Scholar] [CrossRef] [PubMed]
- Liu, H.-M.; He, M.-K.; Yao, Y.-G.; Qin, Z.; Cai, X.-S.; Wang, X.-D. Pectic Polysaccharides Extracted from Sesame Seed Hull: Physicochemical and Functional Properties. Int. J. Biol. Macromol. 2021, 192, 1075–1083. [Google Scholar] [CrossRef]
- Li, K.-Y.; Ye, J.-T.; Yang, J.; Shao, J.-Q.; Jin, W.-P.; Zheng, C.; Wan, C.-Y.; Peng, D.-F.; Deng, Q.-C. Co-Extraction of Flaxseed Protein and Polysaccharide with a High Emulsifying and Foaming Property: Enrichment through the Sequence Extraction Approach. Foods 2023, 12, 1256. [Google Scholar] [CrossRef] [PubMed]
- Muthusamy, S.; Udayakumar, G.P.; Narala, V.R. Recent Advances in the Extraction and Characterization of Seed Polysaccharides, and Their Bioactivities: A Review. Bioact. Carbohydr. Diet. Fibre 2021, 26, 100276. [Google Scholar] [CrossRef]
- Yapo, B.M. Pectic Substances: From Simple Pectic Polysaccharides to Complex Pectins—A New Hypothetical Model. Carbohydr. Polym. 2011, 86, 373–385. [Google Scholar] [CrossRef]
- Zhao, M.; Kuang, F.; Zhang, Y.; Lv, G. Effects of Hydrolysis Condition and Detection Method on the Monosaccharide Composition Analysis of Polysaccharides from Natural Sources. Separations 2024, 11, 2. [Google Scholar] [CrossRef]
- Pico, J.; Vidal, N.P.; Widjaja, L.; Falardeau, L.; Albino, L.; Martinez, M.M. Development and Assessment of GC/MS and HPAEC/PAD Methodologies for the Quantification of α-Galacto-Oligosaccharides (GOS) in Dry Beans (Phaseolus vulgaris). Food Chem. 2021, 349, 129151. [Google Scholar] [CrossRef]
- Merck Life Science. Sigma-Aldrich Sigma-Aldrich—Official Website. Available online: https://www.sigmaaldrich.com/FR/fr (accessed on 28 October 2025).
- Zhang, Z.; Jin, J.; Shi, L. Antioxidant Activity of the Derivatives of Polysaccharide Extracted from a Chinese Medical Herb (Ramulus mori). Food Sci. Technol. Res. 2008, 14, 160–168. [Google Scholar] [CrossRef]
- Lu, Y.; Su, Z.; Bi, Y. Antioxidant Activities of Polysaccharides from Citrus Peel. In Frontier Computing; Hung, J.C., Yen, N.Y., Hui, L., Eds.; Lecture Notes in Electrical Engineering; Springer: Singapore, 2019; Volume 542, pp. 1801–1807. ISBN 978-981-13-3647-8. [Google Scholar]
- Hu, S.; Yin, J.; Nie, S.; Wang, J.; Phillips, G.O.; Xie, M.; Cui, S.W. In Vitro Evaluation of the Antioxidant Activities of Carbohydrates. Bioact. Carbohydr. Diet. Fibre 2016, 7, 19–27. [Google Scholar] [CrossRef]
- Fernandes, P.A.R.; Coimbra, M.A. The Antioxidant Activity of Polysaccharides: A Structure-Function Relationship Overview. Carbohydr. Polym. 2023, 314, 120965. [Google Scholar] [CrossRef]
- Bai, L.; Xu, D.; Zhou, Y.-M.; Zhang, Y.-B.; Zhang, H.; Chen, Y.-B.; Cui, Y.-L. Antioxidant Activities of Natural Polysaccharides and Their Derivatives for Biomedical and Medicinal Applications. Antioxidants 2022, 11, 2491. [Google Scholar] [CrossRef]
- Zhong, Q.; Wei, B.; Wang, S.; Ke, S.; Chen, J.; Zhang, H.; Wang, H. The Antioxidant Activity of Polysaccharides Derived from Marine Organisms: An Overview. Mar. Drugs 2019, 17, 674. [Google Scholar] [CrossRef]
- Yaich, H.; Amira, A.B.; Abbes, F.; Bouaziz, M.; Besbes, S.; Richel, A.; Blecker, C.; Attia, H.; Garna, H. Effect of Extraction Procedures on Structural, Thermal and Antioxidant Properties of Ulvan from Ulva lactuca Collected in Monastir Coast. Int. J. Biol. Macromol. 2017, 105, 1430–1439. [Google Scholar] [CrossRef] [PubMed]
- Liu, X.; Tian, J.; Zhou, Z.; Pan, Y.; Li, Z. Antioxidant Activity and Interactions between Whey Protein and Polysaccharides from Different Parts of Houttuynia cordata. Front. Nutr. 2023, 10, 1020328. [Google Scholar] [CrossRef]
- Qi, H.; Zhang, Q.; Zhao, T.; Chen, R.; Zhang, H.; Niu, X.; Li, Z. Antioxidant Activity of Different Sulfate Content Derivatives of Polysaccharide Extracted from Ulva pertusa (Chlorophyta) in Vitro. Int. J. Biol. Macromol. 2005, 37, 195–199. [Google Scholar] [CrossRef]
- Bu, Y.; Yin, B.; Qiu, Z.; Li, L.; Zhang, B.; Zheng, Z.; Li, M. Structural Characterization and Antioxidant Activities of Polysaccharides Extracted from Polygonati rhizoma Pomace. Food Chem. X 2024, 23, 101778. [Google Scholar] [CrossRef]
- Zhao, L.; Wang, Z.; Li, Y.; Wang, S.; Wang, L.; Qi, Z.; Ge, Q.; Liu, X.; Zhang, J.Z. Designed Synthesis of Chlorine and Nitrogen Co-Doped Ti3C2 MXene Quantum Dots and Their Outstanding Hydroxyl Radical Scavenging Properties. J. Mater. Sci. Technol. 2021, 78, 30–37. [Google Scholar] [CrossRef]
- Zhang, Z.; Wang, F.; Wang, X.; Liu, X.; Hou, Y.; Zhang, Q. Extraction of the Polysaccharides from Five Algae and Their Potential Antioxidant Activity in Vitro. Carbohydr. Polym. 2010, 82, 118–121. [Google Scholar] [CrossRef]
- Zhang, Z.; Wang, X.; Li, J.; Wang, G.; Mao, G. Extraction and Free Radical Scavenging Activity of Polysaccharide from ‘Anji Baicha’ (Camellia sinensis (L.) O. Kuntze). Int. J. Biol. Macromol. 2016, 84, 161–165. [Google Scholar] [CrossRef]
- Surin, S.; You, S.; Seesuriyachan, P.; Muangrat, R.; Wangtueai, S.; Jambrak, A.R.; Phongthai, S.; Jantanasakulwong, K.; Chaiyaso, T.; Phimolsiripol, Y. Optimization of Ultrasonic-Assisted Extraction of Polysaccharides from Purple Glutinous Rice Bran (Oryza sativa L.) and Their Antioxidant Activities. Sci. Rep. 2020, 10, 10410. [Google Scholar] [CrossRef] [PubMed]
- Yang, X.; Liang, Y.; Liu, P.; Song, L.; Gao, J. Extraction, Structural Characteristics, and Antioxidant Activity of a Glucose-Dominated Polysaccharide, NJPW, Purified from Nardostachys jatamansi (D.Don) DC. ACS Omega 2025, 10, 30100–30115. [Google Scholar] [CrossRef] [PubMed]
- Costa, L.S.; Fidelis, G.P.; Telles, C.B.S.; Dantas-Santos, N.; Camara, R.B.G.; Cordeiro, S.L.; Costa, M.S.S.P.; Almeida-Lima, J.; Melo-Silveira, R.F.; Oliveira, R.M.; et al. Antioxidant and Antiproliferative Activities of Heterofucans from the Seaweed Sargassum filipendula. Mar. Drugs 2011, 9, 952–966. [Google Scholar] [CrossRef]
- Ramu Ganesan, A.; Shanmugam, M.; Bhat, R. Producing Novel Edible Films from Semi Refined Carrageenan (SRC) and Ulvan Polysaccharides for Potential Food Applications. Int. J. Biol. Macromol. 2018, 112, 1164–1170. [Google Scholar] [CrossRef]
- Rocha de Souza, M.C.; Marques, C.T.; Guerra Dore, C.M.; Ferreira da Silva, F.R.; Oliveira Rocha, H.A.; Leite, E.L. Antioxidant Activities of Sulfated Polysaccharides from Brown and Red Seaweeds. J. Appl. Phycol. 2007, 19, 153–160. [Google Scholar] [CrossRef]
Disclaimer/Publisher’s Note: The statements, opinions and data contained in all publications are solely those of the individual author(s) and contributor(s) and not of MDPI and/or the editor(s). MDPI and/or the editor(s) disclaim responsibility for any injury to people or property resulting from any ideas, methods, instructions or products referred to in the content. |
© 2026 by the authors. Licensee MDPI, Basel, Switzerland. This article is an open access article distributed under the terms and conditions of the Creative Commons Attribution (CC BY) license.