Author Contributions
Conceptualization, J.B.J., M.I. and M.N.; methodology, J.B.J.; software, J.B.J.; validation, J.B.J.; formal analysis, J.B.J.; investigation, J.B.J.; resources, J.B.J., M.N. and H.F.; data curation, J.B.J.; writing—original draft preparation, J.B.J.; writing—review and editing, J.B.J., H.F., M.I. and M.N.; visualization, J.B.J.; supervision, M.N.; project administration, J.B.J.; funding acquisition, M.N. All authors have read and agreed to the published version of the manuscript.
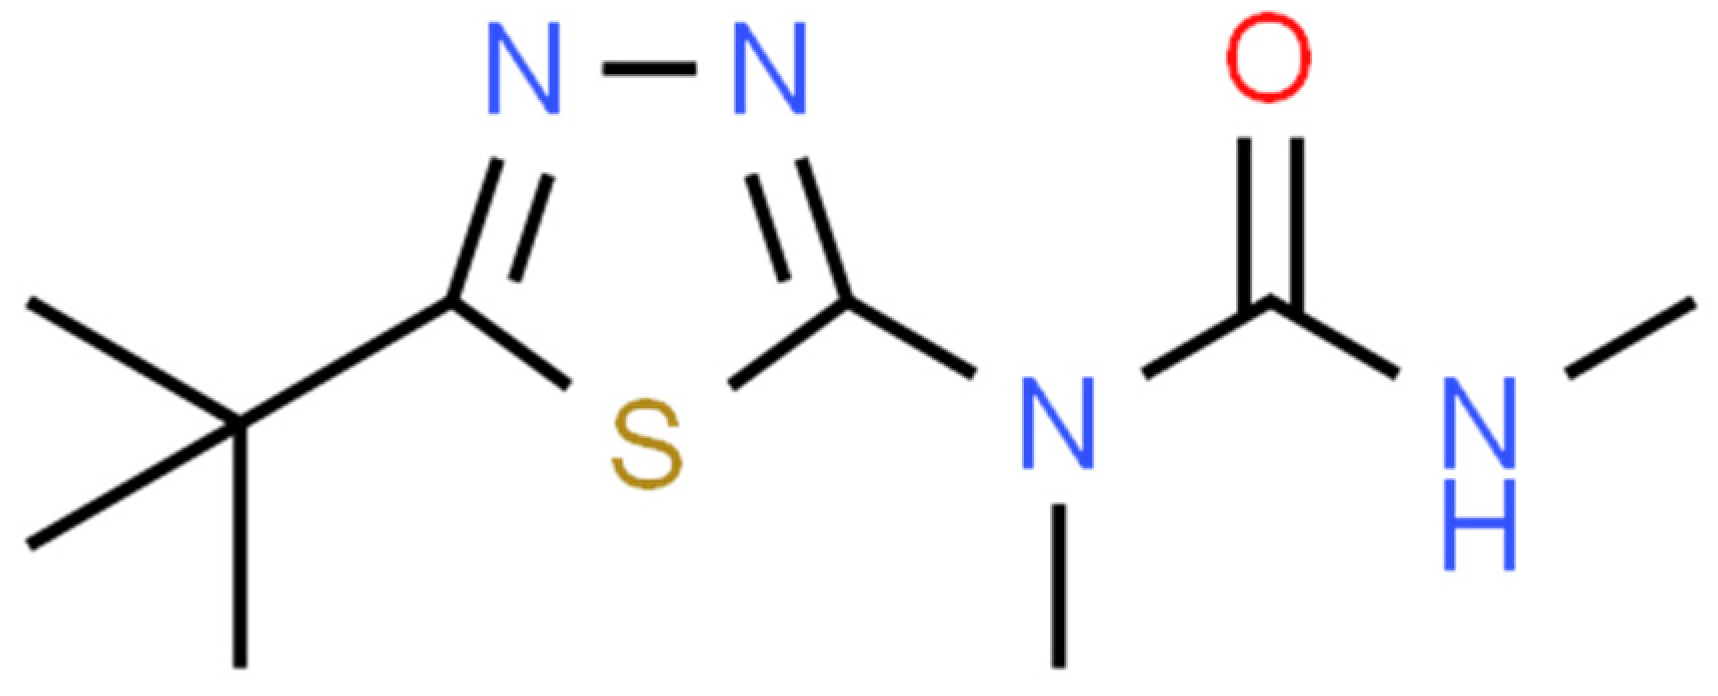
Figure 1.
The chemical structure of tebuthuiron. Retrieved from
http://www.chemspider.com/ (accessed on 28 September 2022) under Creative Commons 4.0 license.
Figure 1.
The chemical structure of tebuthuiron. Retrieved from
http://www.chemspider.com/ (accessed on 28 September 2022) under Creative Commons 4.0 license.
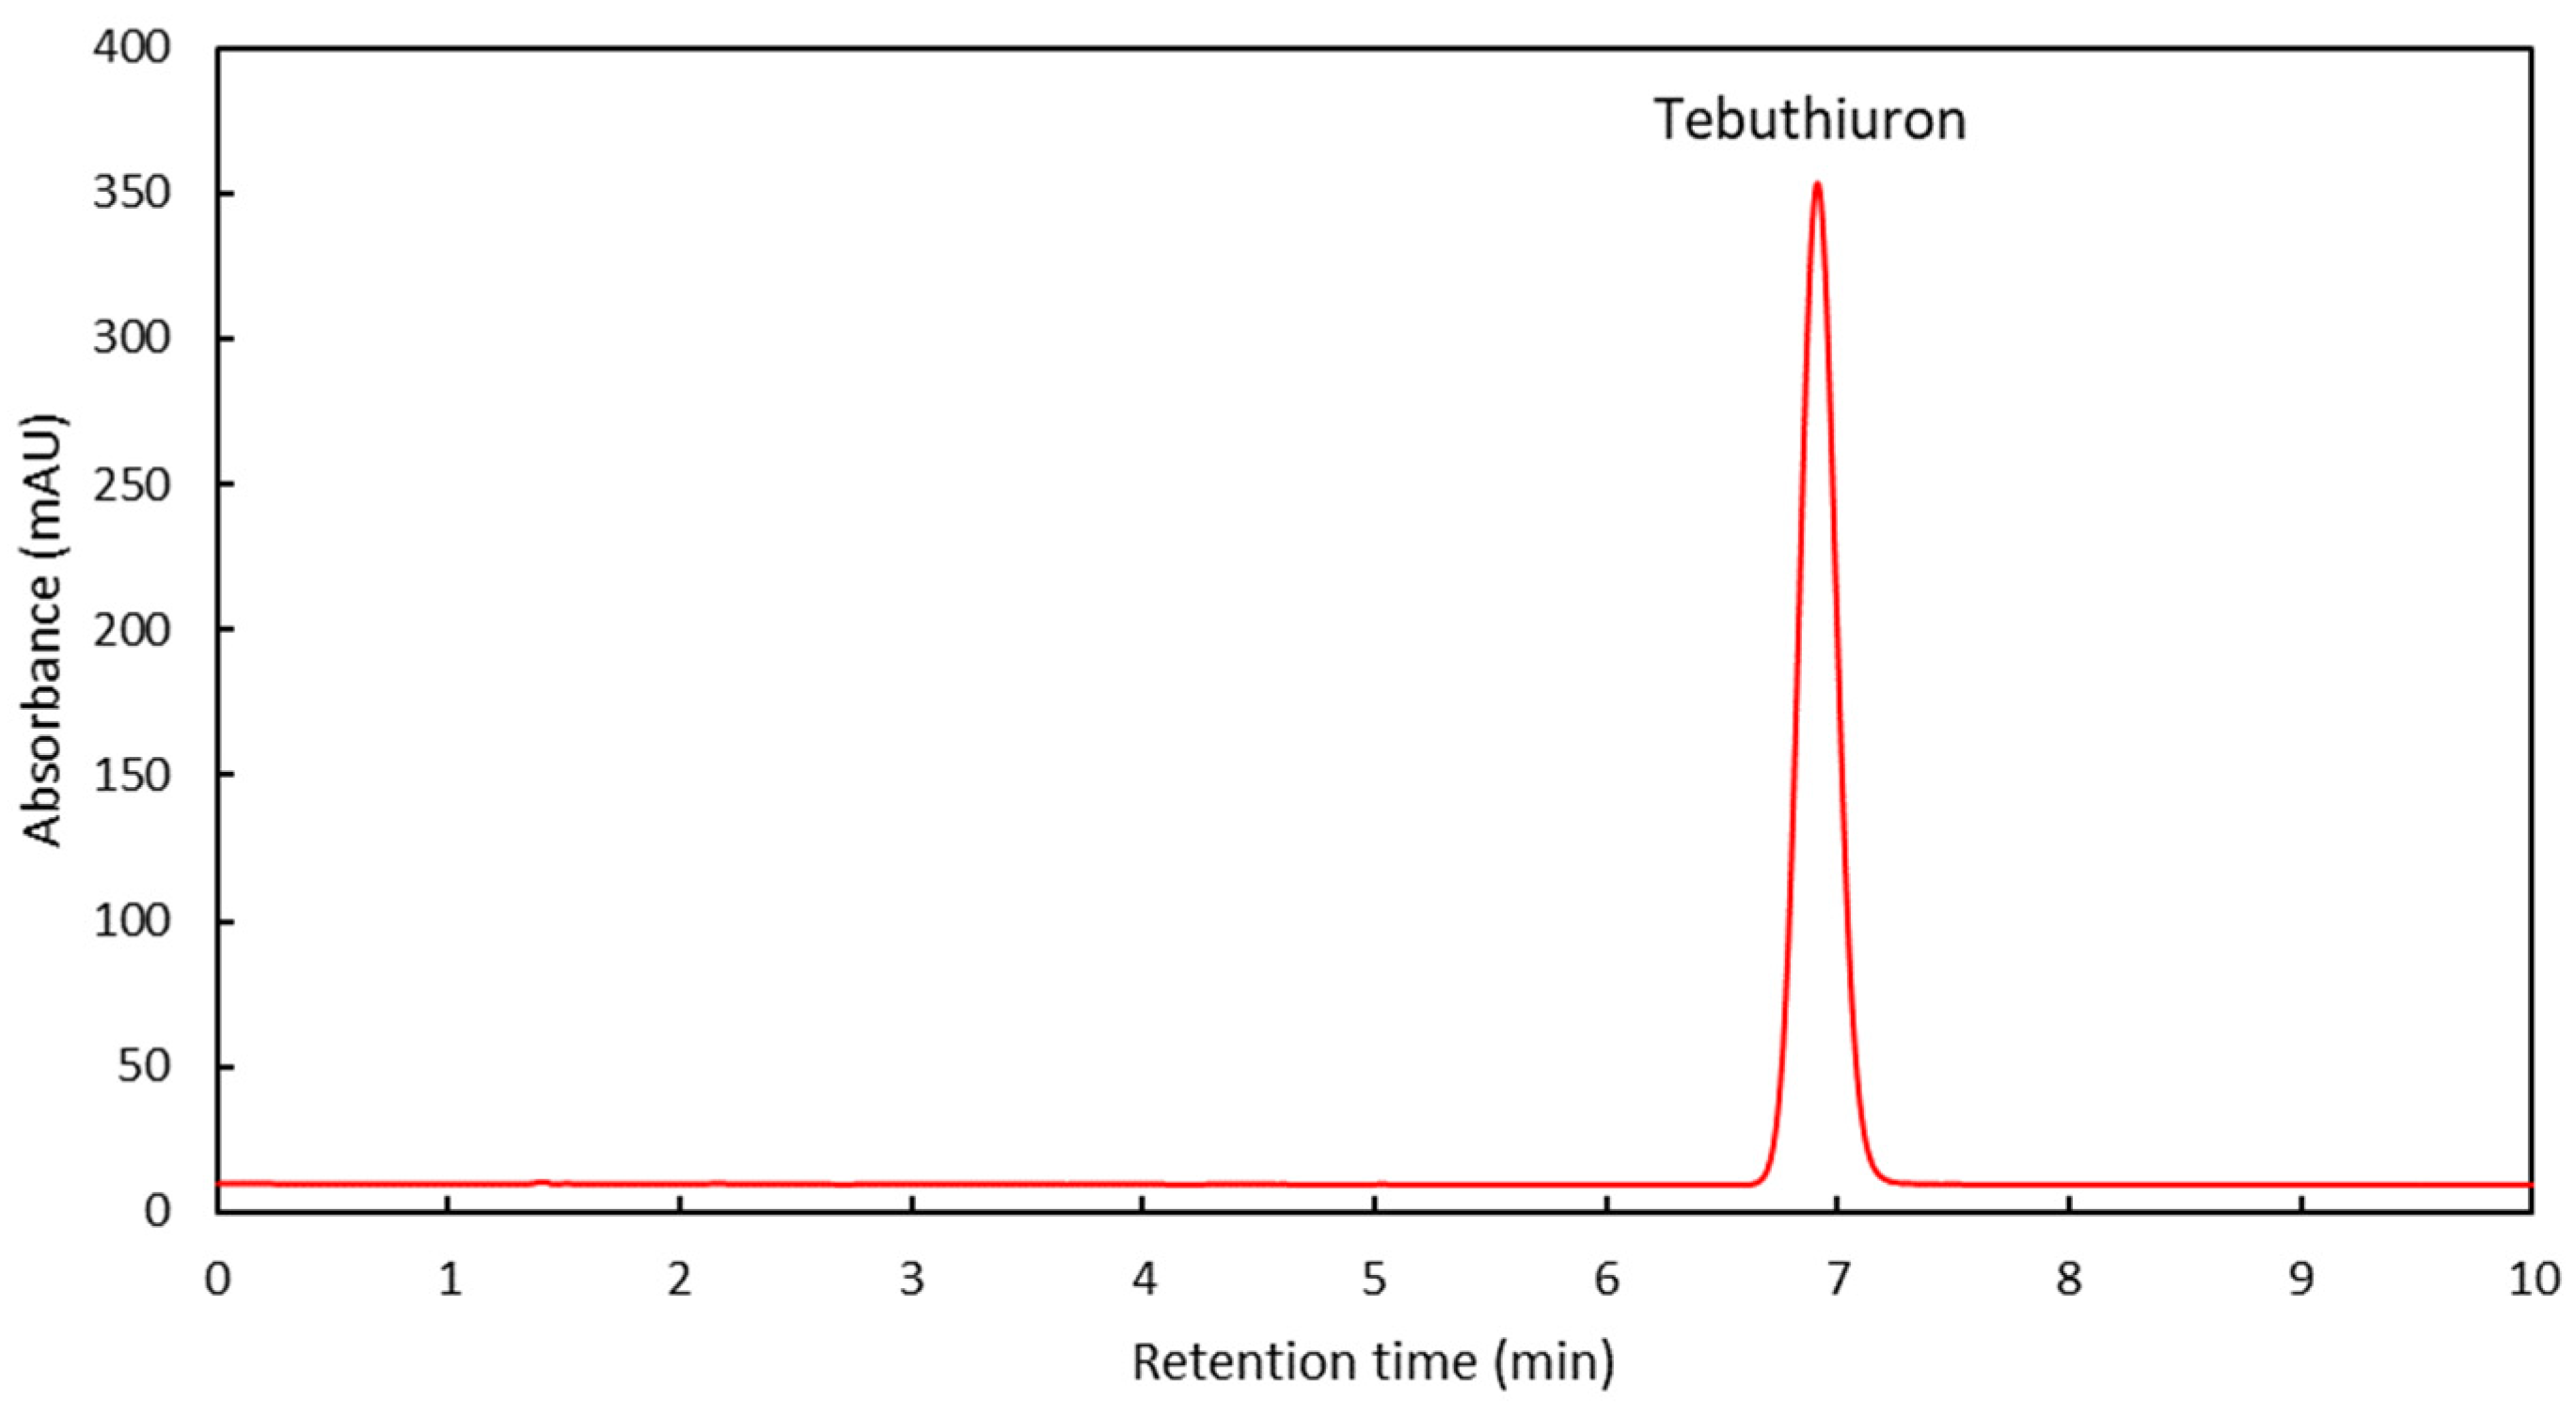
Figure 2.
A typical HPLC chromatogram of a Regain extract, with the location of the tebuthiuron peak indicated.
Figure 2.
A typical HPLC chromatogram of a Regain extract, with the location of the tebuthiuron peak indicated.
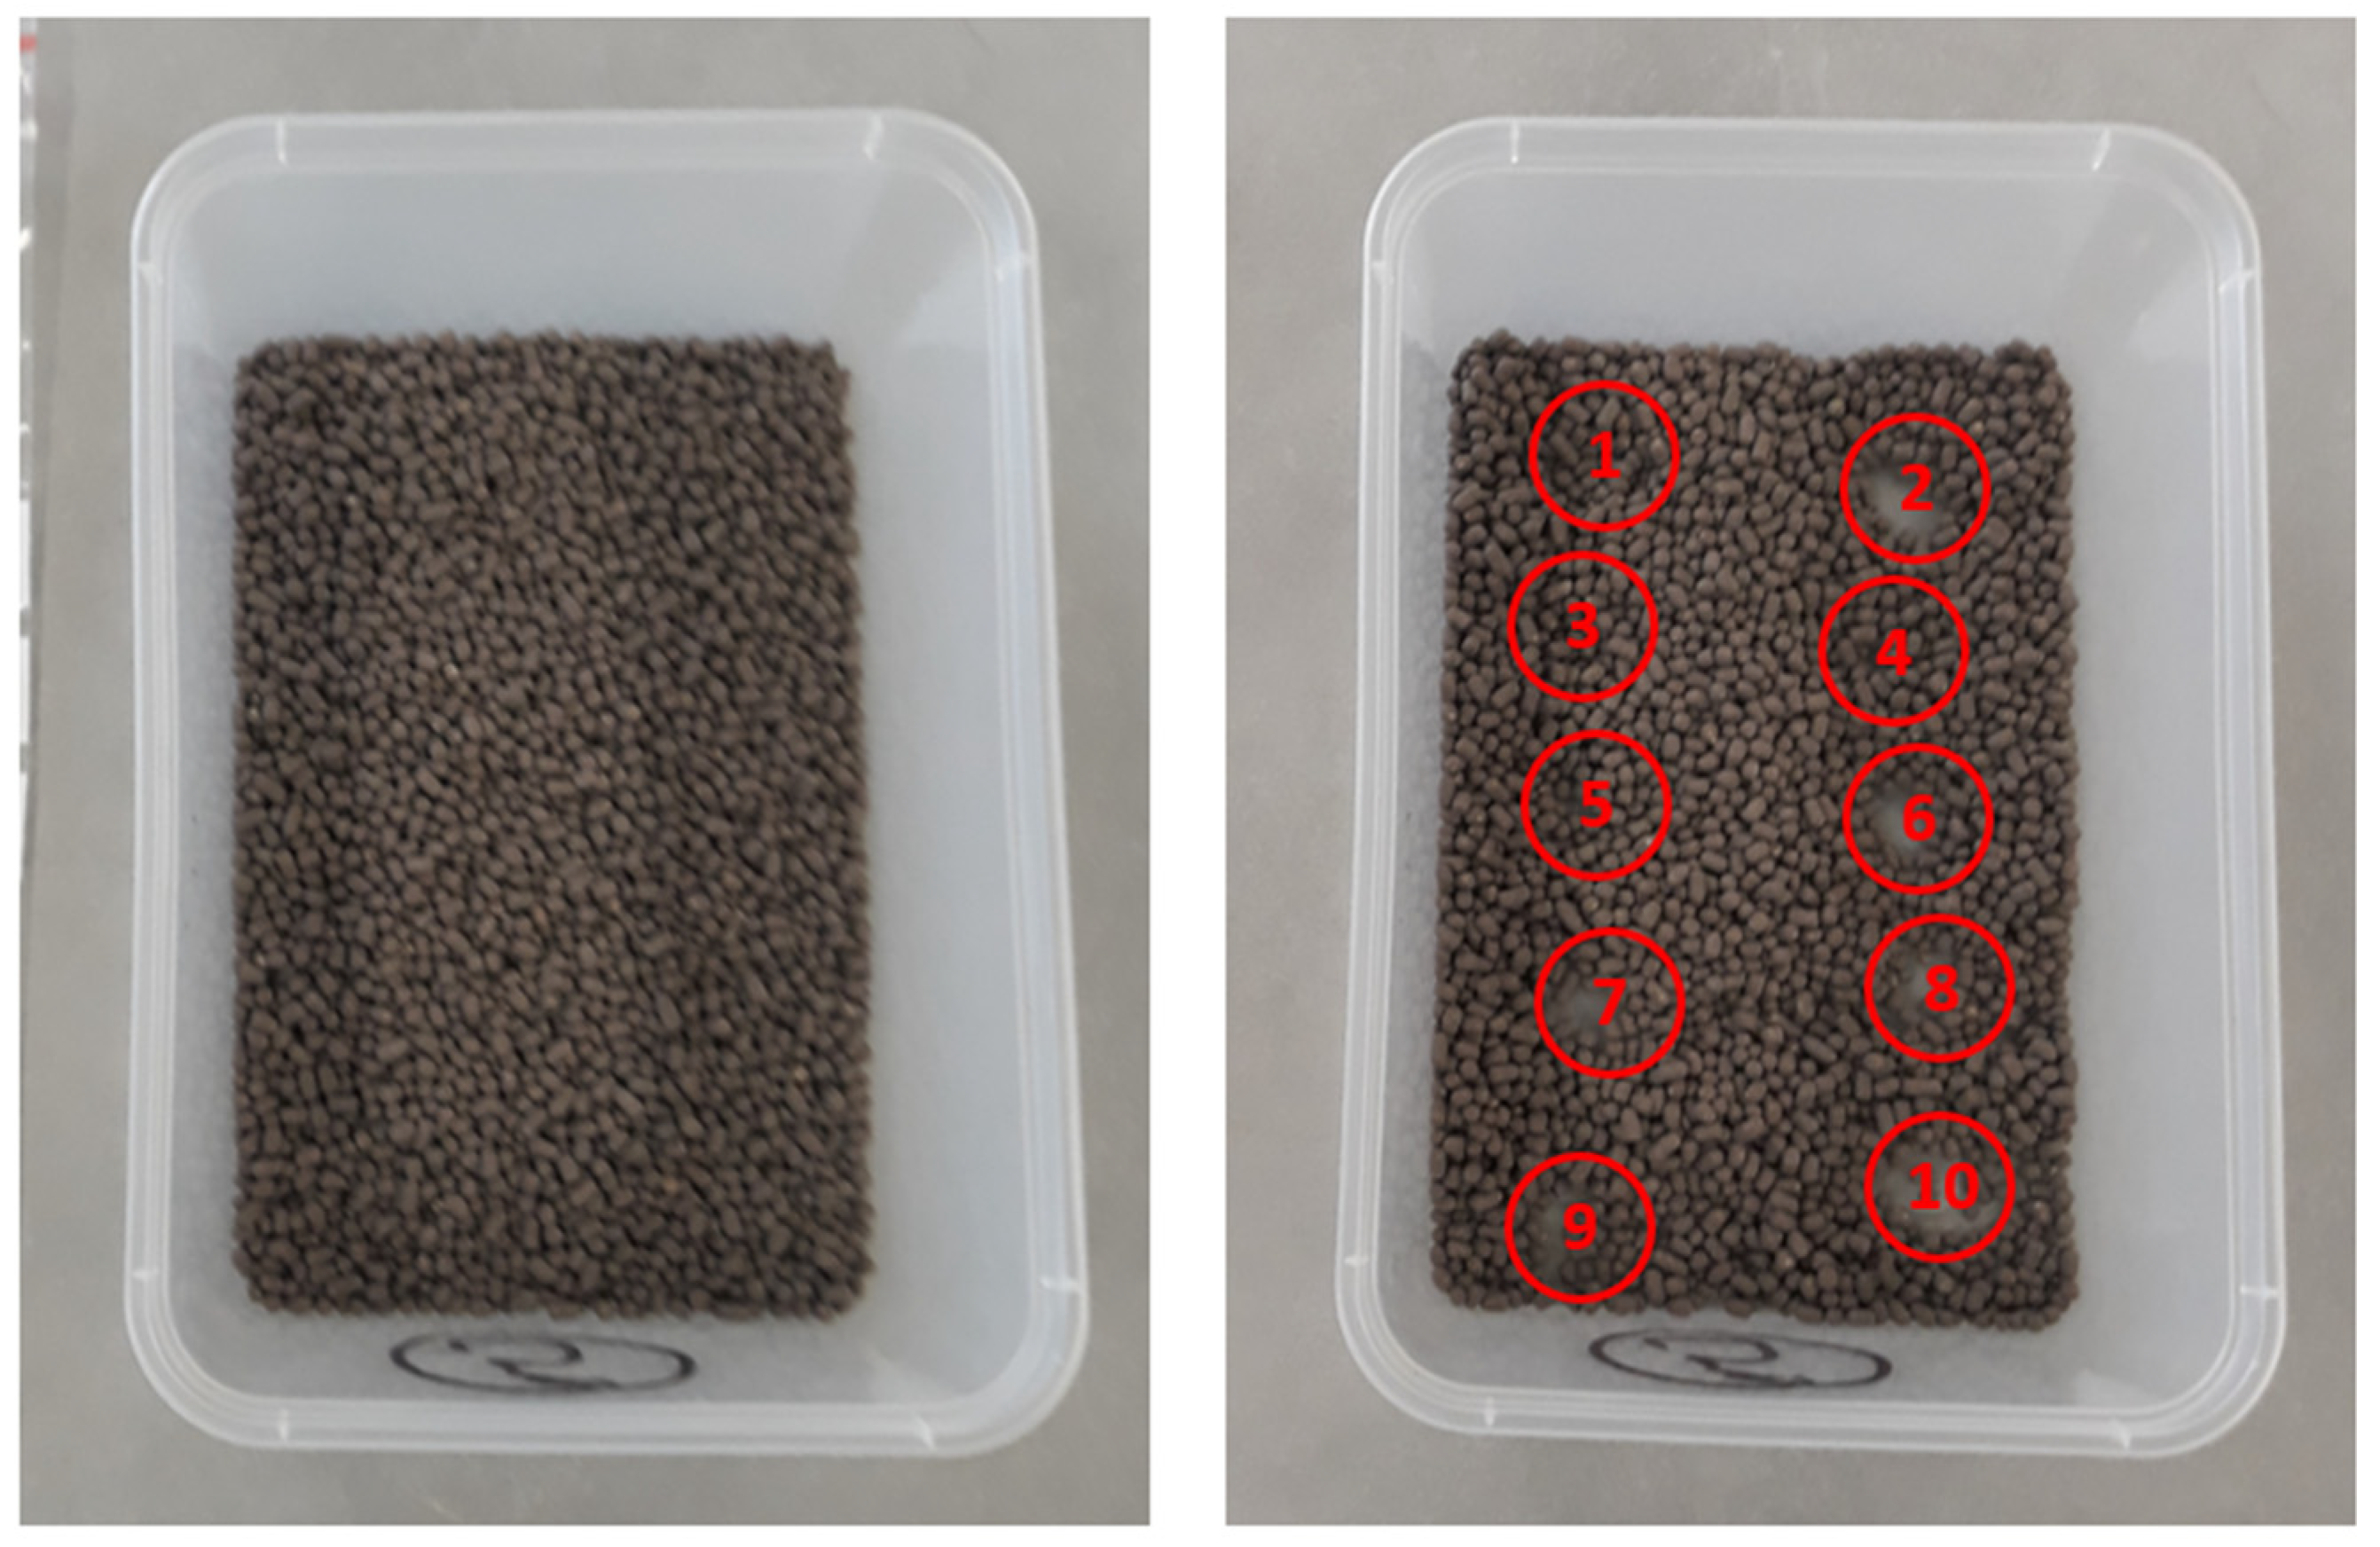
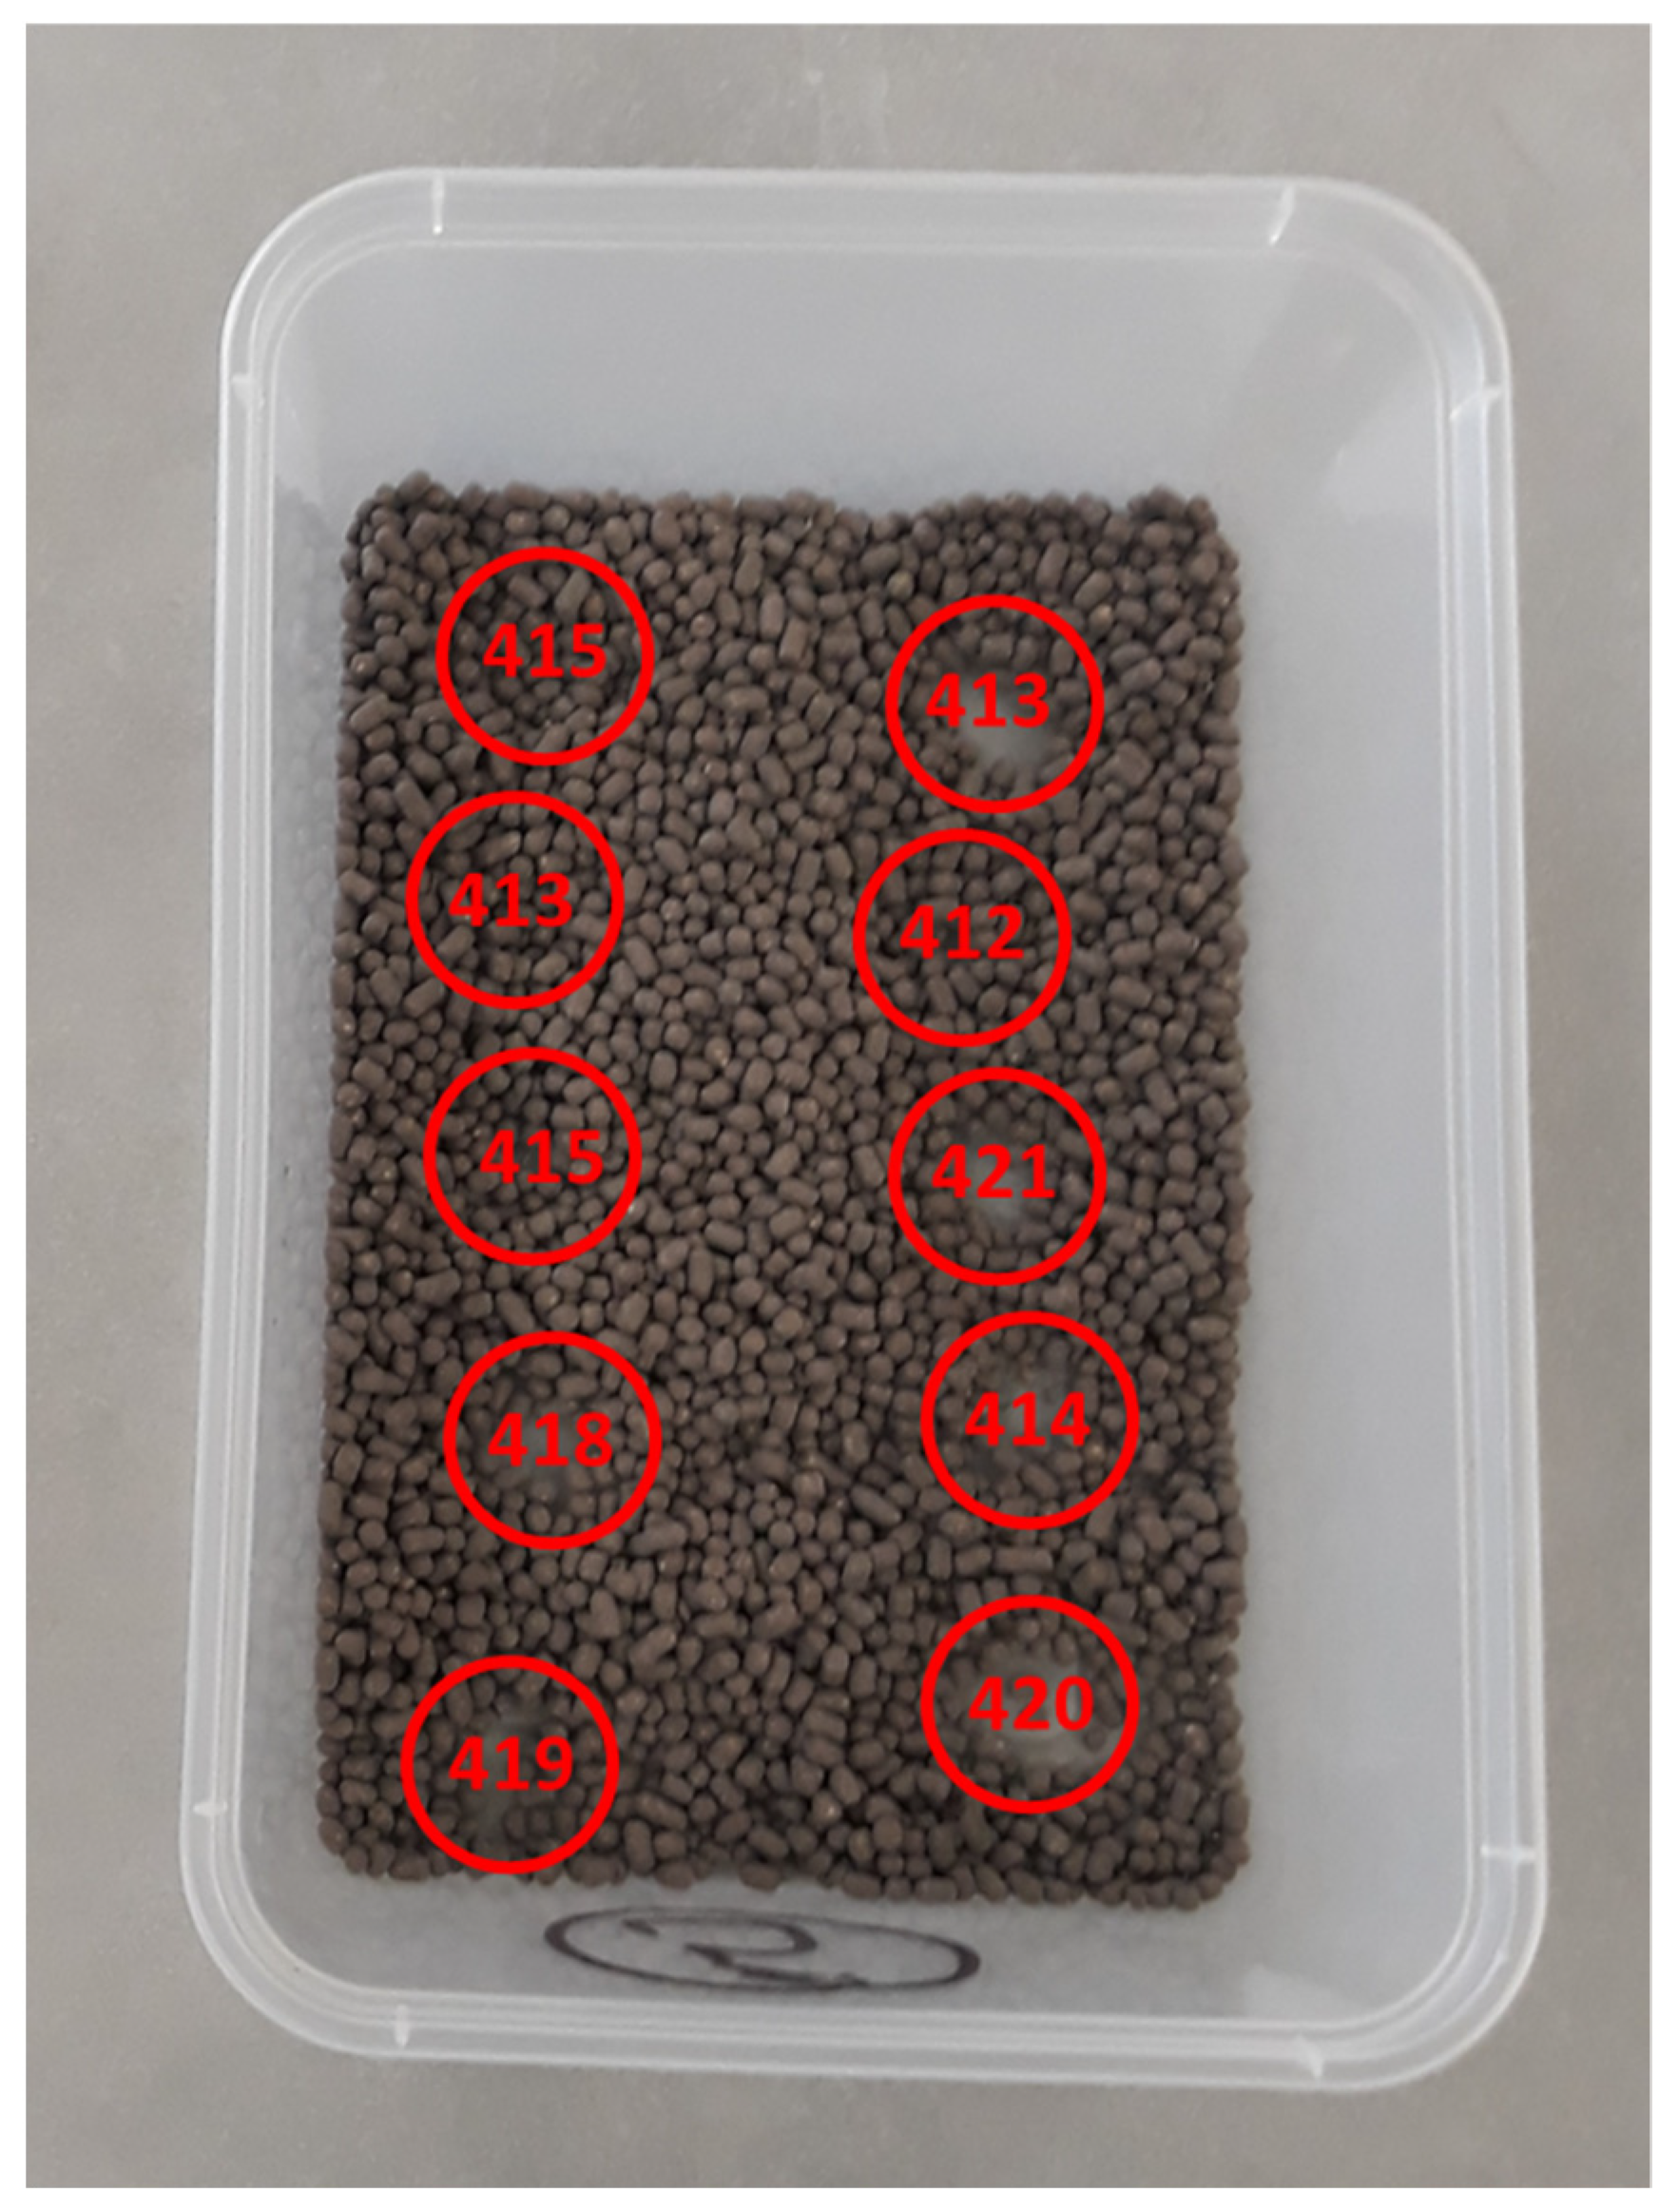
Figure 3.
Sampling of the ten spatial replicates of the Regain400 sample. The red circles show the sampled areas.
Figure 3.
Sampling of the ten spatial replicates of the Regain400 sample. The red circles show the sampled areas.
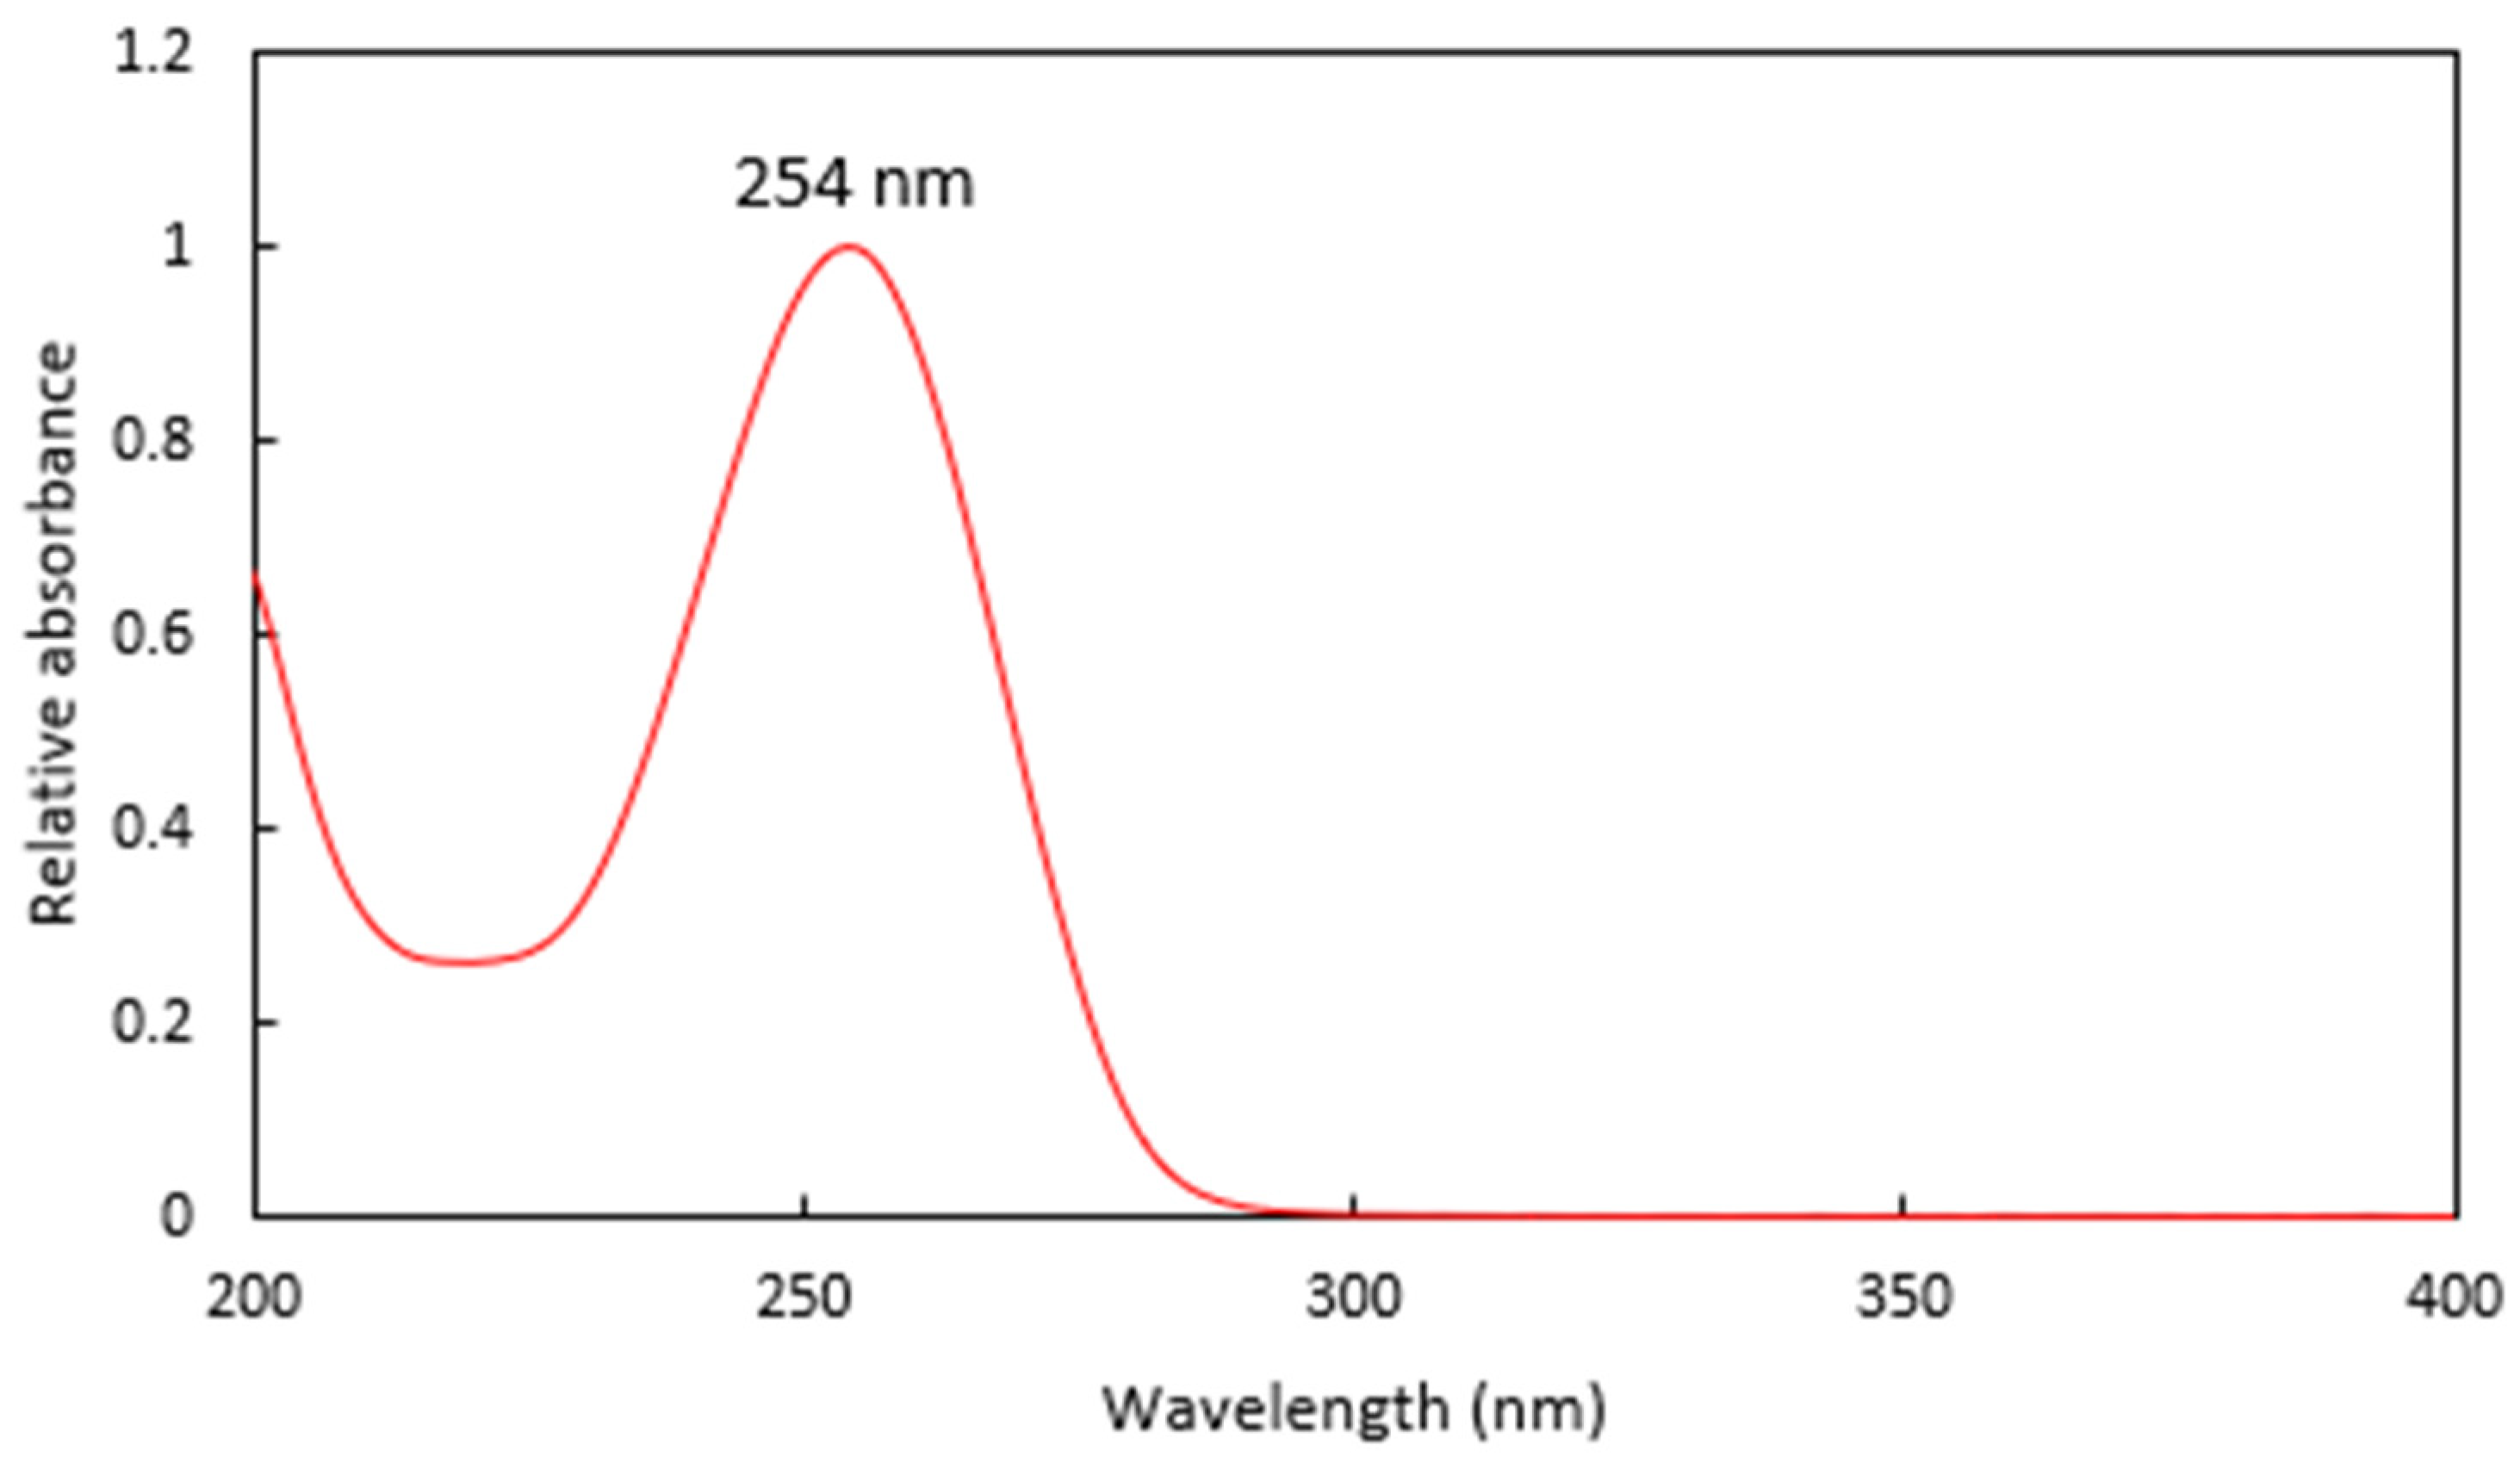
Figure 4.
The UV spectra of a Regain extract, showing the λmax at 254 nm.
Figure 4.
The UV spectra of a Regain extract, showing the λmax at 254 nm.
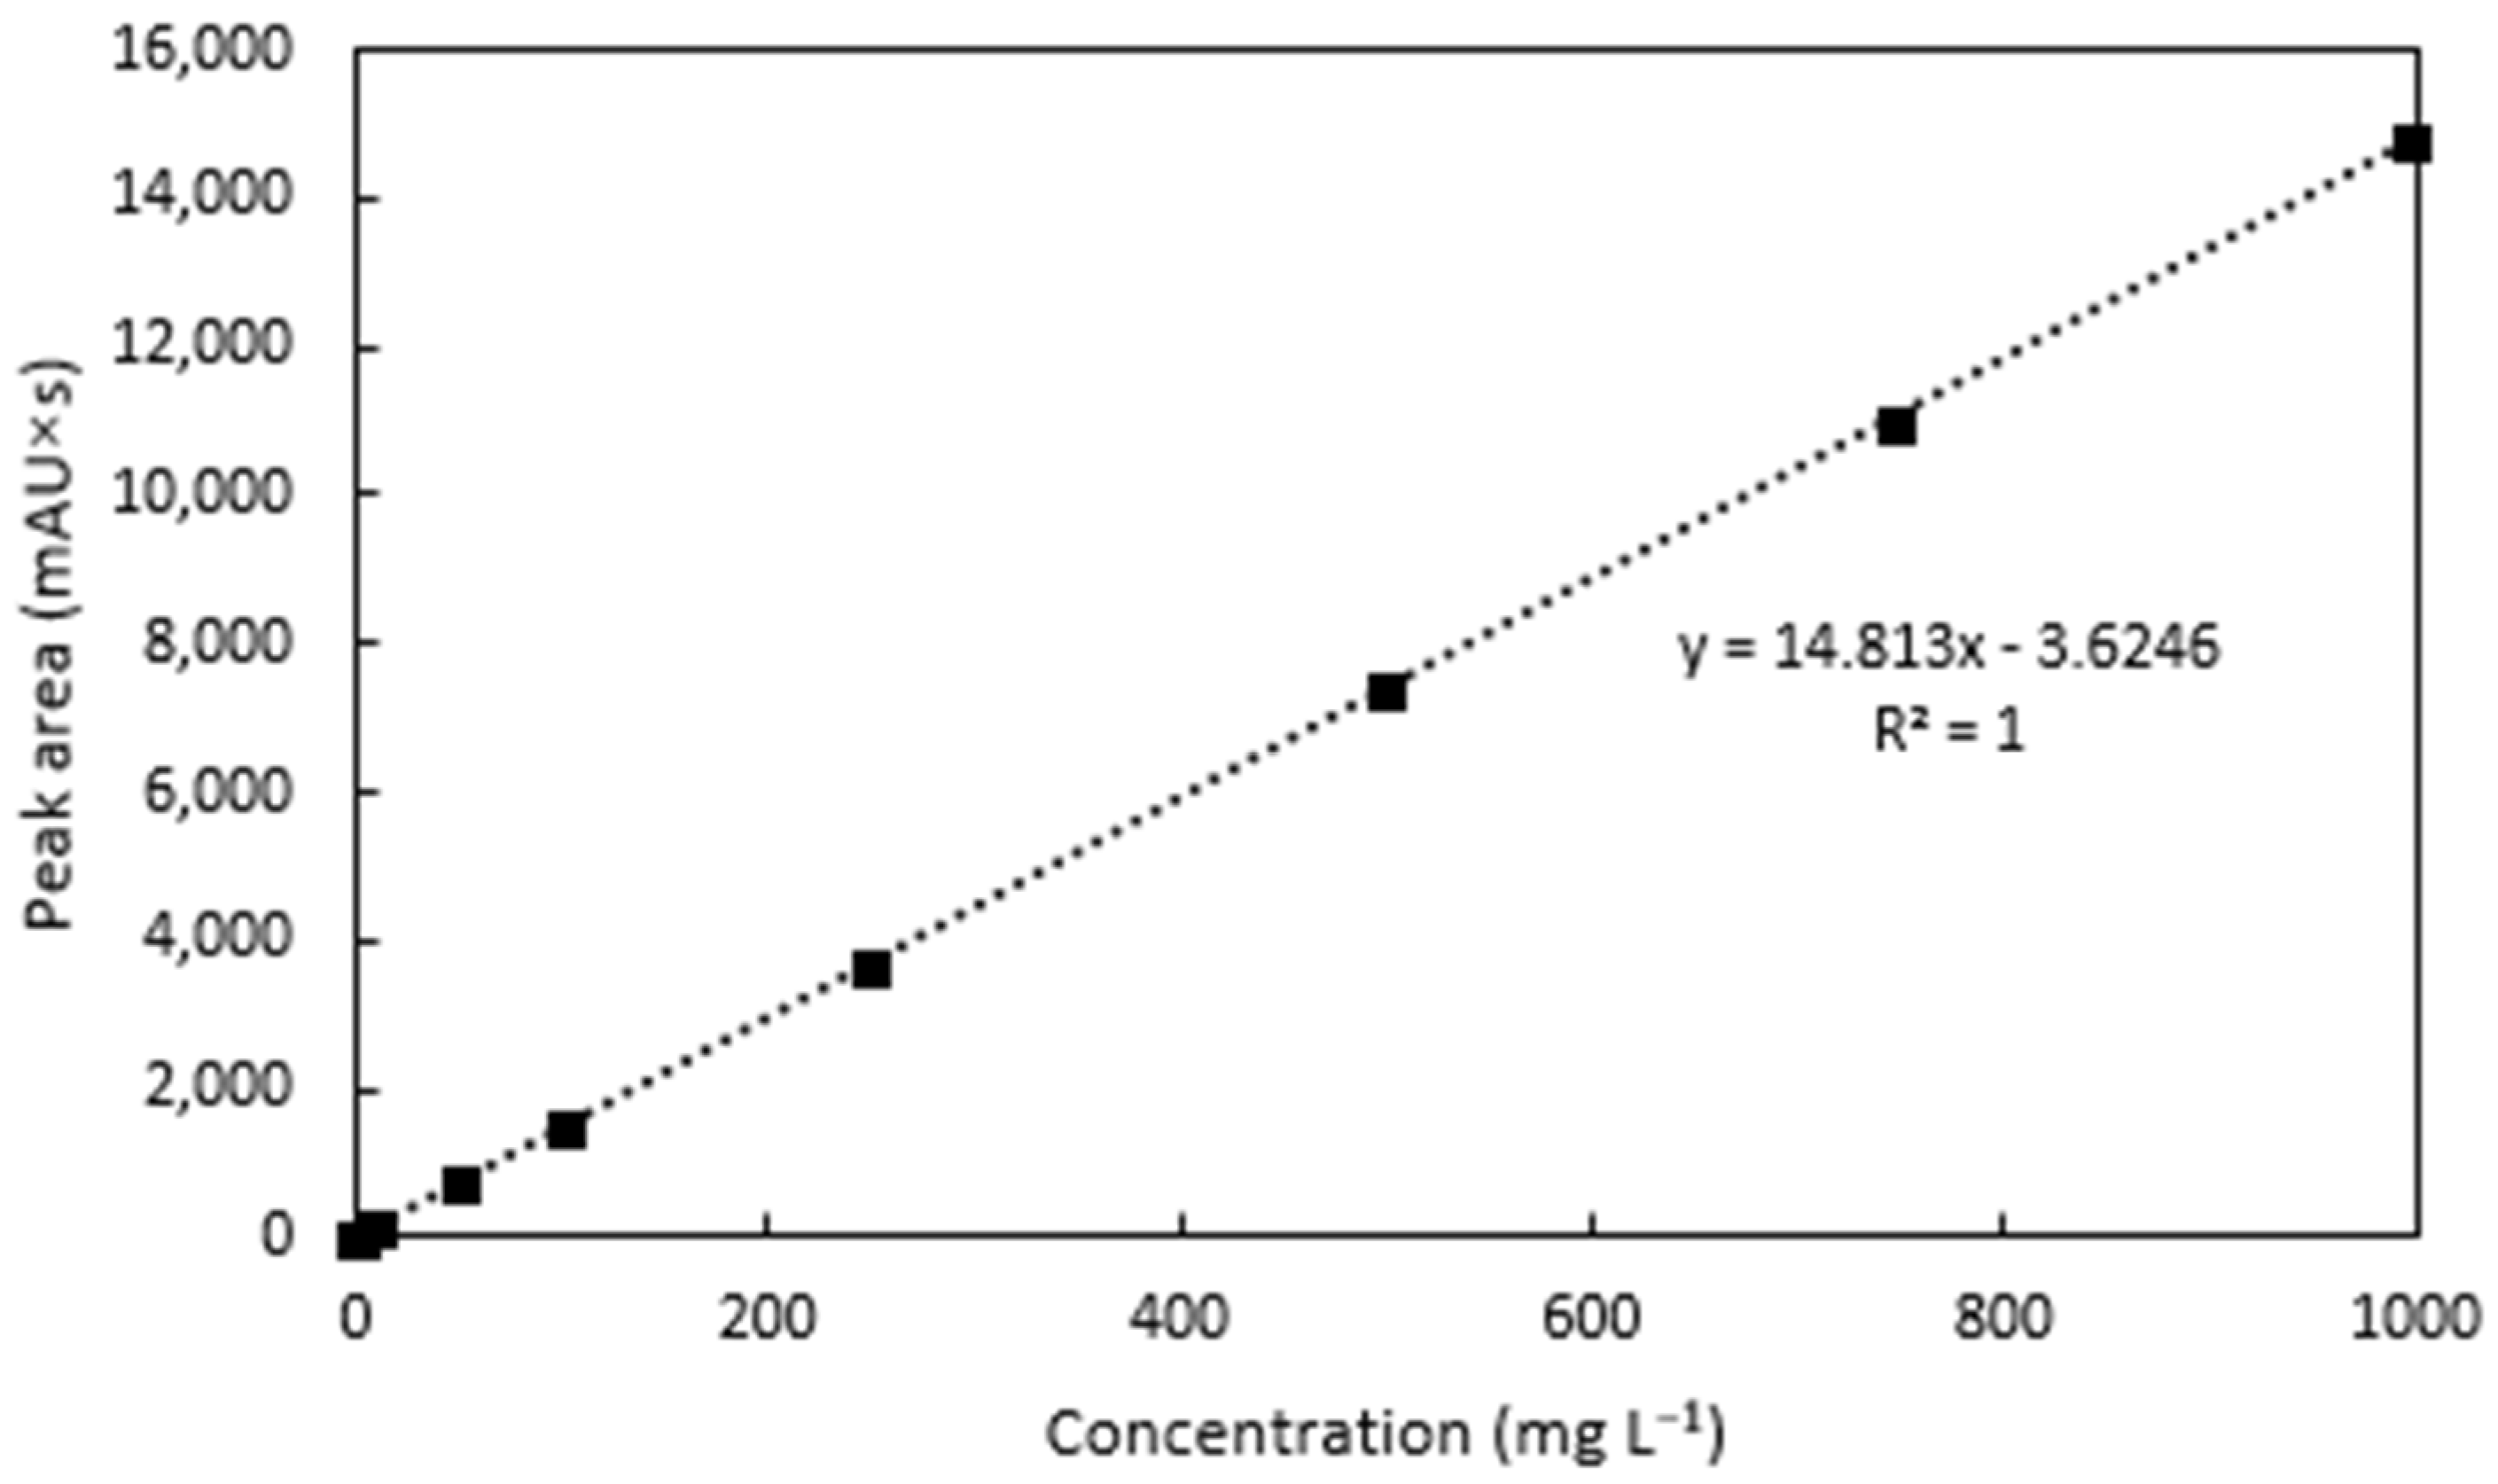
Figure 5.
Linearity of the tebuthiuron standards.
Figure 5.
Linearity of the tebuthiuron standards.
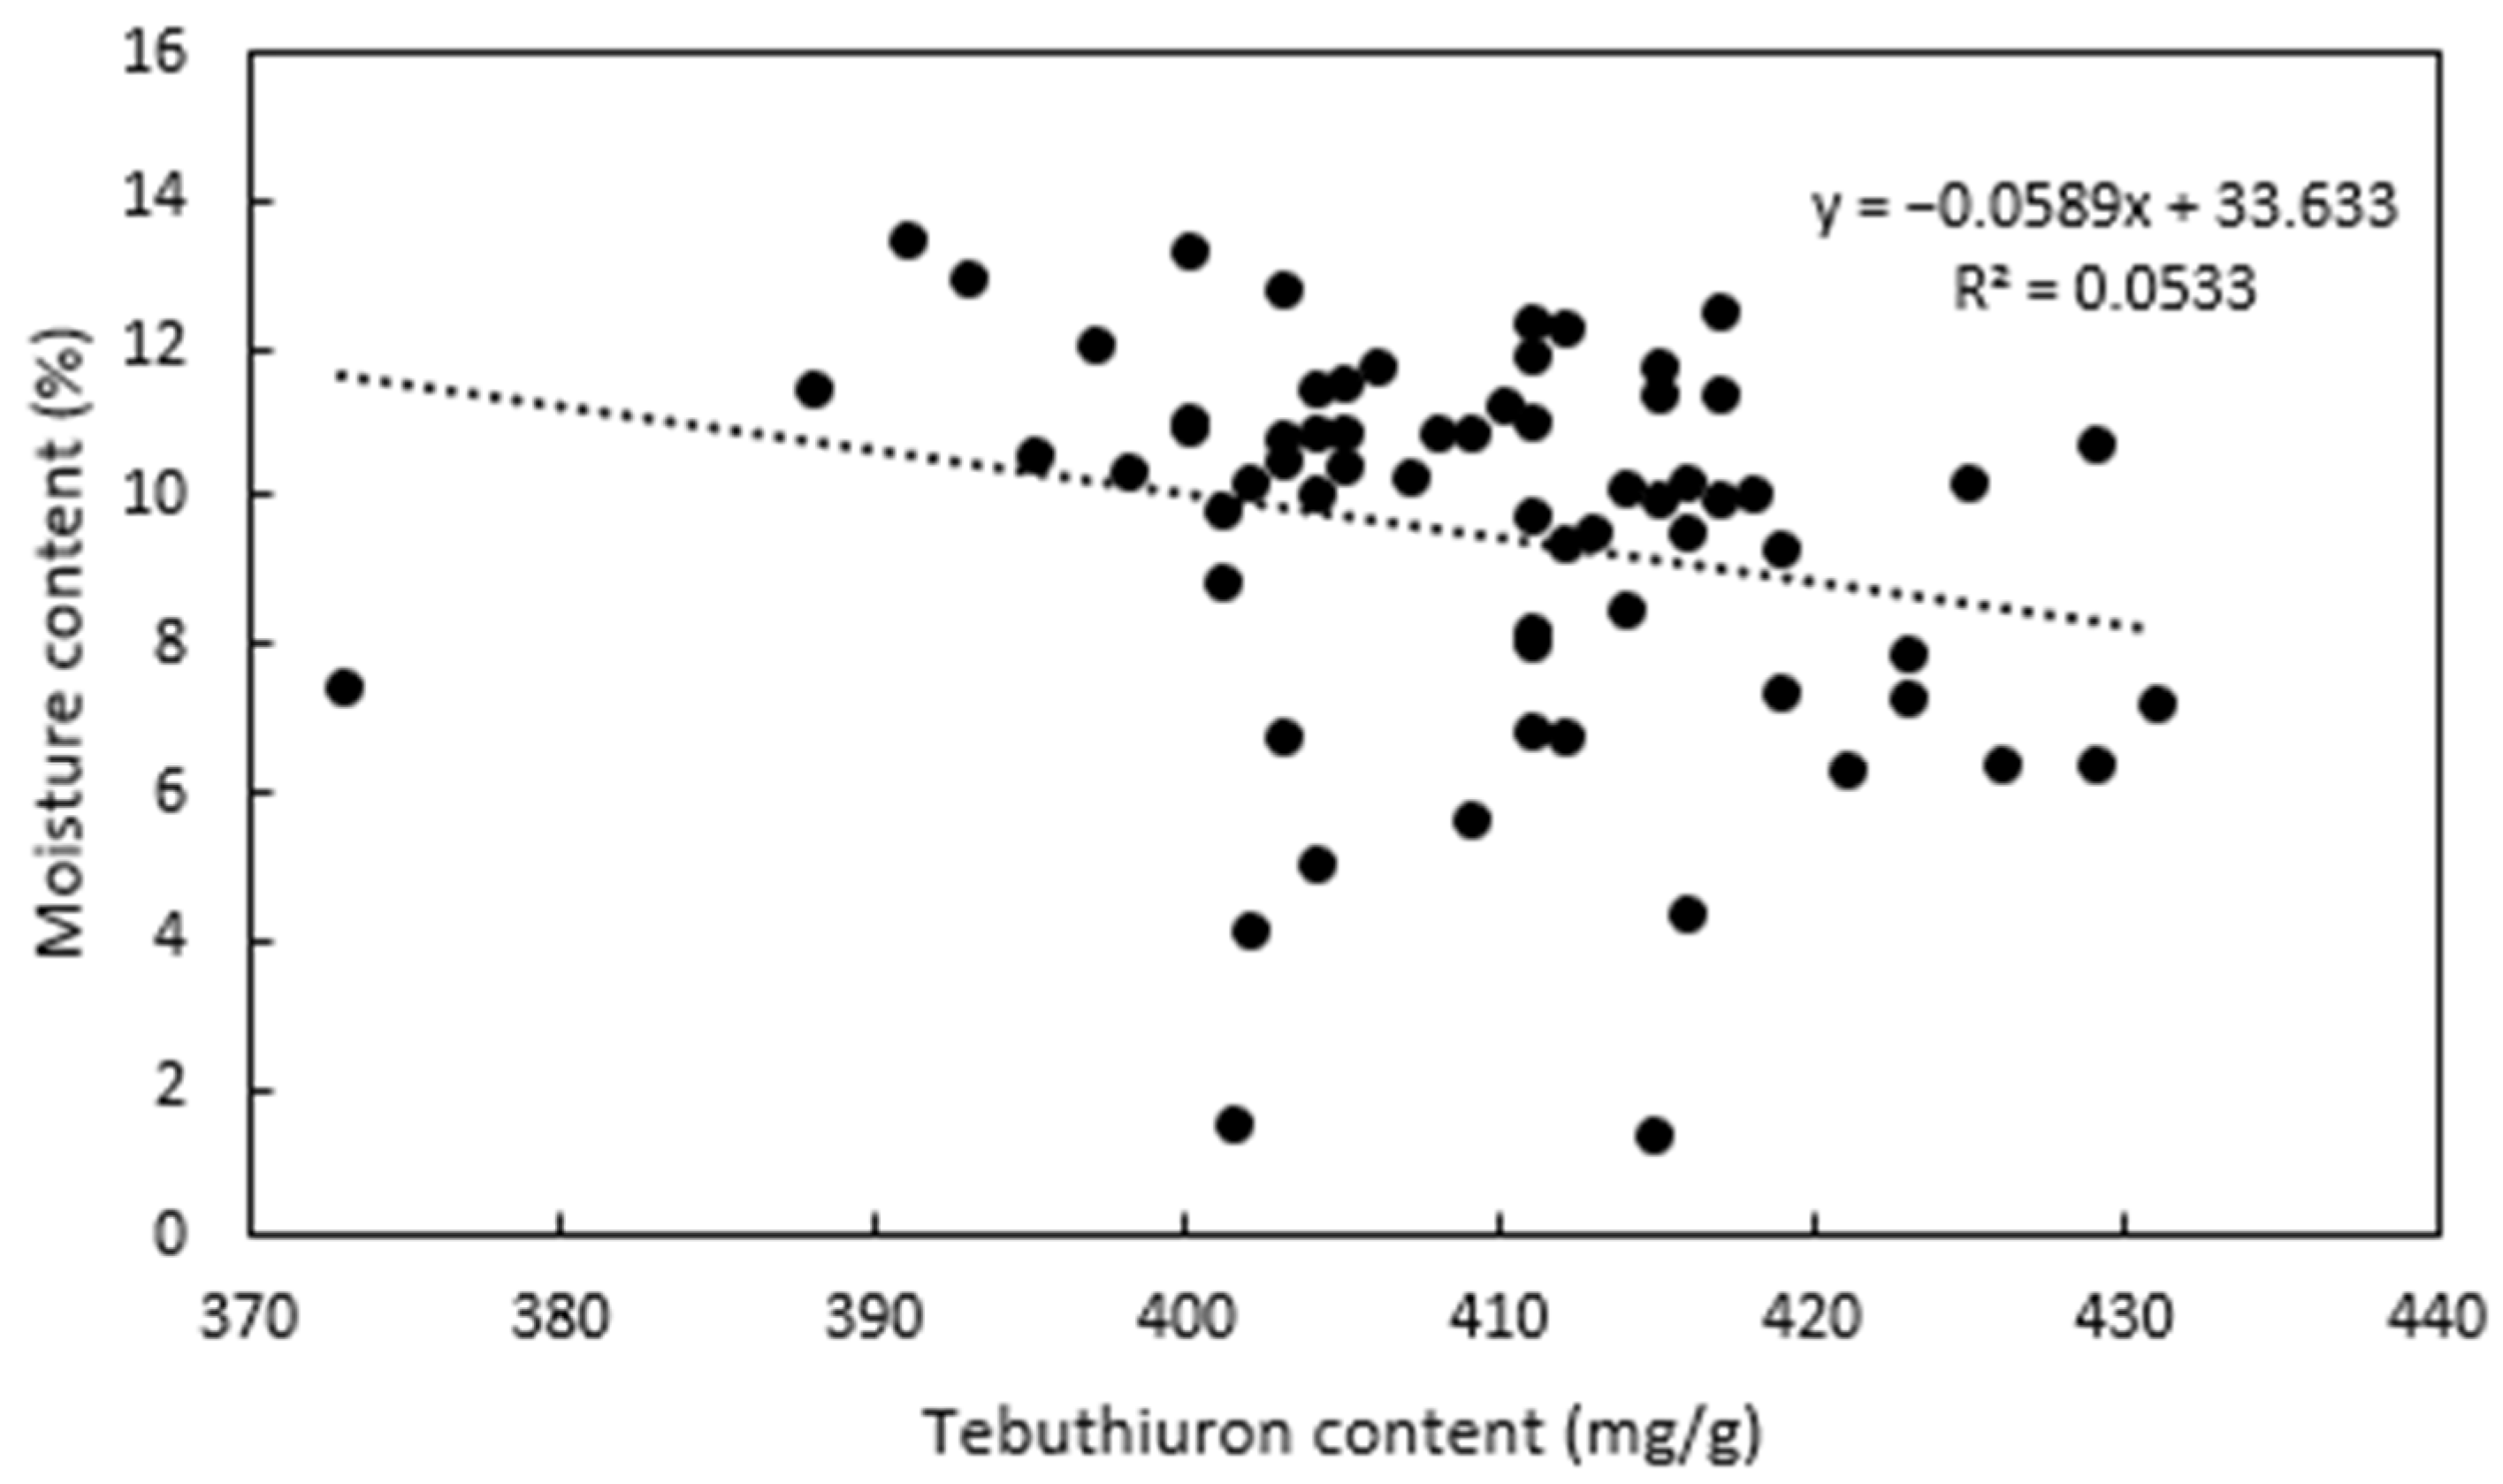
Figure 6.
Relationship between the tebuthiuron content and the moisture content of the Regain400 samples.
Figure 6.
Relationship between the tebuthiuron content and the moisture content of the Regain400 samples.
Figure 7.
The mean tebuthiuron contents for the ten spatial replicates analysed. The numbers over each sample location provide the mean tebuthiuron content in mg/g.
Figure 7.
The mean tebuthiuron contents for the ten spatial replicates analysed. The numbers over each sample location provide the mean tebuthiuron content in mg/g.
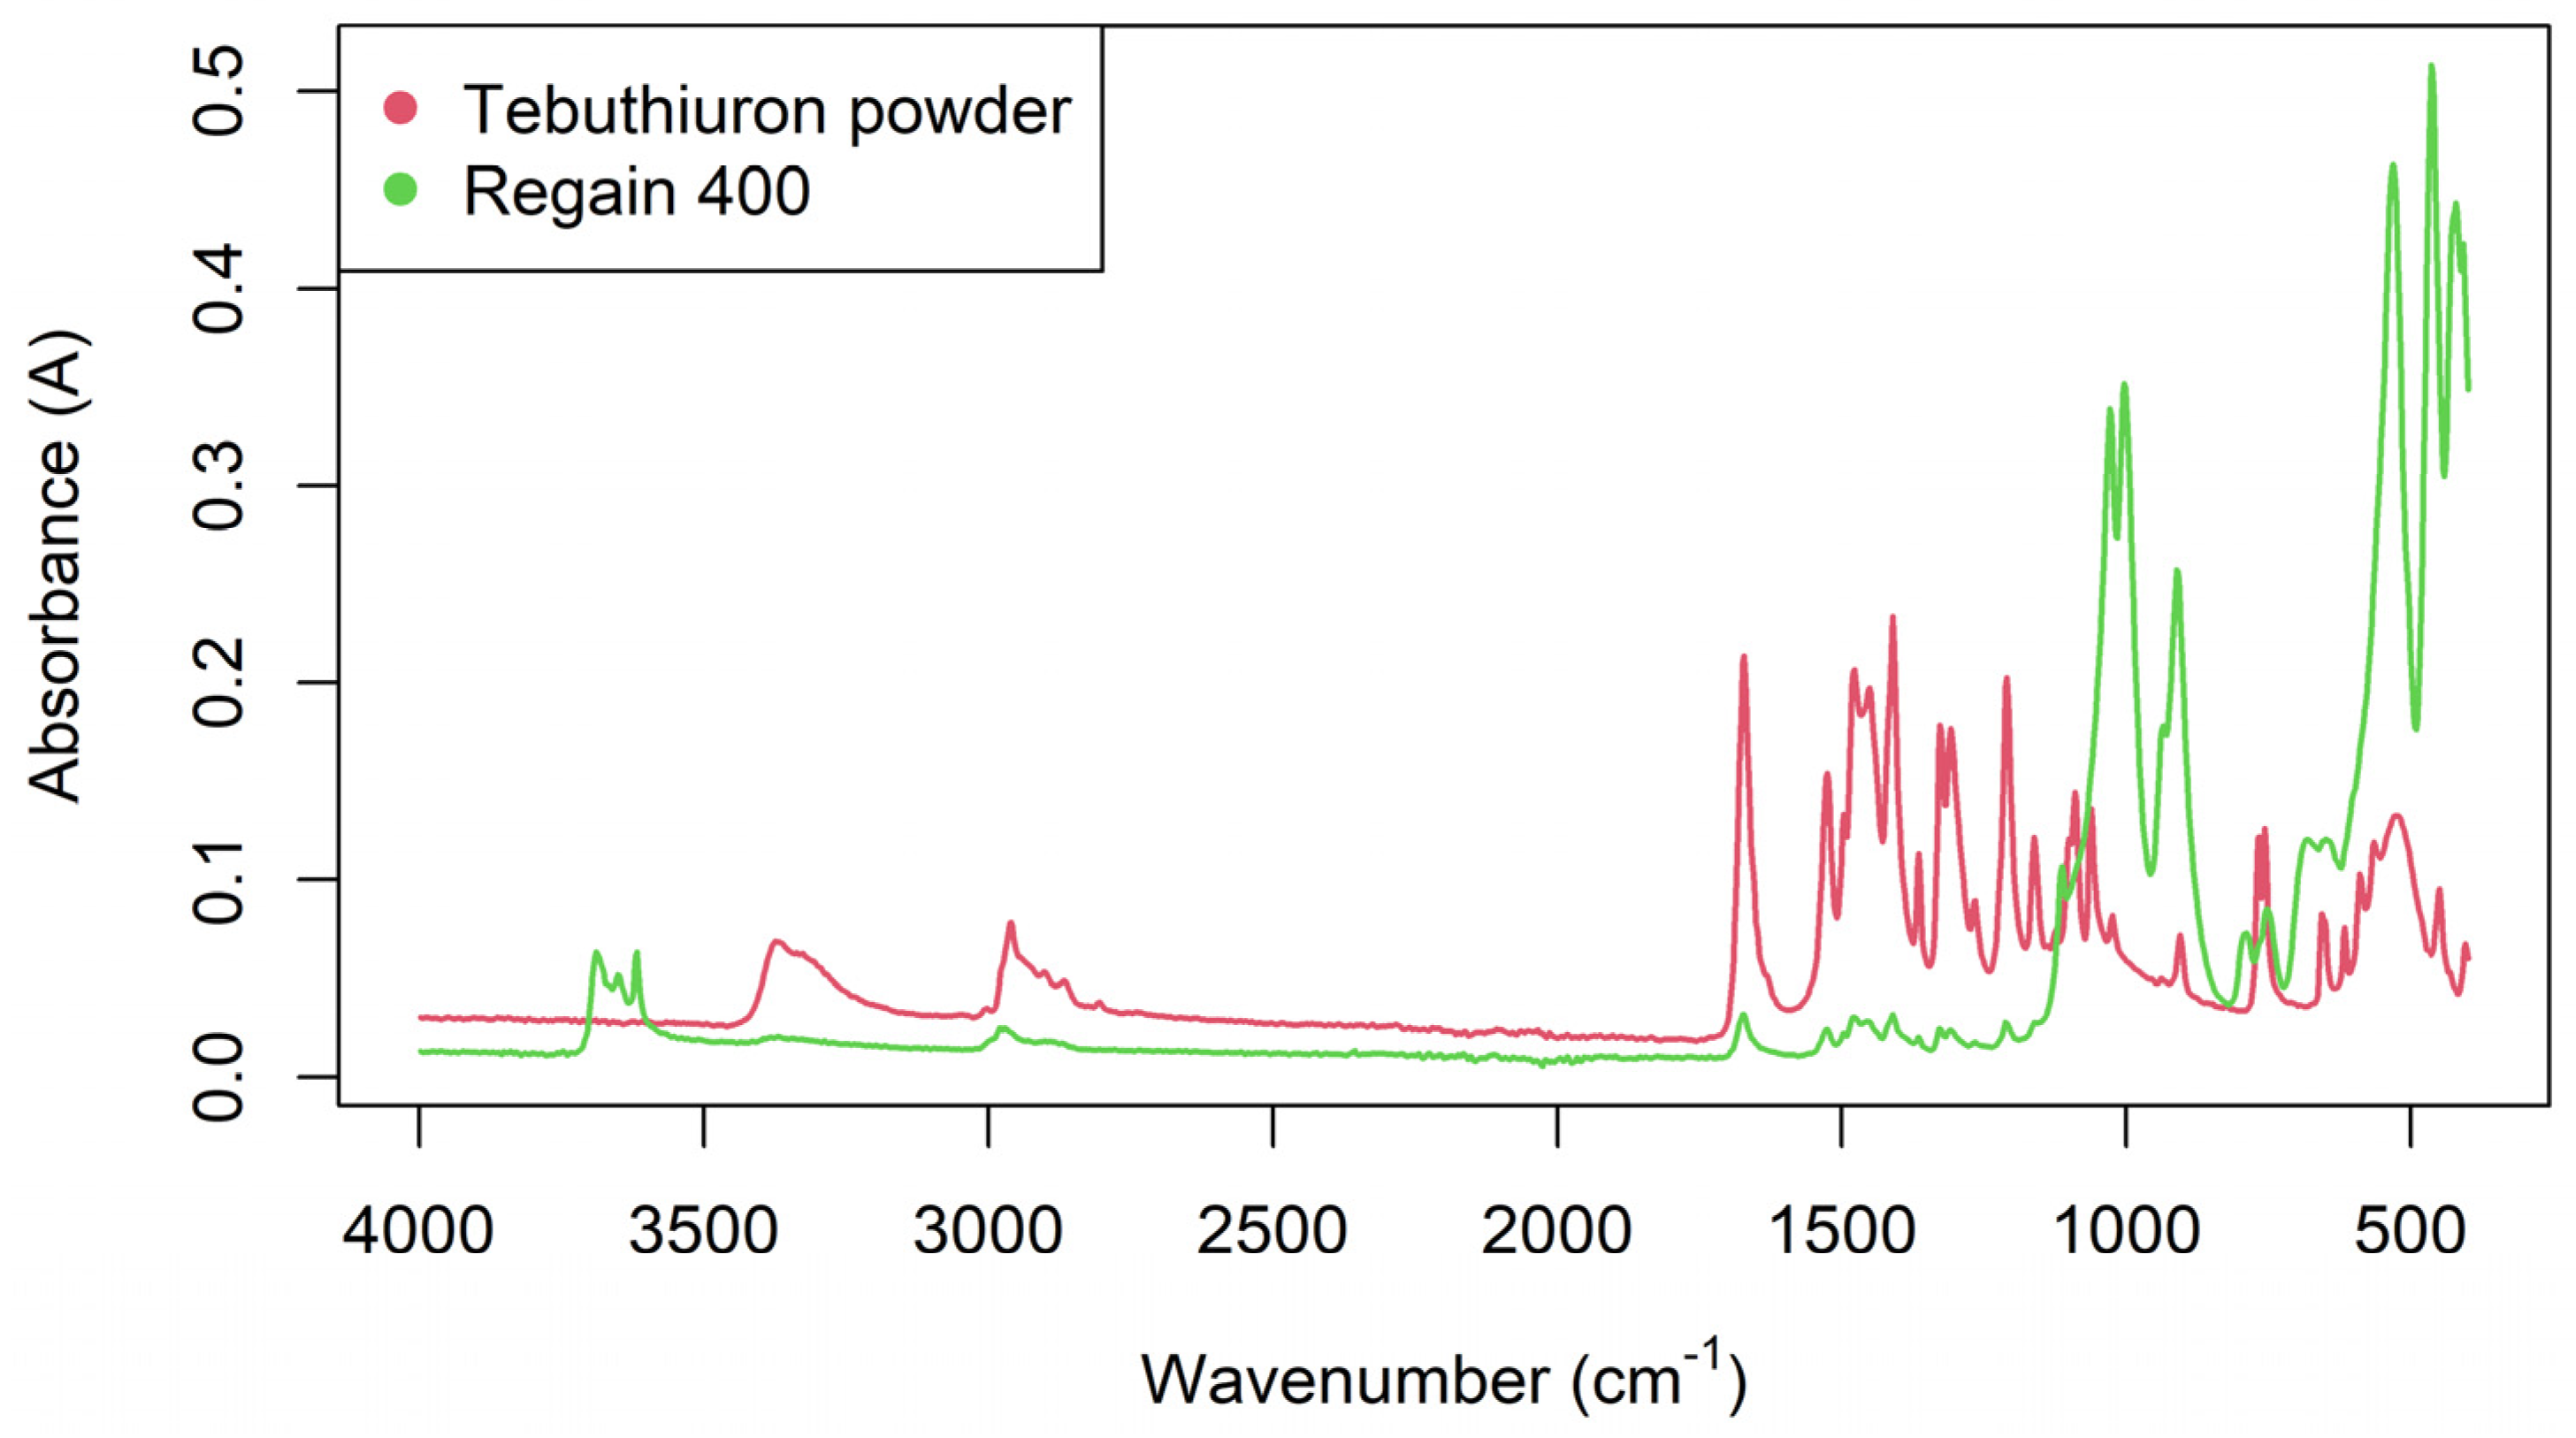
Figure 8.
FTIR spectra of a typical powdered 400 mg/g Regain sample and a sample of pure tebuthiuron powder (99.6% purity).
Figure 8.
FTIR spectra of a typical powdered 400 mg/g Regain sample and a sample of pure tebuthiuron powder (99.6% purity).
Figure 9.
The results of the best-performing PLSR model for the prediction of moisture content using the FTIR spectra of the Regain samples (using SNV pre-processing). The blue points show the model calibration, while the red points show the model cross-validation.
Figure 9.
The results of the best-performing PLSR model for the prediction of moisture content using the FTIR spectra of the Regain samples (using SNV pre-processing). The blue points show the model calibration, while the red points show the model cross-validation.
Figure 10.
The results of the best-performing PLSR model for the prediction of tebuthiuron content using the FTIR spectra of the powdered Regain400 samples (using SNV pre-processing). The blue points show the model calibration, while the red points show the model cross-validation.
Figure 10.
The results of the best-performing PLSR model for the prediction of tebuthiuron content using the FTIR spectra of the powdered Regain400 samples (using SNV pre-processing). The blue points show the model calibration, while the red points show the model cross-validation.
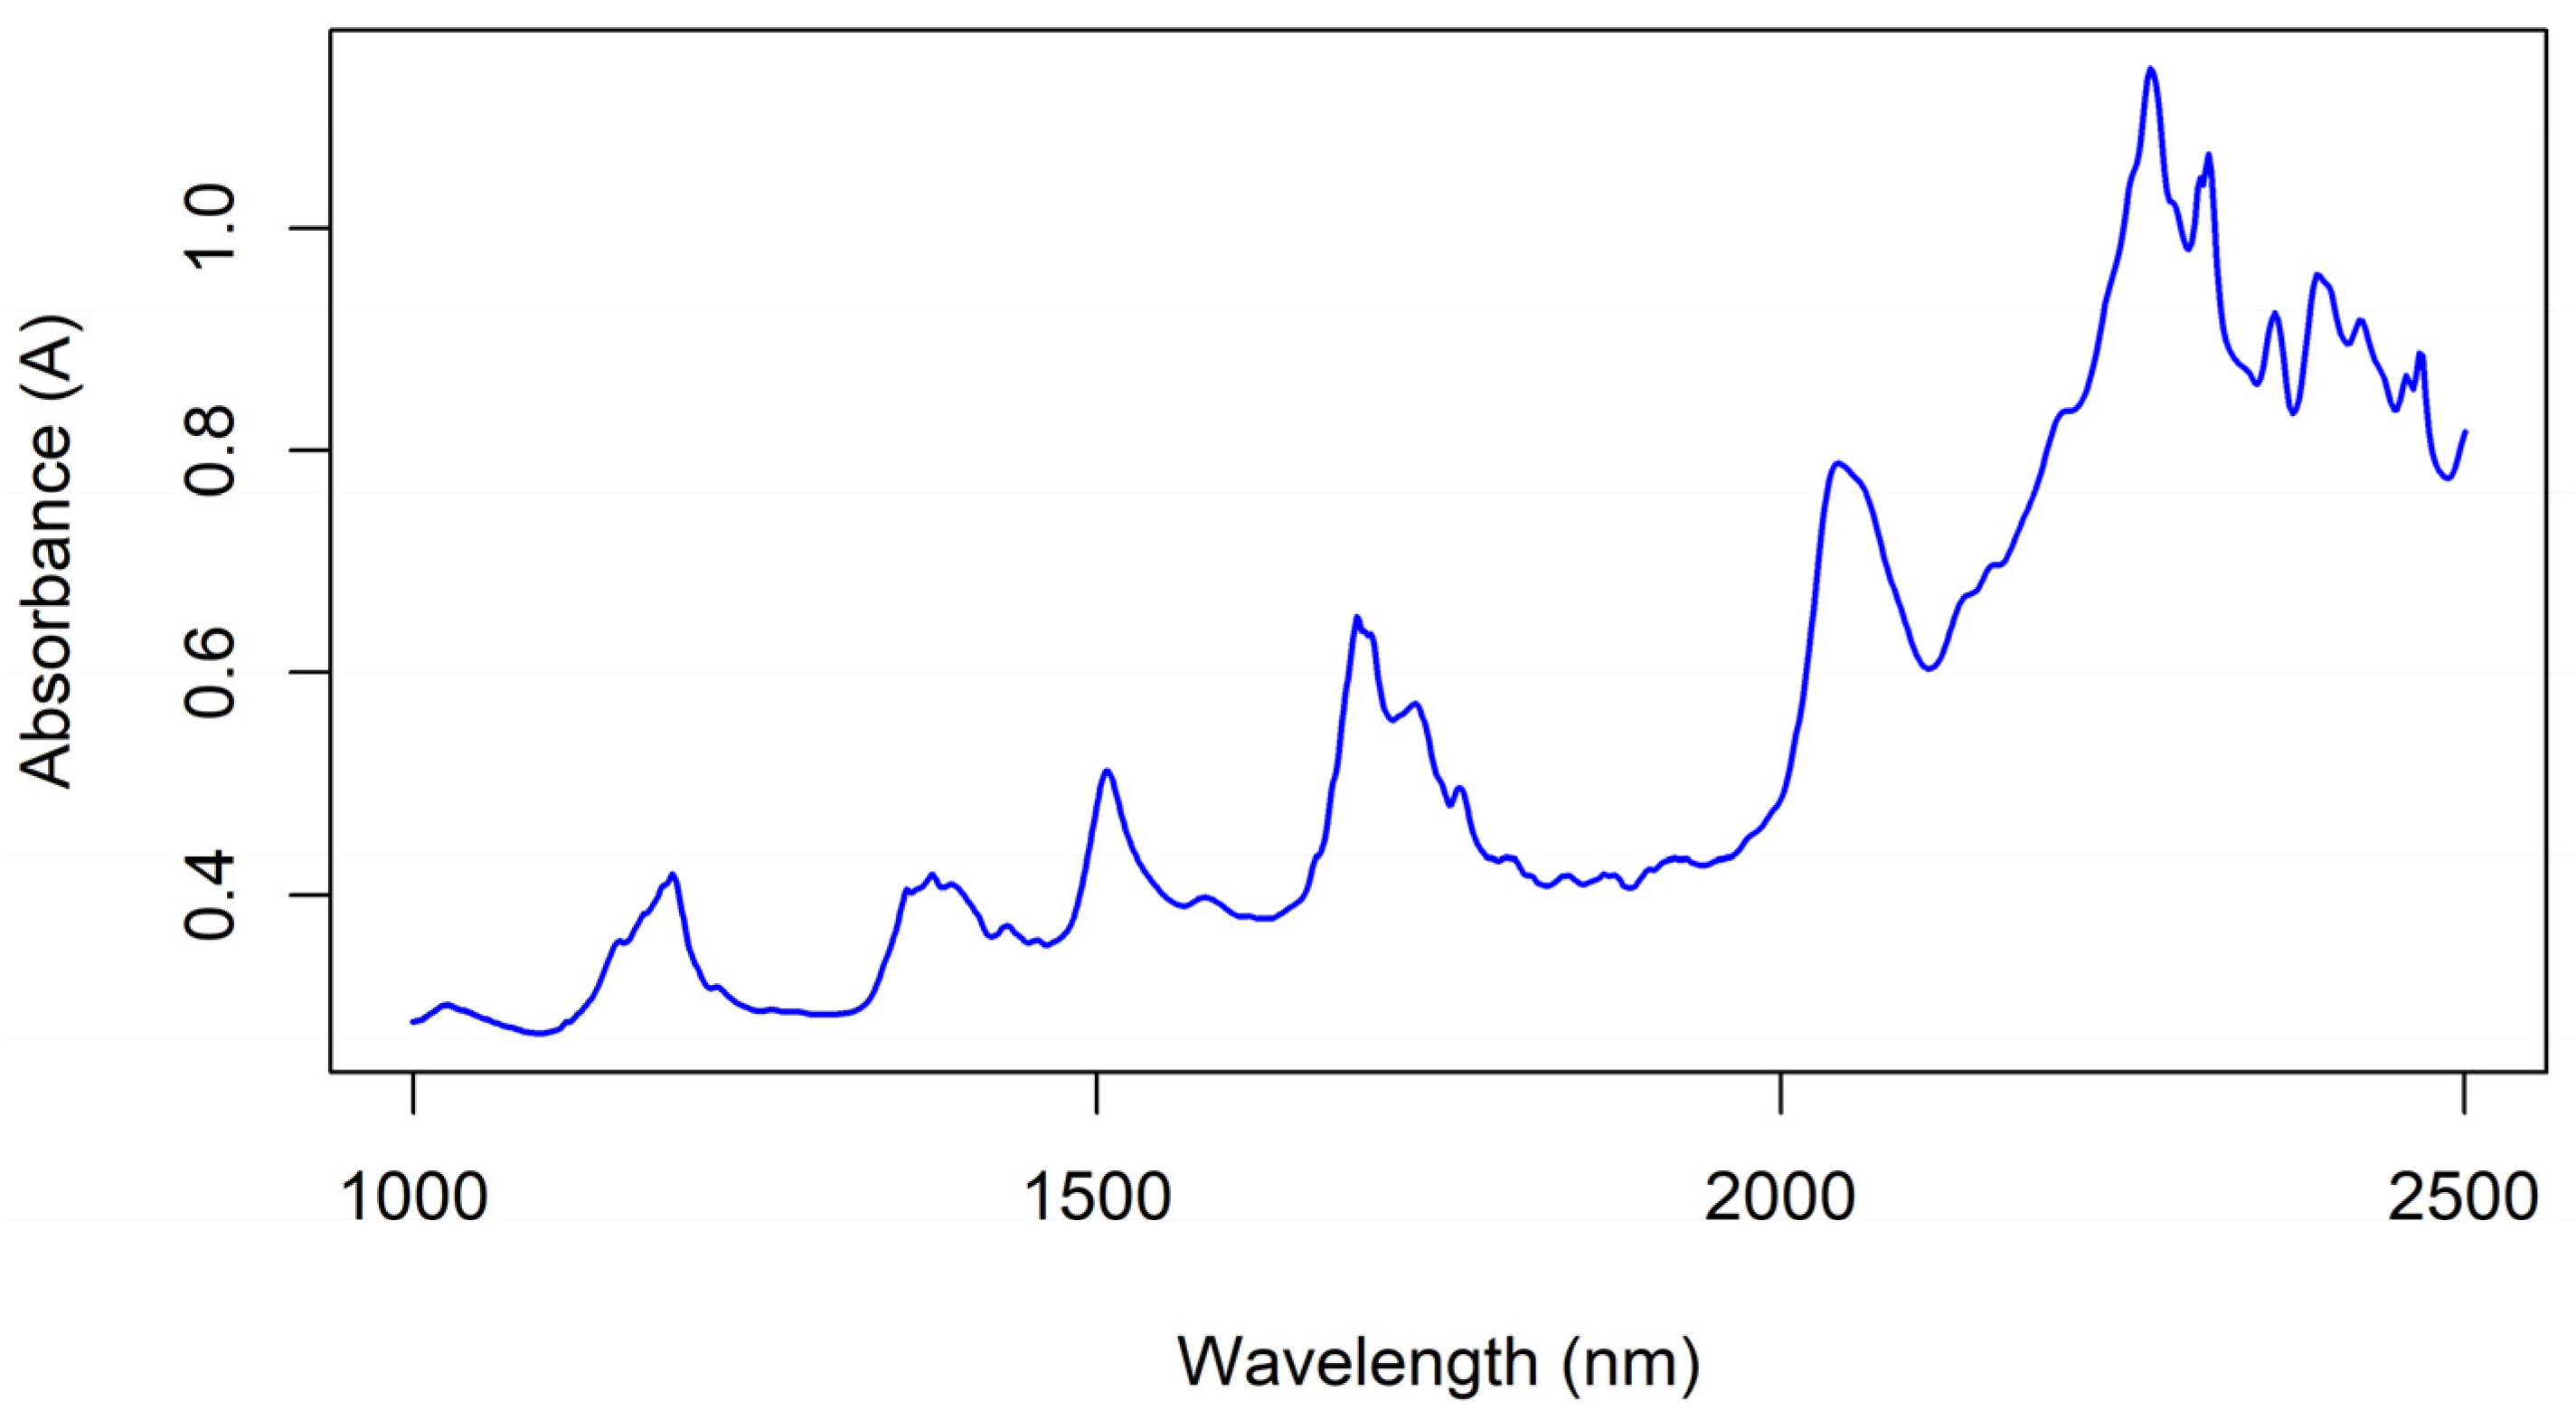
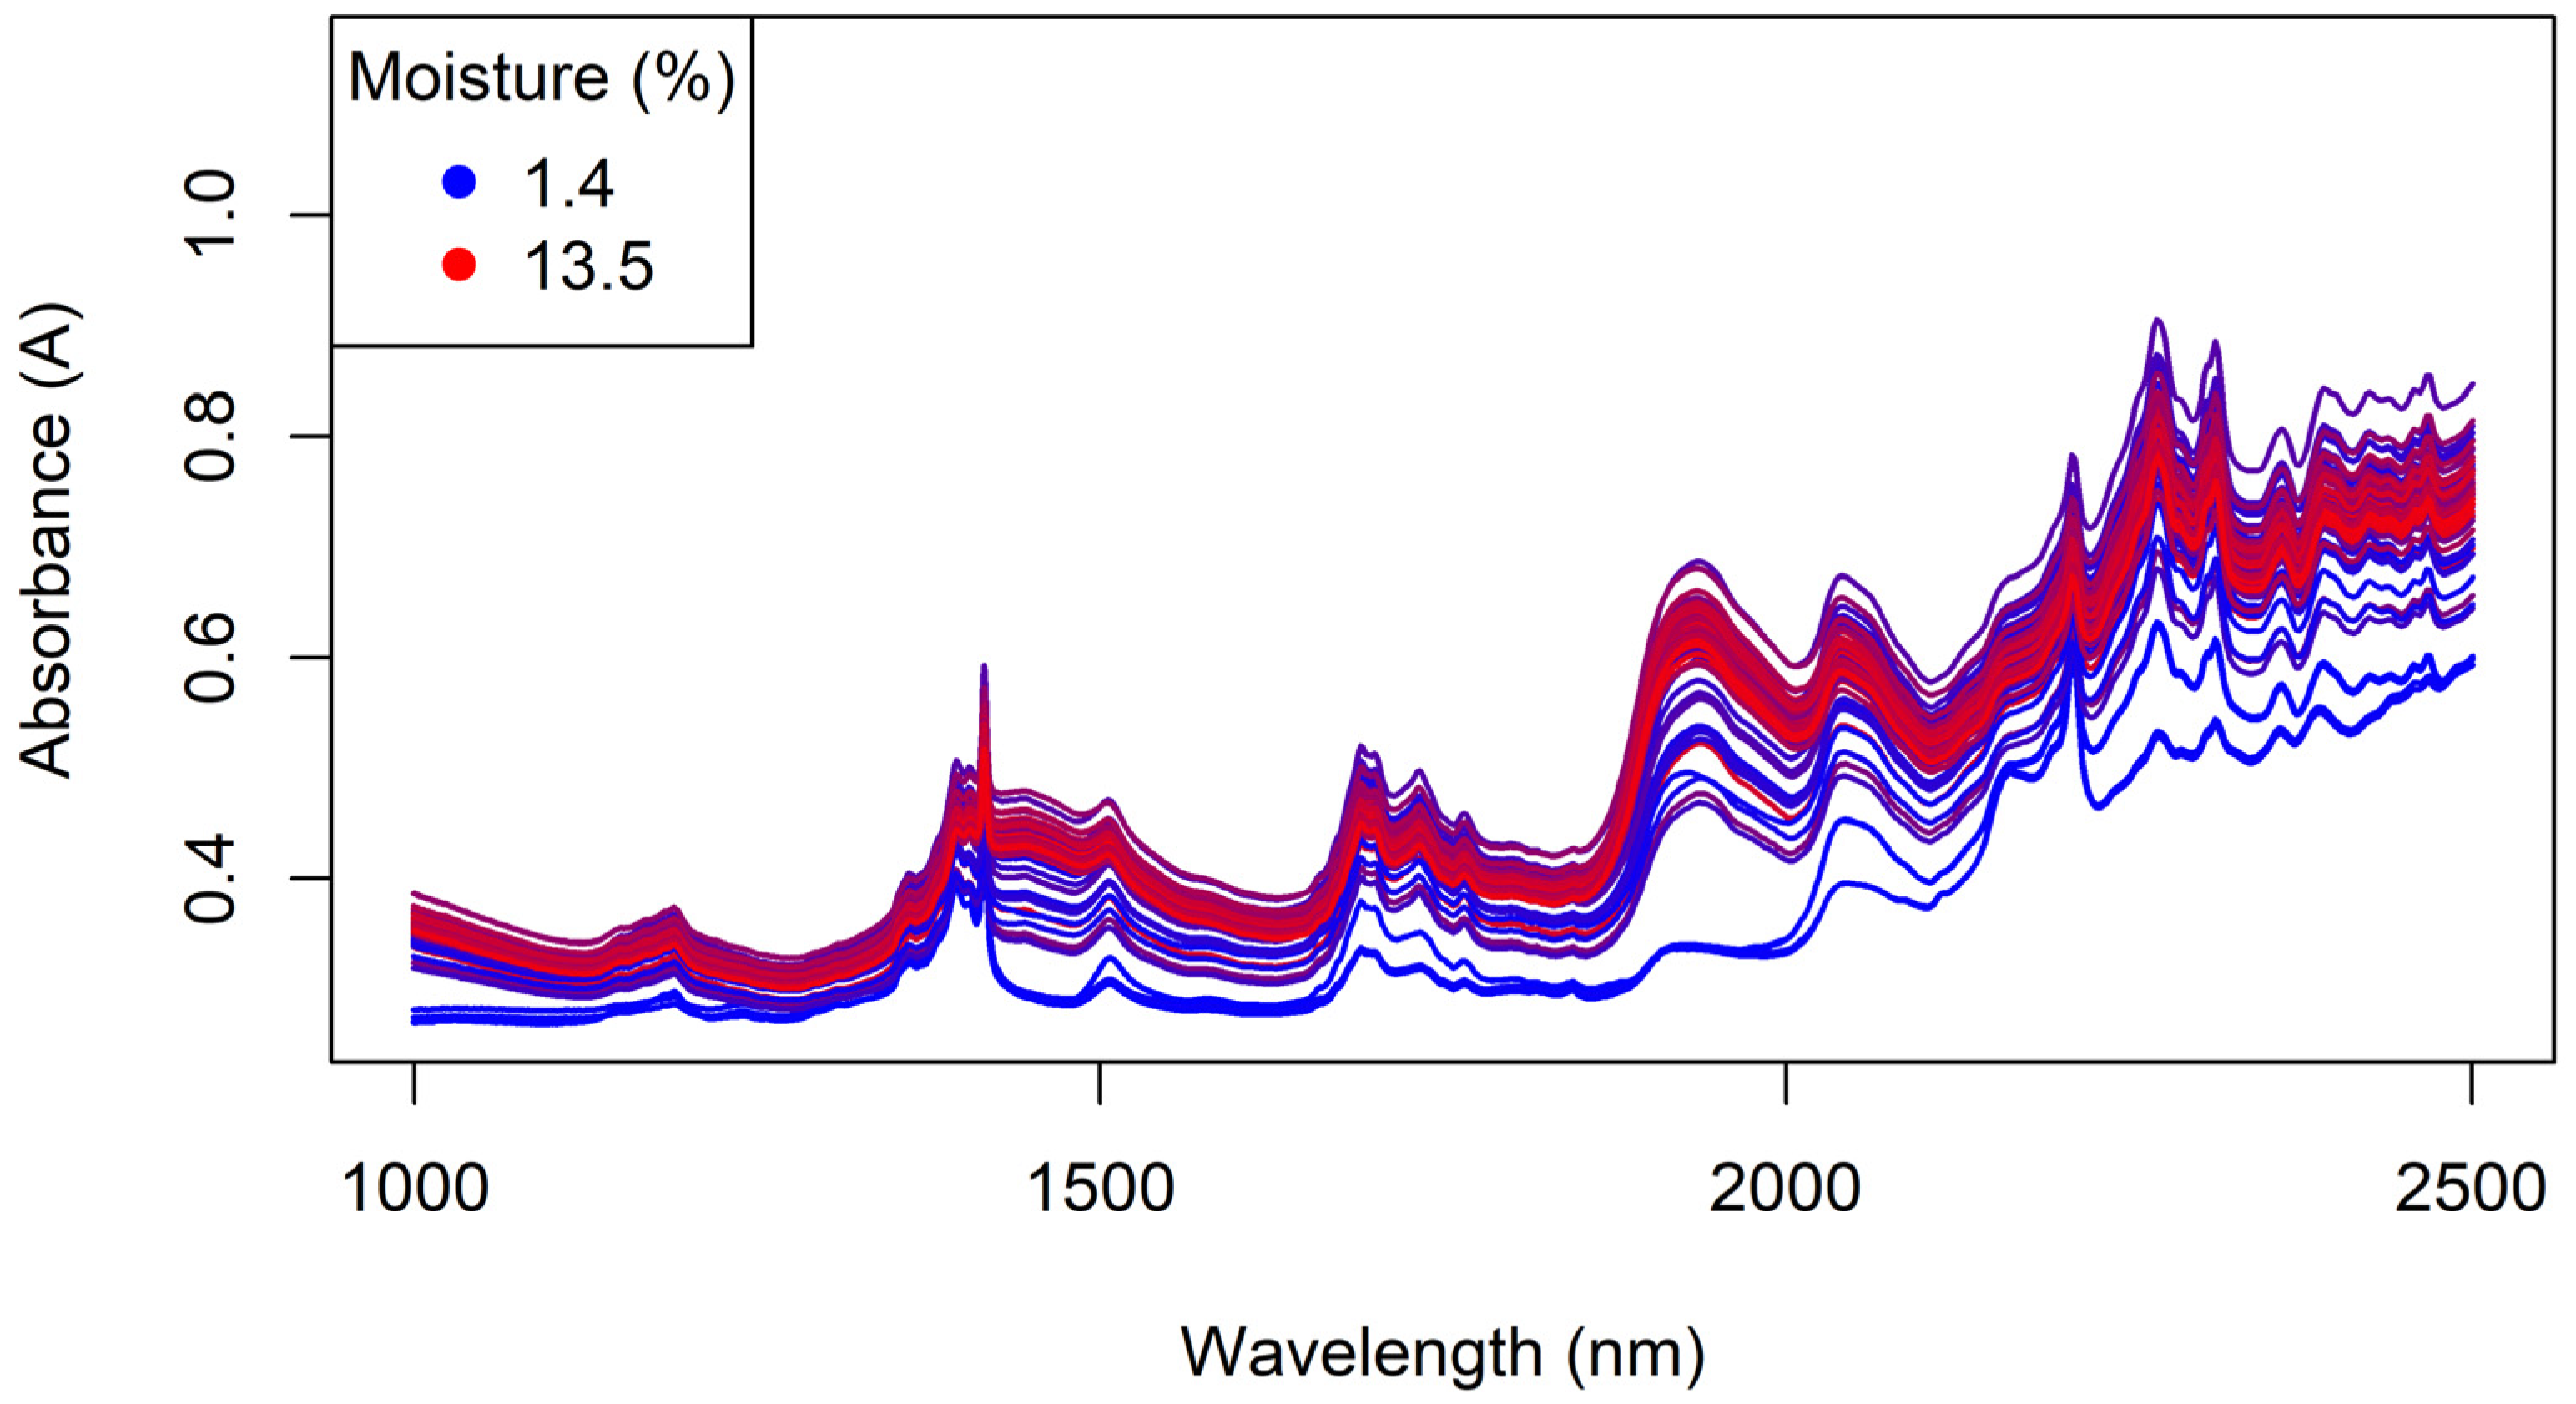
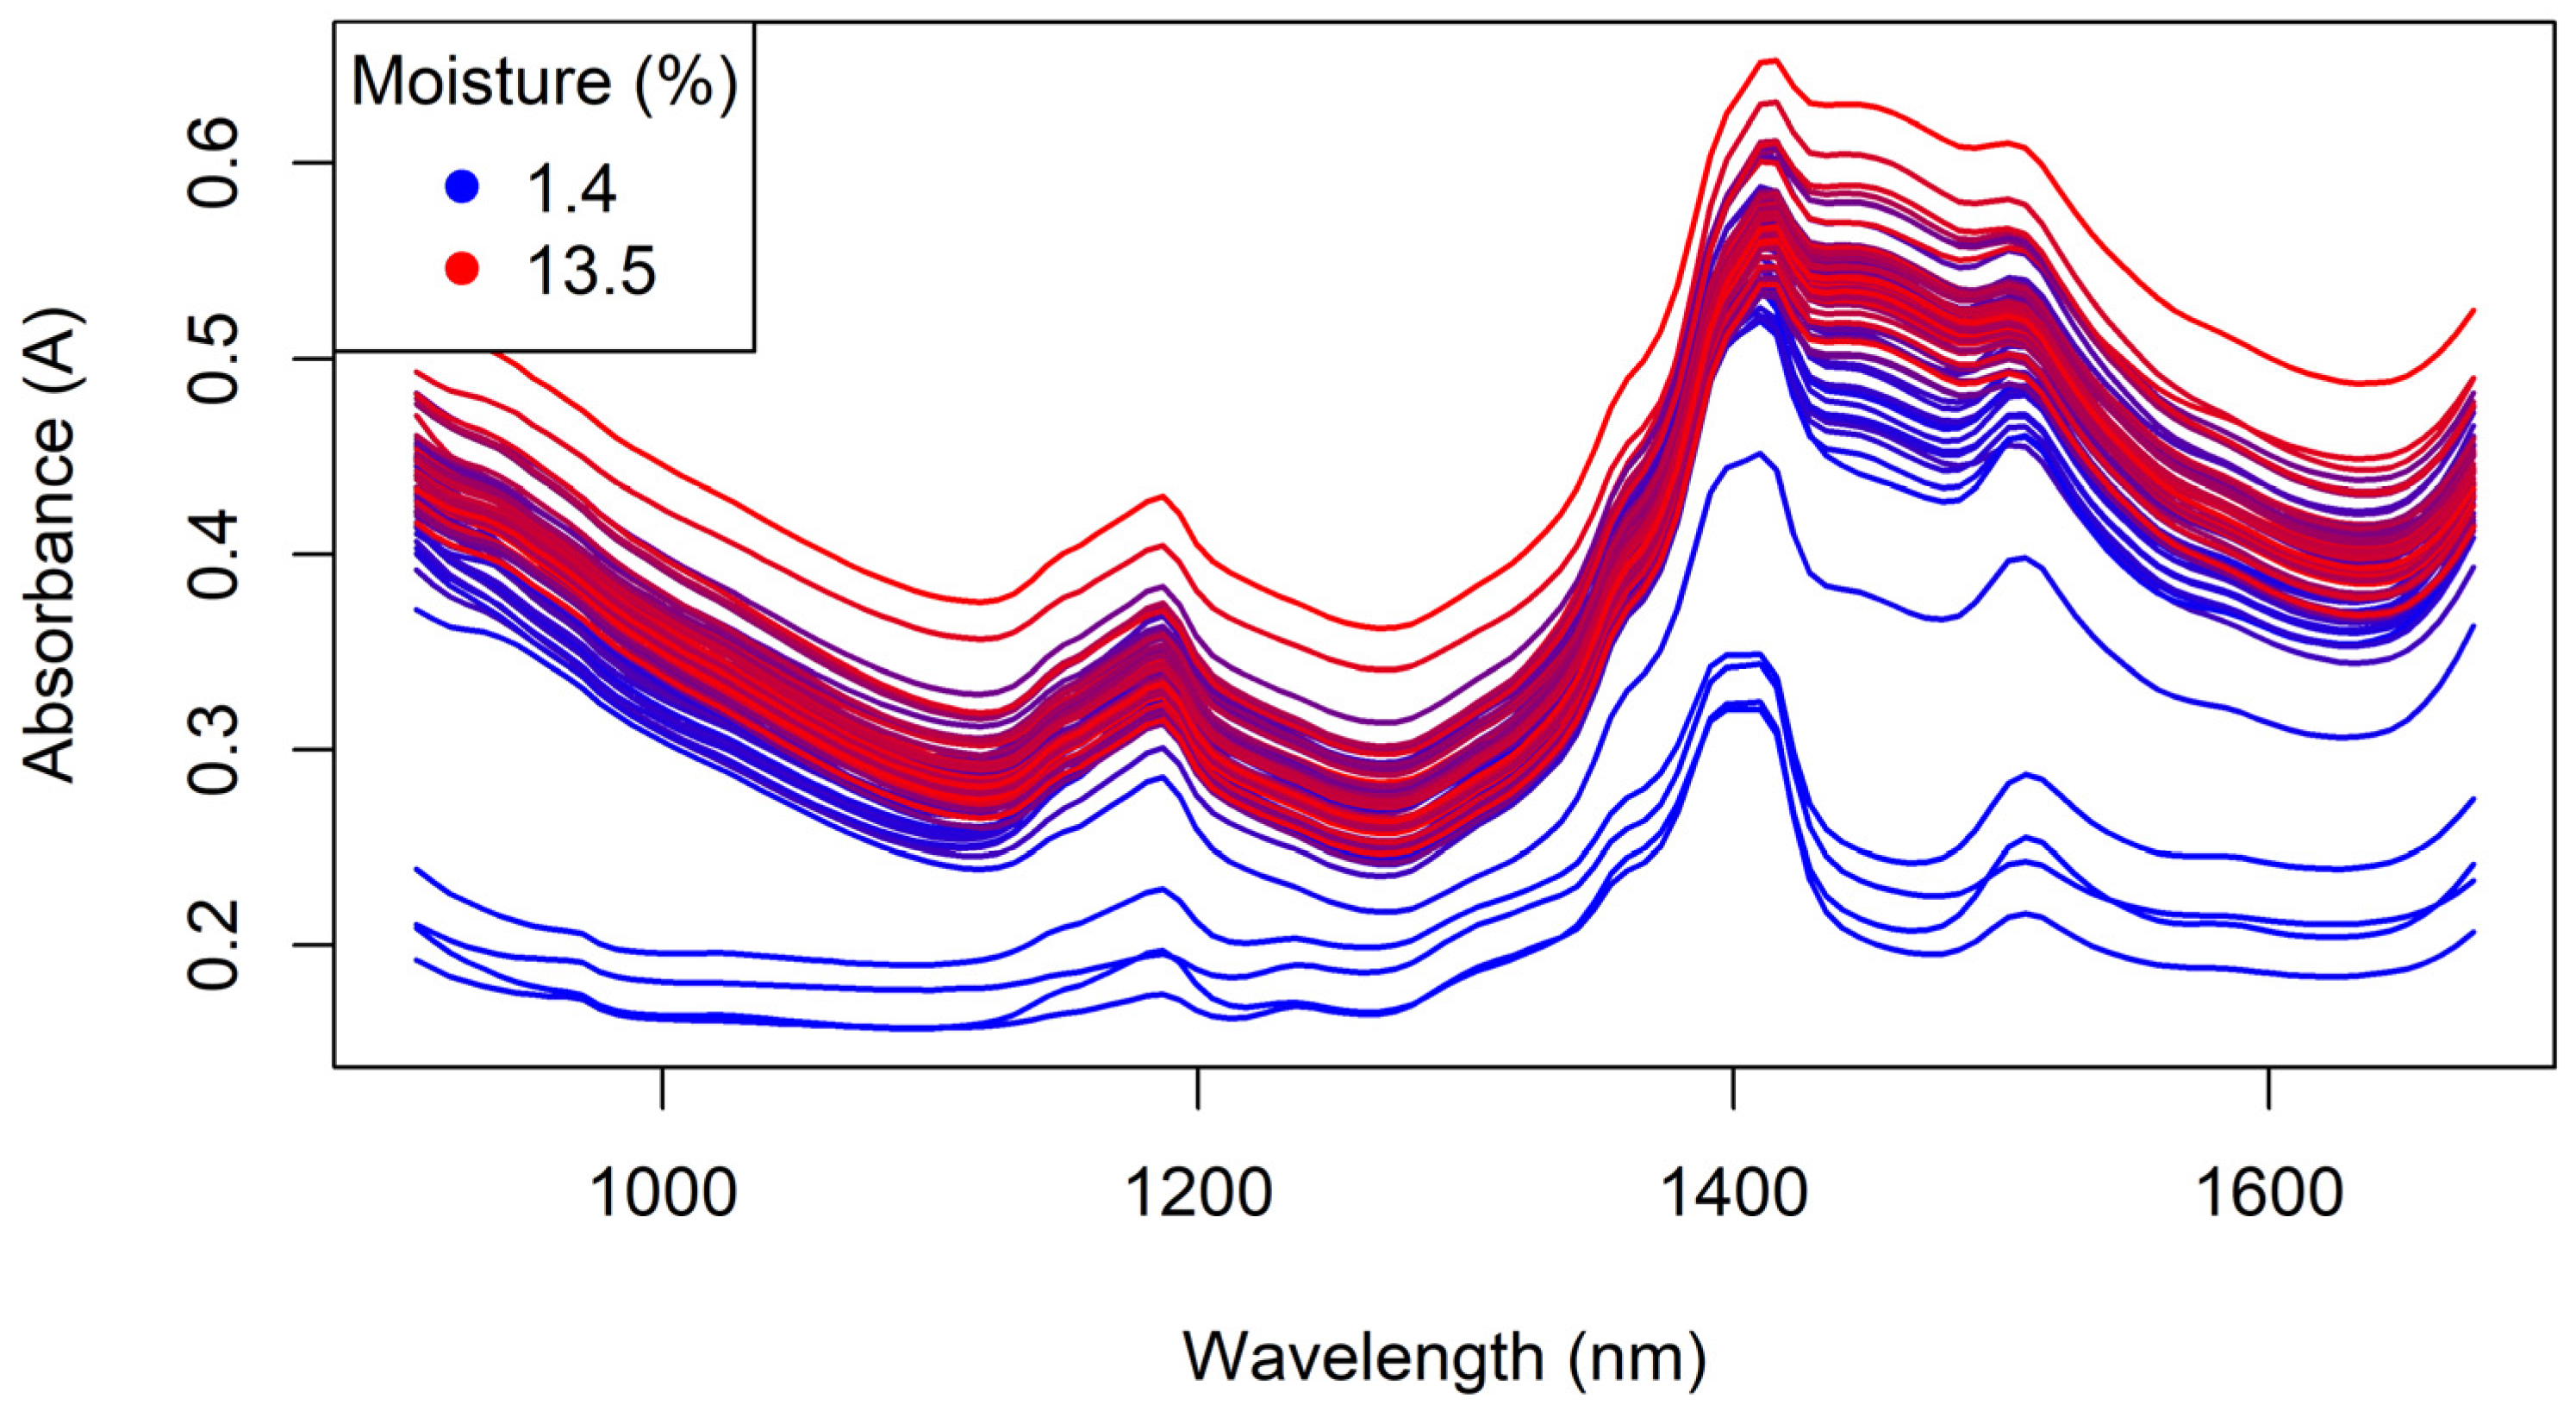
Figure 11.
The benchtop NIR spectra of the Regain granules, coloured by moisture content.
Figure 11.
The benchtop NIR spectra of the Regain granules, coloured by moisture content.
Figure 12.
The NIR spectra of a sample of pure tebuthiuron powder (99.6% assay), measured using the benchtop Antaris instrument.
Figure 12.
The NIR spectra of a sample of pure tebuthiuron powder (99.6% assay), measured using the benchtop Antaris instrument.
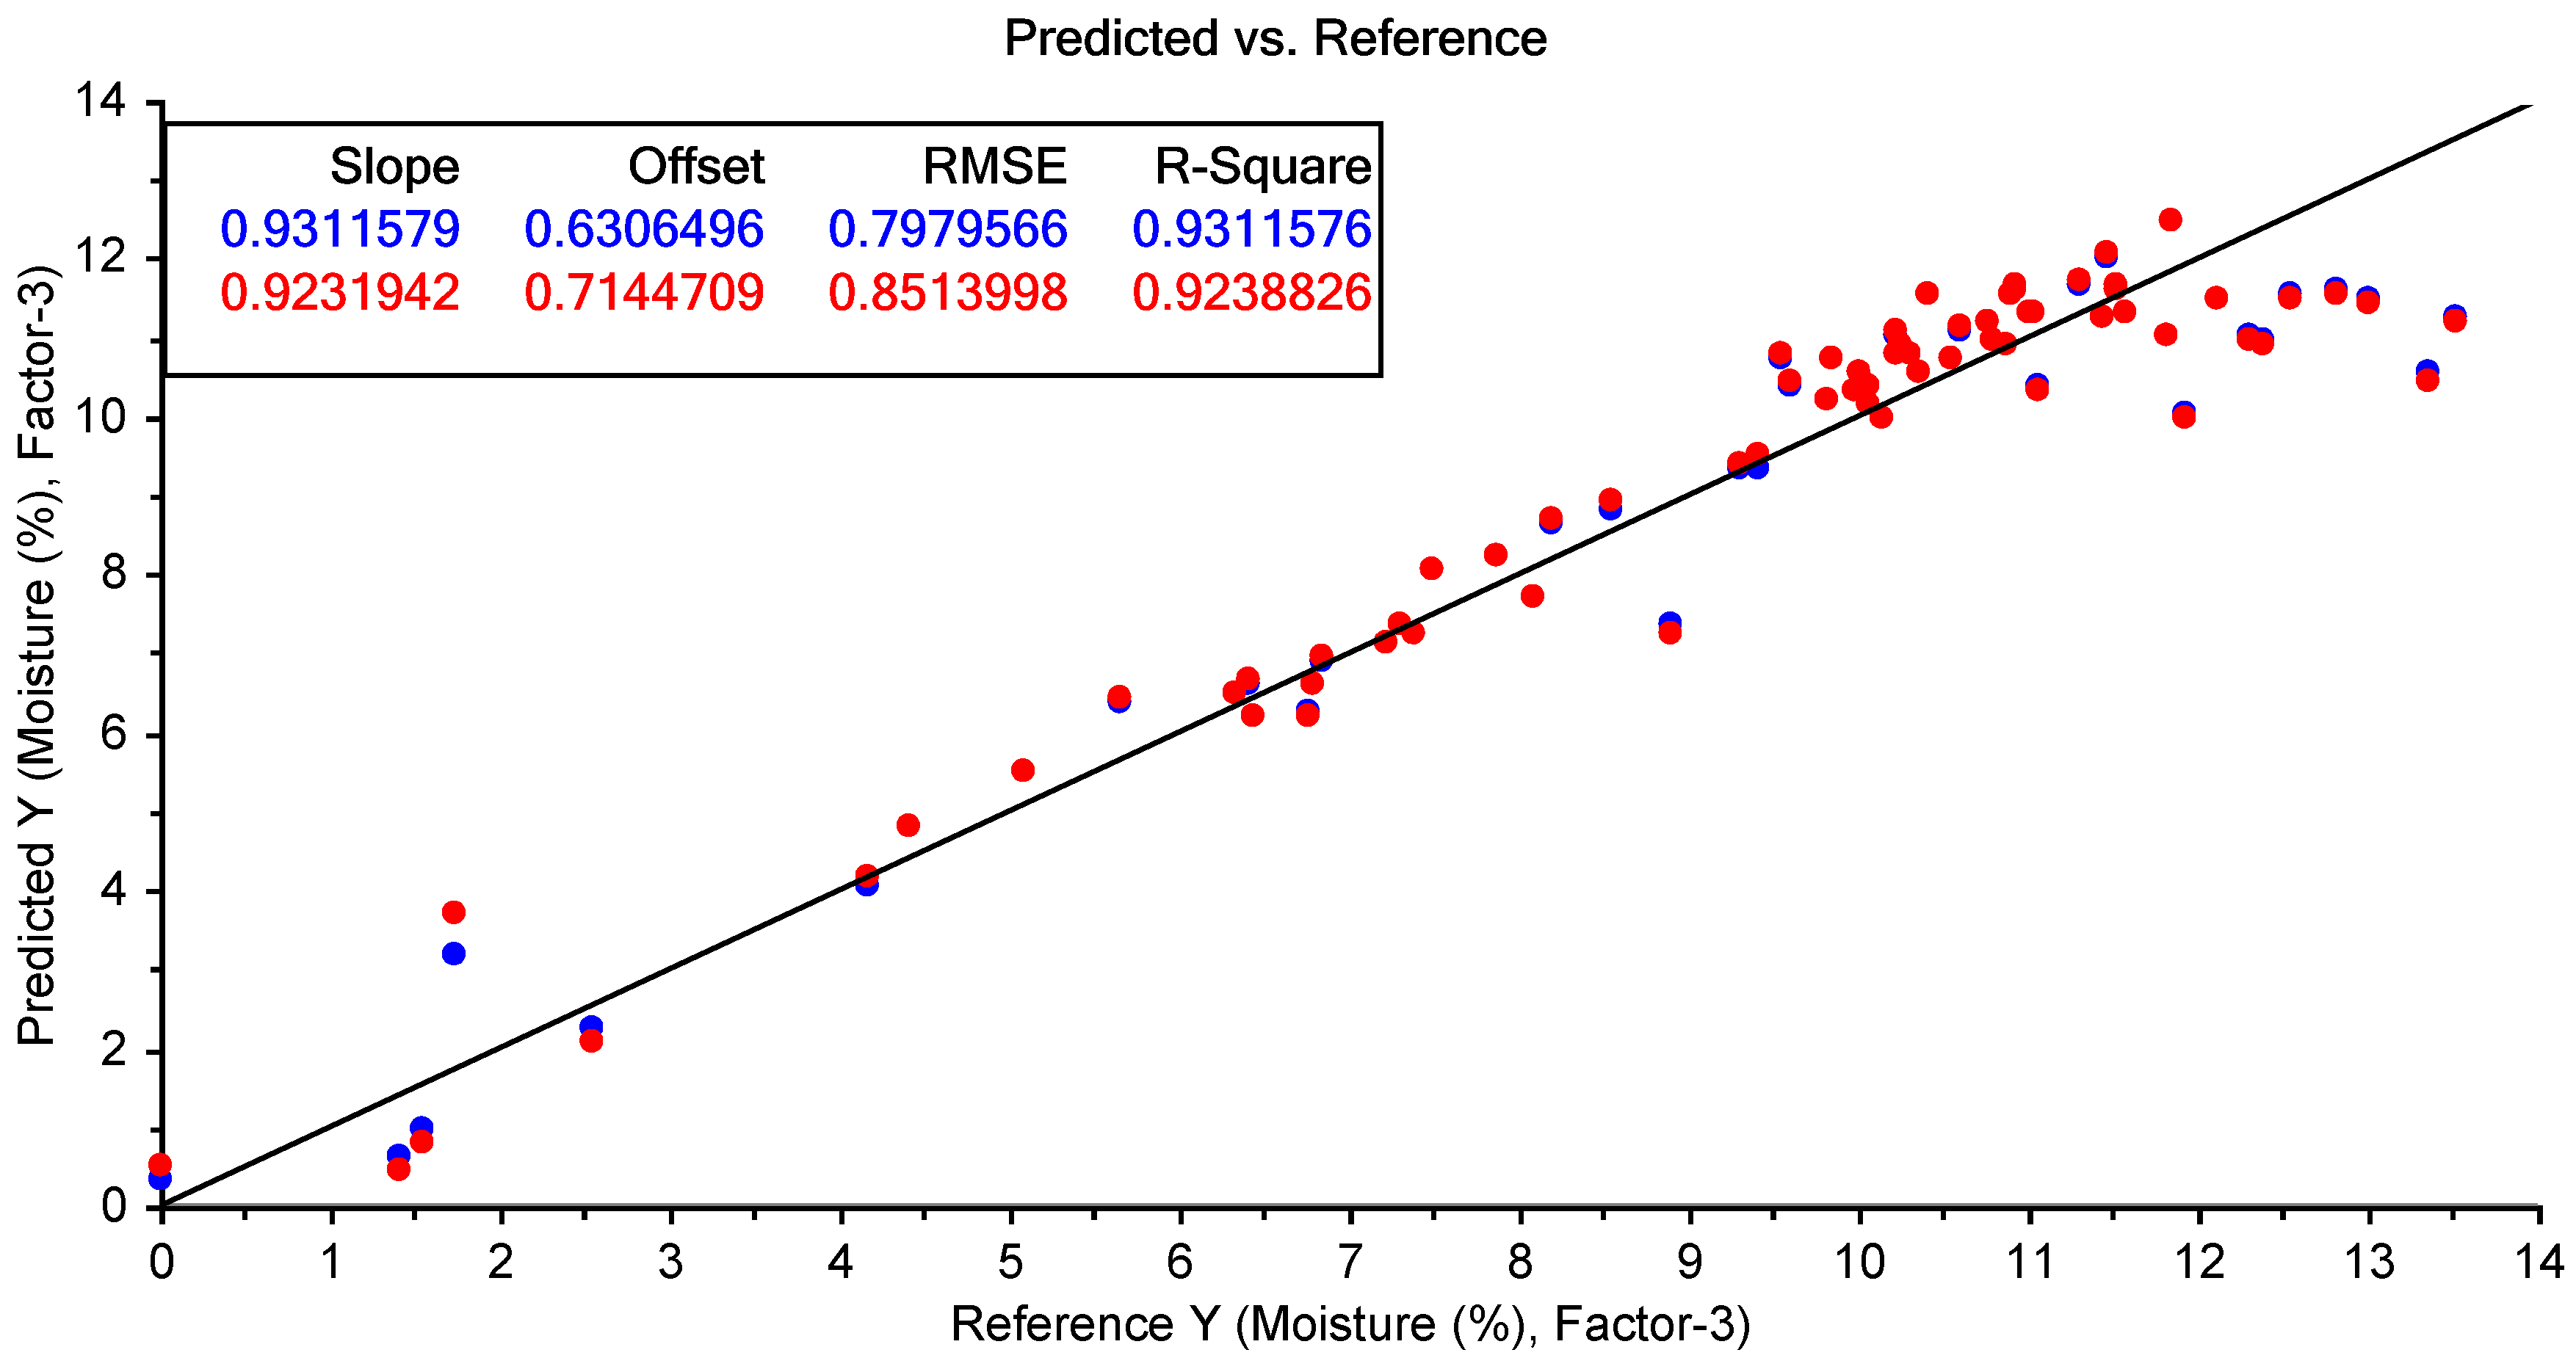
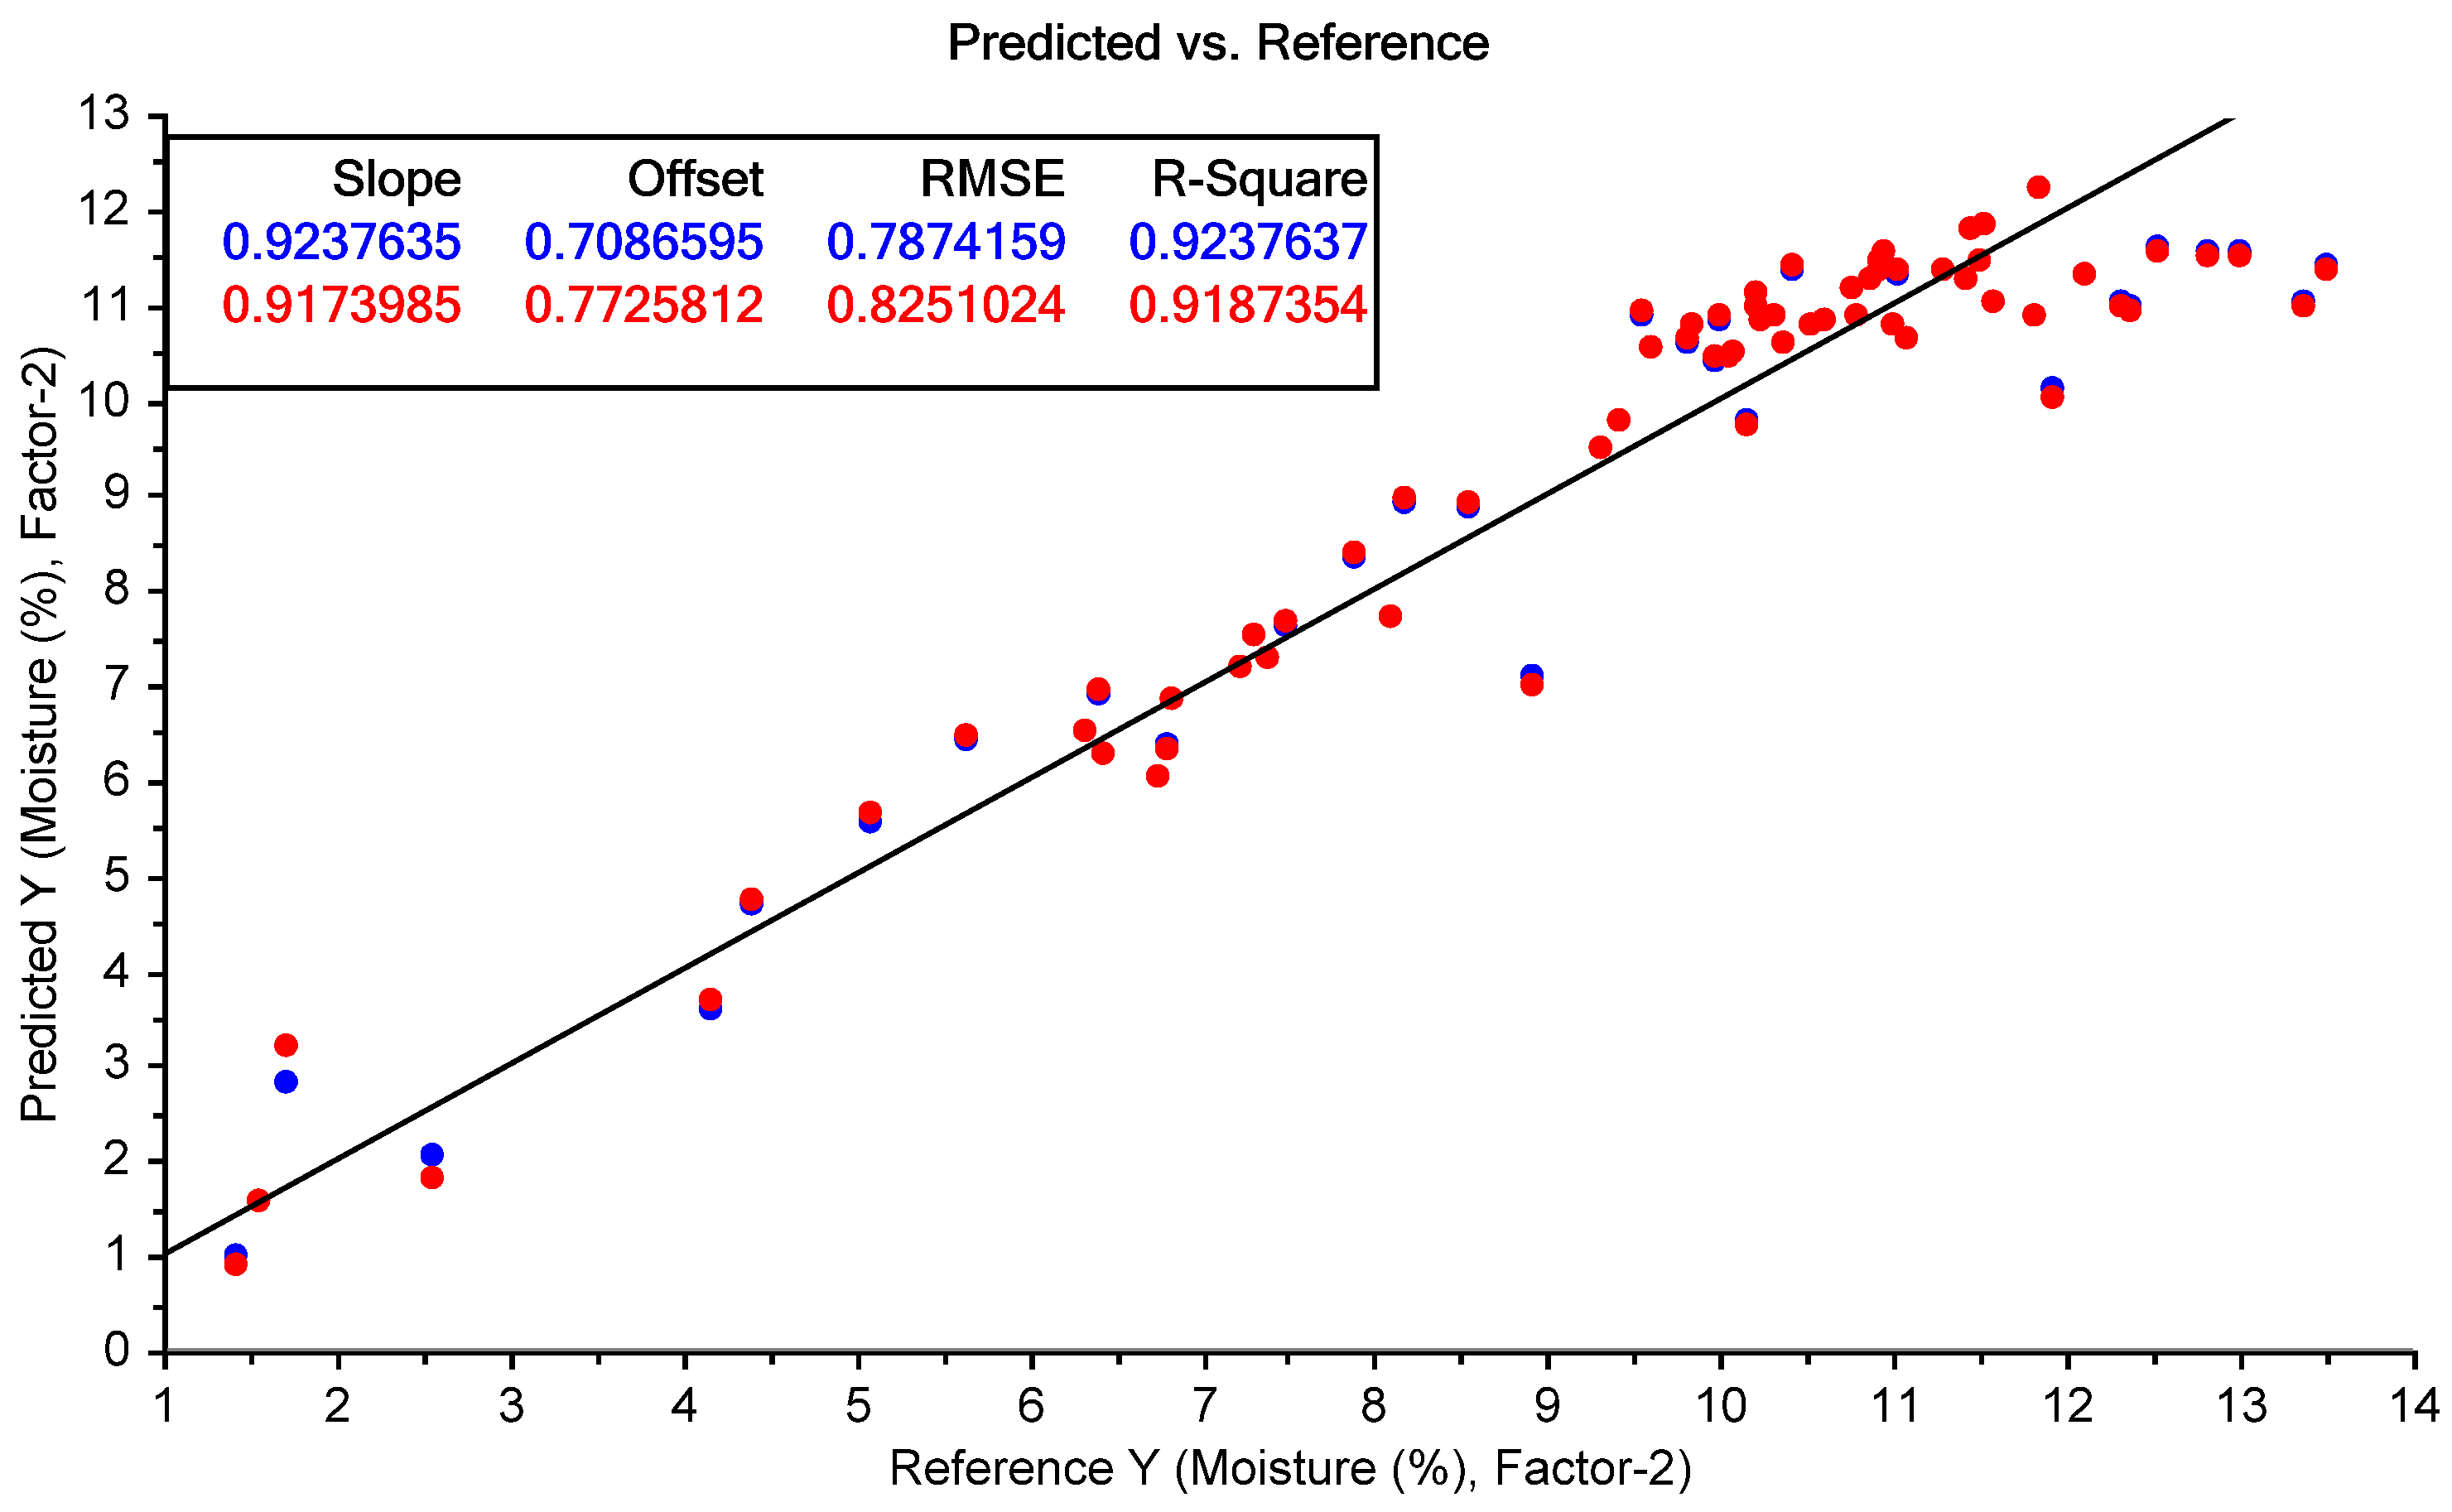
Figure 13.
The results of the best-performing PLSR model for the prediction of moisture content using the benchtop NIR spectra collected from the Regain granules (using no pre-processing). The blue points show the model calibration, while the red points show the model cross-validation.
Figure 13.
The results of the best-performing PLSR model for the prediction of moisture content using the benchtop NIR spectra collected from the Regain granules (using no pre-processing). The blue points show the model calibration, while the red points show the model cross-validation.
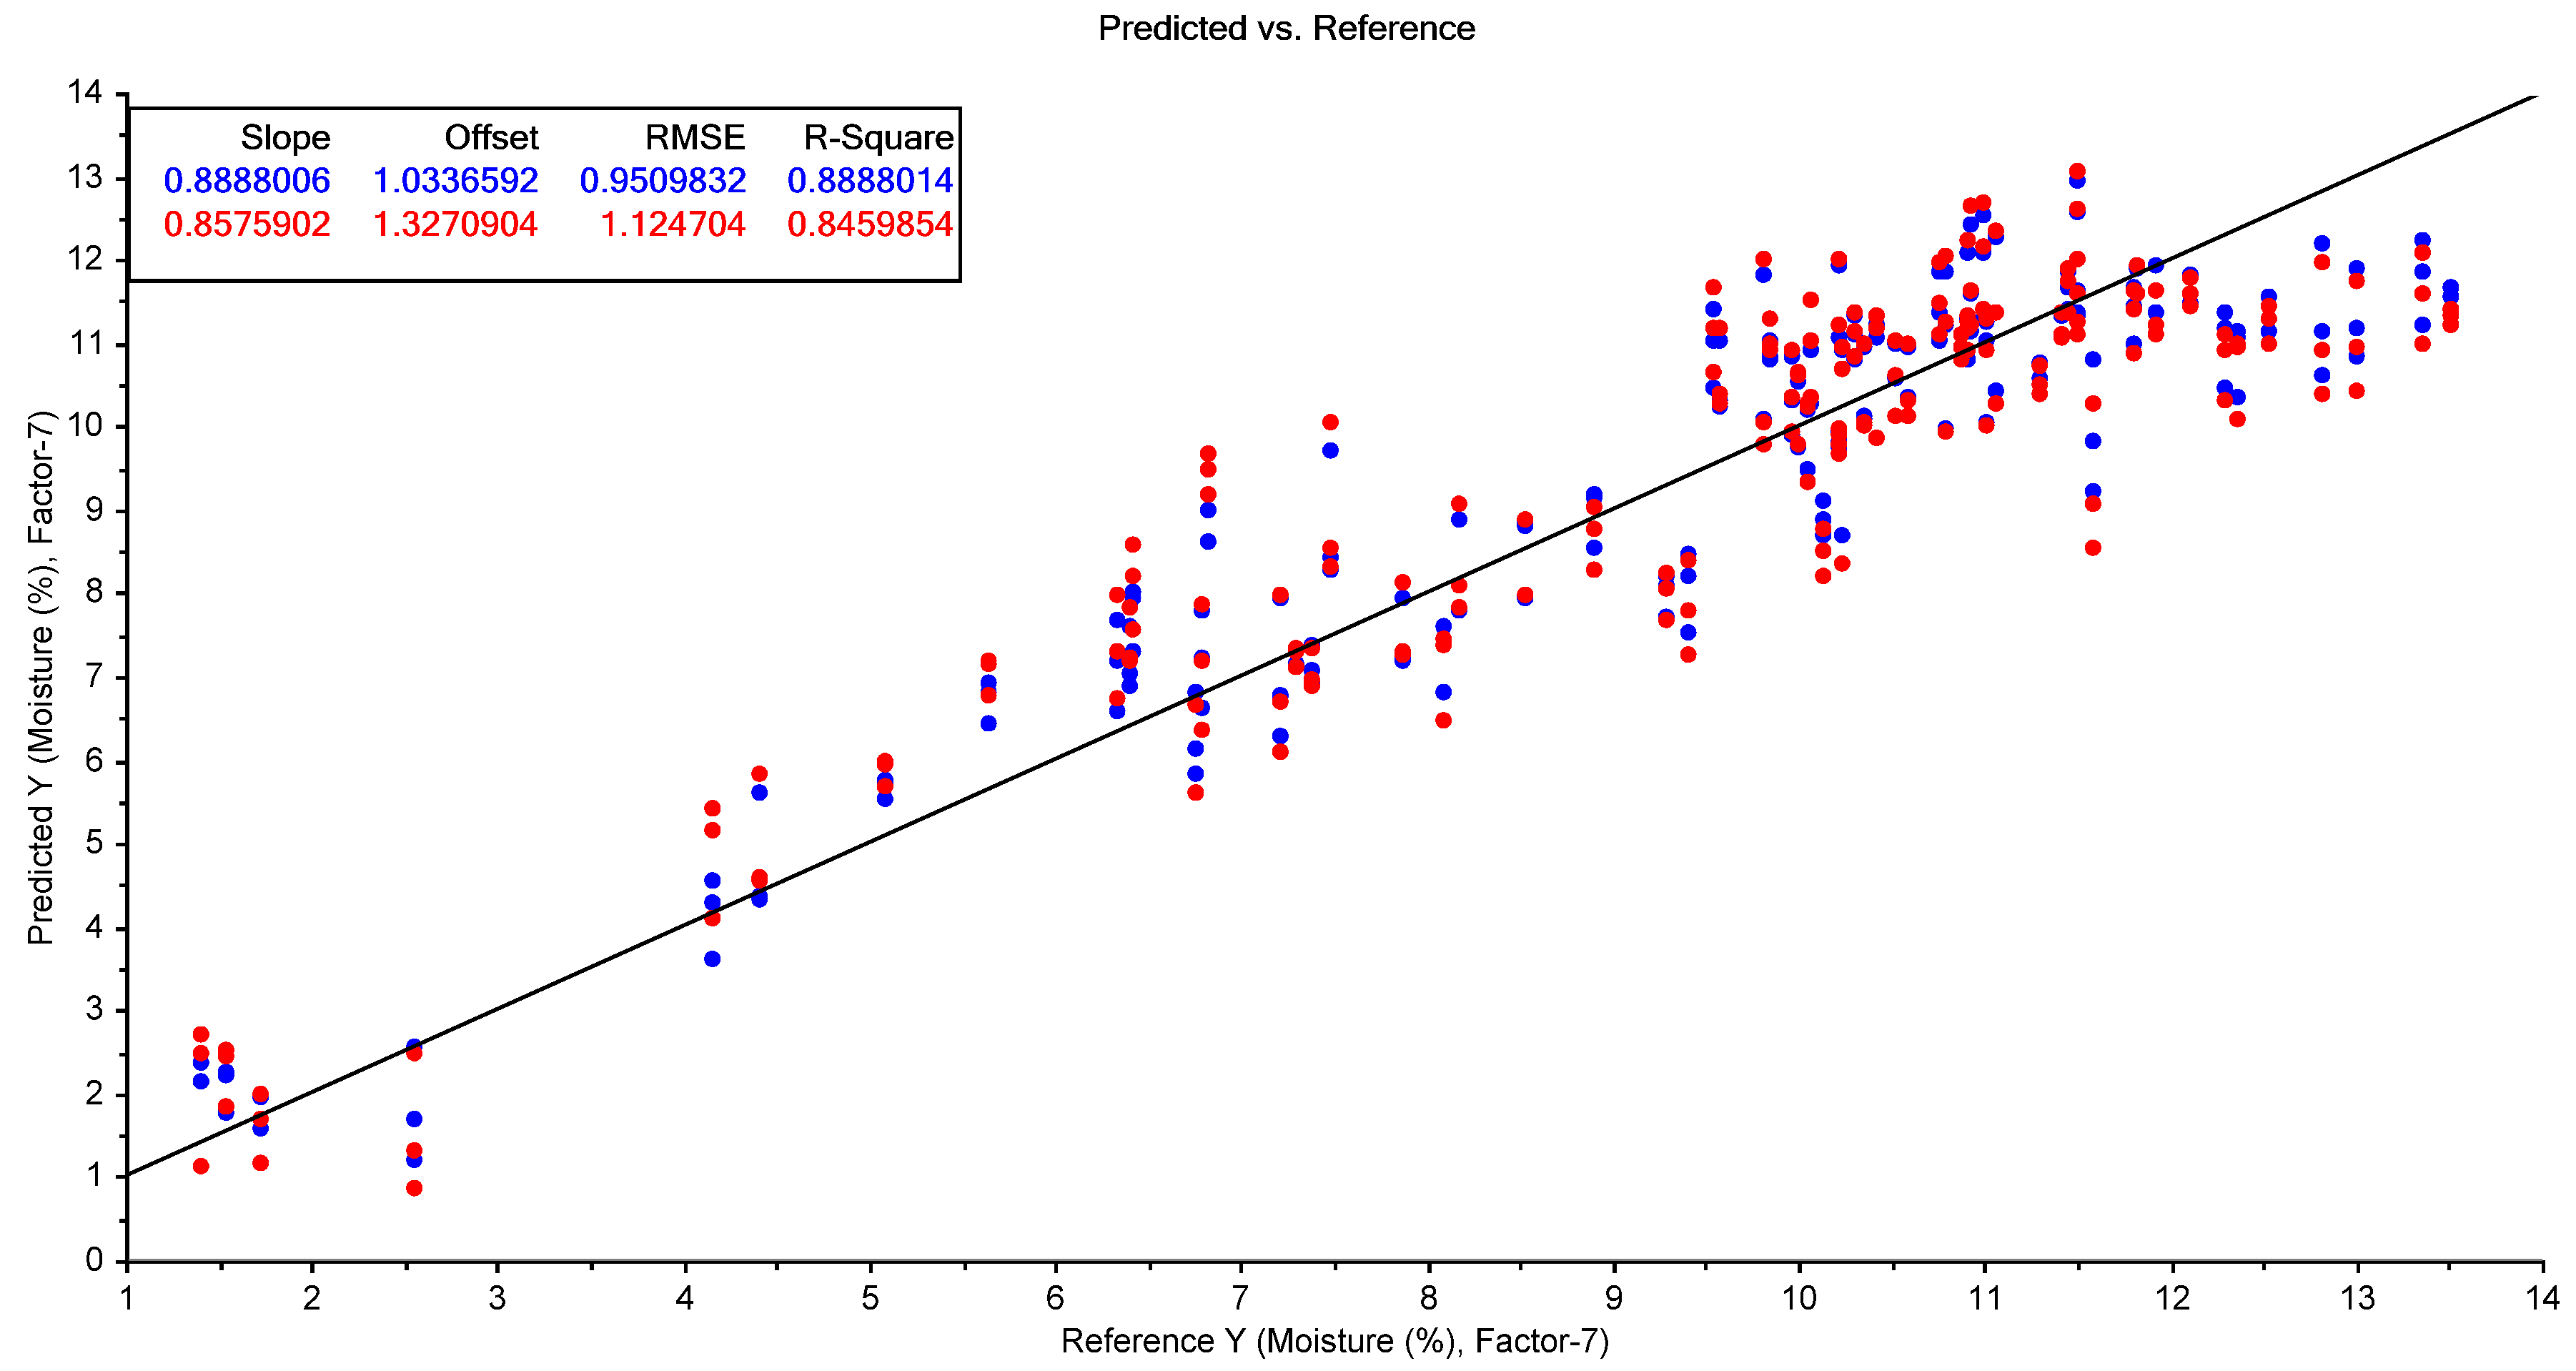
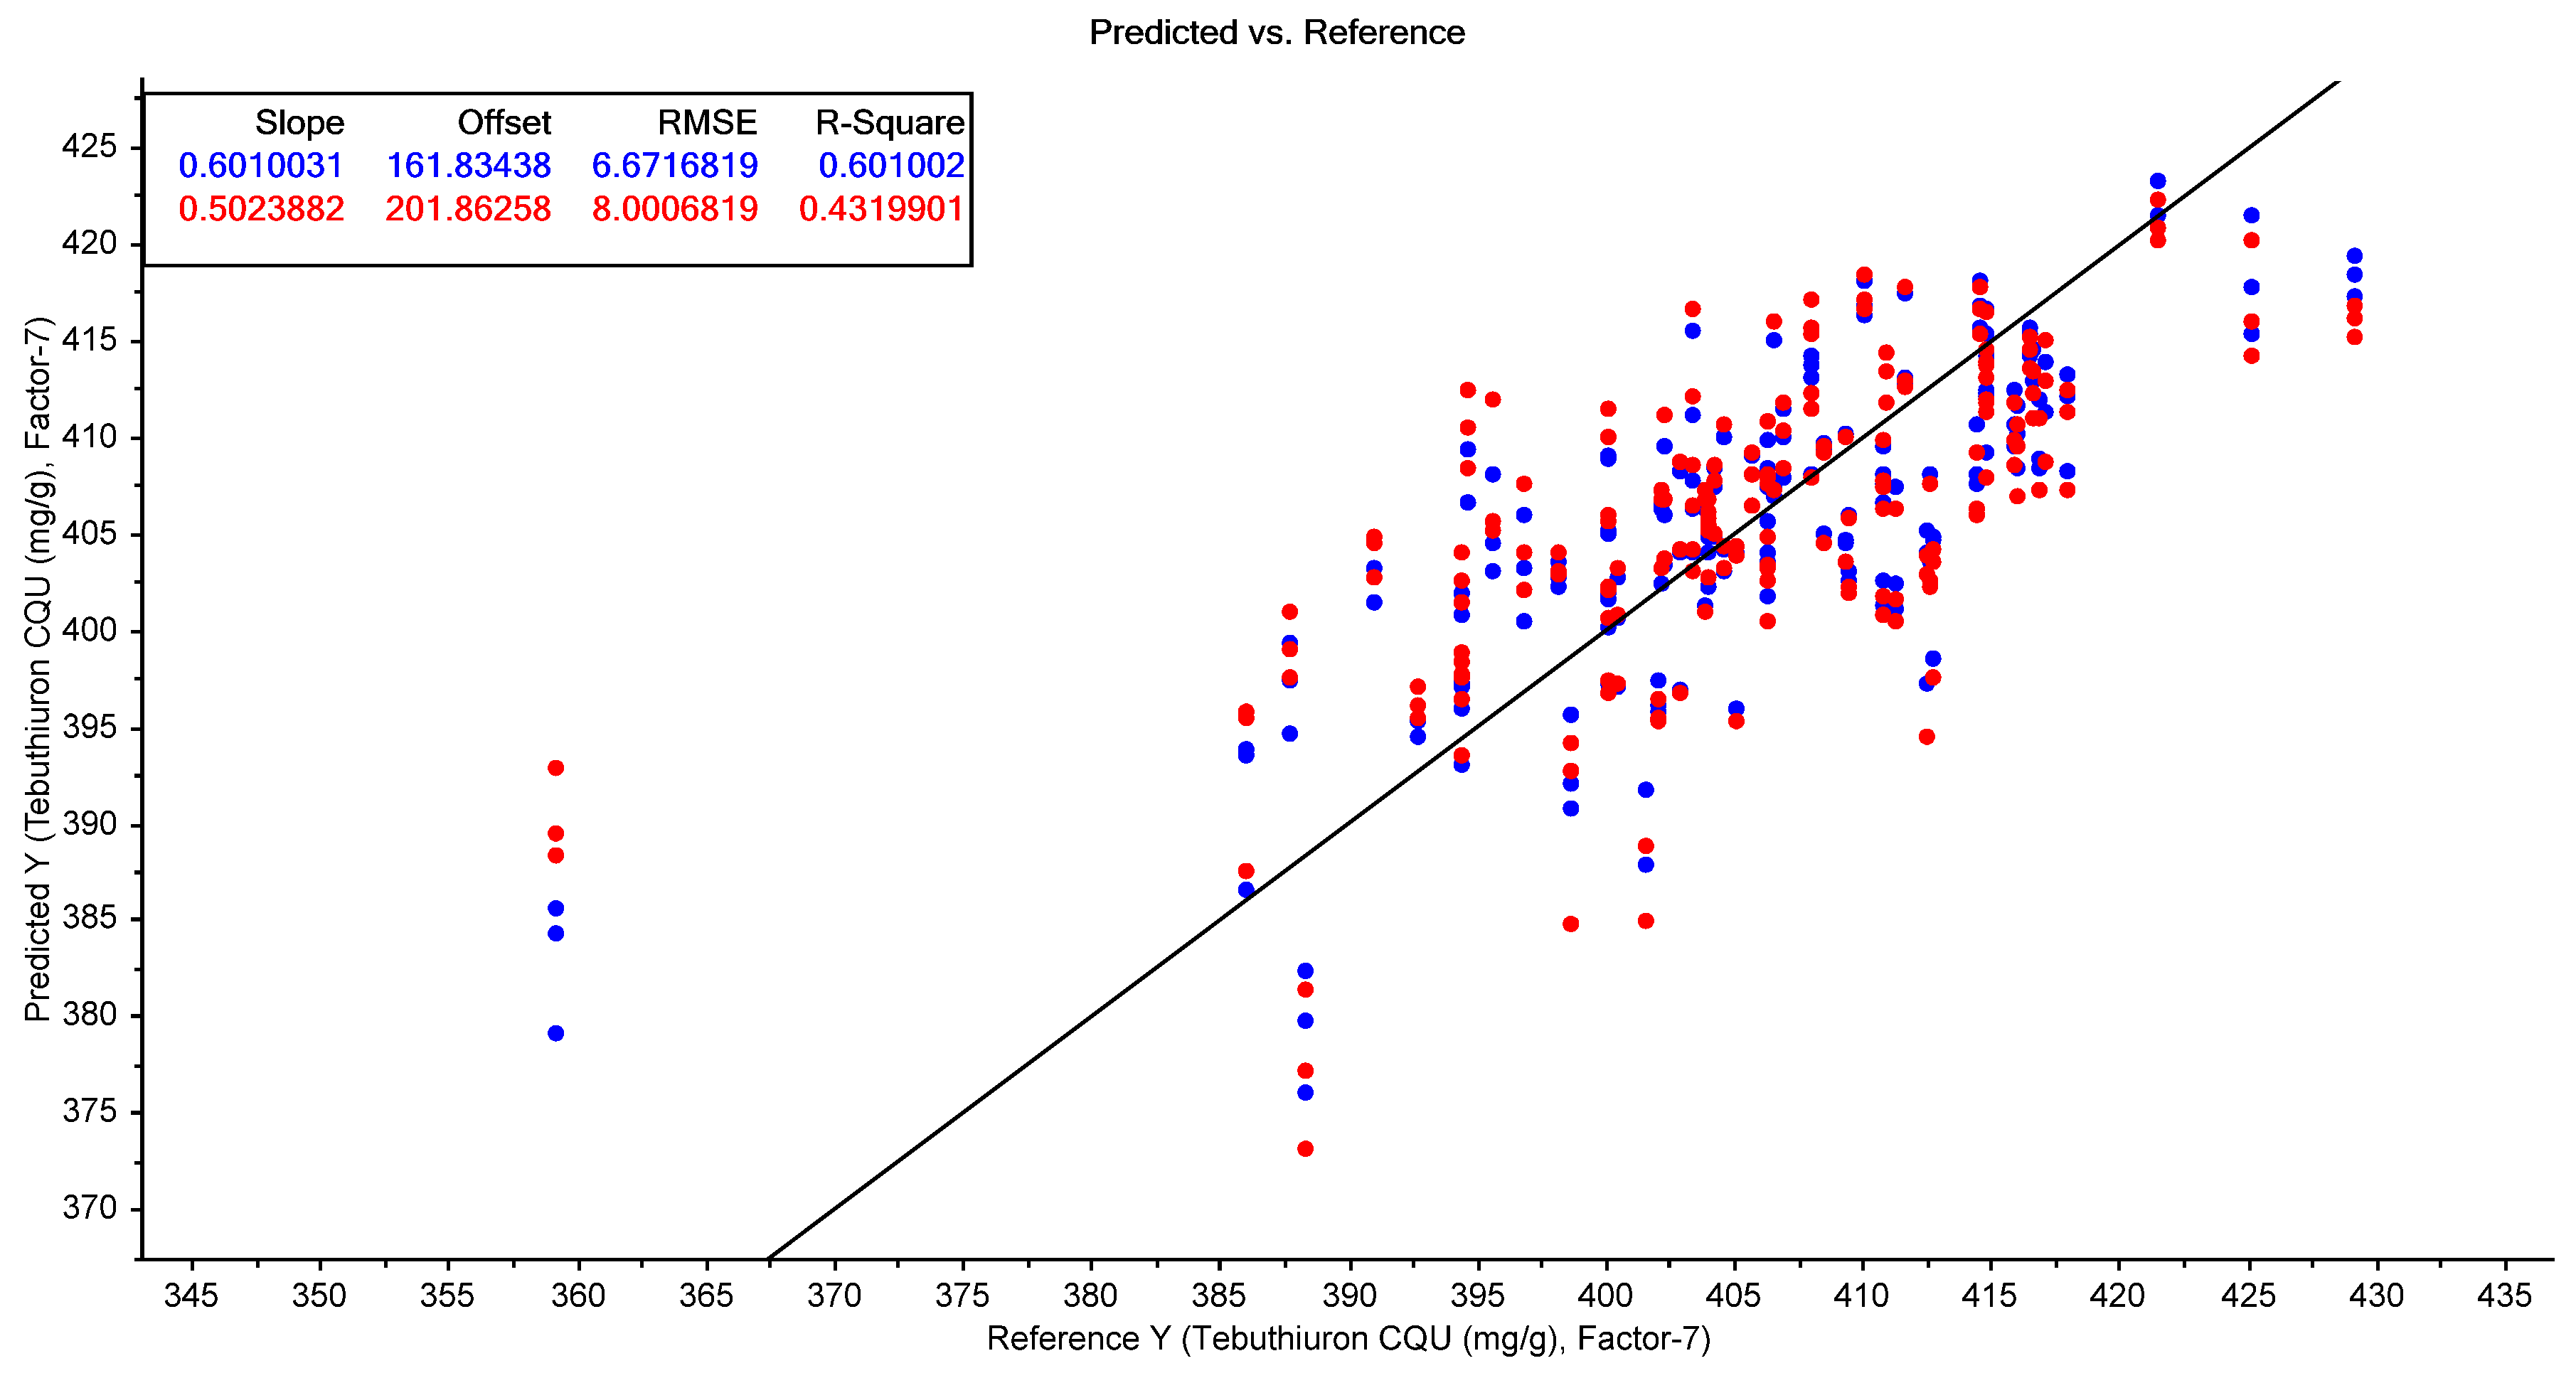
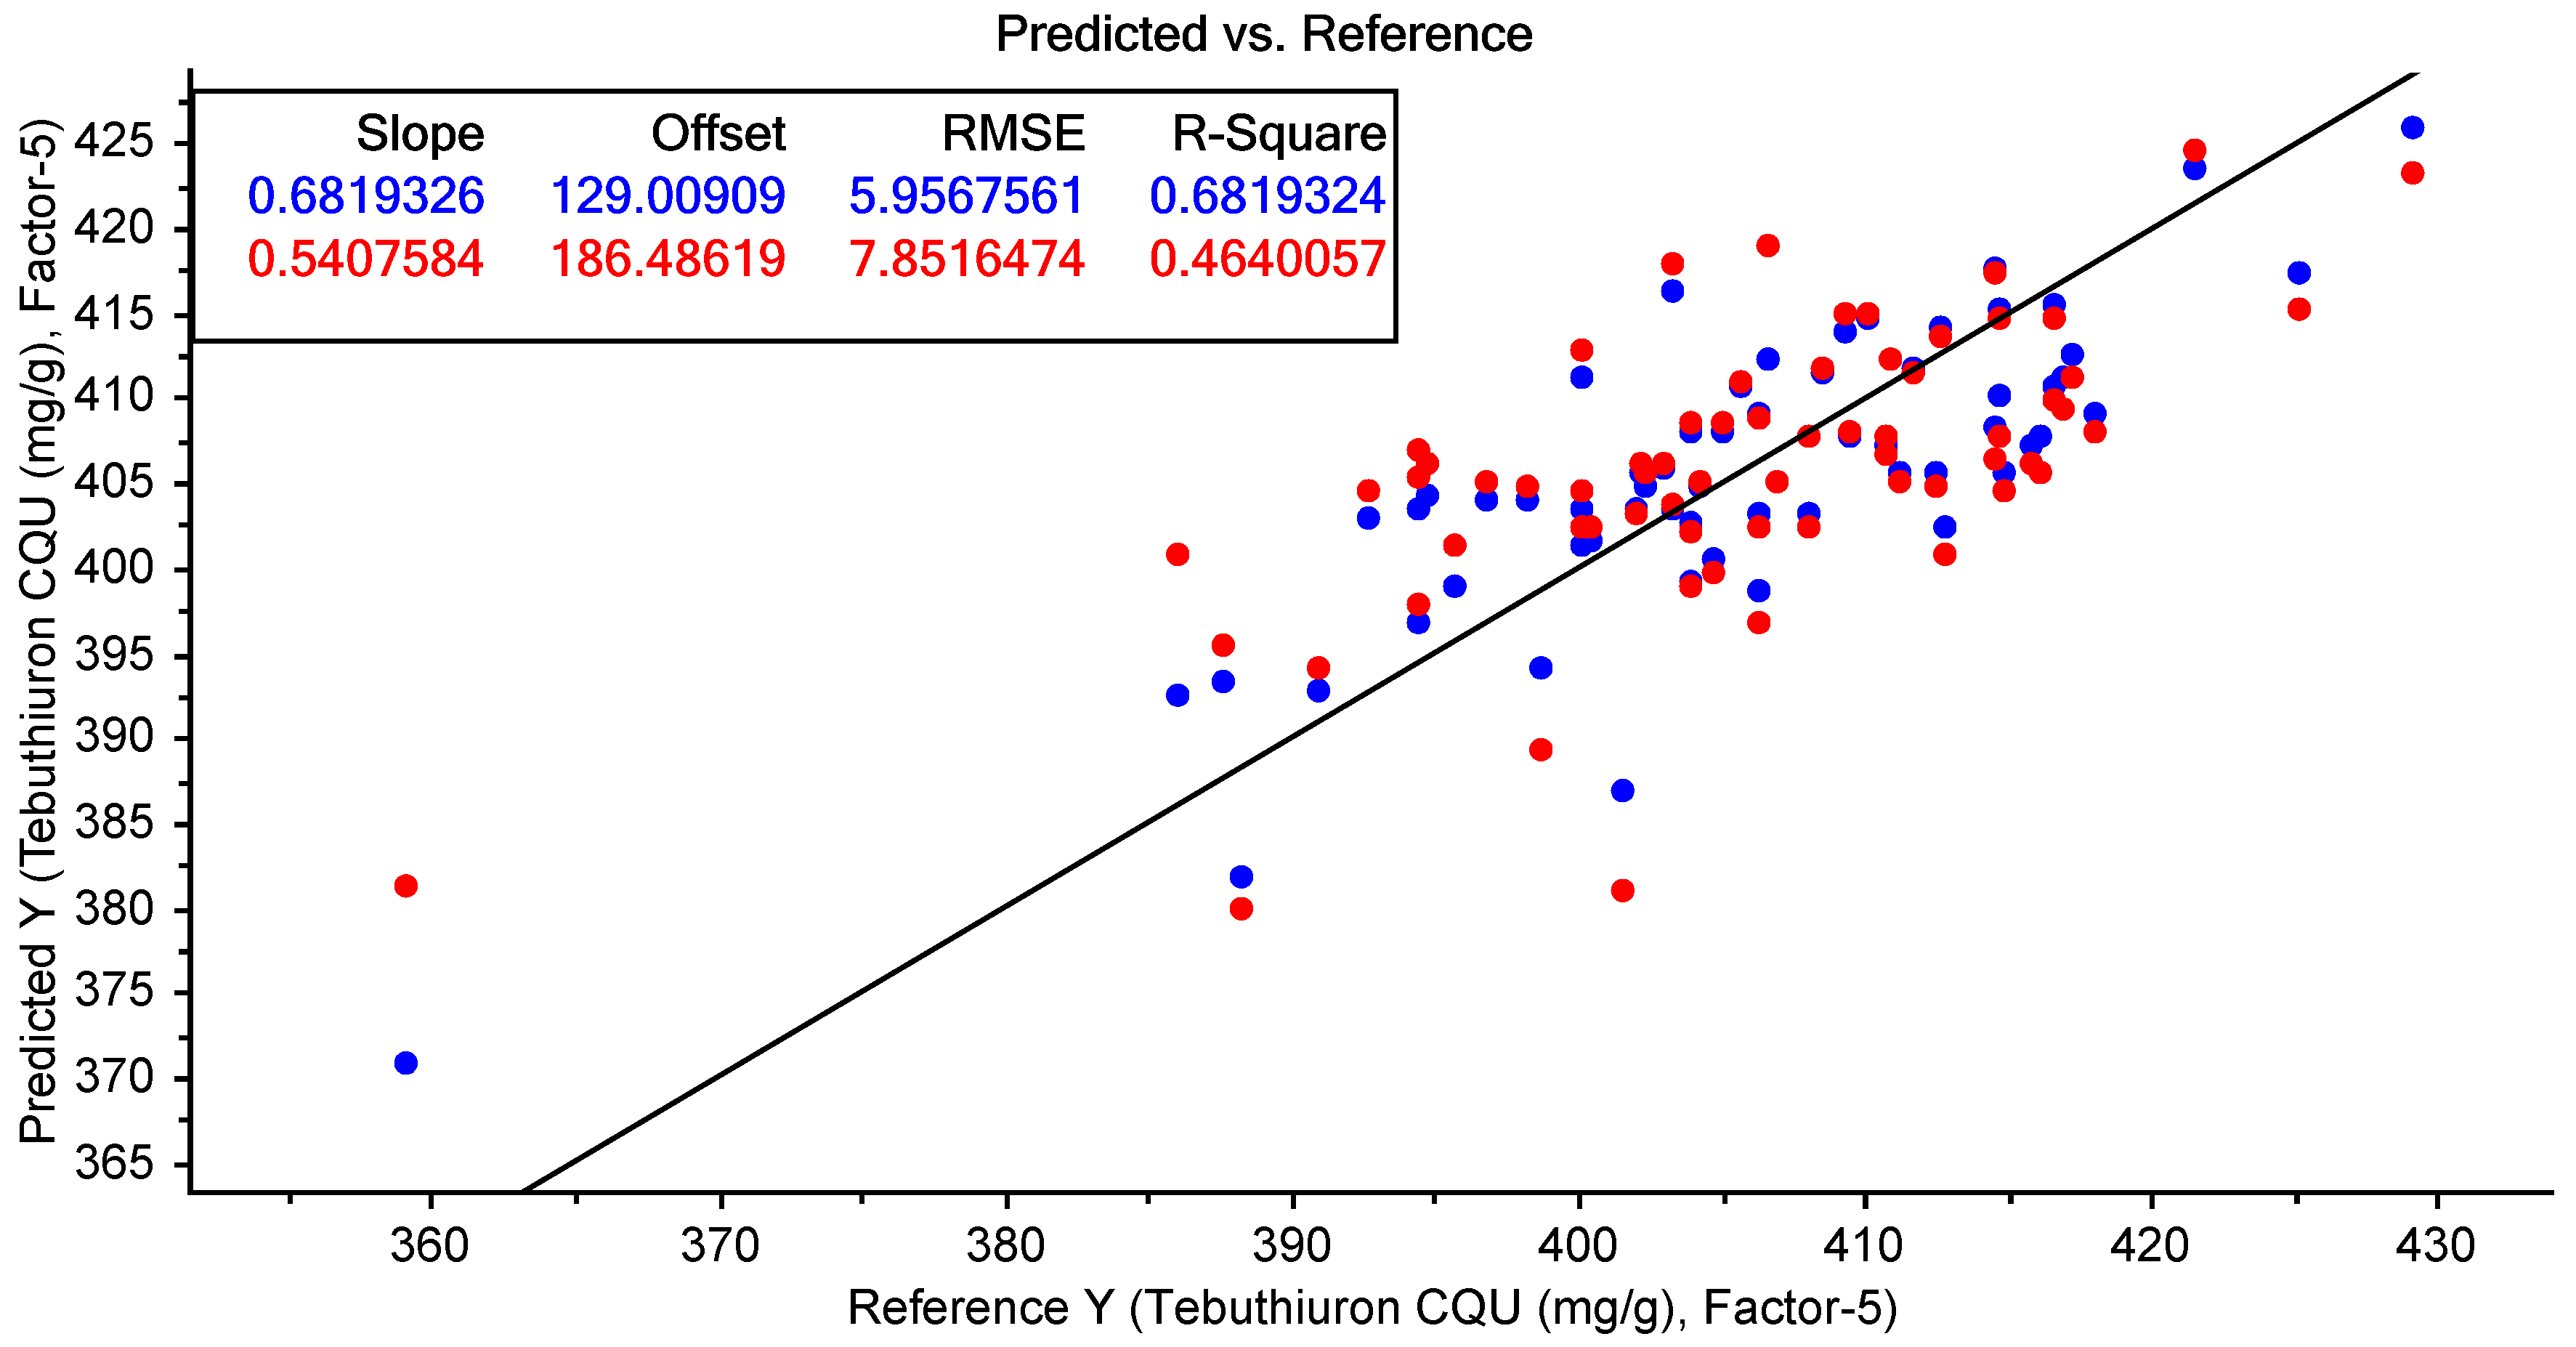
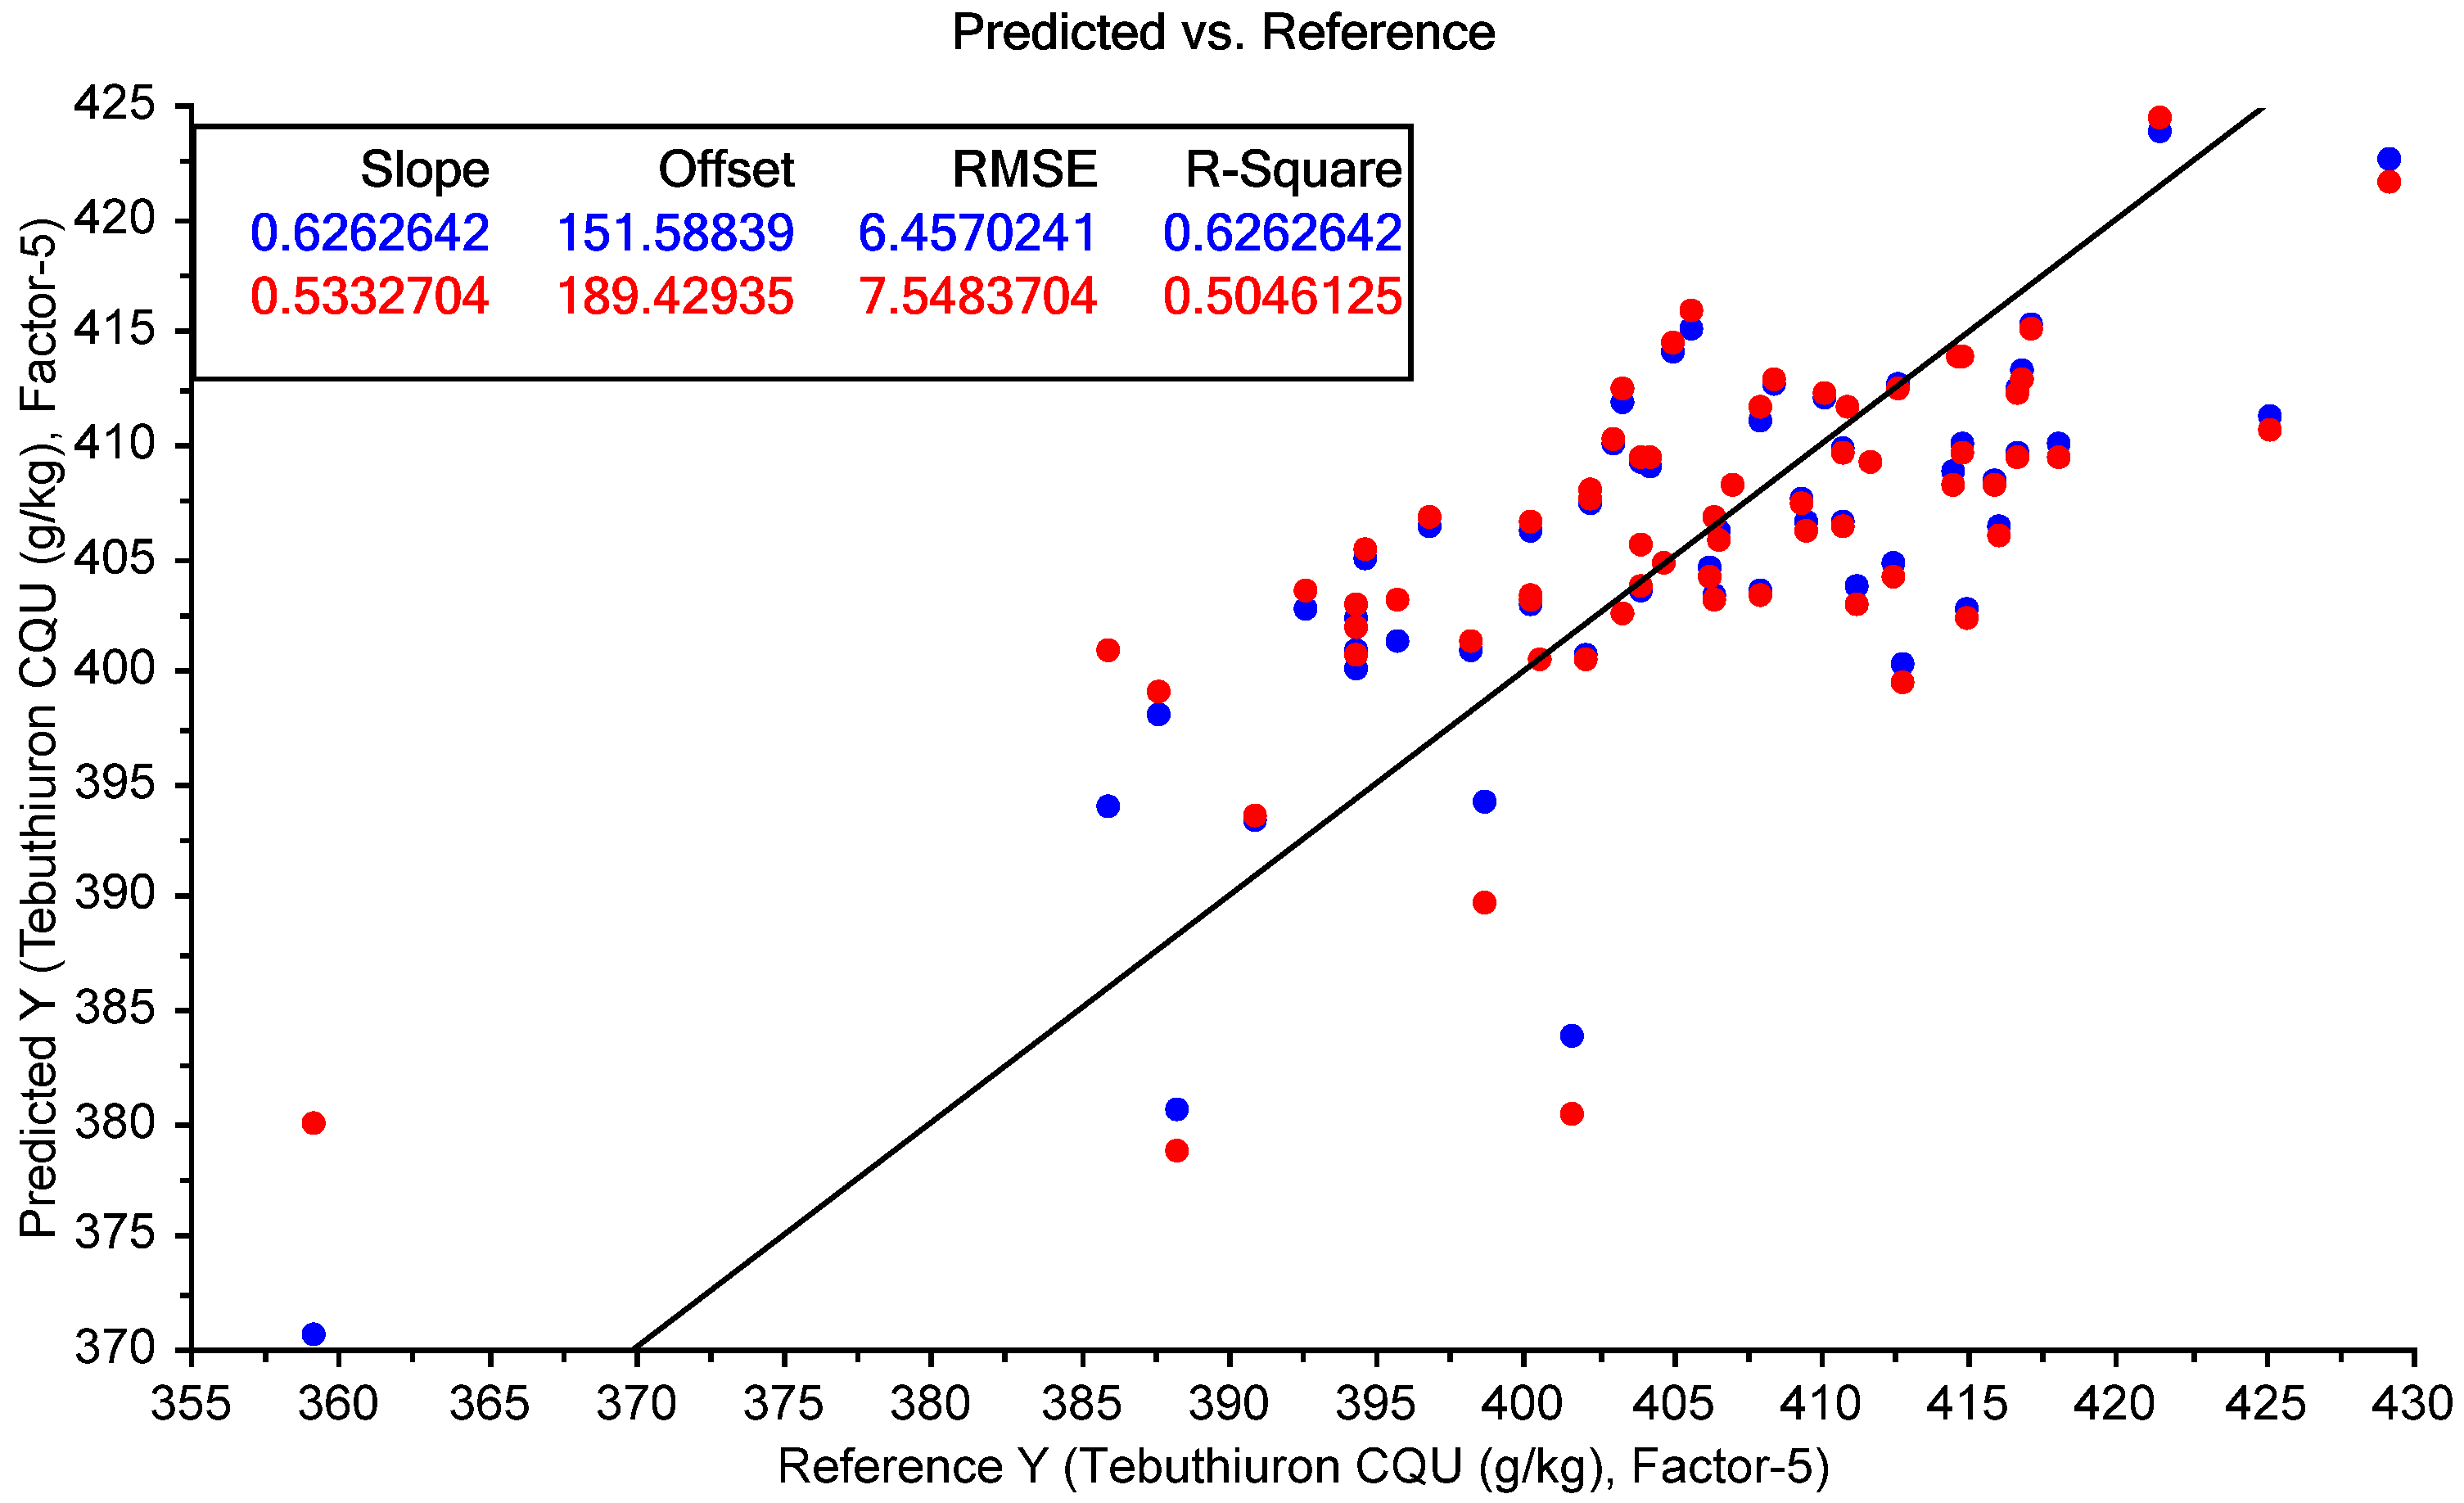
Figure 14.
The results of the best-performing PLSR model for the prediction of tebuthiuron content using the benchtop NIR spectra collected from the Regain400 samples (using 2d11 pre-processing). The blue points show the model calibration, while the red points show the model cross-validation.
Figure 14.
The results of the best-performing PLSR model for the prediction of tebuthiuron content using the benchtop NIR spectra collected from the Regain400 samples (using 2d11 pre-processing). The blue points show the model calibration, while the red points show the model cross-validation.
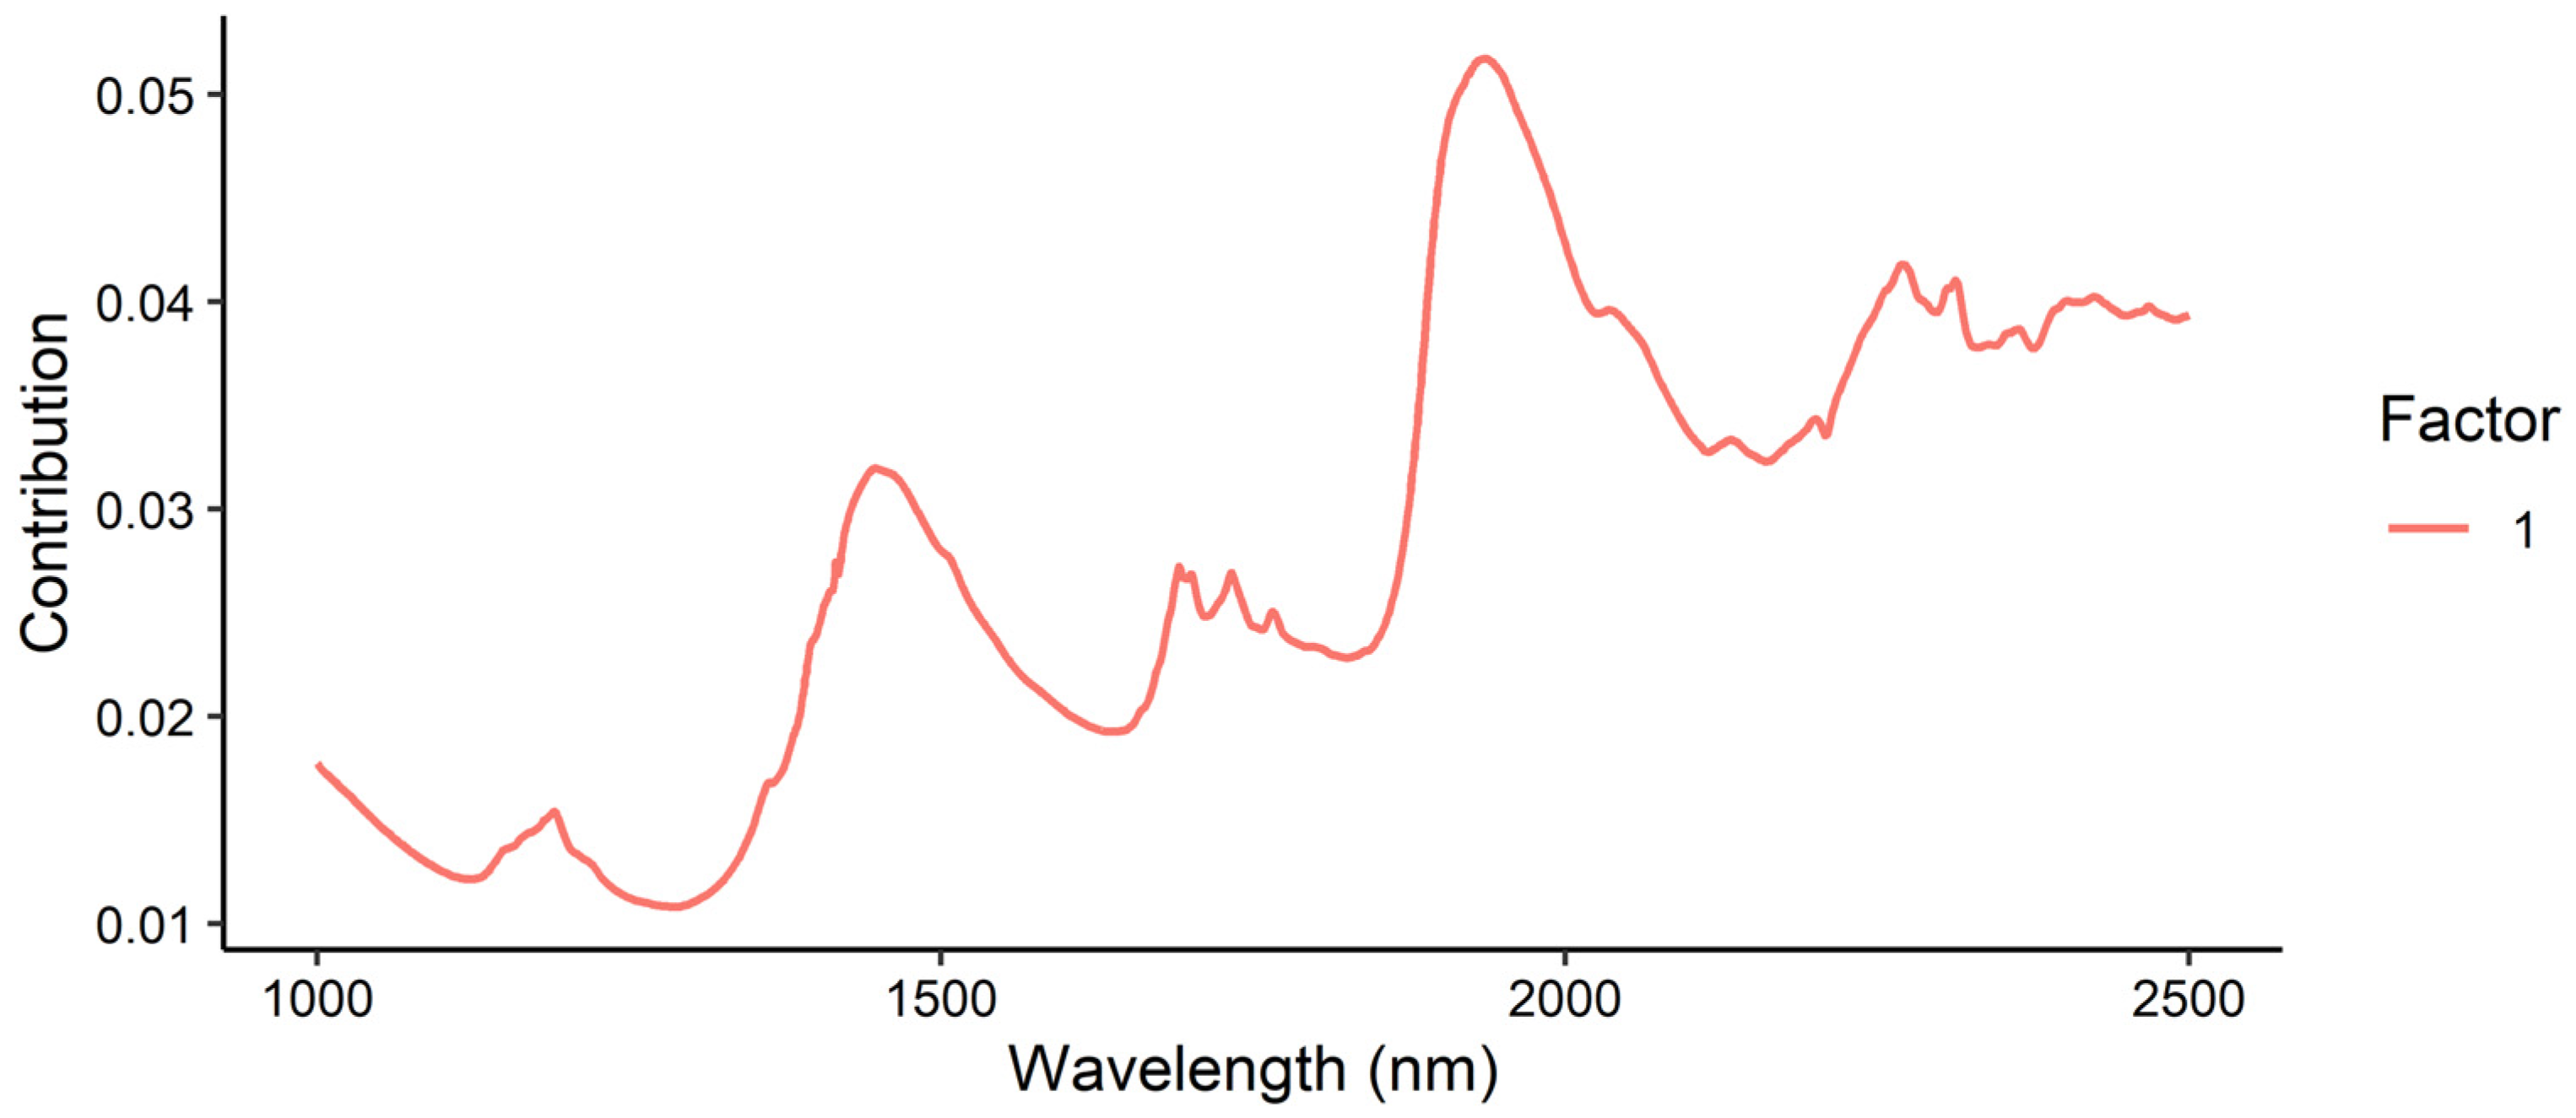
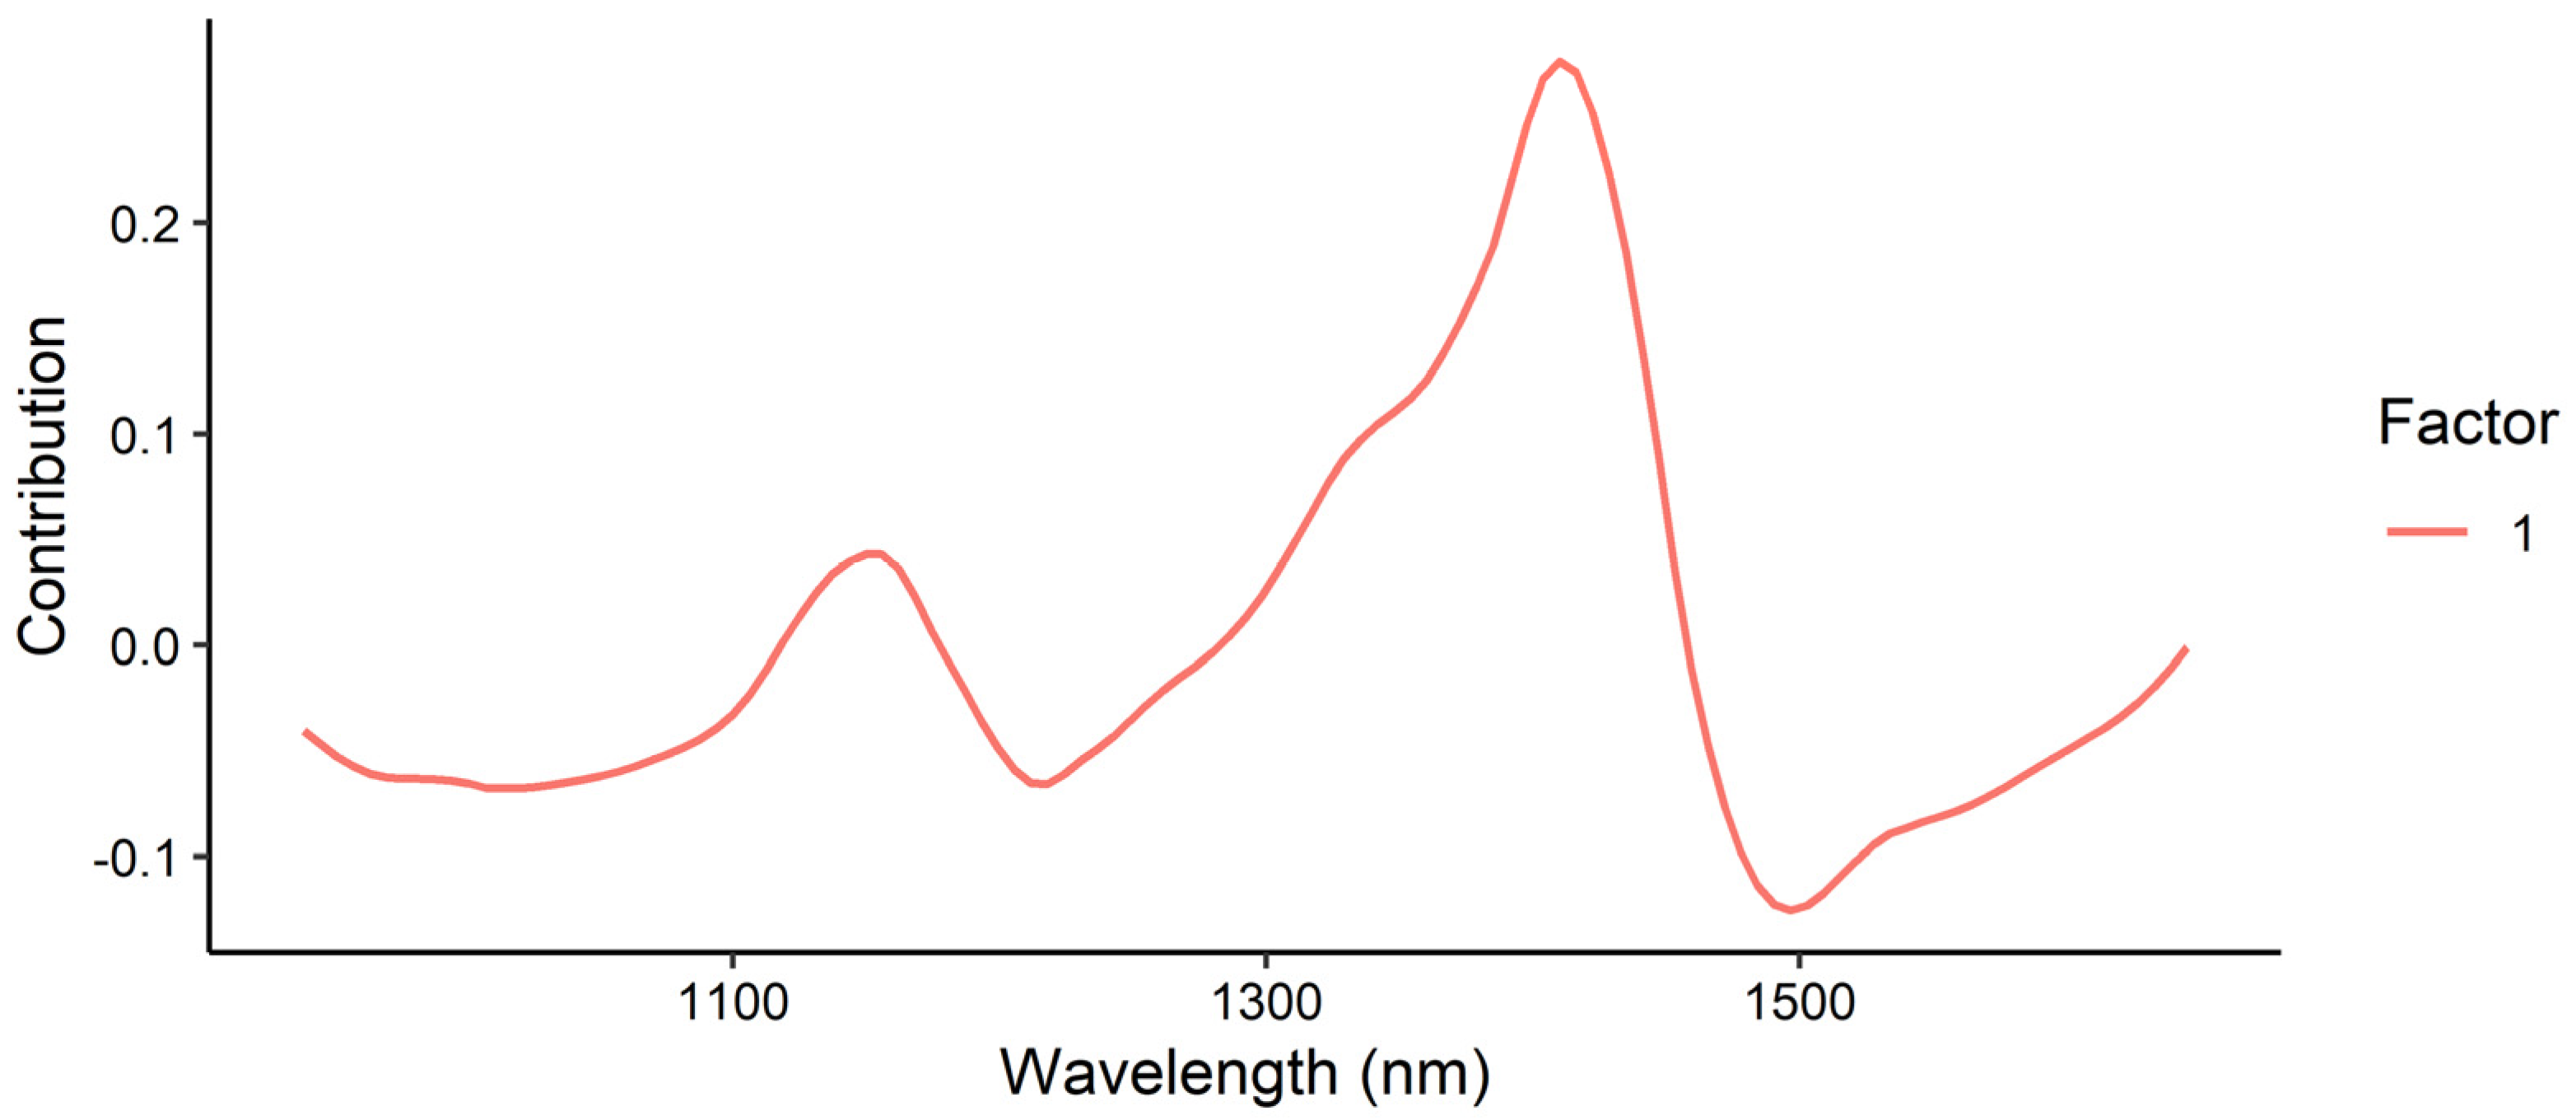
Figure 15.
Loadings plot for the prediction of moisture content in Regain granules using the benchtop Antaris NIR instrument.
Figure 15.
Loadings plot for the prediction of moisture content in Regain granules using the benchtop Antaris NIR instrument.
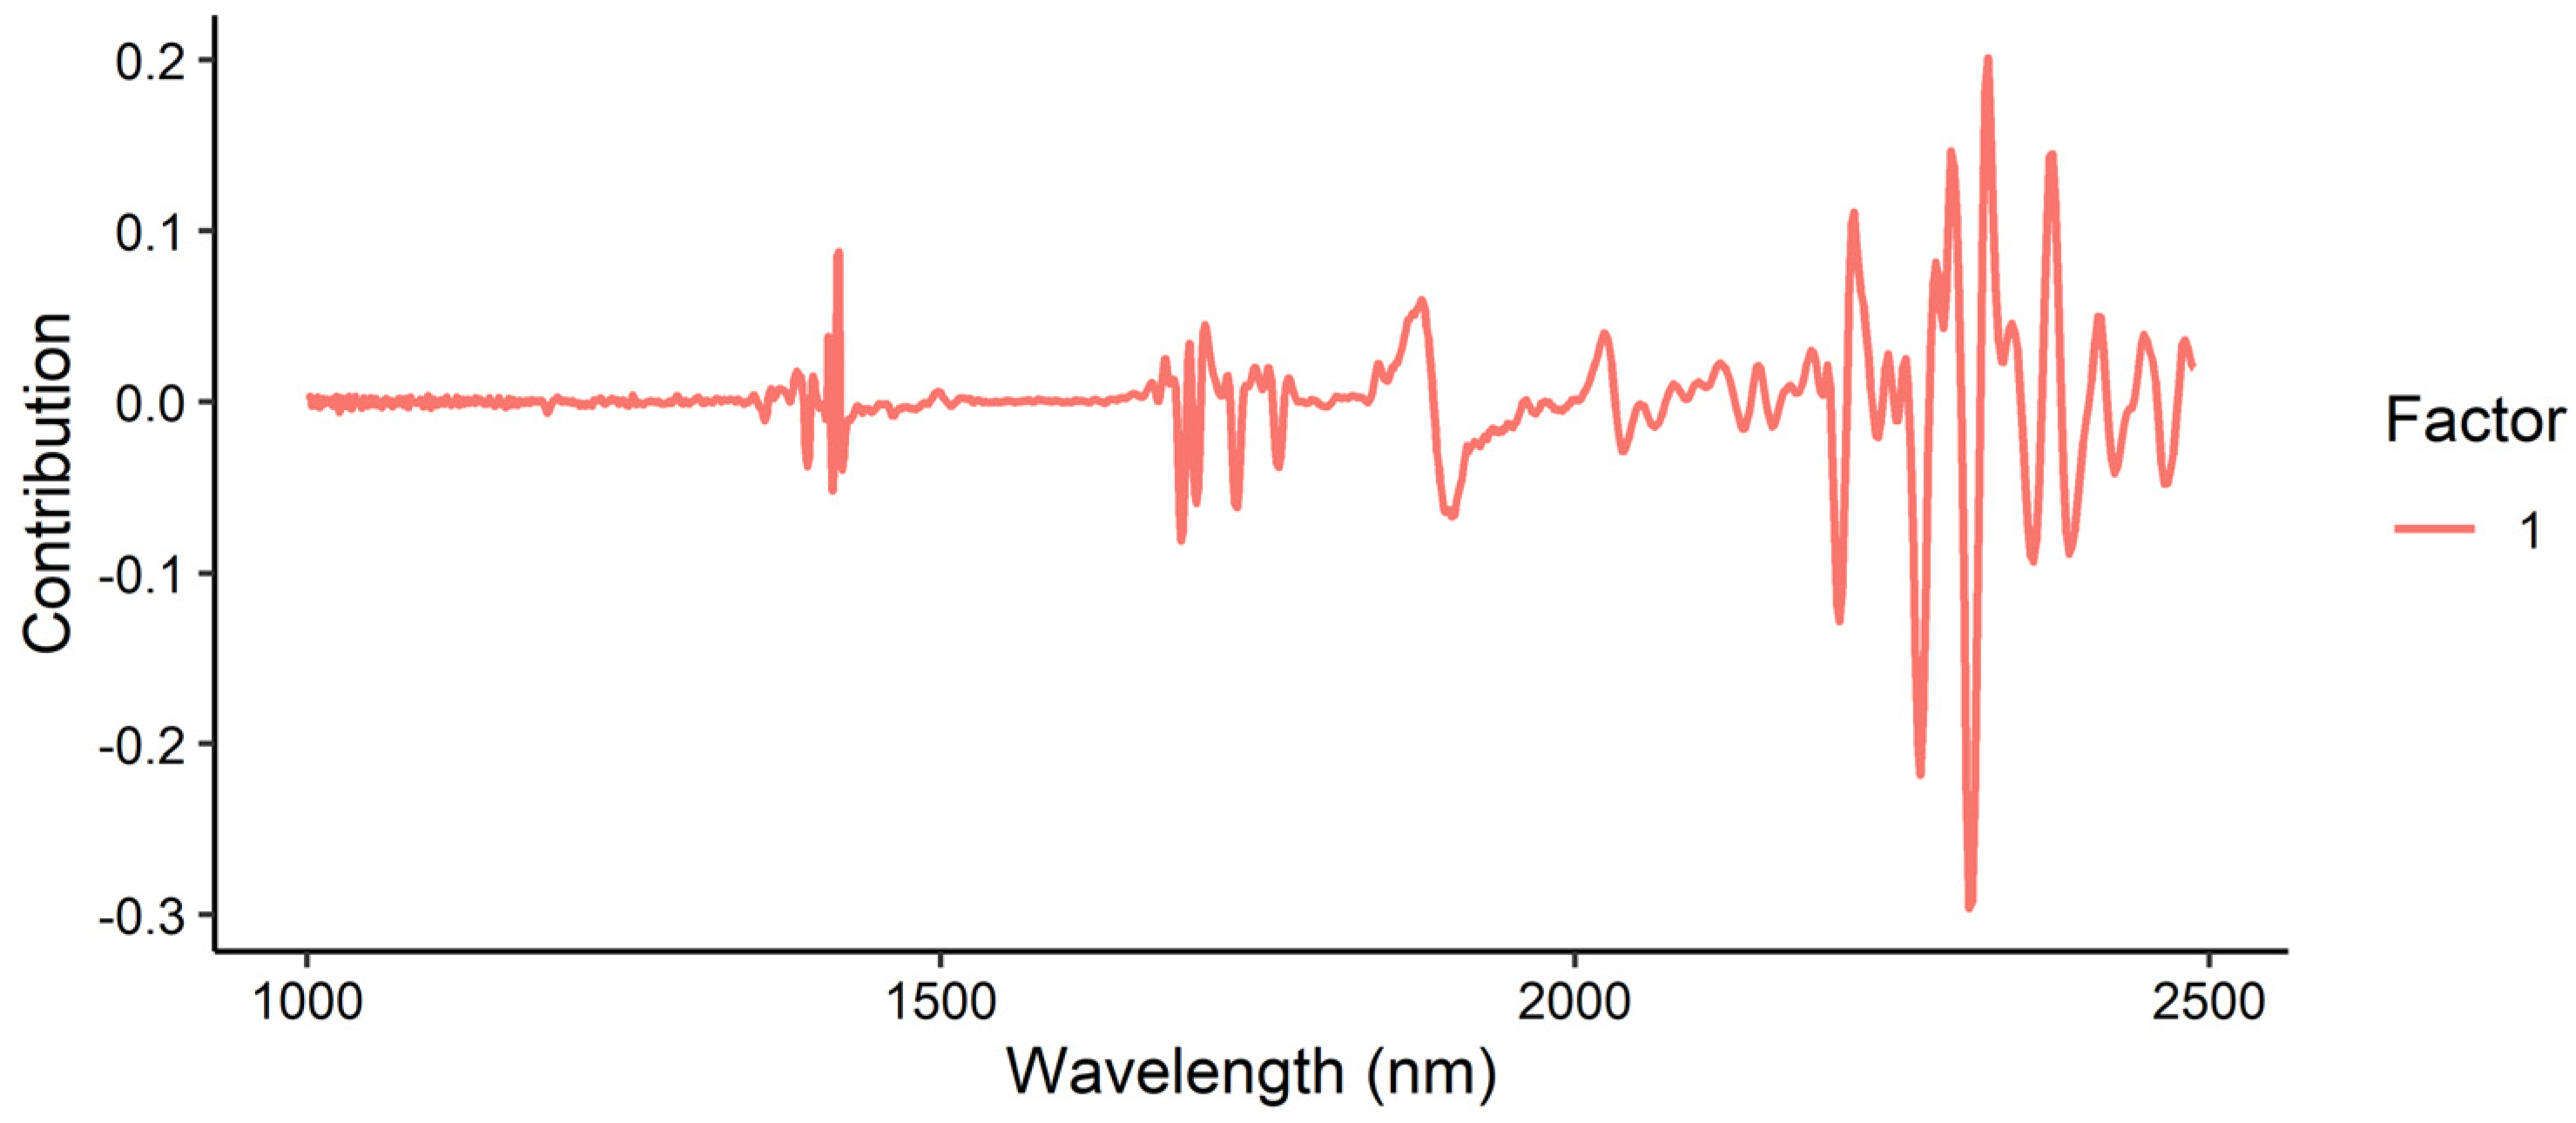
Figure 16.
Loadings plot for the prediction of tebuthiuron content in Regain granules, using the benchtop Antaris NIR instrument.
Figure 16.
Loadings plot for the prediction of tebuthiuron content in Regain granules, using the benchtop Antaris NIR instrument.
Figure 17.
The benchtop NIR spectra of the powdered Regain samples, coloured by moisture content.
Figure 17.
The benchtop NIR spectra of the powdered Regain samples, coloured by moisture content.
Figure 18.
The handheld MicroNIR spectra of the Regain granules, coloured by moisture content.
Figure 18.
The handheld MicroNIR spectra of the Regain granules, coloured by moisture content.
Figure 19.
MicroNIR prediction of moisture content. The blue points show the model calibration, while the red points show the model cross-validation.
Figure 19.
MicroNIR prediction of moisture content. The blue points show the model calibration, while the red points show the model cross-validation.
Figure 20.
Loadings plot for the prediction of moisture content using the MicroNIR instrument.
Figure 20.
Loadings plot for the prediction of moisture content using the MicroNIR instrument.
Figure 21.
MicroNIR prediction of tebuthiuron content. The blue points show the model calibration, while the red points show the model cross-validation.
Figure 21.
MicroNIR prediction of tebuthiuron content. The blue points show the model calibration, while the red points show the model cross-validation.
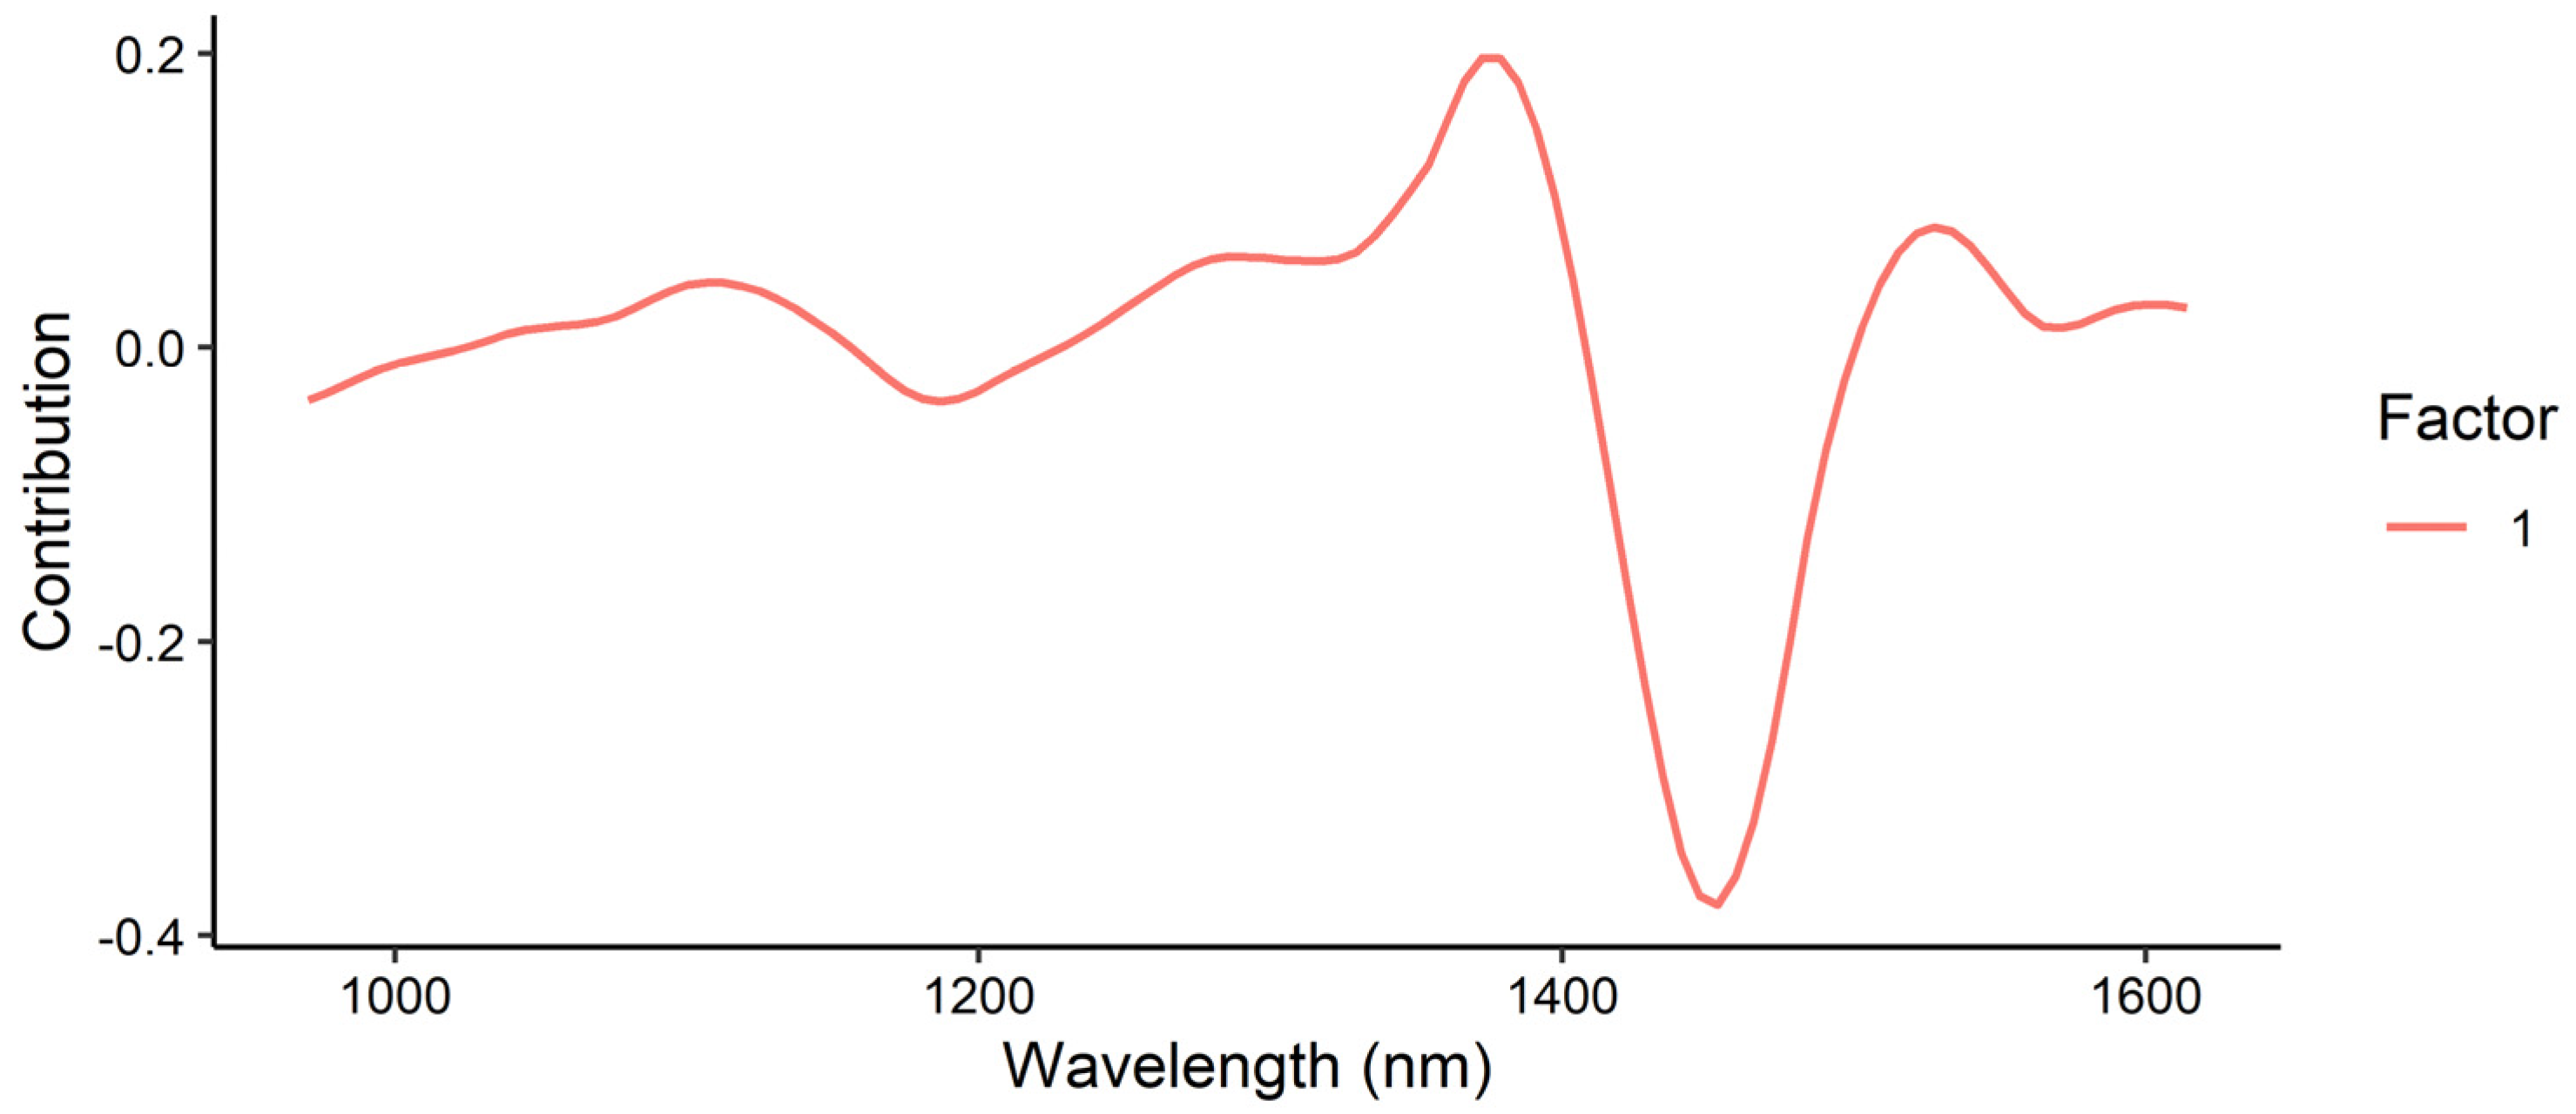
Figure 22.
Loadings plot for the prediction of tebuthiuron content using the MicroNIR instrument.
Figure 22.
Loadings plot for the prediction of tebuthiuron content using the MicroNIR instrument.
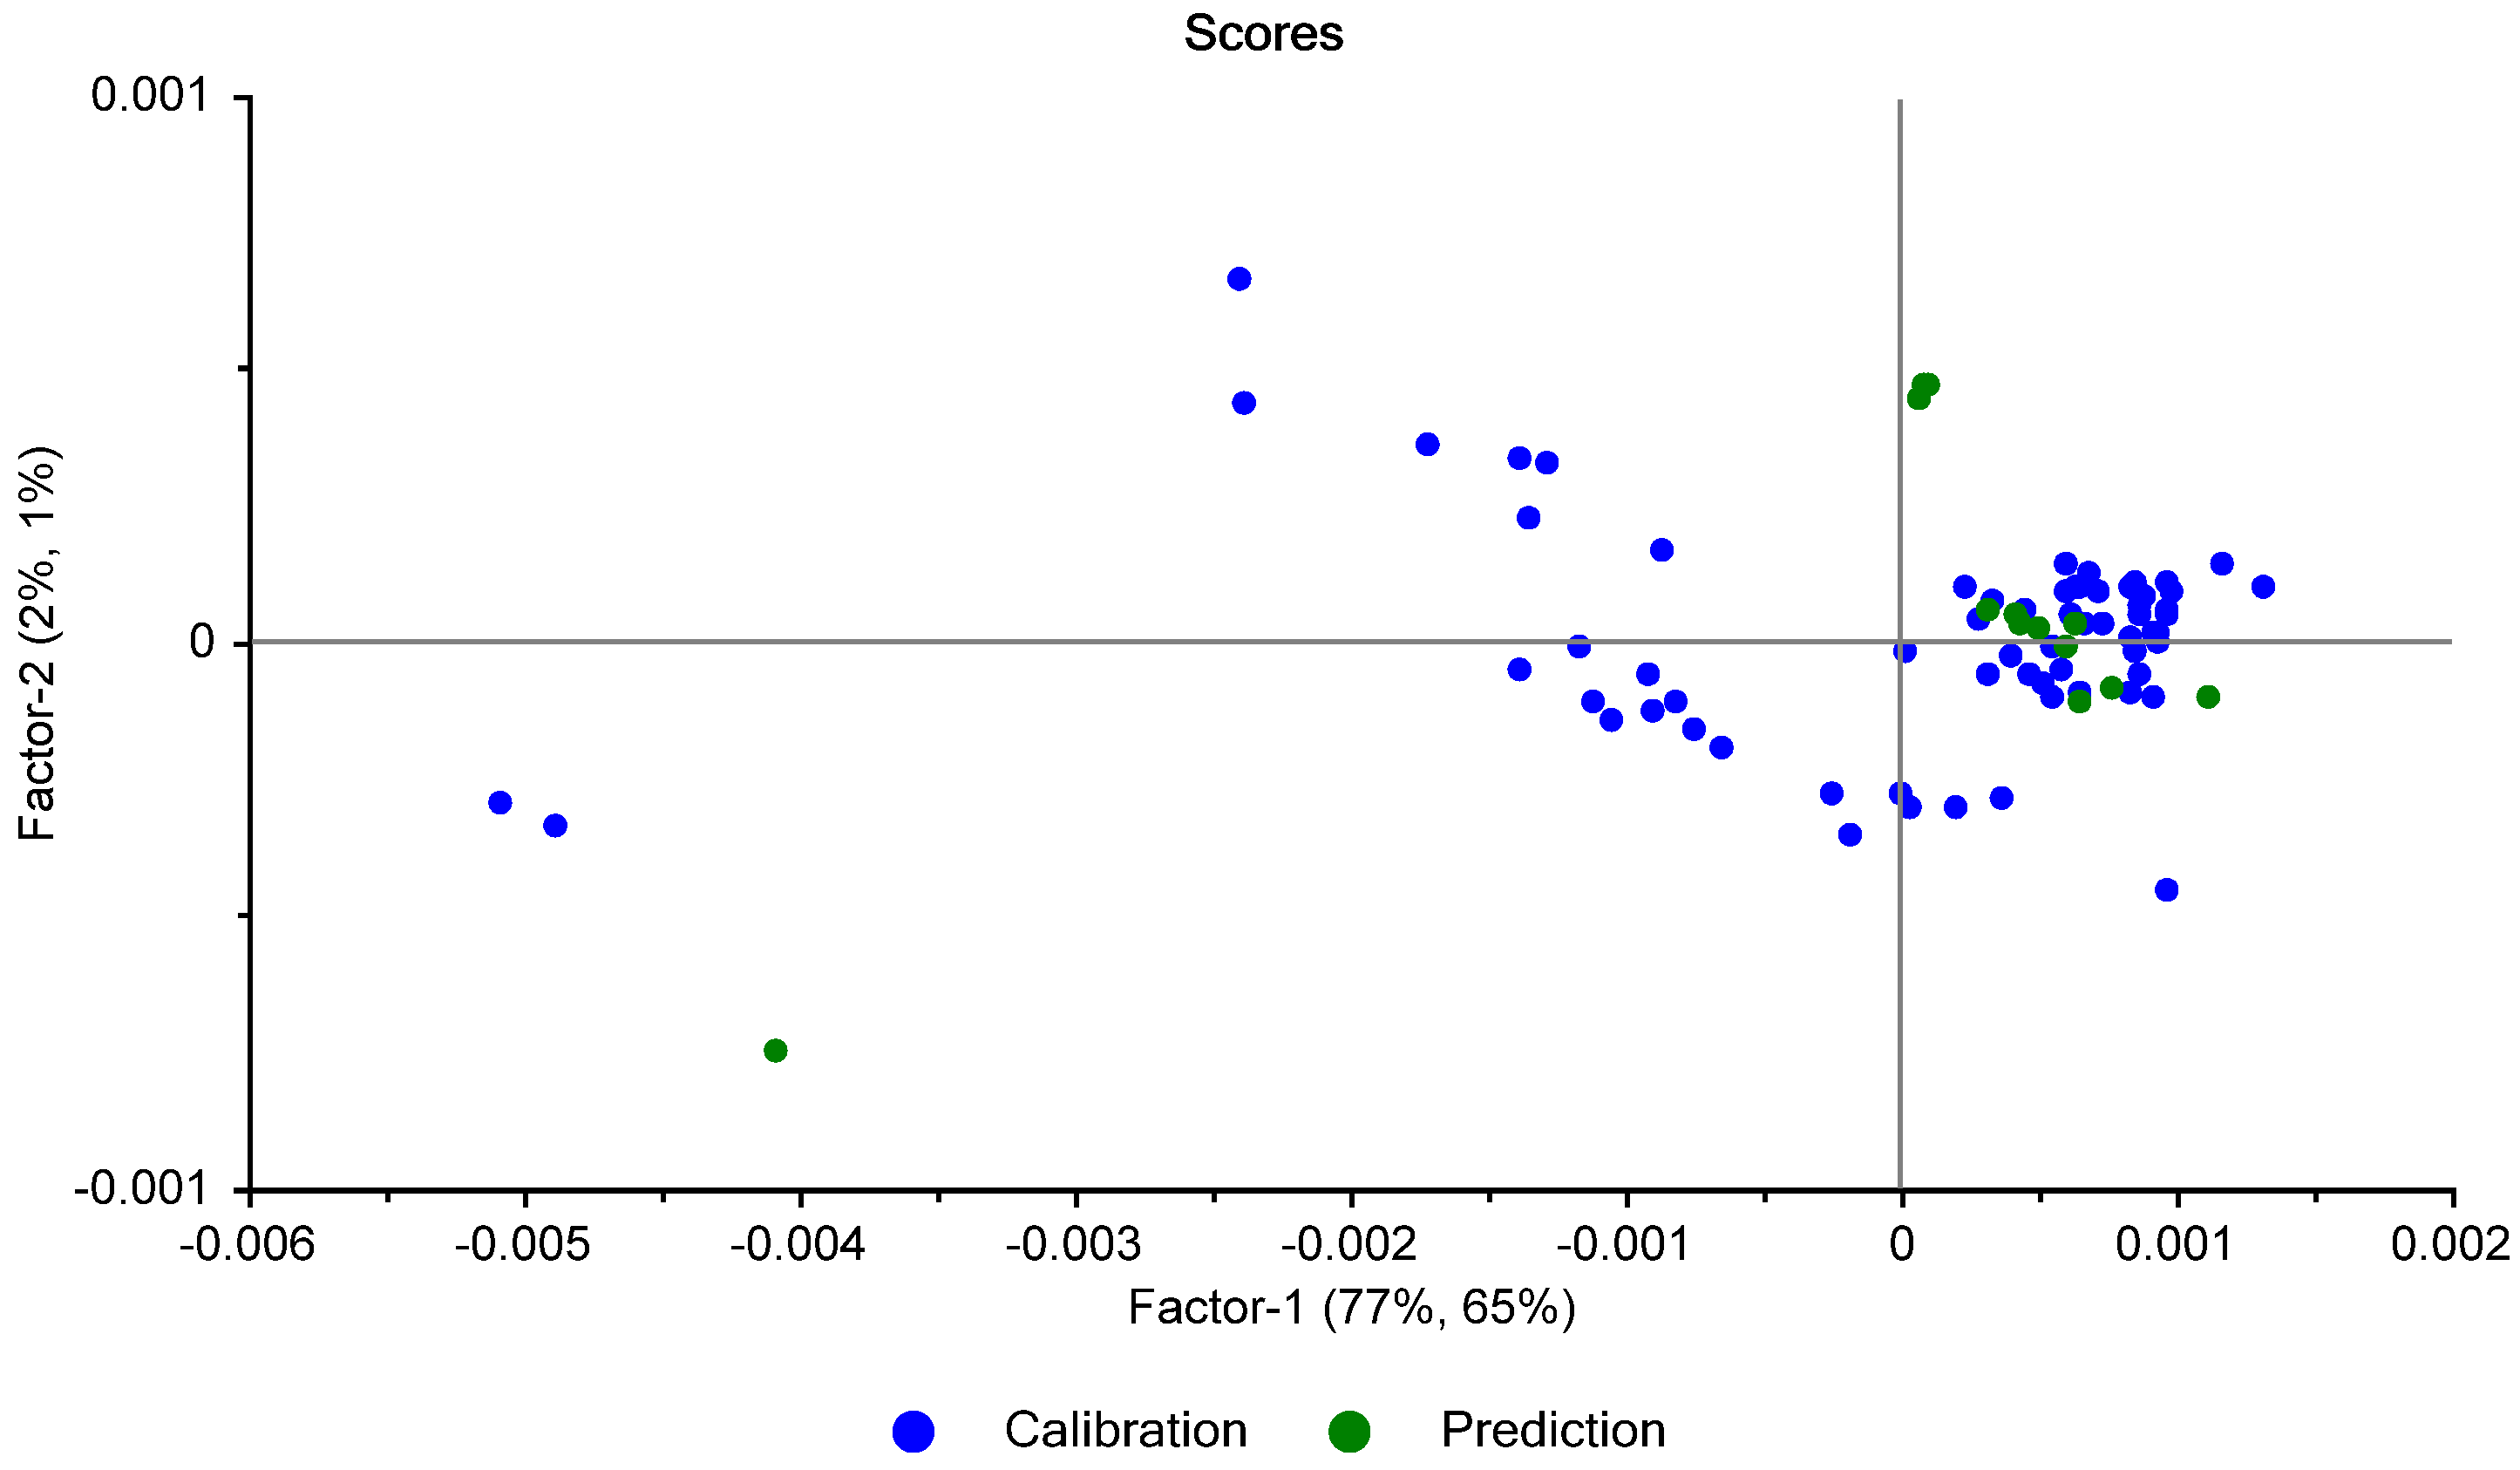
Figure 23.
Scores plot of the calibration and test set spectra.
Figure 23.
Scores plot of the calibration and test set spectra.
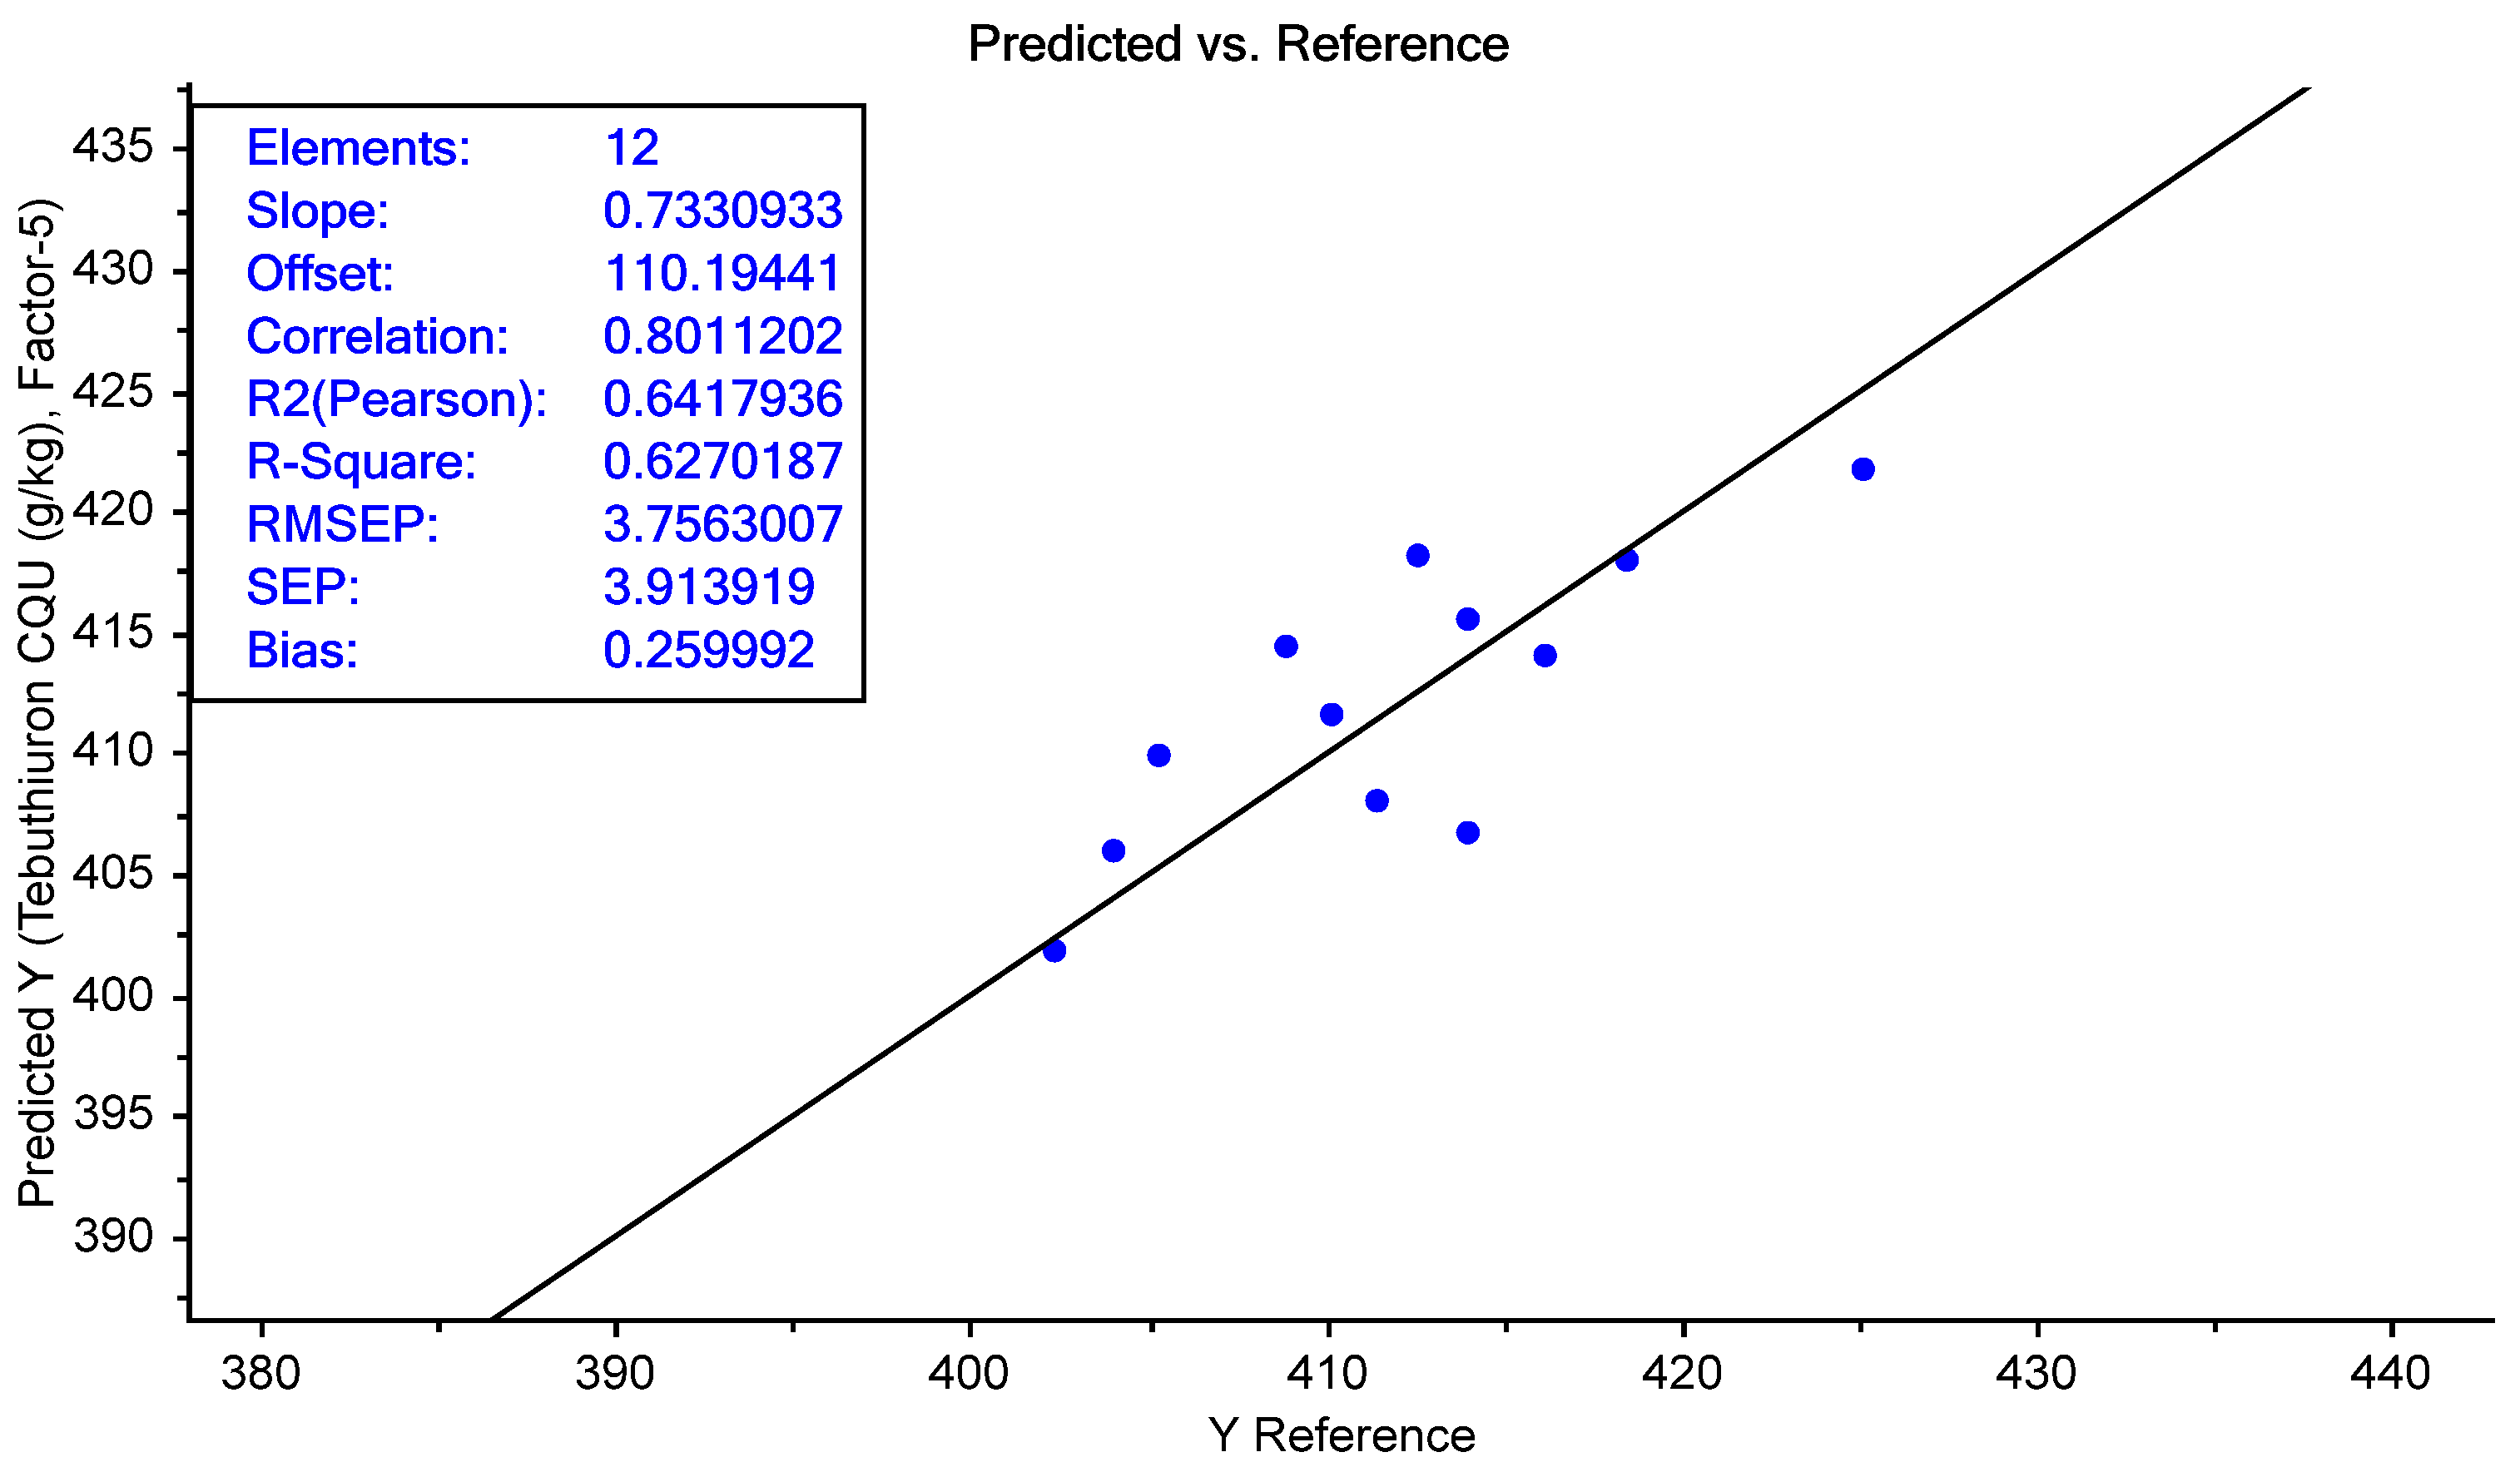
Figure 24.
The predicted vs. measured tebuthiuron content of the Regain 400 samples in the independent test set (n = 12).
Figure 24.
The predicted vs. measured tebuthiuron content of the Regain 400 samples in the independent test set (n = 12).
Table 1.
Intra-day and inter-day precision of replicate injections of 100 mg L−1 tebuthiuron standards analyzed using the HPLC method.
Table 1.
Intra-day and inter-day precision of replicate injections of 100 mg L−1 tebuthiuron standards analyzed using the HPLC method.
| Injection | Peak Area | Day | Peak Area |
|---|
| 1 | 1451.1 | 1 | 1463.2 |
| 2 | 1460.8 | 2 | 1466.3 |
| 3 | 1464.0 | 3 | 1460.2 |
| 4 | 1466.3 | 4 | 1453.8 |
| 5 | 1465.8 | 5 | 1428.2 |
| 6 | 1468.3 | 6 | 1450.5 |
| Mean ± SD | 1463.2 ± 5.1 | Mean ± SD | 1453.7 ± 13.8 |
| %CV | 0.35% | %CV | 0.95% |
Table 2.
Stability of the Regain methanolic extract after 8 days of storage at room temperature.
Table 2.
Stability of the Regain methanolic extract after 8 days of storage at room temperature.
| Sample | Peak Area | Tebuthiuron (mg/g) |
|---|
| Initial extract | 4019.6 | 403.5 |
| After 8 days at room temperature | 4023.4 | 403.9 |
Table 3.
Replicate tebuthiuron content measurements performed on replicate extracts from one powdered, homogenised Regain400 sample.
Table 3.
Replicate tebuthiuron content measurements performed on replicate extracts from one powdered, homogenised Regain400 sample.
| Replicate | Tebuthiuron Content (mg/g) |
|---|
| 1 | 396.5 |
| 2 | 422.9 # |
| 3 | 399.1 |
| 4 | 392.1 |
| 5 | 406.6 |
| 6 | 411.5 |
| 7 | 402.1 |
| Mean | 401.3 |
| SD | 7.0 |
| %CV | 1.74% |
Table 4.
Assessment of the variation in tebuthiuron content between different portions of one Regain400 sample.
Table 4.
Assessment of the variation in tebuthiuron content between different portions of one Regain400 sample.
| | | Tebuthiuron Content (mg/g) |
|---|
| Location | Replicate | Intra-Replicate Analyses | Mean Content | Within-Sample %CV |
|---|
| Location 1 | Replicate A | 405.9 | | |
| | Replicate B | 416.8 | | |
| | Replicate C | 421.4 | 414.7 | 1.91% |
| Location 2 | Replicate A | 411.8 | | |
| | Replicate B | 414.0 | | |
| | Replicate C | 461.3 # | 412.9 | 0.39% |
| Location 3 | Replicate A | 419.7 | | |
| | Replicate B | 413.8 | | |
| | Replicate C | 404.3 | 412.6 | 1.89% |
| Location 4 | Replicate A | 424.0 | | |
| | Replicate B | 404.5 | | |
| | Replicate C | 408.5 | 412.3 | 2.49% |
| Location 5 | Replicate A | 420.1 | | |
| | Replicate B | 416.8 | | |
| | Replicate C | 409.9 | 415.6 | 1.26% |
| Location 6 | Replicate A | 431.1 | | |
| | Replicate B | 417.3 | | |
| | Replicate C | 414.5 | 421.0 | 2.12% |
| Location 7 | Replicate A | 417.2 | | |
| | Replicate B | 420.1 | | |
| | Replicate C | 417.6 | 418.3 | 0.38% |
| Location 8 | Replicate A | 417.1 | | |
| | Replicate B | 412.2 | | |
| | Replicate C | 412.6 | 414.0 | 0.65% |
| Location 9 | Replicate A | 415.9 | | |
| | Replicate B | 419.4 | | |
| | Replicate C | 422.6 | 419.3 | 0.79% |
| Location 10 | Replicate A | 417.4 | | |
| | Replicate B | 428.7 | | |
| | Replicate C | 413.5 | 419.9 | 1.87% |
| Mean | | 416.2 (n = 29) | 416.1 (n = 10) | 1.40% (n = 10) |
| SD | | 6.3 (n = 29) | 3.3 (n = 10) | - |
| %CV | | 1.52% (n = 29) | 0.79% (n = 10) | - |
Table 5.
The major peaks observed in the FTIR spectrum of pure tebuthiuron powder and their assigned bonds.
Table 5.
The major peaks observed in the FTIR spectrum of pure tebuthiuron powder and their assigned bonds.
| Peak (cm−1) | Appearance | Bond | Reference |
|---|
| 3366 | Medium | N-H stretch of secondary amine | [22] |
| 2961 | Medium | C-H stretch of methyl group
(shoulder may be due to sulfide bond) | [22] |
| 1672 | Strong | C=O stretch of secondary and tertiary amide (Amide I band)
C=N stretch of imine may also contribute | [22] |
| 1526 | Strong | N-H bend and C-N stretch (Amide II band)
N-H bend may also be contributed from secondary amine | [23] |
| 1478 | Strong | Unknown (thiadiazyl group likely contributing) | |
| 1451 | Strong | C-H bend of methyl group | [22] |
| 1410 | Strong | Unknown (thiadiazyl group contributing) | |
| 1328 | Strong | - | |
| 1238 | Strong | Tentative: Amide III band | [24] |
| 1210 | Strong | - | |
| 1161 | Medium | Tentative: C-N stretch of amine | [22] |
| 1090 | Medium | C=N stretch of imine | [25] |
| 1062 | Medium | Unknown (thiadiazyl group contributing) | |
| 905 | Weak | =C-N bond | |
| 767 & 756 | Strong | C-S stretch
May be some contribution from N-H wag of secondary amine | [26] |
| 654 | Medium | C-S stretch | [27] |
Table 6.
Optimum pre-processing methods for the prediction of moisture and tebuthiuron content in powdered Regain samples using FTIR spectroscopy. The best-performing model for each analyte is highlighted in bold.
Table 6.
Optimum pre-processing methods for the prediction of moisture and tebuthiuron content in powdered Regain samples using FTIR spectroscopy. The best-performing model for each analyte is highlighted in bold.
| | Moisture | Tebuthiuron |
|---|
| Pre-Processing | Factors | R2cv | RMSECV (%) | Factors | R2cv | RMSECV (mg/g) |
|---|
| None | 7 | 0.82 | 1.22 | 6 | 0.38 | 8.3 |
| SNV | 7 | 0.85 | 1.12 | 7 | 0.43 | 8.0 |
| 1d5 | 4 | 0.77 | 1.39 | 5 | 0.37 | 8.4 |
| 1d11 | 7 | 0.82 | 1.23 | 5 | 0.39 | 8.3 |
| 1d15 | 7 | 0.82 | 1.22 | 6 | 0.40 | 8.2 |
| 1d21 | 7 | 0.82 | 1.21 | 6 | 0.41 | 8.2 |
| 1d31 | 7 | 0.83 | 1.19 | 7 | 0.41 | 8.1 |
| 1d41 | 7 | 0.84 | 1.15 | 5 | 0.39 | 8.3 |
| 2d11 | 4 | 0.75 | 1.42 | 4 | 0.42 | 8.1 |
| 2d15 | 7 | 0.80 | 1.28 | 5 | 0.39 | 8.3 |
| 2d21 | 7 | 0.81 | 1.25 | 5 | 0.40 | 8.2 |
| 2d31 | 7 | 0.81 | 1.23 | 6 | 0.42 | 8.1 |
| 2d41 | 7 | 0.82 | 1.23 | 6 | 0.41 | 8.2 |
Table 7.
Optimum pre-processing methods for the prediction of moisture and tebuthiuron content in Regain granules using the benchtop Antaris NIR instrument. The best-performing model for each analyte is highlighted in bold.
Table 7.
Optimum pre-processing methods for the prediction of moisture and tebuthiuron content in Regain granules using the benchtop Antaris NIR instrument. The best-performing model for each analyte is highlighted in bold.
| | Moisture | Tebuthiuron |
|---|
| Pre-Processing | Factors | R2cv | RMSECV (%) | Factors | R2cv | RMSECV (mg/g) |
|---|
| None | 3 | 0.93 | 0.85 | 5 | 0.24 | 9.3 |
| SNV | 4 | 0.91 | 0.92 | 5 | 0.42 | 8.2 |
| 1d5 | 2 | 0.92 | 0.86 | 5 | 0.40 | 8.3 |
| 1d11 | 2 | 0.92 | 0.86 | 5 | 0.35 | 8.7 |
| 1d15 | 2 | 0.92 | 0.87 | 5 | 0.33 | 8.8 |
| 1d21 | 2 | 0.92 | 0.89 | 4 | 0.31 | 8.9 |
| 1d31 | 2 | 0.91 | 0.90 | 4 | 0.30 | 8.9 |
| 1d41 | 2 | 0.91 | 0.91 | 4 | 0.30 | 9.0 |
| 2d11 | 3 | 0.91 | 0.93 | 5 | 0.46 | 7.9 |
| 2d15 | 3 | 0.91 | 0.94 | 5 | 0.45 | 8.0 |
| 2d21 | 3 | 0.91 | 0.91 | 5 | 0.41 | 8.3 |
| 2d31 | 2 | 0.92 | 0.87 | 5 | 0.38 | 8.5 |
| 2d41 | 2 | 0.92 | 0.89 | 5 | 0.37 | 8.5 |
Table 8.
Optimum pre-processing methods for the prediction of moisture and tebuthiuron content in powdered Regain samples using the benchtop Antaris NIR instrument. The best-performing model for each analyte is highlighted in bold.
Table 8.
Optimum pre-processing methods for the prediction of moisture and tebuthiuron content in powdered Regain samples using the benchtop Antaris NIR instrument. The best-performing model for each analyte is highlighted in bold.
| | Moisture | Tebuthiuron |
|---|
| Pre-Processing | Factors | R2cv | RMSECV (%) | Factors | R2cv | RMSECV (mg/g) |
|---|
| None | 7 | 0.86 | 1.09 | 6 | 0.49 | 7.8 |
| SNV | 6 | 0.88 | 1.02 | 4 | 0.40 | 8.3 |
| 1d5 | 6 | 0.84 | 1.15 | 4 | 0.45 | 7.9 |
| 1d11 | 6 | 0.85 | 1.12 | 5 | 0.45 | 8.0 |
| 1d15 | 6 | 0.85 | 1.12 | 5 | 0.45 | 8.0 |
| 1d21 | 6 | 0.85 | 1.11 | 5 | 0.44 | 8.0 |
| 1d31 | 7 | 0.86 | 1.07 | 6 | 0.44 | 8.0 |
| 1d41 | 6 | 0.85 | 1.12 | 6 | 0.45 | 8.0 |
| 2d11 | 6 | 0.81 | 1.28 | 4 | 0.48 | 7.7 |
| 2d15 | 6 | 0.83 | 1.21 | 4 | 0.46 | 7.9 |
| 2d21 | 6 | 0.83 | 1.18 | 4 | 0.45 | 8.0 |
| 2d31 | 6 | 0.84 | 1.18 | 4 | 0.44 | 8.0 |
| 2d41 | 6 | 0.84 | 1.15 | 4 | 0.43 | 8.1 |
Table 9.
Optimum pre-processing methods for the prediction of moisture and tebuthiuron content in Regain granules using the handheld MicroNIR instrument. The best-performing model for each analyte is highlighted in bold.
Table 9.
Optimum pre-processing methods for the prediction of moisture and tebuthiuron content in Regain granules using the handheld MicroNIR instrument. The best-performing model for each analyte is highlighted in bold.
| | Moisture | Tebuthiuron |
|---|
| Pre-Processing | Factors | R2cv | RMSECV (%) | Factors | R2cv | RMSECV (mg/g) |
|---|
| None | 4 | 0.91 | 0.86 | 6 | 0.24 | 9.3 |
| SNV | 4 | 0.91 | 0.88 | 7 | 0.35 | 8.6 |
| 1d3 | 2 | 0.92 | 0.83 | 5 | 0.44 | 8.0 |
| 1d5 | 2 | 0.92 | 0.83 | 5 | 0.45 | 8.0 |
| 1d7 | 2 | 0.92 | 0.83 | 5 | 0.44 | 8.0 |
| 1d9 | 2 | 0.92 | 0.83 | 5 | 0.44 | 8.0 |
| 1d11 | 2 | 0.92 | 0.83 | 5 | 0.44 | 8.0 |
| 2d5 | 2 | 0.91 | 0.89 | 5 | 0.45 | 7.9 |
| 2d9 | 1 | 0.90 | 0.91 | 5 | 0.46 | 7.9 |
| 2d11 | 1 | 0.91 | 0.89 | 5 | 0.46 | 7.8 |
| 2d15 | 2 | 0.91 | 0.87 | 5 | 0.48 | 7.7 |
| 2d21 | 2 | 0.91 | 0.85 | 5 | 0.50 | 7.5 |
Table 10.
Optimum pre-processing methods for the prediction of moisture and tebuthiuron content in powdered and granular Regain samples, using three different IR instruments. The best-performing model for each analyte is highlighted in bold.
Table 10.
Optimum pre-processing methods for the prediction of moisture and tebuthiuron content in powdered and granular Regain samples, using three different IR instruments. The best-performing model for each analyte is highlighted in bold.
| | | Moisture | Tebuthiuron |
|---|
| Instrument | Matrix | Factors | R2cv | RMSECV (%) | Factors | R2cv | RMSECV (mg/g) |
|---|
| Bruker FTIR (benchtop) | Powder | 7 | 0.85 | 1.12 | 7 | 0.43 | 8.0 |
| Antaris (benchtop) | Powder | 6 | 0.88 | 1.02 | 4 | 0.48 | 7.7 |
| Antaris (benchtop) | Granules | 3 | 0.93 | 0.85 | 5 | 0.46 | 7.9 |
| MicroNIR (handheld) | Powder | - | - | - | - | - | - |
| MicroNIR (handheld) | Granules | 2 | 0.92 | 0.83 | 5 | 0.50 | 7.5 |
Table 11.
Prediction and reference results for the independent test set.
Table 11.
Prediction and reference results for the independent test set.
| Moisture by NIR (%) | Moisture by Drying (%) | Prediction Error (%) | Tebuthiuron by NIR (mg/g) | Tebuthiuron by HPLC (mg/g) | Prediction Error (mg/g) |
|---|
| 9.74 ± 1.34 | 11 | −1.26 | 414 ± 12 | 409 | +5 |
| 9.91 ± 1.39 | ND | | 418 ± 16 | 413 | +5 |
| 9.84 ± 1.39 | ND | | 416 ± 20 | 414 | +2 |
| 3.51 ± 2.86 | ND | | 275 ± 85 | 214 | +61 # |
| 10.86 ± 0.92 | 10 | 0.86 | 422 ± 34 | 425 | −3 |
| 10.9 ± 0.85 | 10.7 | 0.2 | 418 ± 37 | 419 | −1 |
| 10.63 ± 0.79 | 10 | 0.63 | 414 ± 35 | 416 | −2 |
| 10.74 ± 0.81 | 10 | 0.74 | 411 ± 37 | 410 | +1 |
| 11.21 ± 0.58 | 10.8 | 0.41 | 410 ± 15 | 405 | +5 |
| 10.81 ± 0.45 | 11.5 | −0.69 | 407 ± 10 | 414 | −7 |
| 11.74 ± 0.57 | 11.6 | 0.14 | 408 ± 8 | 411 | −3 |
| 10.47 ± 0.27 | 8.38 | 2.09 | 406 ± 9 | 404 | +2 |
| 10.28 ± 0.43 | 9.79 | 0.49 | 402 ± 12 | 402 | 0 |
| | Mean error | 0.36% | | Mean error | +0.3 |


