Next Issue
Volume 1, September


Optics, Volume 1, Issue 1 (June 2020) – 13 articles

Cover Story (view full-size image): 
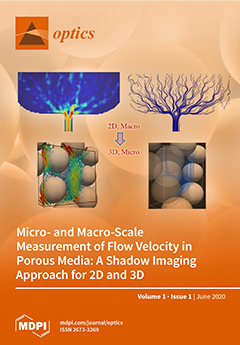
Detailed knowledge of three dimensional (3D) flow has been obtained to interpret phenomena that occurs inside porous media providing understanding of macroscale behaviors. This flow has been measured at the pore and subpore scales using a refractive index matching (RIM) and shadowgraph imaging technique. At the macroscale, flow has been measured using particle image velocimetry (PIV) method in two dimensions (2D) followed by micro scale velocimetry for the 3D flow within an arbitrary volume of the porous medium. The 3D measurement was quantified using particle tracking velocimetry (PTV) in layers and utilizing the conservation of mass principle. View this paper.
  • Issues are regarded as officially published after their release is announced to the table of contents alert mailing list.
  • You may sign up for e-mail alerts to receive table of contents of newly released issues.
  • PDF is the official format for papers published in both, html and pdf forms. To view the papers in pdf format, click on the "PDF Full-text" link, and use the free Adobe Reader to open them.
Order results
Result details
Section
Select all
Export citation of selected articles as:
1 pages, 130 KiB  
Editorial
Optics to the World
by Costantino De Angelis
Optics 2020, 1(1), 174; https://doi.org/10.3390/opt1010013 - 25 Jun 2020
Viewed by 1744
Abstract
Optics play a vital role in today’s society [...] Full article
1 pages, 121 KiB  
Editorial
Optics—Frontiers in Fundamental Research and Applications
by Thomas Seeger
Optics 2020, 1(1), 173; https://doi.org/10.3390/opt1010012 - 25 Jun 2020
Viewed by 1840
Abstract
Optics are nowadays and in future an important part of many key scientific disciplines [...] Full article
18 pages, 13511 KiB  
Article
Optical Measurements on Thermal Convection Processes inside Thermal Energy Storages during Stand-By Periods
by Henning Otto, Christian Resagk and Christian Cierpka
Optics 2020, 1(1), 155-172; https://doi.org/10.3390/opt1010011 - 29 Apr 2020
Cited by 2 | Viewed by 2863
Abstract
Thermal energy storages (TES) are increasingly important for storing energy from renewable energy sources. TES that work with liquid storage materials are used in their most efficient way by stratifying the storage fluid by its thermal density gradient. Mixing of the stratification layers [...] Read more.
Thermal energy storages (TES) are increasingly important for storing energy from renewable energy sources. TES that work with liquid storage materials are used in their most efficient way by stratifying the storage fluid by its thermal density gradient. Mixing of the stratification layers during stand-by periods decreases the thermal efficiency of the TES. Tank sidewalls, unlike the often poorly heat-conducting storage fluids, promote a heat flux from the hot to the cold layer and lead to thermal convection. In this experimental study planar particle image velocimetry (PIV) measurements and background-oriented schlieren (BOS) temperature measurements are performed in a model experiment of a TES to characterise the influence of the thermal convection on the stratification and thus the storage efficiency. The PIV results show two vertical, counter-directed wall jets that approach in the thermocline between the stratification layers. The wall jet in the hot part of the thermal stratification shows compared to the wall jet in the cold region strong fluctuations in the vertical velocity, that promote mixing of the two layers. The BOS measurements have proven that the technique is capable of measuring temperature fields in thermally stratified storage tanks. The density gradient field as an intermediate result during the evaluation of the temperature field can be used to indicate convective structures that are in good agreement to the measured velocity fields. Full article
(This article belongs to the Special Issue Optical Diagnostics in Engineering)
Show Figures

Figure 1

19 pages, 4468 KiB  
Article
On the Impact of Subaperture Sampling for Multispectral Scalar Field Measurements
by Christopher J. Clifford and Brian S. Thurow
Optics 2020, 1(1), 136-154; https://doi.org/10.3390/opt1010010 - 19 Mar 2020
Cited by 1 | Viewed by 2366
Abstract
The novel 3D imaging and reconstruction capabilities of plenoptic cameras are extended for use with continuous scalar fields relevant to reacting flows. This work leverages the abundance of perspective views in a plenoptic camera with the insertion of multiple filters at the aperture [...] Read more.
The novel 3D imaging and reconstruction capabilities of plenoptic cameras are extended for use with continuous scalar fields relevant to reacting flows. This work leverages the abundance of perspective views in a plenoptic camera with the insertion of multiple filters at the aperture plane. The aperture is divided into seven regions using off-the-shelf components, enabling the simultaneous capture of up to seven different user-selected spectra with minimal detriment to reconstruction quality. Since the accuracy of reconstructed features is known to scale with the available angular information, several filter configurations are proposed to maintain the maximum parallax. Three phantoms inspired by jet plumes are simulated onto an array of plenoptic cameras and reconstructed using ASART+TV with a variety of filter configurations. Some systematic challenges related to the non-uniform distribution of views are observed and discussed. Increasing the number of simultaneously acquired spectra is shown to incur a small detriment to the accuracy of reconstruction, but the overall loss in quality is significantly less than the gain in spectral information. Full article
(This article belongs to the Special Issue Optical Diagnostics in Engineering)
Show Figures

Figure 1

22 pages, 5322 KiB  
Article
Volumetric Calibration Refinement of a Multi-Camera System Based on Tomographic Reconstruction of Particle Images
by Christoph Bruecker, David Hess and Bo Watz
Optics 2020, 1(1), 114-135; https://doi.org/10.3390/opt1010009 - 03 Mar 2020
Cited by 4 | Viewed by 3653
Abstract
The calibration of a multi-camera system for volumetric measurements is a basic requirement of reliable 3D measurements and object tracking. In order to refine the precision of the mapping functions, a new, tomographic reconstruction-based approach is presented. The method is suitable for Volumetric [...] Read more.
The calibration of a multi-camera system for volumetric measurements is a basic requirement of reliable 3D measurements and object tracking. In order to refine the precision of the mapping functions, a new, tomographic reconstruction-based approach is presented. The method is suitable for Volumetric Particle Image Velocimetry (PIV), where small particles, drops or bubbles are illuminated and precise 3D position tracking or velocimetry is applied. The technique is based on the 2D cross-correlation of original images of particles with regions from a back projection of a tomographic reconstruction of the particles. The off-set of the peaks in the correlation maps represent disparities, which are used to correct the mapping functions for each sensor plane in an iterative procedure. For validation and practical applicability of the method, a sensitivity analysis has been performed using a synthetic data set followed by the application of the technique on Tomo-PIV measurements of a jet-flow. The results show that initial large disparities could be corrected to an average of below 0.1 pixels during the refinement steps, which drastically improves reconstruction quality and improves measurement accuracy and reliability. Full article
(This article belongs to the Special Issue Optical Diagnostics in Engineering)
Show Figures

Figure 1

17 pages, 2778 KiB  
Article
Synthesizing General Electromagnetic Partially Coherent Sources from Random, Correlated Complex Screens
by Milo W. Hyde IV
Optics 2020, 1(1), 97-113; https://doi.org/10.3390/opt1010008 - 01 Mar 2020
Cited by 6 | Viewed by 2251
Abstract
We present a method to generate any genuine electromagnetic partially coherent source (PCS) from correlated, stochastic complex screens. The method described here can be directly implemented on existing spatial-light-modulator-based vector beam generators and can be used in any application which utilizes electromagnetic PCSs. [...] Read more.
We present a method to generate any genuine electromagnetic partially coherent source (PCS) from correlated, stochastic complex screens. The method described here can be directly implemented on existing spatial-light-modulator-based vector beam generators and can be used in any application which utilizes electromagnetic PCSs. Our method is based on the genuine cross-spectral density matrix criterion. Applying that criterion, we show that stochastic vector field realizations (corresponding to a desired electromagnetic PCS) can be generated by passing correlated Gaussian random numbers through “filters” with space-variant transfer functions. We include step-by-step instructions on how to generate the electromagnetic PCS field realizations. As an example, we simulate the synthesis of a new electromagnetic PCS. Using Monte Carlo analysis, we compute statistical moments from independent optical field realizations and compare those to the corresponding theory. We find that our method produces the desired source—the correct shape, polarization, and coherence properties—within 600 field realizations. Full article
Show Figures

Figure 1

9 pages, 3786 KiB  
Article
Solid State Optical Microlasers Fabrication via Microfluidic Channels
by Maurizio Manzo and Omar Cavazos
Optics 2020, 1(1), 88-96; https://doi.org/10.3390/opt1010007 - 01 Mar 2020
Cited by 4 | Viewed by 2391
Abstract
In this paper, we propose the use of a microfluidic channel with flow focusing technique to fabricate solid state polymeric microlasers to precisely control sizes for mass production. Microlasers are made from a solution of UV curable polymer, namely polyethylene glycol diacrylate (PEGDA) [...] Read more.
In this paper, we propose the use of a microfluidic channel with flow focusing technique to fabricate solid state polymeric microlasers to precisely control sizes for mass production. Microlasers are made from a solution of UV curable polymer, namely polyethylene glycol diacrylate (PEGDA) with a molecular weight of 700 and rhodamine 6G laser dye at two different volumetric ratios (polymer to dye) of 4:1 and 2:1, respectively, which are used as the dispersed phase. A reservoir filled with liquid polydimethylsiloxane (PDMS) was used to cure the microlasers via UV lamp. A microchannel made of (PDMS) and size of 200 µm was used in this paper; mineral oil was selected as the continuous phase. Two experiments are conducted by fixing the pressure flow for the dispersed phase to 188 mbar and 479.9 mbar, respectively. In both experiments, the pressure of the continuous phase (mineral oil) was varied between 1666.9 mbar and 1996.9 mbar. The measurement of the fabricated microlasers’ size was performed with the aid of the MATLAB Image Processing Toolbox by using photographs taken with a CMOS camera. The tunability of the highest size, ranging from 109 µm to 72 µm, was found for the PEGDA to dye ratio of 2:1 (188 mbar) and average standard deviation of 1.49 µm, while no tunability was found for the 4:1 ratio (188 mbar). The tunability of the microlaser’s size, ranging from 139 µm to 130 µm and an average standard deviation value of 1.47 µm, was found for the 4:1 ratio (479.9 mbar). The fabricated microlasers presented a quality factor Q of the order 104, which is suitable for sensing applications. This technique can be used to control the size of the fabrication of a high number of solid state microlaser based UV polymers mixed with laser dyes. Full article
(This article belongs to the Special Issue Fabrication and Applications of Photonic Micro-Devices)
Show Figures

Graphical abstract

17 pages, 5314 KiB  
Article
Micro- and Macro-Scale Measurement of Flow Velocity in Porous Media: A Shadow Imaging Approach for 2D and 3D
by Reza Sabbagh, Mohammad Amin Kazemi, Hirad Soltani and David S. Nobes
Optics 2020, 1(1), 71-87; https://doi.org/10.3390/opt1010006 - 25 Feb 2020
Cited by 10 | Viewed by 3708
Abstract
Flow measurement in porous media is a challenging subject, especially when it comes to performing a three-dimensional (3D) velocimetry at the micro scale. Volumetric flow measurement techniques such as defocusing and tomographic imaging generally involve rigorous procedures, complex experimental setups, and multi-part data [...] Read more.
Flow measurement in porous media is a challenging subject, especially when it comes to performing a three-dimensional (3D) velocimetry at the micro scale. Volumetric flow measurement techniques such as defocusing and tomographic imaging generally involve rigorous procedures, complex experimental setups, and multi-part data processing procedures. However, detailed knowledge of the flow pattern at the pore and subpore scales is important in interpreting the phenomena that occur inside the porous media and understanding the macro-scale behaviors. In this work, the flow of an oil inside a porous medium is measured at the pore and subpore scales using refractive index matching (RIM) and shadowgraph imaging techniques. At the macro scale, flow is measured using the particle image velocimetry (PIV) method in two dimensions (2D) to confirm the volumetric nature of the flow and obtain the overall flow pattern in the vicinity of the flow entrance and at the far field. At the micro scale, the three-dimensional (3D) flow within an arbitrary volume of the porous medium was quantified using 2D particle-tracking velocimetry (PTV) utilizing the law of conservation of mass. Using the shadowgraphy method and a single camera makes the flow measurement much less complex than the approaches using laser light sheets or multiple cameras with multiple viewing angles. Full article
(This article belongs to the Special Issue Optical Diagnostics in Engineering)
Show Figures

Graphical abstract

19 pages, 9633 KiB  
Article
Three-Dimensional Reconstruction of Evaporation-Induced Instabilities Using Volumetric Scanning Particle Image Velocimetry
by Mohammad Amin Kazemi, Janet A. W. Elliott and David S. Nobes
Optics 2020, 1(1), 52-70; https://doi.org/10.3390/opt1010005 - 16 Feb 2020
Cited by 1 | Viewed by 3226
Abstract
The three-dimensional (3D) flow below the interface of an evaporating liquid at a low pressure is visualized and quantified using scanning particle image velocimetry. The technique presented highlights the use of a single camera and a relatively fast moving laser sheet to image [...] Read more.
The three-dimensional (3D) flow below the interface of an evaporating liquid at a low pressure is visualized and quantified using scanning particle image velocimetry. The technique presented highlights the use of a single camera and a relatively fast moving laser sheet to image the flow for an application where using more than one camera is difficult. The technique allows collection of the full three-dimensional velocity vector map over the whole liquid volume. The out-of-plane component of the velocity has been determined using two different processing approaches: (i) deriving the full vector from a 3D cross-correlation of the particle volumes and (ii) applying the continuity equation to determine out-of-plane velocities from the calculated in-plane velocity vector fields. The results obtained from both methods showed good agreement with each other. The 3D velocity field reveals the existence of a torus shaped vortex below the evaporating meniscus that was induced by the exposure of the cold liquid to the warmer solid walls. The velocity data also shows that the maximum velocity occurs below the interface, not at the interface which highlights that the observed vortex is not driven by thermocapillary forces that usually govern the flow during evaporation at smaller scales. Full article
(This article belongs to the Special Issue Optical Diagnostics in Engineering)
Show Figures

Figure 1

12 pages, 1001 KiB  
Article
Simultaneous Stereo PIV and MPS3 Wall-Shear Stress Measurements in Turbulent Channel Flow
by Esther Mäteling, Michael Klaas and Wolfgang Schröder
Optics 2020, 1(1), 40-51; https://doi.org/10.3390/opt1010004 - 06 Jan 2020
Cited by 3 | Viewed by 2797
Abstract
An extended experimental method is presented in which the micro-pillar shear-stress sensor (MPS 3 ) and high-speed stereo particle-image velocimetry measurements are simultaneously performed in turbulent channel flow to conduct concurrent time-resolved measurements of the two-dimensional wall-shear stress (WSS) distribution and the velocity [...] Read more.
An extended experimental method is presented in which the micro-pillar shear-stress sensor (MPS 3 ) and high-speed stereo particle-image velocimetry measurements are simultaneously performed in turbulent channel flow to conduct concurrent time-resolved measurements of the two-dimensional wall-shear stress (WSS) distribution and the velocity field in the outer flow. The extended experimental setup, which involves a modified MPS 3 measurement setup and data evaluation compared to the standard method, is presented and used to investigate the footprint of the outer, large-scale motions (LSM) onto the near-wall small-scale motions. The measurements were performed in a fully developed, turbulent channel flow at a friction Reynolds number R e τ = 969 . A separation between large and small scales of the velocity fluctuations and the WSS fluctuations was performed by two-dimensional empirical mode decomposition. A subsequent cross-correlation analysis between the large-scale velocity fluctuations and the large-scale WSS fluctuations shows that the streamwise inclination angle between the LSM in the outer layer and the large-scale footprint imposed onto the near-wall dynamics has a mean value of Θ ¯ x = 16.53 , which is consistent with the literature relying on direct numerical simulations and hot-wire anemometry data. When also considering the spatial shift in the spanwise direction, the mean inclination angle reduces to Θ ¯ x z = 13.92 . Full article
(This article belongs to the Special Issue Optical Diagnostics in Engineering)
Show Figures

Figure 1

8 pages, 2782 KiB  
Article
A Triple Correlator of Radiation Intensities of a Multimode Semiconductor Laser
by Michael Lebedev, Andrey Demenev, Andrey Parakhonsky and Oleg Misochko
Optics 2020, 1(1), 32-39; https://doi.org/10.3390/opt1010003 - 11 Dec 2019
Cited by 1 | Viewed by 2459
Abstract
In this work, temporal correlations of radiation intensities of a multimode Fabry-Perot (FP) semiconductor laser are studied. Second- and third-order intensity correlation functions are measured both for the multimode FP laser and a pulsed Ti: Sapphire (TiSp) laser. Triple correlators of the latter [...] Read more.
In this work, temporal correlations of radiation intensities of a multimode Fabry-Perot (FP) semiconductor laser are studied. Second- and third-order intensity correlation functions are measured both for the multimode FP laser and a pulsed Ti: Sapphire (TiSp) laser. Triple correlators of the latter demonstrate an ordinary product of double correlators (the classic case). The behavior of the multimode laser is more complex and can indicate the quantum nature of optical field correlations. We follow a specific phenomenological formula for calculation of the triple temporal correlator. Full article
Show Figures

Figure 1

14 pages, 3006 KiB  
Article
Optical Properties of Alkali Halides in Ultraviolet Spectral Regions
by Khagendra P. Bhandari
Optics 2020, 1(1), 18-31; https://doi.org/10.3390/opt1010002 - 11 Dec 2019
Cited by 2 | Viewed by 3297
Abstract
The optical reflectance spectra of alkali halide crystals KI and RbI were measured over the energy range of 4.14 to 6.91 eV. Both single crystal and poly-crystal samples were used to accomplish this task. The phase θ ( ω ) was computed using [...] Read more.
The optical reflectance spectra of alkali halide crystals KI and RbI were measured over the energy range of 4.14 to 6.91 eV. Both single crystal and poly-crystal samples were used to accomplish this task. The phase θ ( ω ) was computed using the Kramers-Kronig relation between the real and imaginary parts of the complex function, ln r = ln | r | + i θ ( ω ) . Subsequently, the optical constants n and κ were determined from the Fresnel reflectivity equation. The real and imaginary parts of dielectric constants ε 1 and ε 2 were then calculated using n and κ. The optical absorption spectra of the crystal have also been measured in these spectral regions. The spectra agree reasonably well with the current theory concerning exciton peaks. In addition, a shoulder was found in the spectra similar to those previously seen and associated with the band-to-band transition in the alkali iodides. Full article
Show Figures

Figure 1

17 pages, 4192 KiB  
Article
Investigation of Five Organic Dyes in Ethanol and Butanol for Two-Color Laser-Induced Fluorescence Ratio Thermometry
by Yogeshwar Nath Mishra, Ajeth Yoganantham, Matthias Koegl and Lars Zigan
Optics 2020, 1(1), 1-17; https://doi.org/10.3390/opt1010001 - 11 Dec 2019
Cited by 17 | Viewed by 4250
Abstract
In this article, we compare absorption and temperature-dependent fluorescence spectra of five organic dyes for 2c-LIF (two-color laser-induced fluorescence) thermometry in ethanol and butanol. The dyes fluorescein, eosin Y, rhodamine B, rhodamine 6G, and sulforhodamine 101 individually mixed in ethanol and butanol were [...] Read more.
In this article, we compare absorption and temperature-dependent fluorescence spectra of five organic dyes for 2c-LIF (two-color laser-induced fluorescence) thermometry in ethanol and butanol. The dyes fluorescein, eosin Y, rhodamine B, rhodamine 6G, and sulforhodamine 101 individually mixed in ethanol and butanol were studied at liquid temperatures of 25–65 °C. The self-absorption spectral bands are analyzed along with intensity ratios and the respective sensitivities for one-dye and two-dye 2c-LIF thermometry are deduced. For one-dye 2c-LIF, rhodamine B showed the highest sensitivity of 2.93%/°C and 2.89%/°C in ethanol and butanol, respectively. Sulforhodamine 101 and rhodamine 6G showed the least sensitivities of 0.51%/°C and 1.24%/°C in ethanol and butanol, respectively. For two-dye 2c-LIF, rhodamine B/sulforhodamine 101 exhibited the highest temperature sensitivities of 2.39%/°C and 2.54%/°C in ethanol and butanol, respectively. The dye pair eosin Y/sulforhodamine 101 showed the least sensitivities of 0.15%/°C and 0.27%/°C in ethanol and butanol, respectively. Full article
(This article belongs to the Special Issue Optical Diagnostics in Engineering)
Show Figures

Figure 1

Next Issue
Back to TopTop