Abstract
This research addresses the complex challenge of integrating modern public transport into historic medieval city centers. These unique urban environments are characterized by narrow streets, protected heritage status, and topographical constraints, which are incompatible with conventional transit vehicles. The introduction of standard bus routes often aggravates traffic congestion and fails to meet the specific mobility needs of residents and visitors. This paper suggests that autonomous electric buses represent a viable and sustainable solution, capable of navigating these constrained environments while aligning with modern energy efficiency goals. The central challenge lies in the optimal selection of an autonomous electric bus that can operate safely and efficiently within the tight streets of historic city centers while satisfying the travel demands of passengers. To address this, a comprehensive study was conducted, analyzing resident mobility patterns—including key routes and hourly passenger loads—and the specific geometric constraints of the road network. Based on this empirical data, a vehicle dynamics model was developed in Matlab®. This model simulates various operational scenarios by calculating the instantaneous forces (rolling resistance, aerodynamic drag, inertial forces) and the corresponding power required for different electric bus configurations to follow pre-established speed profiles. The core of this research is an optimization analysis, designed to identify the balance between minimizing total energy consumption and maximizing the quality of passenger service. The findings provide a quantitative framework and clear procedures for urban planners to select the most suitable autonomous transit system, ensuring that the chosen solution enhances mobility and accessibility without compromising the unique character of historic cities.
1. Introduction
Autonomous vehicles (AVs) are of significant interest to the public transport sector due to their potential to revolutionize urban mobility. Their implementation promises several benefits that address many of the challenges in city transit, including operational efficiency through optimized routes and continuous service, enhanced safety by mitigating human error, and improved accessibility for individuals with mobility limitations. Furthermore, the transition to autonomous transit systems presents opportunities for reduced operational costs by eliminating driver expenses and optimizing energy consumption, which in turn reduces the environmental impact by decreasing greenhouse gas emissions and air pollution.
However, for a large portion of European cities, the integration of modern transport solutions is severely constrained by historic infrastructure. Many urban centers, particularly those with medieval origins, are characterized by narrow streets, protected heritage buildings, and dense populations. These environments were not designed for contemporary vehicle traffic, and the introduction of standard-sized buses often leads to severe traffic congestion, inefficient service, and a deterioration of the urban scenery. This creates a fundamental conflict between the mobility needs of citizens and the preservation of cultural heritage.
Technical and economic effectiveness of transport systems on the basis of autonomous cars is a barrier to mass adoption and integration into existing public transport networks. Further data from different European cities are needed to close gaps in the integration of electric cars into transport services. Another barrier is data protection and privacy (vulnerability to cyberattacks that pose risks to users and operators). Experimental data on the danger of cyberattacks would be a body of evidence from pilot projects adding AVs to old cities. Such data would form the basis of deciding remedies to counter such threats. There are loopholes in European law addressing the use and ownership of autonomous cars as well. These legislative uncertainties complicate the integration of AVs into existing transportation infrastructure (problem of civil liability in the case of accidents—legislation in every European state). Lack of proper data and studies on adaptation by users to the autonomous vehicle transportation system is an incomplete link to popularization of such transportation systems. It will take a long period before users would fully trust the transport service with Autonomous Vehicles (integration and acceptance problems). The solution is to automate public transport step by step so that users would get used to and trust the services. Statistics would drastically reduce the time spent in accepting and integrating AVs in ancient cities [1].
Problems of implementing AVs in transport services are explored in projects and publications. There are data on: period of car life; location map of implementation cities; power supply systems; Users; adaptation of public transport services; national legislation and policies; rush hour speed [2].
There are also needs for data gaps in optimal balance among vehicle size, passenger capacity, and service frequency to achieve maximum energy efficiency as well as maximum passenger satisfaction. There are also needs for data gaps in the features needed to enable an autonomous vehicle to drive efficiently in a historic city center.
In this context, the deployment of compact, autonomous electric buses emerges as a promising solution. This paper explores the operability and viability of such a system by addressing several key questions:
- What are the critical physical and operational characteristics required for an autonomous vehicle to navigate a historic city center effectively?
- Do existing autonomous vehicle technologies adequately address these unique challenges?
- What is the optimal balance between vehicle size, passenger capacity, and service frequency to maximize both energy efficiency and passenger satisfaction?
The scientific literature and existing pilot projects indicate that for successful operation in constrained environments, AVs must possess compact dimensions to minimize congestion, as well as superior maneuverability enabled by advanced steering systems. This, however, introduces a critical optimization problem: is it more effective to deploy a larger AV that meets the maximum dimensional limits of the infrastructure but operates at a low frequency, or to use smaller AVs that run at a higher frequency? Answering this question requires a multi-objective analysis that weighs criteria such as energy consumption, operational costs, and passenger service quality.
Technologically, the safe operation of these vehicles is very important. The deployment of AVs in pedestrian-heavy zones necessitates a sophisticated and redundant sensor suite—including lidar, radar, and cameras—to ensure complete perception of the surrounding environment, even in adverse conditions. To align with sustainability goals, an electric propulsion system is the preferred choice, requiring sufficient battery autonomy and fast-charging capabilities to meet the demands of public transport routes. Operationally, this is supported by precise navigation, V2X (Vehicle-to-Everything) communication, and seamless integration with existing transit networks.
To ground this research in a real-world scenario, the city of Brașov, Romania, was selected as a case study. Brașov’s historic center, originating in the 14th century, retains its medieval street plan, which now serves as a major tourist destination and a critical transit zone for approximately 10,000 residents. The area contains roadways and intersections that are too narrow for conventional public or private transport, creating significant traffic bottlenecks and limiting mobility (Figure 1a—narrow streets, Figure 1b—Piața Unirii intersection).
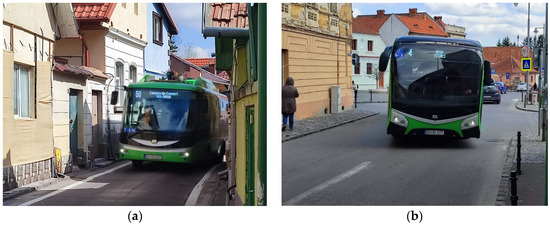
Figure 1.
Narrow streets of Brașov city (a) Pe Tocile St., the bus has difficulty squeezing through the houses; (b) Piata Unirii intersection, the bus turning right at 90 degrees violates the lane in the opposite direction of travel.
To address the primary purpose of this work, the following operational objectives have been established:
- Identify the required vehicle dimensions and maneuverability for a specific route.
- Evaluate the impact on existing infrastructure and traffic flow.
- Model and compare the energy consumption of different vehicle configurations.
- Propose a solution that resolves the transport needs of the area’s inhabitants.
This paper is structured as follows: Section 2 presents the current state of the art in the field. Section 3 details the work methodology, including the identification of key vehicle characteristics and the criteria for comparison. Section 4 is dedicated to the simulation and data analysis. Finally, Section 5 presents a discussion of the results, followed by conclusions and recommendations.
2. State of the Art
2.1. Autonomous Vehicle Technology
Autonomous vehicles are built on three technological pillars that enable their autonomy: advanced sensor systems for perception, precise navigation and mapping technologies for localization, and decision-making and control algorithms for action.
2.1.1. Sensor Systems
The sensor systems of an autonomous vehicle enable it to perceive and interpret its surroundings in real-time. These sensors gather multi-dimensional data used for localization, object detection, and tracking.
- LiDAR (Light Detection and Ranging) systems use laser pulses to generate dense, three-dimensional point clouds, providing precise spatial data about surrounding objects. Recent studies by Yuan et al. [3] demonstrate how LiDAR data fusion improves object recognition and depth estimation, particularly under poor lighting conditions. However, the cost of LiDAR and its performance in adverse weather remain active research topics [4].
- Radar systems are highly effective for long-range object detection and velocity estimation, proving especially useful in conditions of poor visibility such as rain or fog. Operating in the millimeter-wave spectrum, they are less sensitive to environmental interference. Newer 4D radar systems enhance spatial resolution, supporting more robust object tracking in complex, multi-object scenarios [5,6].
- Cameras are indispensable for tasks requiring semantic interpretation, such as traffic light detection, lane marking identification, and traffic sign recognition. Monocular, stereo, and fisheye camera arrays are commonly mounted around the vehicle to provide a 360-degree visual field. Deep learning models are widely used for object detection and classification from visual inputs [7,8].
The fusion of data from these diverse sensors is critical for robust performance. Sensor fusion frameworks—ranging from traditional Kalman filtering to advanced deep fusion networks—enable the system to synthesize multiple data streams for greater accuracy, resilience, and redundancy [9].
2.1.2. Navigation and Mapping Technologies
Navigation and localization systems are important for guiding the vehicle’s movement by determining its precise position and path within the environment.
- GPS (Global Positioning System) is a foundational technology, but its standard accuracy of approximately five meters is inadequate for the lane-level navigation required by AVs. Augmenting GPS with Inertial Measurement Units (IMUs) and Real-Time Kinematic (RTK) positioning can reduce error margins to centimeter levels.
- HD Maps (High-Definition Maps) are highly detailed, multi-layered digital representations of the road network that include semantic elements like curbs, traffic signs, and crosswalks. They are essential for predictive path planning and precise vehicle localization [10,11].
- SLAM (Simultaneous Localization and Mapping) algorithms allow AVs to build and update maps in real-time while navigating, which is critical for operation in unknown or dynamically changing areas. Visual SLAM and LiDAR SLAM are the most studied variants [12,13].
Hybrid approaches that combine global positioning, local odometry, and pre-built HD maps provide the most robust navigation solution, particularly in complex urban environments.
2.1.3. Decision-Making and Control Algorithms
Decision-making systems coordinate autonomous vehicles’ responses to a complex and dynamic environment, including route planning, behavioral modeling, and motion control.
- Path Planning in modern AVs typically uses a hierarchical framework. Global planners determine the overall route to a destination, while local planners calculate safe, collision-free trajectories in the immediate vicinity. Algorithms such as Hybrid A*, D*, and RRT* are widely used for generating smooth, drivable paths [14].
- Behavior Planning involves context-aware decision-making under uncertainty. Methodologies such as Finite State Machines (FSMs), Partially Observable Markov Decision Processes (POMDPs), and reinforcement learning models are deployed to select appropriate driving behaviors in response to traffic conditions and interactions with other road users [15,16].
- Control Systems transform planned trajectories into real-time steering, acceleration, and braking commands. Model Predictive Control (MPC), Linear Quadratic Regulators (LQR), and PID controllers are extensively used for longitudinal and lateral vehicle control. Research indicates that MPC is particularly effective for managing constraints related to road curvature and vehicle dynamics [17,18].
An emerging trend is the development of end-to-end learning models, where perception, planning, and control are jointly optimized within a single neural network [19]. However, the safety validation and interpretability of these systems remain significant ongoing challenges.
2.2. Urban Mobility and Public Transport
Urban mobility is undergoing a significant transformation driven by rapid urbanization, technological advancements, and evolving societal expectations. Historic city centers, such as that of Brașov, face a unique set of challenges related to infrastructure limitations and heritage preservation. In these contexts, the demand for efficient connectivity and the integration of emerging technologies like autonomous vehicles have become critical components of modern urban transport strategies.
Deploying AVs in public transit settings is challenging, especially in dense urban environment with mixed traffic, regulatory constraints, and safety expectations [20]. Several projects now operate at Level 4 (without driver) or Level 3 (supervised autonomy) in controlled areas or geofenced corridors. These pilots explore use cases including shuttles, feeders, and integrated network augmentation. The most important project, AVENUE (in France, Luxembourg, Italy and United Kingdom) deployed automated buses in four European cities, using shared, electric autonomous shuttles integrated into urban transport networks. It studied user acceptance, operations in mixed traffic, and safety protocols [21]. Cities like Lyon (France), Helsingborg (Sweden), and Berlin have tested the NAVYA project or EasyMile autonomous shuttles on short fixed routes. These vehicles typically carry 8 to 12 passengers, run at low speeds (less than 25 km/h), and operate in controlled conditions (e.g., separated lanes, pedestrian zones) [22]. Another project, LogiSmile, exemplifies AV deployment in urban logistics. It pilots autonomous delivery vehicles in European cities to optimize last mile flows, which has parallels for AV public transport [23].
High-definition maps, reliable localization, and V2X (vehicle-to-infrastructure) communication are essential. Pilots require roadway modifications or sensor infrastructure to support AV operations. Low speeds, limited range, and cautious acceleration are common constraints. Many pilots restrict AVs to controlled conditions or off-peak hours to minimize risk. Pilots are expensive, require specialized oversight, and often rely on subsidies or research funding. Scaling to full public transport networks is still aspirational. Despite challenges, pilots provide valuable lessons in human–machine interaction, system reliability, and incremental integration.
2.2.1. Challenges of Public Transport in Historical City Centers
Historical urban cores are characterized by narrow streets, strict heritage preservation requirements, and high pedestrian density. These constraints often prevent the implementation of large-scale public transport infrastructure [24]. Traditional buses and trams may be too large or disturbing for these settings, leading to traffic congestion, inefficient service, and accessibility issues. In many European cities, attempts to retrofit transit systems in historical centers have created conflicts between mobility demands and conservation efforts [25]. Furthermore, issues of traffic congestion, air pollution, and noise are amplified in these dense areas. Researchers like Banister [26] argue that urban sustainability in such areas depends on shifting from car-dominant paradigms to integrated, low-impact transport solutions.
2.2.2. Existing Solutions for Last-Mile Connectivity
Last-mile connectivity refers to the final part of a journey from a transit hub to a destination. This is a persistent barrier in achieving door-to-door mobility, particularly in cities with fragmented networks. According to [27], shared mobility services, such as bike-sharing, e-scooters, and demand-responsive shuttles, offer scalable last-mile options. The integration of active transport (walking and cycling) with mass transit improves both health and environmental outcomes [28]. Transit-oriented development (TOD) strategies that prioritize walkable neighborhoods and mixed land use have been shown to reduce last-mile barriers [29].
Digital platforms that enable multimodal trip planning and ticketing, like Mobility-as-a-Service (MaaS), are also key enablers. Studies in Helsinki and Vienna have demonstrated the potential of MaaS in reducing car dependency by streamlining travel experiences [30].
2.2.3. Studies on the Integration of Autonomous Vehicles in Urban Environments
Autonomous vehicles are increasingly seen as a transformative force in urban mobility. Their deployment in shared public transport modes, such as the autonomous shuttle pilots in cities like Lyon, Las Vegas, and Geneva, has demonstrated their potential [31]. Research indicates that shared AVs could enhance safety, reduce operational costs, and support low-emission mobility if properly integrated with public transport networks [32]. However, concerns regarding curb management, drop-off positions, safe interaction with pedestrians in crowded zones, and data control remain unresolved. Studies emphasize that policy frameworks must promote inclusive design and ensure that autonomous vehicle deployment complements, rather than competing with existing mass transit systems [33].
2.3. Urban Planning and Infrastructure
The introduction of autonomous vehicles into urban environments has the potential to significantly reshape city planning, infrastructure, and transportation policies. The integration of AVs necessitates changes in urban areas, such as a reduced need for parking, which could alter land use and support economic growth.
2.3.1. The Impact of Autonomous Vehicles on Street Design and Traffic Flow
AVs necessitate a rethinking of traditional street layouts. Their capacity for precise navigation and responsive driving behaviors may allow for narrower lanes and reduced spacing between vehicles, potentially reclaiming urban space for pedestrians, cyclists, and green infrastructure [34]. In terms of traffic flow, AVs are expected to reduce congestion by maintaining consistent speeds and minimizing reaction time delays. Coordinated AV movements can mitigate bottlenecks and optimize traffic signal performance [33]. However, the overall impact depends heavily on the ownership model; privately owned AVs may increase vehicle kilometers traveled (VKT), whereas shared autonomous vehicles (SAVs) can support more efficient usage patterns. Infrastructure sensors, vehicle-to-everything (V2X) communication, and dynamic signage are also likely to become integral to future street design, requiring digital as well as physical infrastructure planning [31].
2.3.2. Challenges in Adapting Existing Infrastructure
Legacy infrastructure was not designed for autonomous navigation. Retrofitting roads, intersections, and signage to accommodate AVs presents significant logistical and financial challenges, especially in historic urban areas where physical alterations are often restricted [32]. Planners must also manage the transitional period where AVs and conventional vehicles share the road, a mixed-traffic environment that poses safety and predictability challenges [35]. Furthermore, the operational dependence of AVs on high-definition maps and real-time data highlights the need for robust ICT infrastructure, making the deployment of 5G and edge computing critical for enabling low-latency data exchange [36].
2.3.3. Regulations and Policies for the Implementation of Autonomous Vehicles
The policy environment surrounding AVs is still evolving. Key considerations include data privacy, cybersecurity, insurance liability, and the ethical frameworks governing decision-making algorithms. Establishing clear lines of accountability in the event of an accident is one of the most pressing legal challenges [37]. Successful implementation requires close coordination among transport authorities, technology providers, and the public to ensure that the benefits of autonomous mobility are distributed equitably [33].
In June 2022, Regulation (EU) 2022/2236 [38] on the technical requirements for vehicles produced in unlimited series, also integrated autonomous vehicles produced in small series and special-purpose vehicles, and the specifications on the software update.
Regulation (EU) 2022/1426 entered into force on 5 August 2022 [39]. It lays down detailed rules for the application of Regulation (EU) 2019/2144 proposed by the European Parliament and the Council of the European Union laying down the procedures and technical specifications for the approval of automated driving systems (ADS) for autonomous vehicles [40].
According to the mentioned regulations, three autonomous vehicle architectures were considered:
- -
- Dual vehicles: manual driving and fully automated driving.
- -
- Fully automated vehicles of categories N1, N2, N3, M1, M2, M3 without a driver’s seat, with passengers.
- -
- Fully automated vehicles in categories N1, N2 and N3 without driver seat and without occupants.
Cybersecurity and Software Updates legislation articles are as follows:
- -
- UNECE Reg. 155 [41] for the approval of vehicles with regard to cybersecurity and the cybersecurity management system.
- -
- UNECE Reg. 156 [42] for the approval of vehicles with regard to the software update management system.
Deployment of ITS legislation articles are as follows:
- -
- Directive 2010/40/EU of the European Parliament and of the Council of 7 July 2010 [43] governing the framework for the deployment of intelligent transport systems in road transport and for interfaces with other modes of transport.
- -
- 2017/2380 Decision amending Directive 2010/40/EU [44]. The decision requires compliance with the specifications necessary to ensure compatibility, interoperability and continuity of the deployment and operational use of Intelligent Transport Systems for priority actions for a further period of five years starting with 27 August 2017.
2.4. Social Acceptance and User Experience of Autonomous Vehicles as Means of Transport
The social integration of autonomous vehicles requires not only technological maturity but also public perception, user expectations, and equitable access. Following studies and theoretical models from transport psychology and human–computer interaction, this section examines public attitudes, behavioral intentions, and inclusivity concerns related to autonomous public transport.
2.4.1. Public Perception of Autonomous Vehicle Technology
Public perception plays a pivotal role in the adoption and policymaking surrounding autonomous vehicle technologies. According to [45], surveys indicate that while many respondents express cautious optimism, they remain concerned about safety, cybersecurity, and the loss of human control. Trust in autonomous vehicles often varies by demographic, with younger populations and individuals with higher technological literacy being more open to the concept [46].
Media portrayals and real-world testing incidents significantly influence attitudes. For instance, a study by Nordhoff [47] shows that direct exposure to autonomous vehicles, such as riding in a pilot shuttle, improves trust and willingness to adopt. Similarly, Kyriakidis [48] found that the willingness to use autonomous vehicles increases when users are provided with comprehensive information about the system’s limitations and operational procedures.
Socio-cultural factors also impact acceptance. In collectivist cultures, trust in governmental oversight may correlate with higher acceptance levels [49], whereas in others, concerns about personal safety and freedom of choice dominate perceptions. Public education campaigns, interactive demonstrations, and transparent communication regarding AV capabilities and limitations are essential for building long-term public confidence. Additionally, the perceived value of AVs in improving safety, reducing traffic congestion, and providing mobility to underserved populations plays a significant role in getting public support [50].
2.4.2. User Needs and Expectations for Public Transportation Using Autonomous Vehicles
Understanding user expectations is critical to developing autonomous vehicle-based public transport systems that are user-centric, efficient, and widely accepted. According to Kröger [51], key user expectations include reliability and punctuality, affordable pricing, seamless integration with existing transport modes, and safe operation in mixed-traffic conditions. In a cross-national study, Haboucha [52] found that many users prefer autonomous vehicles when they enhance comfort, reduce travel-related stress, and improve time efficiency. Preferences for shared versus private AVs differ based on factors such as income level, urban density, and commuting patterns [53].
Users are particularly sensitive to how autonomous vehicles handle dynamic environments, such as interactions with pedestrians and cyclists. Perceived competence in such scenarios significantly affects user confidence [54]. Moreover, trust is influenced by human–machine interaction features, such as voice interfaces, visual feedback, and emergency override options [55]. For AVs to become a mainstream public transport option, they must also support intermodal travel planning, facilitate digital payment systems, and provide real-time updates.
2.4.3. Accessibility and Inclusion Considerations
To ensure the equitable distribution of benefits from AV technology, systems must be designed with inclusiveness as a core principle. Autonomous public transport holds significant potential for increasing mobility for people with disabilities, the elderly, and those in underserved areas. However, early deployments have shown that inclusion is often an afterthought in AV development [56].
Designing AVs for accessibility requires adherence to universal design principles, including low-floor boarding, tactile surfaces, auditory announcements, visual cues, and user-friendly applications that support multiple languages and accessibility settings [57]. Furthermore, inclusive service planning must address spatial and temporal coverage to ensure that AVs serve low-income neighborhoods and operate outside of peak hours. Regulatory mandates should guide public-sector AV investments to promote transport equity [58]. Community co-design and stakeholder engagement are crucial for enhancing inclusivity, ensuring that AV services address diverse needs and foster a sense of public ownership [31,59].
2.5. Dimensions and Maneuverability of Electric Buses
Electric buses (e-buses) are central to the transition toward cleaner and more sustainable urban transport. This section addresses the critical issues of vehicle dimensions and maneuverability, the use of articulated or modular structures, and the inherent advantages of electric propulsion in reducing urban noise and emissions.
2.5.1. Optimal Bus Width and Turning Radius
The physical dimensions of electric buses significantly influence their operability within constrained city streets. The optimal width of a bus typically ranges from 2.4 to 2.6 m, which provides sufficient interior space for passengers while maintaining compatibility with standard traffic lanes [60]. Buses that exceed this range can face difficulties in older urban districts with narrow roads.
Turning radius is another critical factor, especially in dense cities with tight intersections. Highway and street design vehicles standard [61] gives the typical dimensions for all types of transport vehicles. Standards for turning radius can vary depending on the effective radius of each bus and other factors, such as whether a bicycle lane or parking lane is available, or if traffic volumes are so low as to allow transit vehicles to make full use of either departure or receiving lanes.
Ref. [45] According to [61], a typical 12 m standard bus requires a turning radius of around 12 m, though modern steering systems and electric drive configurations allow tighter turning capabilities.
Small electric buses, typically 6 to 8 m in length, are increasingly deployed on low-demand routes and in areas with narrow streets, such as historic districts. Their compact dimensions allow for a much tighter turning radius (often less than 8 m), making them ideal for first- and last-mile connections where full-size buses are impractical. Electric powertrains offer advantages in weight distribution and vehicle architecture, which can enhance maneuverability. A study by [62], Gori shows that the placement of electric drive units can lower the center of gravity, improve stability, and increase turning efficiency.
2.5.2. Considerations Regarding Articulation and Modularity
Articulated and modular bus configurations are increasingly used to manage growing urban transit demands. Articulated buses, often exceeding 18 m in length, offer higher passenger capacity without a proportional increase in their operational footprint. They typically include a flexible joint and multiple axles to help navigate tighter turns.
Modularity in bus design allows for a more adaptable fleet composition, with configurations that can include interchangeable power modules, battery packs, or passenger units, as outlined by [47].
Both articulated and modular designs must balance capacity, energy efficiency, and drivability. Electric articulation systems benefit from precise torque control and regenerative braking systems, enhancing stability in curves and during deceleration [60].
Recent developments in small bus design include modular chassis systems that allow the same base vehicle to serve multiple purposes, from passenger shuttle to cargo transport. This is particularly advantageous for cities seeking multipurpose fleets and cost efficiency [63].
2.5.3. Electric Propulsion for Reduced Noise and Emissions
A primary advantage of electric propulsion in public transport is the significant reduction in noise and emissions. Unlike internal combustion engine (ICE) buses, e-buses generate minimal operational noise, especially at low speeds, which improves the urban soundscape [64]. The elimination of tailpipe pollutants, such as nitrogen oxides (NOx) and particulate matter (PM), is crucial for improving air quality in congested city centers. According to [65], when paired with clean electricity sources, the shift to e-buses can reduce local emissions by over 90%.
Electric drivetrains also support smoother acceleration and deceleration, which reduces mechanical wear and enhances rider comfort, contributing to a longer service life and lower operational costs, as confirmed by case studies from the European Clean Bus Deployment Initiative [66]. Small electric buses are especially valuable in cities with environmental protection zones, where noise and air quality standards are most stringent. Their low operational weight and battery consumption contribute to energy efficiency and extended range, making them suitable for inner-city loops and community transport [60].
3. Materials and Methods
3.1. Assessing European Urban Contexts for Narrow-Street Electric Buses Deployment
European cities with historic, narrow street networks offer valuable real-world laboratories for testing and deploying autonomous public transport due to their inherent spatial constraints and high pedestrian presence. Prototypical environments for such a deployment include the historic centers of Lucca, Italy; the canalized roads of Bruges, Belgium; the winding alleyways of Toledo, Spain; and the heritage districts of Salzburg, Austria. The selection of a representative city for a case study must, however, be based on a strategic and evidence-based framework.
3.1.1. Criteria for Selecting a Representative European City with Narrow Streets
To ensure the relevance and broader applicability of the findings, the selection of a city for piloting autonomous electric buses should be guided by several core criteria:
(a) Historical urban fabric: The city should feature a well-preserved historic urban form with a compact street grid and narrow passages that challenge conventional vehicle navigation [67] (b) Street width profile: The city must have a significant number of streets, particularly in central areas, that are narrower than 3.5 m, thereby necessitating the use of smaller, more agile vehicles [24]. (c) Transport system maturity: An ideal candidate will have an established yet flexible public transport system that can support the integration of a new autonomous service [29]. (d) Supportive policy environment: The city should demonstrate a commitment to sustainable mobility through policies such as Low Emission Zones (LEZs) or congestion charging [68]. (e) Demographic and pedestrian considerations: high-density pedestrian areas, particularly in cities with significant tourist influxes or aging populations, stand to benefit most from quiet, zero-emission transport modes [26].
3.1.2. Archetype of a Suitable European City: Lucca, Italy
The city of Lucca, Italy, offers a compelling archetype of a European city suitable for narrow-street autonomous bus deployment. Its characteristics provide a representative model for identifying similar locations:
- Urban morphology: the inner city is defined by its Renaissance-era walls and a network of compact streets, many of which are less than 3 m wide. Cobblestone surfaces and historic building facades limit infrastructural modifications, requiring vehicle-based innovation [69].
- Traffic regulations: the city enforces a Limited Traffic Zone (Zona a Traffico Limitato—ZTL), which restricts car access and prioritizes pedestrians, bicycles, and electric minibuses [70].
- Mobility demand and flow; as a UNESCO cultural heritage site, Lucca receives large numbers of seasonal tourists. Daily pedestrian counts within the city center frequently exceed 10,000 in peak months. This creates a clear demand for small-scale, quiet transit that complements foot traffic without disrupting the historical ambiance [71].
- Policy and planning alignment; Lucca’s inclusion in Tuscany’s Sustainable Urban Mobility Plan (SUMP) positions it as a forward-thinking municipality focused on multimodal, clean transport solutions.
- AV readiness: Lucca already operates a fleet of electric minibuses on its narrowest routes. The city has also begun implementing intelligent traffic systems and vehicle-to-infrastructure (V2I) trials, suggesting a strong readiness for limited-autonomy operations within its geofenced ZTL [69].
Together, these characteristics make Lucca not only representative of many compact European cities but also an ideal candidate for deeper research and experimentation with next-generation electric and autonomous public transport systems.
3.2. Case Study: Brașov, Romania
3.2.1. Description of the Study Area: Urban Planning and Road Infrastructure
As outlined in the introduction, the historic center of Brașov was chosen for this case study due to its significant infrastructural challenges. The area concentrates numerous functions, serving as a hub for administrative, educational, cultural, commercial, and tourism activities [72] which generates significant pedestrian and vehicular traffic.
The geometric particularities of the street network reflect the city’s medieval origins (Figure 2). The Prund-Șchei district and the Old Center are characterized by a traditional, irregular street grid with narrow profiles, which is not favorable to modern traffic volumes. The core of the historic center is managed by a one-way ring system that utilizes a series of collector streets (e.g., Mureșenilor Street, Poarta Șchei Street, Castelului Street) to facilitate traffic flow. Public transport currently operates on these streets, where speeds are limited to 30 km/h. However, the network’s capacity is insufficient.
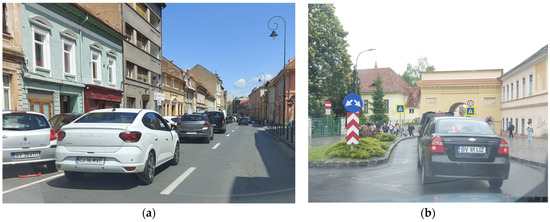
Figure 2.
Brasov’s old (historical) center: (a) Parking of vehicles on the second lane on N. Balcescu Street; (b) Poarta Schei area with a roundabout near a secondary school.
The main dysfunction in this area arises from the conflict between vehicular traffic and pedestrian activity. On key streets open to cars, such as Poarta Șchei and Castelului, the sidewalks are dangerously narrow. This forces pedestrians into close proximity with moving vehicles, creating safety risks and degrading the quality of the urban environment, particularly given the area’s significant role as a tourist and leisure destination.
3.2.2. Analysis of Road Flows in the Implementation Area
To enhance the quality of life for urban residents in line with European Union standards, the challenges posed by the transport sector must be systematically assessed and addressed. The primary objectives of sustainable urban mobility—improving accessibility, safety, economic efficiency, and environmental quality—serve as the guiding principles for this analysis. Sustainable transport includes not only vehicles and energy but also the infrastructure and operational logistics that support them. Its success is measured by the efficiency of the transport system and its overall environmental impact.
Any modifications to public transport networks or the implementation of new services must be grounded in rigorous analysis, including traffic studies, impact assessments, and feasibility studies, while also aligning with regional development strategies and sustainable urban mobility plans.
In the context of Brașov, traffic flow in and around the historic Old Center is a significant and persistent problem. During the morning, noon, and evening peak hours, the area experiences high volumes of vehicular traffic. The concentration of public institutions, educational facilities, tourist attractions, and commercial areas within this perimeter leads to frequent traffic congestion on both weekdays and weekends.
For this study, a critical intersection was selected for detailed analysis: the junction of Gheorghe Baritiu Street, Șirul Beethoven Street, and Șirul Gheorghe Dima Street, located near the Maternity Hospital (Figure 3). This intersection is a significant bottleneck during rush hour, serving key destinations such as the Andrei Șaguna National College, Transilvania University, and access points to the old citadel walls. It consistently experiences traffic jams that delay both vehicular and pedestrian access to these areas of interest.
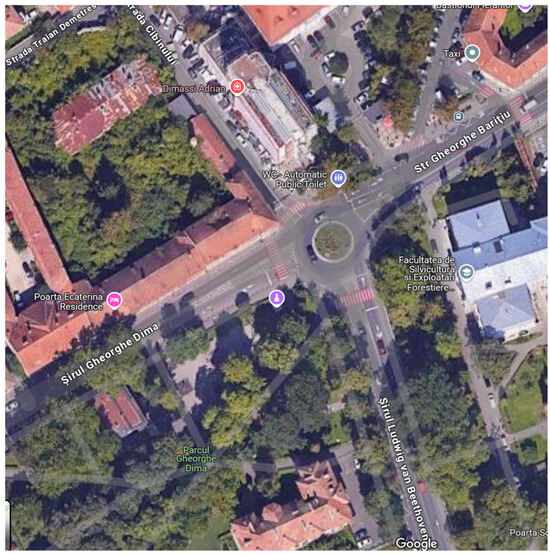
Figure 3.
Gheorghe Baritiu St. + Şirul Beethoven St. + Șirul Gheorghe Dima Street + Cibinului St. (Maternity Hospital), source Google Maps.
The following table (Table 1) presents the road flow data collected during the afternoon peak hour (13:40–14:40) for vehicles traveling inbound on Gheorghe Baritiu Street toward the Șchei neighborhood.

Table 1.
Vehicle counts at the Maternity Hospital intersection.
| Vehicles | Etalon Vehicles | |
| Total Left ← | 243 | 249 |
| Total Forward ↑ | 274 | 310 |
| Total Right → | 27 | 27 |
| Total Turn ↺ | 115 | 124 |
| Total for Access | 659 | 710 |
The data reveals that a total of 659 vehicles entered the intersection from Gheorghe Baritiu Street during the one-hour observation period. In the same period, seven vehicles came from Cibinului Street and headed towards Schei, and 40 came from Ludwig van Beethoven Street, with the same destination—the Schei neighborhood. Analysis of turning movements shows that 321 of these vehicles proceeded toward the Șchei neighborhood. Assuming an average vehicle occupancy, this corresponds to an estimated passenger volume of approximately 500 people traveling in private vehicles toward this specific destination.
In parallel, data for the existing public transport route (Line 50) traveling in the same direction was analyzed. By examining bus schedules, vehicle types, and observed passenger loads, the public transit load was calculated. This analysis revealed a demand ranging from 40 passengers per hour during off-peak times to 120 passengers per hour during peak periods (e.g., 07:30–08:30 and 15:00–16:00).
By combining these two data streams, a comprehensive demand profile can be established. The minimum baseline demand for a public transport service is 120 passengers per hour, based on existing transit load. However, to fully address the mobility needs of the area and attract users from individual transport, the service must be designed to accommodate a potential peak demand of up to 620 passengers per hour (120 from current transit +500 from private vehicles). These demand figures serve as the primary input data for the subsequent public transport simulations.
3.2.3. Description of Infrastructure Problems
The primary infrastructural challenge within Brașov’s Historic Center is the intense competition for limited space. This spatial conflict is aggravated by historical urban planning decisions that prioritized personal vehicle mobility, leading to significant accessibility and safety issues for other road users. These existing deficiencies create a complex environment for implementing an autonomous public transport service. The following specific problems have been identified as critical barriers:
- P1. Constrained vehicle access on narrow streets (Figure 4): The historic center’s canyon streets physically restrict vehicle dimensions. In many sections, the road is too narrow for vehicles to pass one another, and tight intersection radii make turning difficult for any vehicle larger than a standard car. This requires any autonomous shuttle to be compact and highly maneuverable.
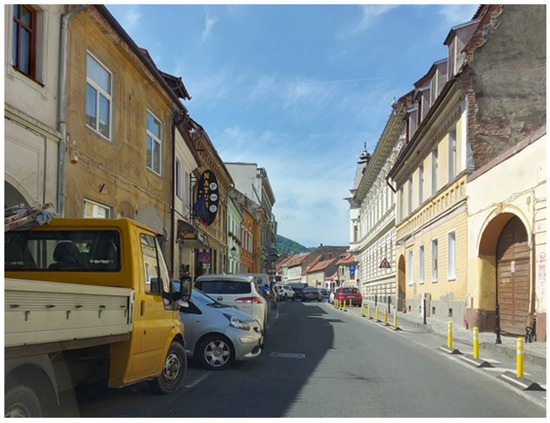 Figure 4. Castelului Street, Brasov.
- P2. Hazardous parking configurations (Figure 5): Parking is organized both laterally and obliquely along the roadways. While lateral parking presents a lower risk, oblique parking spaces force drivers to reverse into active traffic lanes with severely limited visibility. This creates unpredictable and high-risk scenarios that are challenging for an autonomous vehicle’s prediction and decision-making algorithms.
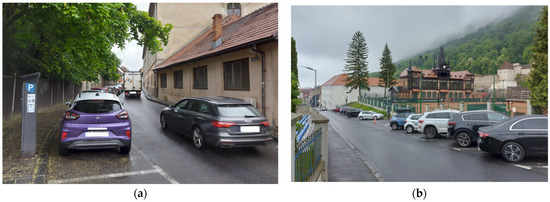 Figure 5. Side parking (a) and oblique parking (b).
 - P3. Illegal parking and obstruction (Figure 6): Insufficient parking capacity leads to frequent illegal parking on roadways and sidewalks. These static and dynamic obstructions reduce the effective width of the street, block sightlines, and create unexpected obstacles that an autonomous system must be able to safely navigate or circumvent.
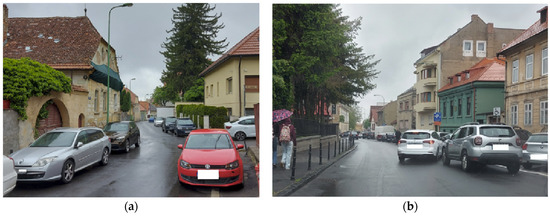 Figure 6. Situations of illegal parking (a) on the secondary street C. Lacea or (b) on the main street Prundului.
 - P4. High-density pedestrian flow (Figure 7): As a major tourist and commercial hub, the historic center experiences extremely high pedestrian flows. Pedestrians often spill off the narrow sidewalks into the street, creating a complex and fluid environment that is difficult for autonomous sensors to interpret and predict safely, especially in crowded conditions.
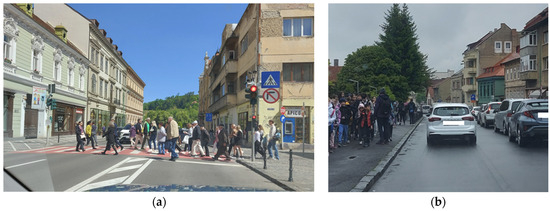 Figure 7. Pedestrian flows on (a) pedestrian crossings and (b) sidewalks at peak hours.
- P5. Unpredictable traffic from school-related activity (Figure 7): The morning and afternoon peaks are characterized by chaotic traffic patterns around schools, with frequent stopping, double-parking, and sudden maneuvers from vehicles dropping off or picking up students. This type of unpredictable human driver behavior represents a significant “edge case” that poses a major safety and operational challenge for current autonomous driving systems.
3.3. Methodology—Optimizing Autonomous Public Transport in the Historic Center of Brașov
This chapter details the methodology for optimizing an autonomous public transport route within a constrained urban environment. The analysis is built upon a multi-objective optimization framework that considers three essential pillars: the minimization of travel time, the maximization of passenger comfort, and the minimization of energy consumption. This framework is applied to a case study involving four distinct types and sizes of autonomous electric vehicles operating on a designated route in Brașov’s historic center.
- Travel time: Minimizing travel time is a fundamental objective for any public transport system. For autonomous vehicles, this is achieved not by maximizing speed, but through intelligent management of velocity and acceleration to maintain a consistent and efficient flow while adhering to all traffic regulations and operational constraints.
- Passenger comfort: This is quantified by limiting longitudinal and lateral accelerations. To prevent motion sickness and ensure a comfortable ride, the simulation enforces strict limits on acceleration, typically within the range of 0.1 g to 0.2 g (where g is gravitational acceleration).
- Energy consumption: The model calculates the total energy required for propulsion to overcome rolling resistance, aerodynamic drag, and grade resistance.
The deployment of autonomous vehicles in the environment presents significant benefits, from reducing human error to optimizing traffic flow and improving air quality. However, realizing these benefits requires meticulous planning and optimization. The following methodology was developed for a case study on Brașov’s existing public transport route, Line 50 (Livada Poștei—Pietrele lui Solomon).
The proposed methodology involves the following key steps:
- Detailed mapping and digitalization of the route: The geometry of the route (width, curvature, slopes), traffic restrictions (speed limits, one-way streets), and the location of fixed obstacles and high-pedestrian-traffic zones were digitized to create a high-fidelity model of the operational environment.
- Modeling of vehicle dynamics and autonomous behavior: A dynamic model was developed for each vehicle type to reflect its behavior in real-world conditions. The autonomous driving behavior was modeled using trajectory planning and rule-based adaptive control algorithms, assuming the vehicles can maintain constant speeds and optimize acceleration and deceleration profiles within safety and comfort limits.
- Calculation of minimum travel time: The minimum travel time for each vehicle was calculated while strictly adhering to traffic laws, mandatory stops at stations, and the pre-defined passenger comfort constraints.
- Fleet size calculation: Based on the travel time for each vehicle type, the number of vehicles required to meet the estimated passenger demand (as presented in the previous chapter) was calculated.
- Energy efficiency analysis: The total energy consumption for each vehicle type was calculated and normalized by the number of passengers to determine the energy consumed per passenger transported, providing a key metric for comparing the overall efficiency of the different solutions.
3.3.1. Generating the Vehicle Trajectory in Constrained Urban Spaces
For the case study, bus route Line 50 was selected. The route’s path was exported from OpenStreetMap (Figure 8). The raw geospatial data, consisting of a series of waypoints, was then imported into the MathWorks Driving Scenario Designer. In this environment, the data was processed and refined to create an accurate digital representation of the route, including features such as the “Livada Poștei” bus station (Figure 9).
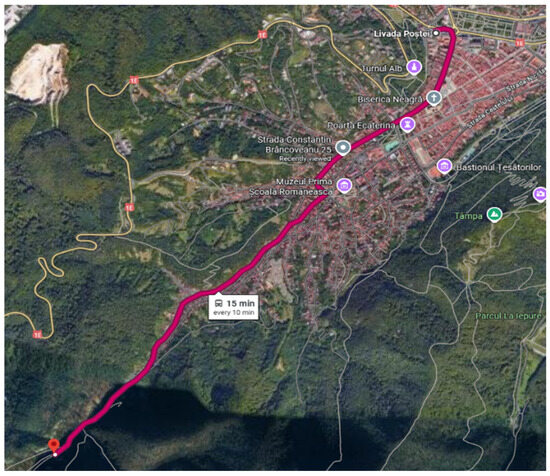
Figure 8.
Route of line 50 crossing the historic center of Brasov, where the symbols represent tourist destinations (historical, architectural monuments or natural reserves), source Google Map.
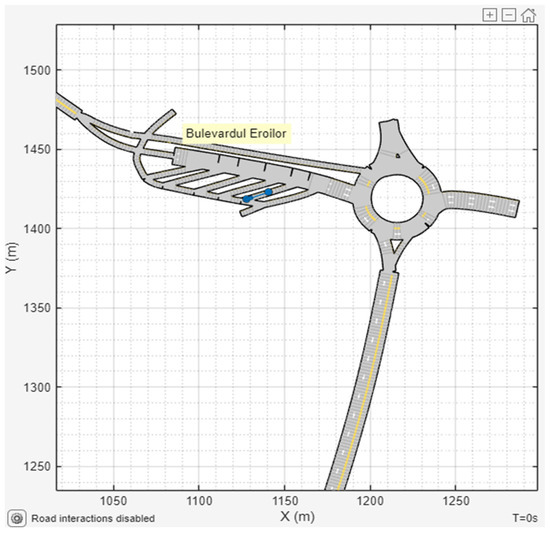
Figure 9.
Digitized representation of the “Livada Postei” bus station with details regarding passenger boarding platforms and the first segment of the route of line 50 created with Driving Scenario Designer.
The initial set of points primarily marked the beginning and end of road segments. To create a continuous, high-resolution path suitable for dynamic simulation, spline interpolation was used to generate points along the entire route at approximately 0.1 m intervals (Figure 10). From this high-resolution path, the curvature at each point was computed. This curvature value is a critical input, as it directly determines the maximum velocity the bus can maintain in a turn without exceeding the acceptable lateral acceleration limit for passenger comfort.
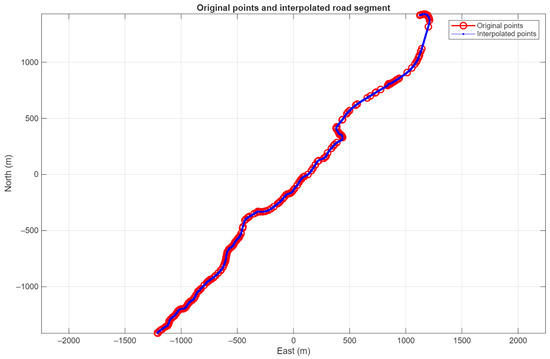
Figure 10.
Route of line 50 reconstructed based on points (marked with red circles) and segments (blue color) generated by interpolation.
Along this route, several points require the vehicle to either stop or slow down. These constraints were mapped by their distance from the starting point (in meters):
- Bus station locations = [0, 782, 1028, 1503, 2058, 2371, 2672, 2887, 3077, 3357, 3537, 4044];
- Crosswalk locations = [770, 850, 1000, 1170, 1350, 1870, 2860];
- Traffic light locations = [192, 402].
The chosen route is geometrically complex, traversing a dense urban and tourist area with tight curves, a small-radius roundabout, and multiple pedestrian crossings. Figure 11 presents the curvature values (in 1/m) along the entire route, highlighting the sections with a small turning radius that impose the most significant speed constraints.
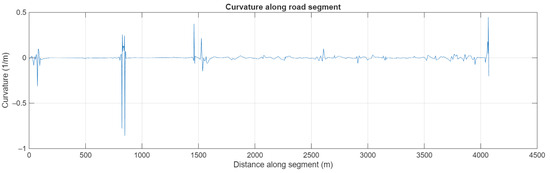
Figure 11.
Curvature along road segment.
The vehicle is modeled as a 4 × 2, rear-wheel-drive vehicle with Ackerman steering. It is assumed that the rear axle wheels rotate around the center of the road’s curve (Figure 12). Under these assumptions, the point of maximum lateral acceleration occurs at the outer front corner of the vehicle. This critical point is therefore used to calculate and enforce the passenger comfort limits throughout the simulation.
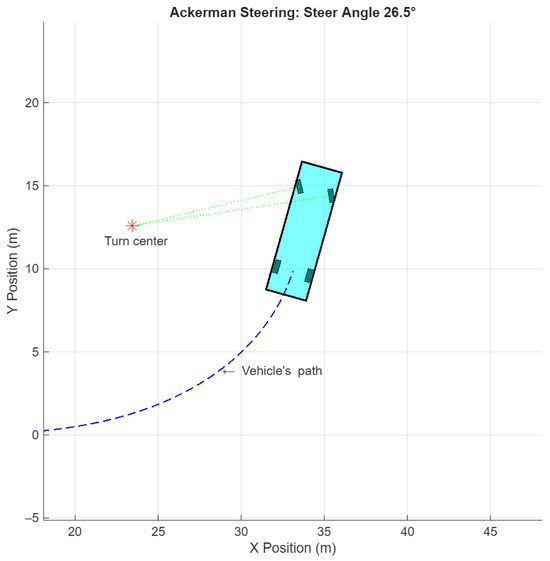
Figure 12.
Vehicle trajectory, with blue dashed line, around the center of rotation marked in red, with Ackerman steering.
3.3.2. Simulating the Movement of Different Autonomous Public Transport Vehicles
This study develops a computational and analytical model to evaluate the suitability of various autonomous public transport vehicles for meeting passenger demand in cities with constrained urban spaces. The analysis is benchmarked against electric passenger transport vehicles that are already in operation in such environments, although with human drivers.
Vehicle Selection
Six distinct electric vehicles were identified for this comparative analysis. The selection includes a range of sizes, from compact vans to full-sized 12 m buses, to assess the trade-offs between passenger capacity and maneuverability. The final four vehicles in the list are currently part of the operational fleet of the local transport authority in Brașov, providing a direct real-world baseline for the case study. The main characteristics of the selected electric vehicles are presented in Table 2 [73,74,75].
Table 2.
Types of electric buses proposed for analysis.
Simulation Parameters
To configure the MATLAB R2025a simulation, key parameters governing vehicle dynamics, passenger comfort, and energy efficiency were established based on a review of the specialized literature.
- Longitudinal Acceleration (=0.9 m/s2): While human drivers can exhibit accelerations up to 4.8 m/s2, studies show that 90% of observed accelerations fall within a much narrower range, typically below 1.0 m/s2 [76,77]. Furthermore, public transport systems like light rail transit (LRT), which are considered a benchmark for passenger comfort, operate with a longitudinal acceleration of approximately 1.34 m/s2 [76,78]. To prioritize a smooth and comfortable ride, a conservative value of 0.9 m/s2 was selected for the simulation.
- Lateral Acceleration (=1.2 m/s2): Passenger comfort is highly sensitive to lateral acceleration in curves [79]. Guidelines for driver comfort and safety set tolerance limits between 1.47 m/s2 and 1.96 m/s2 [80]. Prediction models for electric buses often use a threshold of 1.5 m/s2 [81]. To ensure a high degree of passenger comfort, especially in the tight turns of the historic center, a maximum lateral acceleration of 1.2 m/s2 was chosen.
- Deceleration (=−1.0 m/s2): Similarly to acceleration, comfortable deceleration is critical. The LRT benchmark for comfortable deceleration is −1.34 m/s2 [76], while some energy consumption models for electric buses use a limit of −0.8 m/s2 [81]. A value of −1.0 m/s2 was selected as a balanced parameter that ensures a smooth, comfortable stop without being overly conservative.
- Powertrain and regenerative braking efficiency (=0.85 and 0.70): The efficiency of an electric powertrain varies with operating conditions, but comprehensive vehicle tests show that it can reach up to 91% [81]. An average efficiency of 0.85 from the battery to the wheels was adopted for propulsion. For regenerative braking, which captures kinetic energy and returns it to the battery, a round-trip efficiency of 0.70 was used [82].
- Vehicle resistance parameters:
- a.
- Effective mass factor (=1.02): To account for the rotational inertia of the wheels and transmission, an effective mass factor of 1.02 was applied, meaning the inertial mass is considered to be 102% of the vehicle’s static mass [81].
- b.
- Drag coefficient (=0.36): Based on coast-down tests for modern electric vehicles [81], an average aerodynamic drag coefficient of 0.36 was used.
- c.
- Rolling resistance coefficient (=0.01): This coefficient varies with road surface quality. Measured values for electric buses range from 0.0088 on good asphalt to 0.0112 on poor asphalt [81,83]. An intermediate value of 0.01 was selected for the simulation.
Behavioral Rules and Constraints
The behavioral patterns of human drivers serve as the basis for the simulation program, which operates on three levels: strategic, tactical, and control. Behavior is defined as a sequence of actions taken in response to a driving situation. The strategic level establishes the overall objective, the tactical level manages these tasks through rule-based or knowledge-based behaviors, and the control level is responsible for their execution [84,85]. In [86], Wang et al. demonstrated that a multi-agent system strategy can integrate multiple criteria to assess the energy efficiency of vehicle behavior in real-time, enabling the selection of optimal driving strategies. The simulated bus was programmed to adhere to the following operational rules:
- The maximum speed is limited to 30 km/h, in accordance with local regulations for the historic center.
- When approaching pedestrian crossings, the vehicle decelerates to 20 km/h over a distance of 20 m.
- In all curves, the vehicle’s speed is dynamically adjusted to ensure that the lateral acceleration experienced by the outermost passenger does not exceed the comfort limit of 1.2 m/s2.
4. Results
4.1. Calculation of Velocity Profiles
Using the parameters, behavioral rules, and vehicle characteristics defined in the previous chapter, the simulation program calculated the optimal velocity profile for each of the six electric bus types. The primary objective was to determine the minimum possible travel time for each vehicle along the designated route, while strictly adhering to all constraints, including regulatory speed limits, mandatory stops, and passenger comfort limits (i.e., maximum longitudinal and lateral acceleration).
The resulting velocity profiles for Bus #1 (the most compact vehicle) and Bus #6 (the largest vehicle) are presented in Figure 13 and Figure 14, respectively. These two cases were selected as they represent the minimum and maximum limits of the dimensional and capacity range of the vehicles under consideration.
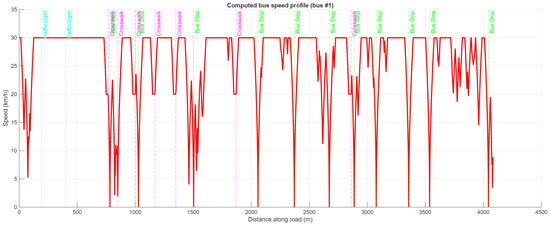
Figure 13.
Speed profile along the route for Bus#1.
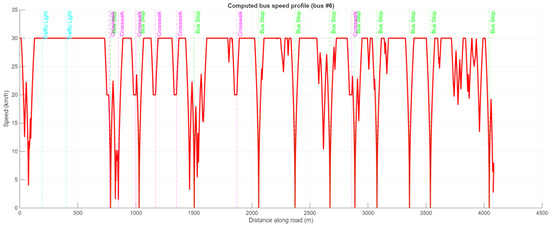
Figure 14.
Speed profile along the route for Bus#6.
The graphs clearly illustrate the vehicle’s behavior along the route. The velocity drops to zero at designated bus stops, as required. At signalized pedestrian crossings, the model assumes a green light, and thus the vehicle does not stop. At unsignalized pedestrian crossings, the vehicle proactively decelerates to a safe, lower speed to mitigate the risk posed by unexpected pedestrian movements.
A comparison of the two graphs reveals that the speed profiles are nearly identical on straight segments of the route. In these sections, both vehicles accelerate to the maximum permitted speed of 30 km/h and maintain it.
The significant differences emerge in sections with non-zero curvature, particularly in curves with small turning radii. In these segments, the dimensional characteristics of the vehicles directly influence the maximum safe speed. To stay within the passenger comfort limit for lateral acceleration, longer and wider vehicles must navigate these tight turns at a considerably lower speed than their smaller, more agile counterparts. This dynamic speed adjustment based on vehicle geometry is a key factor influencing the overall travel time and energy consumption for each bus type.
4.2. Bus Energy Consumption Calculation
Based on the parameters presented in Section 3.3.2, the constructive characteristics of the electric buses presented in Table 2 (length, wheelbase, width, height, self-weight, weight with passengers within the limit of seats), respecting the traffic rules on the chosen route as well as the imposed rules of behavior, we calculated for all six types of electric buses the forces and powers of the engines necessary to travel with the previously established speed profiles.
The total energy consumed by the bus over its operational route was determined using a backward quasi-static model, based on the principles of longitudinal vehicle dynamics. This approach uses the known velocity profile to calculate the instantaneous tractive force required at the wheels, which is then used to compute the power demand from the energy source (battery) by taking into account the powertrain efficiencies.
The principle of the model is the longitudinal force balance equation, where the total tractive force, Ftractive, must overcome the sum of all resistive forces to produce the required acceleration:
where Frr is the rolling resistance, Fad is the aerodynamic drag, Fg is the gradient resistance, and Fi is the inertial force.
Each resistive force component is calculated at every time step of the simulation as follows:
- 1.
- Rolling resistance (Frr): This force arises from the deformation of the tires and contact with the road surface. It is calculated as a function of the vehicle’s mass and the road surface characteristics:where m is the vehicle mass, g is the gravitational acceleration, θ is the road grade angle, and Crr is the dimensionless rolling resistance coefficient.
- 2.
- Aerodynamic drag (Fad): This is the force of air resistance acting on the vehicle and it is proportional to the square of the vehicle’s velocity:Here, ρ is the air density, A is the vehicle’s frontal cross-sectional area, v is the vehicle velocity, and Cd is the dimensionless drag coefficient.
- 3.
- Gradient resistance (Fg): The gravitational force component on a slope, given by Fg = m⋅g⋅sin(θ). For this analysis, the road was assumed to be perfectly flat (θ = 0) at all points along the route. This simplification was made to establish a baseline energy consumption profile, isolating the energy impacts of the vehicle’s mass, aerodynamic profile, and the kinetic demands of the speed profile itself, independent of topographical variations.
- 4.
- Inertial Force (Fi): This is the force required to accelerate the vehicle. The calculation includes an effective mass factor, ym, to account for the rotational inertia of the wheels and powertrain components.
From the total tractive force, the mechanical power required at the wheels, Pwheels, is calculated:
To determine the power drawn from the energy source, Psource, the model accounts for the overall efficiency of the powertrain (ηpt). During propulsion (Pwheels > 0), the power drawn is greater than the power delivered. During deceleration (Pwheels < 0), the electric vehicle can recover a portion of the vehicle’s kinetic energy through regenerative braking. This is particularly effective in urban driving, where frequent braking events occur. The power from the source is thus determined by
The efficiencies for propulsion and regeneration, ηpropulsion and ηregeneration, can be derived from component efficiency maps but can be represented by average values for a quasi-static analysis.
Finally, the total energy consumed, Etotal, over the entire route is calculated by numerically integrating the source power over the duration of the trip:
This computational approach provides a robust and repeatable method for estimating the energy consumption of a vehicle over any given drive cycle for which position and speed data are available.
Figure 15 illustrates the calculated tractive forces for Bus #1, Bus #3, and Bus #6. A significant difference is observable between the maximum force values. Bus #6, being the largest and heaviest vehicle, requires substantially higher forces to accelerate and overcome resistance compared to the much smaller Bus #1 minibus. Bus #3, with its intermediate size, exhibits force values that fall between these two extremes.
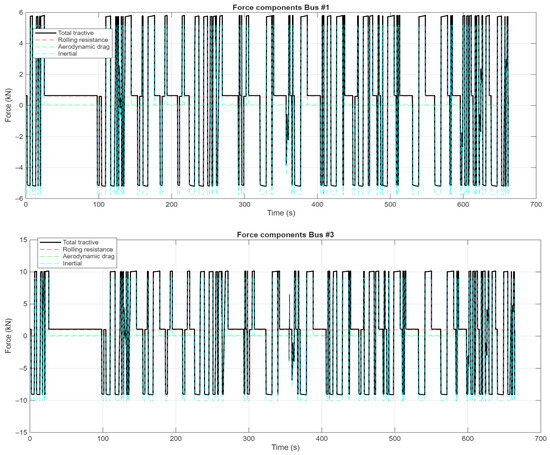
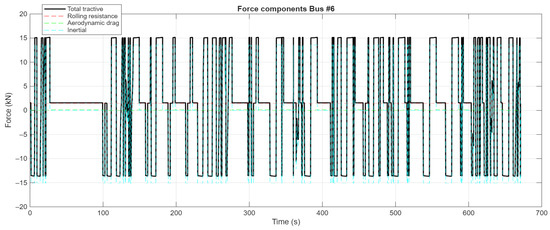
Figure 15.
Calculated forces.
This difference in required force translates directly to the power demand, as shown in Figure 16. The larger mass and frontal area of Bus #6 necessitate a much higher power output from the electric motor to follow the same speed profile as the smaller vehicles.
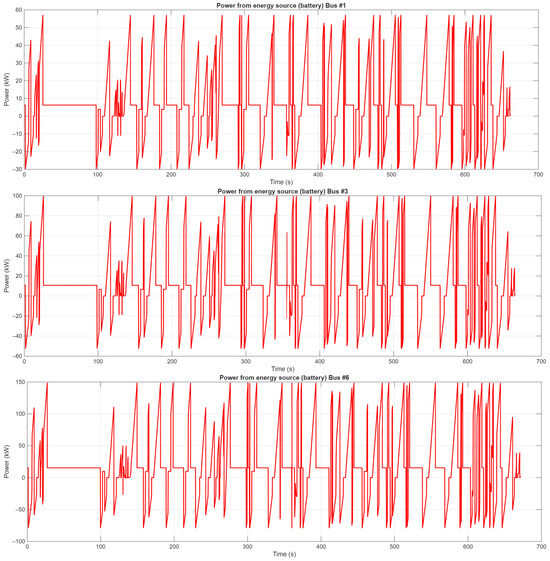
Figure 16.
Calculated power.
The final calculated travel times and energy consumption metrics for all six cases are presented in Table 3. The data was then used to calculate the energy consumption rate per kilometer and, crucially, the energy consumed per passenger, which normalizes the results based on the transport capacity of each vehicle.
Table 3.
Calculated energies by each type of bus (six cases) along the route.
The results reveal a clear trend. While larger buses consume more total energy and have slightly longer travel times due to their need to slow down more in curves, they are significantly more efficient on a per-passenger basis. The energy consumption per passenger decreases steadily as the vehicle size and capacity increase, with the largest vehicle (Bus #6) demonstrating the highest efficiency in terms of moving people. This highlights the critical trade-off between the absolute energy consumption of a vehicle and its overall transport efficiency
4.3. Validation of Simulation Results
To verify the accuracy of the simulation model, a comparative analysis was conducted between the simulated velocity profile and real-world operational data. The velocity profile for Bus #4 (SOR EBN 9.5) (see Table 2, Figure 1a) was selected for this validation, as it corresponds to a vehicle currently in operation. Real-world data was collected by recording a complete trip along the Line 50 route aboard an operational SOR EBN 9.5 electric bus, using the Matlab Mobile application to capture GPS and speed data.
The two datasets—simulated and real—were superimposed for a direct comparison, as shown in Figure 17. The analysis reveals several key differences between the idealized simulation and the real-world operation. The human-driven bus (blue curve) occasionally exceeded the legal speed limit on straight sections, a behavior not permitted in the simulation’s rule-based system. Also, the real bus was subject to unpredictable traffic conditions, necessitating decelerations and stops not accounted for in the baseline simulation, such as stops at two pedestrian crossings.
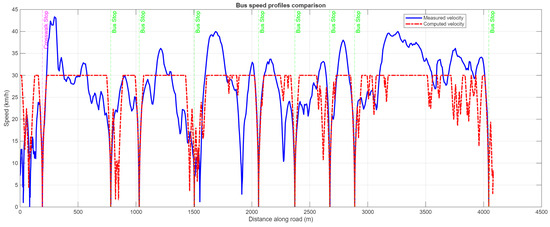
Figure 17.
Speed profiles of the real bus (solid blue line) and the virtual one (dashed red line).
To create a meaningful comparison of the net travel time, it is necessary to account for the time the real bus spent stationary. The total measured trip time for the real bus was 739 s (12 min and 19 s). This included a cumulative 80 s of dwell time at bus stops (as detailed in Table 4) and 18 s stationary at pedestrian crossings.
Table 4.
Bus stops on line 50.
By subtracting these stationary periods from the total trip duration, the net travel time for the real bus is calculated:
Net Real Travel Time = 739 s (Total) − 80 s (Bus Stops) − 18 s (Crossings) = 641 s.
This net travel time of 641 s is remarkably close to the simulated travel time of 640 s for the virtual bus under the same stopping conditions. This strong correlation, with a deviation of less than 0.2%, validates the accuracy of the vehicle dynamics model and confirms that the simulation provides a reliable and realistic prediction of the vehicle’s performance along the specified route.
4.4. Analysis of Optimal Fleet Configuration
The final goal of this analysis is to propose an optimal autonomous vehicle fleet for Line 50, one that meets the established passenger demand while balancing operational efficiency, energy consumption, and passenger service quality. The simulation results provide the necessary data to evaluate the trade-offs between deploying different vehicle types. This analysis considers six key dimensions: (i) the balance between energy consumption and passenger service, (ii) infrastructural compatibility, (iii) total costs, (iv) social acceptance, (v) operational flexibility, and (vi) integration with broader urban mobility strategies.
(i) The trade-off: energy efficiency and passenger waiting time
As established in Section 3.2.2, the public transport service on Line 50 must accommodate a baseline demand of 120 passengers per hour. Currently, the operator uses three different bus types (SOR EBN 8, 9.5, and 11) at different times of the day to manage this demand (see Table 2). This raises a classic public transport optimization problem: is it more effective to use small buses with a high frequency or large buses with a low frequency?
To answer this, the number of vehicles required per hour to meet the 120-passenger demand was calculated for each of the three SOR bus types. The results, along with the corresponding total energy consumption and maximum passenger waiting time, are presented in Table 5.
Table 5.
Fleet requirements and performance metrics for a 120 passenger/h demand.
The analysis reveals a clear conflict between two primary objectives. From an energy consumption perspective, the largest buses (EBN 11) are the most efficient, resulting in the lowest total fleet energy consumption (14.40 kWh). However, this efficiency comes at the cost of reduced service frequency, leading to the longest maximum waiting time for passengers (12 min). Conversely, the smallest buses (EBN 8) offer the best passenger service with a short waiting time of just 7.5 min, but this requires a larger fleet and results in the highest total energy consumption (19.28 kWh). This demonstrates a classic multi-objective optimization challenge where a balance must be struck between operational efficiency and quality of service.
(ii) Infrastructural compatibility
The physical constraints of the historic city center are a critical factor. As the simulation results showed, larger vehicles are forced to travel at lower speeds in tight curves to maintain passenger comfort, which slightly increases their overall journey time. Smaller vehicles, with their superior maneuverability and tighter turning radii, are inherently better suited to the “canyon streets” and non-standard intersections of Brașov. The current use of the SOR EBN 8, 9.5, and 11 buses on Line 50 already highlights a practical compromise, demonstrating their adaptability to the local conditions.
(iii) Total cost of ownership
While this study focuses on energy consumption, a comprehensive decision-making process must consider the total cost of ownership (TCO). This includes the initial investment value, maintenance, and other operational costs. A TCO analysis comparing the cost of operating a larger fleet of small buses versus a smaller fleet of large buses would be essential for a final implementation decision.
(iv) Social acceptance and user experience
Public acceptance is essential for large-scale adoption. In Romania, citizens’ perceptions and attitudes toward AVs remain underexplored, particularly in medium-sized cities like Brașov, which present specific challenges: urban density, street layout, population’s tech literacy, and public transport experience. Romanian citizens have limited knowledge about Avs and they still lean toward private mobility solutions over shared autonomous transport systems. However, Brașov is a university center with a substantial student population (Romanian students show positive attitudes toward Avs, especially due to safety and comfort), potentially increasing familiarity and openness to emerging mobility technologies. If current public transport systems are perceived as inefficient, citizens may be more receptive to AV alternatives that promise reliability, comfort, and punctuality.
As detailed in Section 2.4.2, passenger satisfaction is driven by factors such as reliability, punctuality, comfort, and short waiting times. The higher frequency offered by smaller buses directly addresses the critical issue of waiting time, which is a major determinant of passenger satisfaction. Furthermore, different bus models may offer varying levels of accessibility for people with disabilities, another crucial factor for social acceptance.
Public perception of autonomous vehicle technology in Romanian cities like Brașov remains under-researched but critical for future implementation.
(v) Adapting to fluctuating demand
Tourist cities like Brașov experience significant fluctuations in transport demand, driven by seasonal visitor numbers, special events, and the daily mobility of students. A flexible and modular fleet offers the most effective way to manage these variations. For instance, a strategy could involve deploying larger buses during peak tourist and commuter hours, while using smaller, more frequent buses during off-peak periods to maintain a high level of service without operating large, empty vehicles.
(vi) Integration with urban mobility strategies
The choice of vehicle type must align with the city’s broader sustainable urban mobility plan. The use of compact autonomous vehicles can support strategic goals by reclaiming urban space for pedestrians and cyclists. However, the successful operation of AVs also depends on a robust ICT infrastructure (e.g., 5G, edge computing) to support the real-time data exchange and high-definition mapping they require.
(vii) Legal framework for integrating an AV transport system in Brașov city
Implementing an autonomous vehicle (AV) transport system in Brașov requires navigating a complex and evolving legal environment. At present, Romania lacks specific AV legislation, and the regulatory impetus comes largely from European Union rules. AVs are not separately regulated, so they must rely on existing traffic and vehicle laws. There are no tailored insurance or liability rules for Avs, and general third-party liability and product liability frameworks apply. Romanian civil law adheres to fault-based liability (culpa) as a basic principle. However, in AV contexts, the fault-based approach may be insufficient, as computing what failed can be complex. Since AVs are not yet legally recognized, no specific mandatory insurance regime for AV operation exists, so standard compulsory motor insurance remains in place.
However, Romania participates in broader European Union level frameworks to authorize testing of automated driving systems. So, national implementation and enabling administrative procedures remain limited. For Brașov to integrate an AV public transport system, the legal framework must fill existing gaps and adapt European Union rules to local context. Brașov City Council should create by-laws or municipal regulations designating geofenced zones where AV transit can operate (historic center, corridors, limited zones). ocal traffic regulations must be modified to allow AVs to deviate from normal traffic rules under controlled conditions (e.g., priority, signals, turning permissions).
4.5. Economic Considerations to Bring Autonomous Vehicles to Constrained Urban Settings
It takes more than addressing technology requirements to implement autonomous public transport solutions—there is an overall economic consideration as well. To assist with informed decision-making on the part of city governments, we recommend the following primary areas of analysis be considered:
- Capital Expenditure (CAPEX): Initial outlays for purchasing and installing vehicles and supporting infrastructure, including autonomous technology, charging stations, and environmental sensors.
- Operational Expenditure (OPEX): Recurring costs such as energy or fuel, maintenance, insurance, communication networks, software, and staff for monitoring and maintenance.
- Lifecycle Costs and Depreciation: Predicted operating lifespan of the vehicle and forecasted residual value.
- Other Costs in Densely Packaged Environments: Such as costs unique to densely populated urban environments, i.e., modifying road infrastructure, new signs or signals, and the operational impacts of using smaller, more intense groups of vehicles.
Current studies provide benchmark cost estimates to guide financial planning. Autonomous micro shuttles (6–12 passengers) used in pilot operations typically cost in the order of USD 100,000 per vehicle. Overall costs per route in terms of both CAPEX and OPEX are tens of thousands to several hundred thousand USD in context-dependent and scale-dependent variations.
Electric buses (9–12 m), based on study and buying data, generally run from around USD 200,000 to over USD 500,000, depending on options and market dynamics in a region.
While removing the driver would greatly decrease some operating costs, other ongoing expenses—maintenance, infrastructure, and long-distance monitoring, for instance—remain [87].
Simple Total Cost of Ownership (TCO) model. The table below (Table 6) presents some illustrative calculations from published sources [88,89,90,91,92,93].
Table 6.
Total Cost of Ownership (TCO) model.
Recommended analyses for decision makers
- Cost per seat-km and per vehicle-km analysis—determine the cost per seat-kilometer and compare it with traditional alternatives (such as conventional diesel or electric buses), taking into account the additional expenses related to operating on constrained routes.
- Sensitivity analysis—adjust key variables such as energy prices, annual mileage (km/year), battery lifespan, capital costs, and level of automation (e.g., L4 vs. L2+ with an onboard operator). Research indicates that the primary factors affecting TCO are vehicle/AV equipment costs and labor expenses; while lowering labor costs can make certain projects more viable, this typically requires time and adjustments to contractual frameworks [95].
- Additional costs in confined environments—operations on narrow streets may necessitate smaller vehicles, increased service frequency, and infrastructure modifications, which can lengthen cycle times and raise OPEX per passenger.
- Contractual frameworks—models such as leasing, public–private partnerships, or “gross cost” vs. “net cost” contracts can redistribute financial risks between public authorities and operators (for example, the Noida project illustrates per-kilometer tariff structures in tenders) [97].
5. Discussion and Conclusions
Europe’s historic cities often feature small floor plans, winding streets, and infrastructure that respects cultural heritage. These characteristics challenge traditional buses and large transport vehicles, but also create opportunities for autonomous, electric, and small shuttles.
The morphology of the historic core and street width should be considered when determining which cities are suitable for AV-based public transportation in narrow-street settings. Criteria include:
- City layout (cities with medieval cores featuring streets less than 4 m wide);
- Traffic and access restrictions (cities with low-emission zones or limited traffic zones in their old towns);
- Pedestrian density and tourism pressure (high footfall areas where quieter, cleaner AVs could enhance the urban experience);
- Existing mobility policies and smart infrastructure (municipal support for sustainable mobility, readiness for digital infrastructure, and openness to innovation);
- Precedent for small-scale transit or shuttle solutions (cities already running electric minibuses or pilot mobility systems).
The findings from the Brașov case study provide a transferable framework that can be applied to other European cities facing similar challenges, particularly those with historically significant and spatially constrained urban cores. Cities such as Lucca, Italy; Bruges, Belgium; and Toledo, Spain, exhibit comparable infrastructural and mobility characteristics, making the lessons learned from this analysis broadly applicable. The discussion below synthesizes the key findings and their implications.
5.1. Vehicle Selection and Infrastructural Compatibility
The results strongly support the conclusion that compact, electric-powered vehicles, like Zhongthong Electric Van, Yutong E7S and SOR EBN 8, are the most suitable option for navigating the “canyon streets” typical of historic city centers. Their smaller dimensions and superior maneuverability are important for minimizing traffic disruption and safely operating within the existing infrastructure. The simulation demonstrated that larger vehicles like SOR EBN 9.5, SOR EBN 11 and SOR NS 12 are forced to operate at lower speeds in curves to maintain passenger comfort, which negatively impacts their overall journey time and the operational frequency of the service. This finding reinforces the principle that in environments with tight geometric constraints, vehicle agility is a primary determinant of operational efficiency. Furthermore, the choice of electric vehicles is also important for addressing the environmental concerns in these high-density pedestrian zones, as their zero-emission and low-noise operation aligns with sustainable mobility objectives.
5.2. The Central Optimization Challenge: Capacity, Efficiency, and Service Quality
The analysis revealed a direct trade-off between energy efficiency and passenger service quality. Larger buses, like SOR EBN 9.5, SOR EBN 11 and SOR NS 12, while consuming more energy in absolute terms, are significantly more efficient on a per-passenger basis. However, this efficiency is achieved at the cost of lower service frequency and longer waiting times for passengers. On the other hand, smaller vehicles like Zhongthong Electric Van and Yutong E7S provide a superior level of service with short travel time but result in higher total fleet energy consumption.
This highlights that there is no single “optimal” vehicle. The ideal solution lies in a carefully balanced fleet configuration that is tailored to the specific mobility patterns of the city. This requires a data-driven approach, using detailed mobility studies to understand passenger demand across different times of the day and days of the week. For instance, a hybrid strategy could be employed, deploying larger, high-capacity vehicles during peak commuter and tourist hours, while using smaller, more frequent shuttles during off-peak periods to maintain a high level of service without operating underutilized vehicles.
5.3. A Data-Driven Framework for Urban Planning
This study demonstrates the value of a simulation-driven planning methodology. By creating a digital twin of the road infrastructure and modeling vehicle dynamics, it is possible to conduct an analysis of various transport scenarios. This approach allows urban planners to calculate key performance indicators, such as travel times, fleet requirements, and energy consumption per passenger, for different vehicle types before making significant capital investments.
5.4. Addressing Broader Urban Challenges
The deployment of a well-designed autonomous public transport service can be a catalyst for addressing broader urban challenges. The specific issues identified in Brașov, such as illegal parking, high-density pedestrian flows, and school-related traffic congestion, are common to many historic cities. A reliable, high-frequency autonomous shuttle service can reduce dependency on private vehicles, thus improving parking pressure and congestion. When integrated with local policies such as limited traffic zones and congestion charging, compact AVs can help reclaim urban space, enhancing the environment for pedestrians and cyclists and improving the overall quality of life in the historic center.
5.5. Social Inclusion and User Experience
The success of any public transport system depends on its acceptance by the public. The operational frequency, which is directly linked to vehicle size and fleet configuration, has a significant impact on waiting times and perceived reliability—two critical factors for passenger satisfaction. Furthermore, autonomous public transport systems must be designed with inclusivity at their core. By adhering to universal design principles, these services have the potential to dramatically improve accessibility for the elderly, people with disabilities, and other underserved groups, ensuring that the benefits of modern mobility are distributed equitably.
In summary, the Brașov case study provides a robust framework for understanding the complex variables involved in implementing autonomous public transport in historic cities. The simulation model, validated against real-world operational data from an existing bus line, proved to be a highly accurate tool for predicting vehicle performance and energy consumption. In this analysis, the objective was to evaluate whether an autonomous vehicle can exhibit operational behavior comparable to that of a conventional vehicle operated by a human driver. To ensure a controlled comparison between the two configurations, a simplified route was selected—one devoid of stochastic elements such as uncertainties or unexpected obstacles. Key operational parameters, including acceleration profiles, maximum velocities, and station dwell times, were constrained based on established standards and values cited in the specialized literature. Although the autonomous model has been trained to handle certain levels of uncertainty, for the purposes of this phase of the study, such factors were assumed to impact the digital simulation outcomes to a similar extent as they would affect real-world vehicle behavior.
The central conclusion is that a comprehensive, multi-objective analysis—balancing vehicle size, operational frequency, energy consumption, and passenger comfort—is essential for tailoring a solution to the unique characteristics of each urban environment. This study was subject to some simplifying assumptions that provide clear directions for future research. Firstly, the energy consumption model assumed a flat road network. While this established a crucial baseline, road grade is known to have a major impact on the energy consumption of electric vehicles. The inclusion of topographical data would be particularly important for modeling regenerative braking, where energy recovered during descents can significantly compensate the energy consumed during climbs. Secondly, the analysis was based on a static passenger demand profile. Real-world passenger flow is dynamic and can fluctuate significantly, a factor that would be better captured by more advanced modeling techniques. Future studies must be supported by precise local data and dynamic simulations to move beyond theoretical models and toward practical, effective, and sustainable urban mobility solutions. In this article, we aimed to identify specific challenges that may arise in cities with limited urban space and to assess the potential use of autonomous vehicles for future public transportation systems. Naturally, several challenges were not addressed in this study, including those related to vehicle performance under special operating conditions—such as winter environments, areas with high pedestrian density, or emergency scenarios. Consequently, the proposed analytical model has certain limitations and can be further refined. Future work may expand this model by incorporating additional external and internal factors related to operation, profitability, safety, and social acceptance.
Author Contributions
Conceptualization, S.B.; data curation, S.T. and R.T.; formal analysis, C.A.; investigation, S.T. and R.T.; methodology, S.B. and C.A.; project administration, S.B.; software, C.A.; supervision, S.B. and C.A.; validation, S.B. and C.A.; visualization, C.A.; writing—original draft, S.T. and R.T.; writing—review and editing, S.B. All authors have read and agreed to the published version of the manuscript.
Funding
This work is supported by the Ministry of Education of Romania, Executive Unit for Financing Higher Education, Research, Development and Innovation (UEFISCDI), under the project titled “Intelligent Connected Vehicle Cooperative System for Enhanced Driving Experience” (iDrive), project code PN-IV-P2-2.1-TE-2023-1434.
Data Availability Statement
The original contributions presented in this study are included in the article. Further inquiries can be directed to the corresponding author.
Conflicts of Interest
The authors declare no conflicts of interest.
References
- Hafiz, D.; AlKhafagy, M.; Zohdy, I. Autonomous Public Transport: Evolution, Benefits, and Challenges in the Future of Urban Mobility. World Electr. Veh. J. 2025, 16, 482. [Google Scholar] [CrossRef]
- Konstantas, D.; Fournier, G. Fully automated public transportation mobility: The hidden challenges for a commercial deployment. Open Res. Eur. 2023, 3, 71. [Google Scholar] [CrossRef]
- Yuan, Y.; Liu, Y. BEVEFNet: A Multiple Object Tracking Model Based on LiDAR-Camera Fusion. Procedia Comput. Sci. 2024, 242, 560–567. [Google Scholar] [CrossRef]
- Chen, X.; Ma, H.; Wan, J.; Li, B.; Xia, T. Multi-View 3D Object Detection Network for Autonomous Driving. In Proceedings of the 2017 IEEE Conference on Computer Vision and Pattern Recognition (CVPR), Honolulu, HI, USA, 21–26 July 2017. [Google Scholar]
- Paek, D.-H.; Kong, S.-H.; Wijaya, K.T. K-Radar: 4D Radar Object Detection for Autonomous Driving in Various Weather Conditions. In Proceedings of the Neural Information Processing Systems Track on Datasets and Benchmarks, New Orleans, LA, USA, 10–16 November 2023. [Google Scholar]
- Yao, S.; Guan, R.; Huang, X.; Li, Z.; Sha, X.; Yue, Y.; Lim, E.G.; Seo, H.; Man, K.L.; Zhu, X.; et al. Radar-Camera Fusion for Object Detection and Semantic Segmentation in Autonomous Driving: A Comprehensive Review. IEEE Trans. Intell. Veh. 2024, 9, 2094–2128. [Google Scholar] [CrossRef]
- Redmon, J.; Divvala, S.; Girshick, R.; Farhadi, A. You Only Look Once: Unified, Real-Time Object Detection. In Proceedings of the 2016 IEEE Conference on Computer Vision and Pattern Recognition (CVPR), Las Vegas, NV, USA, 27–30 June 2016; pp. 779–788. [Google Scholar]
- Geiger, A.; Lenz, P.; Urtasun, R. Are We Ready for Autonomous Driving? The KITTI Vision Benchmark Suite. In Proceedings of the 2012 IEEE Conference on Computer Vision and Pattern Recognition, Providence, RI, USA, 16–21 June 2012; pp. 3354–3361. [Google Scholar]
- Fayyad, J.; Jaradat, M.A.; Gruyer, D.; Najjaran, H. Deep Learning Sensor Fusion for Autonomous Vehicle Perception and Localization: A Review. Sensors 2020, 20, 4220. [Google Scholar] [CrossRef]
- Ziegler, J.; Bender, P.; Schreiber, M.; Lategahn, H.; Strauss, T.; Stiller, C.; Dang, T.; Franke, U.; Appenrodt, N.; Keller, C.G.; et al. Making Bertha Drive—An Autonomous Journey on a Historic Route. IEEE Intell. Transport. Syst. Mag. 2014, 6, 8–20. [Google Scholar] [CrossRef]
- Levinson, J.; Thrun, S. Robust Vehicle Localization in Urban Environments Using Probabilistic Maps. In Proceedings of the 2010 IEEE International Conference on Robotics and Automation, Anchorage, AK, USA, 3–7 May 2010; pp. 4372–4378. [Google Scholar] [CrossRef]
- Cadena, C.; Carlone, L.; Carrillo, H.; Latif, Y.; Scaramuzza, D.; Neira, J.; Reid, I.; Leonard, J.J. Past, Present, and Future of Simultaneous Localization and Mapping: Towards the Robust-Perception Age. IEEE Trans. Robot. 2016, 32, 1309–1332. [Google Scholar] [CrossRef]
- Thrun, S.; Burgard, W.; Fox, D. Probabilistic Robotics; Intelligent Robotics and Autonomous Agents series; MIT Press: Cambridge, MA, USA, 2005; ISBN 978-0-262-20162-9. [Google Scholar]
- Dolgov, D.; Thrun, S.; Montemerlo, M.; Diebel, J. Practical Search Techniques in Path Planning for Autonomous Driving. Ann. Arbor 2008, 1001, 18–80. [Google Scholar]
- Sadigh, D.; Sastry, S.; Seshia, S.A.; Dragan, A.D. Planning for Autonomous Cars That Leverage Effects on Human Actions. In Proceedings of the Robotics: Science and Systems XII, Robotics: Science and Systems Foundation, Ann Arbor, MI, USA, 18–22 June 2016. [Google Scholar]
- Paden, B.; Čáp, M.; Yong, S.Z.; Yershov, D.; Frazzoli, E. A Survey of Motion Planning and Control Techniques for Self-Driving Urban Vehicles. IEEE Trans. Intell. Veh. 2016, 1, 33–55. [Google Scholar] [CrossRef]
- Falcone, P.; Borrelli, F.; Asgari, J.; Tseng, H.E.; Hrovat, D. Predictive Active Steering Control for Autonomous Vehicle Systems. IEEE Trans. Contr. Syst. Technol. 2007, 15, 566–580. [Google Scholar] [CrossRef]
- Gao, Y.; Lin, T.; Borrelli, F.; Tseng, E.; Hrovat, D. Predictive Control of Autonomous Ground Vehicles with Obstacle Avoidance on Slippery Roads. In Proceedings of the ASME 2010 Dynamic Systems and Control Conference, ASMEDC, Cambridge, MA, USA, 12–15 September 2010; Volume 1, pp. 265–272. [Google Scholar]
- Bojarski, M.; Testa, D.D.; Dworakowski, D.; Firner, B.; Flepp, B.; Goyal, P.; Jackel, L.D.; Monfort, M.; Muller, U.; Zhang, J.; et al. End to End Learning for Self-Driving Cars. arXiv 2016, arXiv:1604.07316. [Google Scholar] [CrossRef]
- Gavanas, N.; Anastasiadou, K.; Nathanail, E.; Basbas, S. Transport Policy Pathways for Autonomous Road Vehicles to Promote Sustainable Urban Development in the European Union: A Multicriteria Analysis. Land 2024, 13, 1807. [Google Scholar] [CrossRef]
- Nemoto, E.H.; Jaroudi, I.; Duffner-Korbee, D.; Viere, T.; Naderer, G.; Boos, A.; van den Boom, N.; Fournier, G. Sustainability Assessment of the Integration of Automated Minibuses in Urban Mobility Systems: Learnings from the AVENUE Project. In Automated Vehicles as a Game Changer for Sustainable Mobility: Learnings and Solutions; Fournier, G., Boos, A., Konstantas, D., Attias, D., Eds.; Springer Nature: Cham, Switzerland, 2024; pp. 413–426. ISBN 978-3-031-61681-5. [Google Scholar]
- Debbaghi, F.-Z.; Rombaut, E.; Vanhaverbeke, L. Lessons Learned from Shared Automated Vehicles Pilots in Europe: An Evaluation of Safety, Traffic, and User Acceptance. Case Stud. Transp. Policy 2025, 20, 101447. [Google Scholar] [CrossRef]
- Lemardelé, C.; Baldó, A.; Aniculaesei, A.; Rausch, A.; Conill, M.; Everding, L.; Vietor, T.; Hegerhorst, T.; Henze, R.; Mátyus, L.; et al. The LogiSmile Project—Piloting Autonomous Vehicles for Last-Mile Logistics in European Cities. Transp. Res. Procedia 2023, 71, 180–187. [Google Scholar] [CrossRef]
- Gehl, J. Cities for People; Island Press: Washington, DC, USA, 2010; ISBN 978-1-59726-573-7. [Google Scholar]
- Wheeler, S.M. The Transit Metropolis: A Global Inquiry by Robert Cervero. Berkeley Plan. J. 2000, 14, 202. [Google Scholar] [CrossRef]
- Banister, D. Unsustainable Transport: City Transport in the New Century; Routledge: London, UK, 2005; ISBN 978-0-203-00388-6. [Google Scholar]
- Shaheen, S.; Cohen, A.; Zohdy, I.; United States Federal Highway Administration. Shared Mobility: Current Practices and Guiding Principles; Federal Highway Administration: Washington, DC, USA, 2016. Available online: https://ops.fhwa.dot.gov/publications/fhwahop16022/index.htm (accessed on 6 September 2025).
- Koglin, T. City Cycling by John Pucher & Ralph Buehler. Eur. Plan. Stud. 2013, 22, 227–228. [Google Scholar] [CrossRef]
- Cervero, R.; Suzuki, H.; Iuchi, K. Transforming Cities with Transit: Transit and Land-Use Integration for Sustainable Urban Development; World Bank Publications—Books: Washington, DC, USA, 2013. [Google Scholar]
- Sochor, J.; Arby, H.; Karlsson, M.; Sarasini, S. A Topological Approach to Mobility as a Service: A Proposed Tool for Understanding Requirements and Effects, and for Aiding the Integration of Societal Goals. In Proceedings of the 1st International Conference on Mobility as a Service (ICoMaaS), Tampere, Finland, 28–29 November 2017; pp. 187–201. [Google Scholar]
- Milakis, D.; Snelder, M.; van Arem, B.; van Wee, B.; Correia, G.H.d.A. Development and Transport Implications of Automated Vehicles in the Netherlands: Scenarios for 2030 and 2050. Eur. J. Transp. Infrastruct. Res. 2017, 17, 5. [Google Scholar] [CrossRef]
- Fagnant, D.J.; Kockelman, K. Preparing a Nation for Autonomous Vehicles: Opportunities, Barriers and Policy Recommendations. Transp. Res. Part A Policy Pract. 2015, 77, 167–181. [Google Scholar] [CrossRef]
- Litman, T. Autonomous Vehicle Implementation Predictions. Implications for Transport Planning. Available online: https://www.scirp.org/reference/referencespapers?referenceid=2466795 (accessed on 6 September 2025).
- Anderson, J.M.; Nidhi, K.; Stanley, K.D.; Sorensen, P.; Samaras, C.; Oluwatola, O.A. Autonomous Vehicle Technology: A Guide for Policymakers; Rand Corporation: Santa Monica, CA, USA, 2014; ISBN 978-0-8330-8437-8. [Google Scholar]
- Rahman, M.d.M.; Thill, J.-C. Impacts of Connected and Autonomous Vehicles on Urban Transportation and Environment: A Comprehensive Review. Sustain. Cities Soc. 2023, 96, 104649. [Google Scholar] [CrossRef]
- Kovačić, M.; Mutavdžija, M.; Buntak, K. New Paradigm of Sustainable Urban Mobility: Electric and Autonomous Vehicles—A Review and Bibliometric Analysis. Sustainability 2022, 14, 9525. [Google Scholar] [CrossRef]
- Gurney, J.K. Crashing into the Unknown: An Examination of Crash-Optimization Algorithms Through the Two Lanes of Ethics and Law, 79 Albany Law Review (2016). Available online: https://www.albanylawreview.org/article/69727-crashing-into-the-unknown-an-examination-of-crash-optimization-algorithms-through-the-two-lanes-of-ethics-and-law (accessed on 6 September 2025).
- European Comission Commission Delegated Regulation (EU) 2022/2236. Available online: https://eur-lex.europa.eu/eli/reg_del/2022/2236/oj/eng (accessed on 15 October 2025).
- European Commission, Commission Implementing Regulation (EU) 2022/1426. Available online: https://eur-lex.europa.eu/eli/reg_impl/2022/1426/oj/eng (accessed on 15 October 2025).
- EU-Level—Connected Automated Driving. Connected Automated Driving—Just Another WordPress Site 2019. Available online: https://www.connectedautomateddriving.eu/regulation-and-policies/eu-level/ (accessed on 15 October 2025).
- UN Regulation No. 155—Uniform Provisions Concerning the Approval of Vehicles with Regards to Cyber Security and Cyber Security Management System [2025/5]. 2025. Available online: https://eur-lex.europa.eu/legal-content/EN/TXT/PDF/?uri=OJ:L_202500005 (accessed on 15 October 2025).
- UN Regulation No. 156—Uniform Provisions Concerning the Approval of Vehicles with Regards to Software Update and Software Updates Management System, E/ECE/TRANS/505/Rev.3/Add.155. Available online: https://unece.org/sites/default/files/2024-03/R156e%20%282%29.pdf (accessed on 15 October 2025).
- European Union. Directive 2010/41/EU of the European Parliament and of the Council of 7 July 2010. Off. J. Eur. Union 2015, 207/1, 352–355. Available online: https://eur-lex.europa.eu/eli/dir/2010/41/oj/eng (accessed on 15 October 2025).
- European Union. Decision (EU) 2017/2380 of the European Parliament and of the Council—Of 12 December 2017—Amending Directive 2010/40/EU as Regards the Period for Adopting Delegated Acts. Off. J. Eur. Union 2017, 340/1, 1–3. Available online: https://eur-lex.europa.eu/eli/dec/2017/2380/oj/eng (accessed on 15 October 2025).
- Schoettle, B.; Sivak, M. A Survey of Public Opinion about Connected Vehicles in the U.S., the U.K., and Australia. In Proceedings of the 2014 International Conference on Connected Vehicles and Expo (ICCVE), Vienna, Austria, 3–7 November 2014; pp. 687–692. [Google Scholar]
- Kaur, K.; Rampersad, G. Trust in Driverless Cars: Investigating Key Factors Influencing the Adoption of Driverless Cars. J. Eng. Technol. Manag. 2018, 48, 87–96. [Google Scholar] [CrossRef]
- Nordhoff, S.; de Winter, J.; Kyriakidis, M.; van Arem, B.; Happee, R. Acceptance of Driverless Vehicles: Results from a Large Cross-National Questionnaire Study. J. Adv. Transp. 2018, 2018, 5382192. [Google Scholar] [CrossRef]
- Kyriakidis, M.; Happee, R.; de Winter, J.C.F. Public Opinion on Automated Driving: Results of an International Questionnaire among 5000 Respondents. Transp. Res. Part F Traffic Psychol. Behav. 2015, 32, 127–140. [Google Scholar] [CrossRef]
- Charness, N.; Yoon, J.S.; Souders, D.; Stothart, C.; Yehnert, C. Predictors of Attitudes Toward Autonomous Vehicles: The Roles of Age, Gender, Prior Knowledge, and Personality. Front. Psychol. 2018, 9, 2589. [Google Scholar] [CrossRef] [PubMed]
- Payre, W.; Cestac, J.; Delhomme, P. Intention to Use a Fully Automated Car: Attitudes and a Priori Acceptability. Transp. Res. Part F Traffic Psychol. Behav. 2014, 27, 252–263. [Google Scholar] [CrossRef]
- Kröger, L.; Kuhnimhof, T.; Trommer, S. Does Context Matter? A Comparative Study Modelling Autonomous Vehicle Impact on Travel Behaviour for Germany and the USA. Transp. Res. Part A Policy Pract. 2019, 122, 146–161. [Google Scholar] [CrossRef]
- Haboucha, C.J.; Ishaq, R.; Shiftan, Y. User Preferences Regarding Autonomous Vehicles. Transp. Res. Part C Emerg. Technol. 2017, 78, 37–49. [Google Scholar] [CrossRef]
- Levin, M.W.; Kockelman, K.M.; Boyles, S.D.; Li, T. A General Framework for Modeling Shared Autonomous Vehicles with Dynamic Network-Loading and Dynamic Ride-Sharing Application. Comput. Environ. Urban Syst. 2017, 64, 373–383. [Google Scholar] [CrossRef]
- Rödel, C.; Stadler, S.; Meschtscherjakov, A.; Tscheligi, M. Towards Autonomous Cars: The Effect of Autonomy Levels on Acceptance and User Experience. In Proceedings of the 6th International Conference on Automotive User Interfaces and Interactive Vehicular Applications, Seattle, WA, USA, 17–19 September 2014; Association for Computing Machinery: New York, NY, USA; pp. 1–8. [Google Scholar]
- Verberne, F.M.F.; Ham, J.; Midden, C.J.H. Trust in Smart Systems: Sharing Driving Goals and Giving Information to Increase Trustworthiness and Acceptability of Smart Systems in Cars. Hum. Factors 2012, 54, 799–810. [Google Scholar] [CrossRef]
- Dianin, A.; Ravazzoli, E.; Hauger, G. Implications of Autonomous Vehicles for Accessibility and Transport Equity: A Framework Based on Literature. Sustainability 2021, 13, 4448. [Google Scholar] [CrossRef]
- Rosenbloom, S. The Mobility Needs of Older Americans: Implications for Transportation Reauthorization, The Brookings Institution—Series on Transportation Reform. Available online: https://www.brookings.edu/wp-content/uploads/2016/06/20030807_Rosenbloom.pdf (accessed on 8 September 2025).
- Schweitzer, L.; Valenzuela, A., Jr. Environmental Injustice and Transportation: The Claims and the Evidence. J. Plan. Lit. 2004, 18, 383–398. [Google Scholar] [CrossRef]
- Binns, R. Fairness in Machine Learning: Lessons from Political Philosophy. In Proceedings of the 1st Conference on Fairness, Accountability and Transparency, New York, NY, USA, 23–24 January 2018; pp. 149–159. [Google Scholar]
- UITP Global Urban Mobility Indicators. Public Transport Metrics from 53 Cities Worldwide in 2023. Available online: https://mylibrary.uitp.org/GED_V14/298938001611/20250812_Global-Urban-Mobility-Indicators-GUMI_Statistics_Brief_WEB.pdf (accessed on 8 September 2025).
- Potts, I.B.; Harwood, D.W.; Cook, D.J.; Moran, R.A.; Busenbark, L. Highway and Street Design Vehicles: An Update; Transportation Research Board: Washington, DC, USA, 2023; ISBN 978-0-309-69897-9. [Google Scholar]
- Gori, V.; Hendrix, W.; Das, A.; Sun, Z. Effect of Weight Distribution and Active Safety Systems on Electric Vehicle Performance. Sensors 2024, 24, 3557. [Google Scholar] [CrossRef]
- Hatzenbühler, J.; Jenelius, E.; Gidófalvi, G.; Cats, O. Modular Vehicle Routing for Combined Passenger and Freight Transport. Transp. Res. Part A Policy Pract. 2023, 173, 103688. [Google Scholar] [CrossRef]
- Martini, D.; Bezzini, P.; Longo, M. Environmental Impact of Electrification on Local Public Transport: Preliminary Study. Energies 2024, 17, 5886. [Google Scholar] [CrossRef]
- Buekers, J.; Van Holderbeke, M.; Bierkens, J.; Int Panis, L. Health and Environmental Benefits Related to Electric Vehicle Introduction in EU Countries. Transp. Res. Part D Transp. Environ. 2014, 33, 26–38. [Google Scholar] [CrossRef]
- European Commission European Clean Bus Deployment Initiative. Available online: https://transport.ec.europa.eu/transport-themes/clean-transport/european-clean-bus-deployment-initiative_en (accessed on 5 September 2025).
- Jensen, J.O.; Christensen, T.H.; Gram-Hanssen, K. Sustainable Urban Development—Compact Cities or Consumer Practices? Dan. J. Geoinform. Land Manag. 2011, 119, 50–64. [Google Scholar] [CrossRef]
- European Commission Fit for 55: Delivering the EU’s 2030 Climate Target, 2021. Available online: https://eur-lex.europa.eu/legal-content/EN/TXT/HTML/?uri=CELEX:52021DC0550 (accessed on 5 September 2025).
- Comune di Lucca Piano Della Mobilità Sostenibile—Relazione Generale, Atto Normative. Available online: https://www.comune.lucca.it/documento_pubblico/piano-della-mobilita-sostenibile-relazione-generale/ (accessed on 5 September 2025).
- DeRobertis, M.; Tira, M. The Most Widespread Traffic Control Strategy You’ve Never Heard of: Traffic-Restricted Zones in Italy. Ite J. Inst. Transp. Eng. 2016, 44–49. Available online: https://www.semanticscholar.org/paper/The-Most-Widespread-Traffic-Control-Strategy-You%27ve-DeRobertis-Tira/42bef80ce5226254b7814b10423d479db448a5f1 (accessed on 5 September 2025).
- Comune di Viareggio Piano Urbano della Mobilità Sostenibile (P.U.M.S.). Available online: http://viareggio-pnrr.web.kibernetes.net/home/amministrazione/Strumenti-urbanistici-di-Governo-del-Territorio/Piani-di-settore/Piano-Urbano-Mobilita--Sostenibile.html (accessed on 5 September 2025).
- Traffic Study for Municipality of Brasov. Available online: https://www.brasovcity.ro/file-zone/transport-public/studiu-trafic/Actualizare%20studiu%20de%20trafic%20Brasov_Livrabil4_v6_15.03.2021.pdf (accessed on 6 September 2025).
- Electric Van|New Energy Vehicle Manufacturer|Zhongtong Bus. Available online: http://zhongtongbuses.com/5-3-electric-van.html (accessed on 24 September 2025).
- 12 Seater Electric Mini Coach Bus for Trip-Yutong. Available online: https://en.yutong.com/products/E7S.shtml (accessed on 24 September 2025).
- SOR EBN—SOR Libchavy s.r.o. Available online: https://www.sor.cz/en/ebn/ (accessed on 24 September 2025).
- Karjanto, J.; Yusof, N.M.; Terken, J.; Delbressine, F.; Hassan, M.Z.; Rauterberg, M. Simulating Autonomous Driving Styles: Accelerations for Three Road Profiles. MATEC Web Conf. 2017, 90, 01005. [Google Scholar] [CrossRef]
- Bosetti, P.; Da Lio, M.; Saroldi, A. On the Human Control of Vehicles: An Experimental Study of Acceleration. Eur. Transp. Res. Rev. 2014, 6, 157–170. [Google Scholar] [CrossRef]
- de Winkel, K.N.; Irmak, T.; Happee, R.; Shyrokau, B. Standards for Passenger Comfort in Automated Vehicles: Acceleration and Jerk. Appl. Ergon. 2023, 106, 103881. [Google Scholar] [CrossRef]
- Pigeon, C.; Alauzet, A.; Paire-Ficout, L. Factors of Acceptability, Acceptance and Usage for Non-Rail Autonomous Public Transport Vehicles: A Systematic Literature Review. Transp. Res. Part F Traffic Psychol. Behav. 2021, 81, 251–270. [Google Scholar] [CrossRef]
- Antonios, T.E.; Konstantinos, A.; Basil, P. Vehicles Lateral Acceleration and Speed Profiles Investigation at the Entry Area of Interchange Ramps as a Criterion of Geometric Road Design. Transp. Res. Procedia 2023, 69, 13–20. [Google Scholar] [CrossRef]
- Beckers, C.J.J. Energy Consumption Prediction for Electric City Buses: Using Physics-Based Principles. Ph.D. Thesis, Technische Universiteit Eindhoven, Eindhoven, The Netherlands, 2022. [Google Scholar]
- Berjoza, D.; Jurgena, I.; Millers, R. Effect of electric vehicle mass change on energy consumption and the range. Agronomy Res. 2024, 22, 1089–1097. [Google Scholar] [CrossRef]
- Wu, X.; Freese, D.; Cabrera, A.; Kitch, W.A. Electric Vehicles’ Energy Consumption Measurement and Estimation. Transp. Res. Part D Transp. Environ. 2015, 34, 52–67. [Google Scholar] [CrossRef]
- Pozna, C.R.; Antonya, C.; Horváth, E. Case Study on the Tactical Level of an Autonomous Vehicle Control. In Proceedings of the 2021 International Conference on Electrical, Computer, Communications and Mechatronics Engineering (ICECCME), Mauritius, Mauritius, 7–8 October 2021; pp. 1–6. [Google Scholar]
- Pozna, C.R.; Antonya, C. Proposal of an Autonomous Vehicle Control Architecture. In Proceedings of the 2021 IEEE 25th International Conference on Intelligent Engineering Systems (INES), Budapest, Hungary, 7–9 July 2021; pp. 000037–000042. [Google Scholar]
- Wang, X.; Qi, X.; Wang, P.; Yang, J. Decision Making Framework for Autonomous Vehicles Driving Behavior in Complex Scenarios via Hierarchical State Machine. Auton. Intell. Syst. 2021, 1, 10. [Google Scholar] [CrossRef]
- ITS The Total Deployment Cost for an Automated Shuttle Pilot Project in Utah Was Estimated at $627,000.|ITS Deployment Evaluation. Available online: https://www.itskrs.its.dot.gov/2022-sc00509 (accessed on 15 October 2025).
- ITS Autonomous Vehicle Fleet Ownership and Operating Costs Are Expected to Be Half That of Traditional Vehicles by 2030–2040. |ITS Deployment Evaluation. Available online: https://www.itskrs.its.dot.gov/2018-sc00406 (accessed on 15 October 2025).
- Wadud, Z.; Mattioli, G. Fully Automated Vehicles: A Cost-Based Analysis of the Share of Ownership and Mobility Services, and Its Socio-Economic Determinants. Transp. Res. Part A Policy Pract. 2021, 151, 228–244. [Google Scholar] [CrossRef]
- Tirachini, A.; Antoniou, C. The Economics of Automated Public Transport: Effects on Operator Cost, Travel Time, Fare and Subsidy. Econ. Transp. 2020, 21, 100151. [Google Scholar] [CrossRef]
- Foresights, M. Global Autonomous Shuttle Market 2024–2030. Available online: https://mobilityforesights.com/product/autonomous-shuttle-market (accessed on 15 October 2025).
- Robot Shuttles and Autonomous Buses Market Report|Forecast [2033]. Available online: https://www.marketgrowthreports.com/market-reports/robot-shuttles-and-autonomous-buses-market-114251 (accessed on 15 October 2025).
- Gusev, M.; Gilroy, S. The Effectiveness of Autonomous Public Transport Systems in Densely Populated Urban Areas. Transp. Econ. Manag. 2025, 3, 1–8. [Google Scholar] [CrossRef]
- Steinvorth, A.; Gutiérrez, K.; Campos, E.; Macêdo, B.; Batista, M.; Tenenbaum, G.; Maltese, T.; Rosa, A.; Galarza, S.; Acevedo, H. Pipeline of Electric Bus Projects in Latin America an Overview of 32 Cities; 2023. Available online: https://www.c40.org/wp-content/uploads/2023/04/FINAL-Pipeline-of-Electric-Bus-Projects-in-Latin-America-compressed.pdf?utm_source=chatgpt.com (accessed on 15 October 2025).
- Quarles, N.; Kockelman, K.M.; Mohamed, M. Costs and Benefits of Electrifying and Automating Bus Transit Fleets. Sustainability 2020, 12, 3977. [Google Scholar] [CrossRef]
- Bösch, P.M.; Becker, F.; Becker, H.; Axhausen, K.W. Cost-Based Analysis of Autonomous Mobility Services. Transp. Policy 2018, 64, 76–91. [Google Scholar] [CrossRef]
- Dev, A. Government Hires Two Agencies to Run 500 Electric Buses for 12 Years. The Times of India. 2025. Available online: https://timesofindia.indiatimes.com/city/noida/government-hires-two-agencies-to-run-500-electric-buses-for-12-years/articleshow/122032583.cms?utm_source=chatgpt.com (accessed on 15 October 2025).


Disclaimer/Publisher’s Note: The statements, opinions and data contained in all publications are solely those of the individual author(s) and contributor(s) and not of MDPI and/or the editor(s). MDPI and/or the editor(s) disclaim responsibility for any injury to people or property resulting from any ideas, methods, instructions or products referred to in the content. |
© 2025 by the authors. Licensee MDPI, Basel, Switzerland. This article is an open access article distributed under the terms and conditions of the Creative Commons Attribution (CC BY) license (https://creativecommons.org/licenses/by/4.0/).