1. Introduction
The safety assurance of Connected, Cooperative, and Automated Mobility (CCAM) systems [
1] remains a fundamental challenge for large-scale deployment and acceptance. Such systems must reliably operate across various driving scenarios, necessitating a comprehensive safety argumentation framework. As higher levels of automation are pursued, validation through conventional real-world testing becomes impractical due to the vast number of scenarios requiring evaluation. Consequently, a combination of physical and virtual testing has emerged as a more viable solution, with virtual platforms reducing the overall verification and validation effort and addressing the so-called “billion-mile” challenge [
2]. Several international initiatives have begun refining test and validation strategies by transitioning from traditional methodologies to scenario-based testing frameworks [
3,
4]. In scenario-based testing, CCAM systems are evaluated by subjecting the vehicle under test to specific traffic scenarios and environmental parameters to ensure that it behaves safely under various conditions. On the regulatory side, the New Assessment/Test Methodology (NATM) [
3] developed by UNECE advances the so-called multi-pillar approach, combining scenario-based testing in simulation and controlled test facilities, real-world testing, audit activities, and in-service monitoring.
Figure 1 illustrates the scope of NATM.
However, a considerable gap persists between overarching schematic descriptions in the current frameworks and concrete guidance in the form of well-defined standards or guidelines. While NATM establishes the premises for safety assurance, it offers limited practical guidance on structuring arguments, defining acceptance criteria, and allocating verification activities across environments. The absence of a common validation framework impedes these technologies’ safe and large-scale deployment, with existing or developing standards representing only initial steps toward harmonised assessment. A principal difficulty lies in the lack of comprehensive safety assessment criteria that can be consistently applied across the entire parameter space of driving scenarios, further complicated by regional variations in regulations, signage, and driver behaviour. Several European research projects are paving the way for such a framework, including [
5,
6,
7]. The SUNRISE project [
6] developed a safety assurance framework (SAF) focused on input definition and the assessment of top-level vehicle behaviour, i.e., part of the NATM scope (see
Figure 1). The framework applies a harmonised scenario representation and draws on a federated European scenario database. It is demonstrated across simulation, XiL-based testing, and proving ground experiments. The approach emphasises coverage of test scenarios within the operational design domain (ODD) and integrates key performance indicators (KPIs) to support systematic evaluation of safety criteria. Within the assurance process, the KPIs are devised to be explicitly linked to argumentation, thereby substantiating the claims made in the assurance case.
The novelty of this paper lies in demonstrating how a harmonised and scalable safety assurance framework, which fulfils the assumption of conformance to the New Assessment/Test Method (NATM), can be operationalised and made actionable for real-world application. The main contribution is to show how such a framework can be applied in practice through a structured and traceable process that does not rely on continuous test code maintenance [
8]. Instead, the framework is kept automatically aligned with the prevailing traffic environment through a continuously updated scenario database. Relevant scenarios are retrieved by querying this database with operational design domain (ODD) and dynamic driving task (DDT) constraints, forming the basis for generating a well-defined test space that ensures consistent coverage without imposing excessive testing overhead. Since an exhaustive exploration of the scenario space is infeasible in most cases due to its size, scenario selection must follow a strategic approach, supported by an explicit argument that no significant gaps remain that could give rise to unreasonable risk. Evidence collected from heterogeneous virtual and physical test environments demonstrates that the defined key performance indicators retain their validity across varied operational conditions, thereby substantiating the claim of safety and reliability within the designated setting.
The operationalisation is exemplified through the recently released SUNRISE SAF [
9], applied to a real-world use case involving an automated driving system (ADS) feature for trucks performing automated docking at a logistics hub. For demonstration, a rather limited scenario is chosen where a truck with a semi-trailer is parked in a staging area by a human driver and then automatically executes a reverse manoeuvre to dock at the designated port. Thereby, the ODD and the scenario space are intentionally restricted. The use case is evaluated across heterogeneous test environments, including simulation using CARLA [
10,
11], an automated scaled model truck, and a full-scale truck.
The contribution further incorporates an integrated pathway that formalises end-user needs into measurable key performance indicators and acceptance thresholds; defines a parametrised scenario space that couples operational conditions (scenarios within the declared ODD [
12]) with internal system conditions; orchestrates exploration in heterogeneous test environments using complementary test models while tracking coverage; interprets outcomes through predefined test metrics and aggregation rules; manages completion via explicit coverage targets and stopping criteria; and consolidates the resulting evidence into a pass/fail judgment embedded in a structured safety argument with clearly stated assumptions and limitations. The value lies in the linkages and bidirectional traceability across the elements depicted in
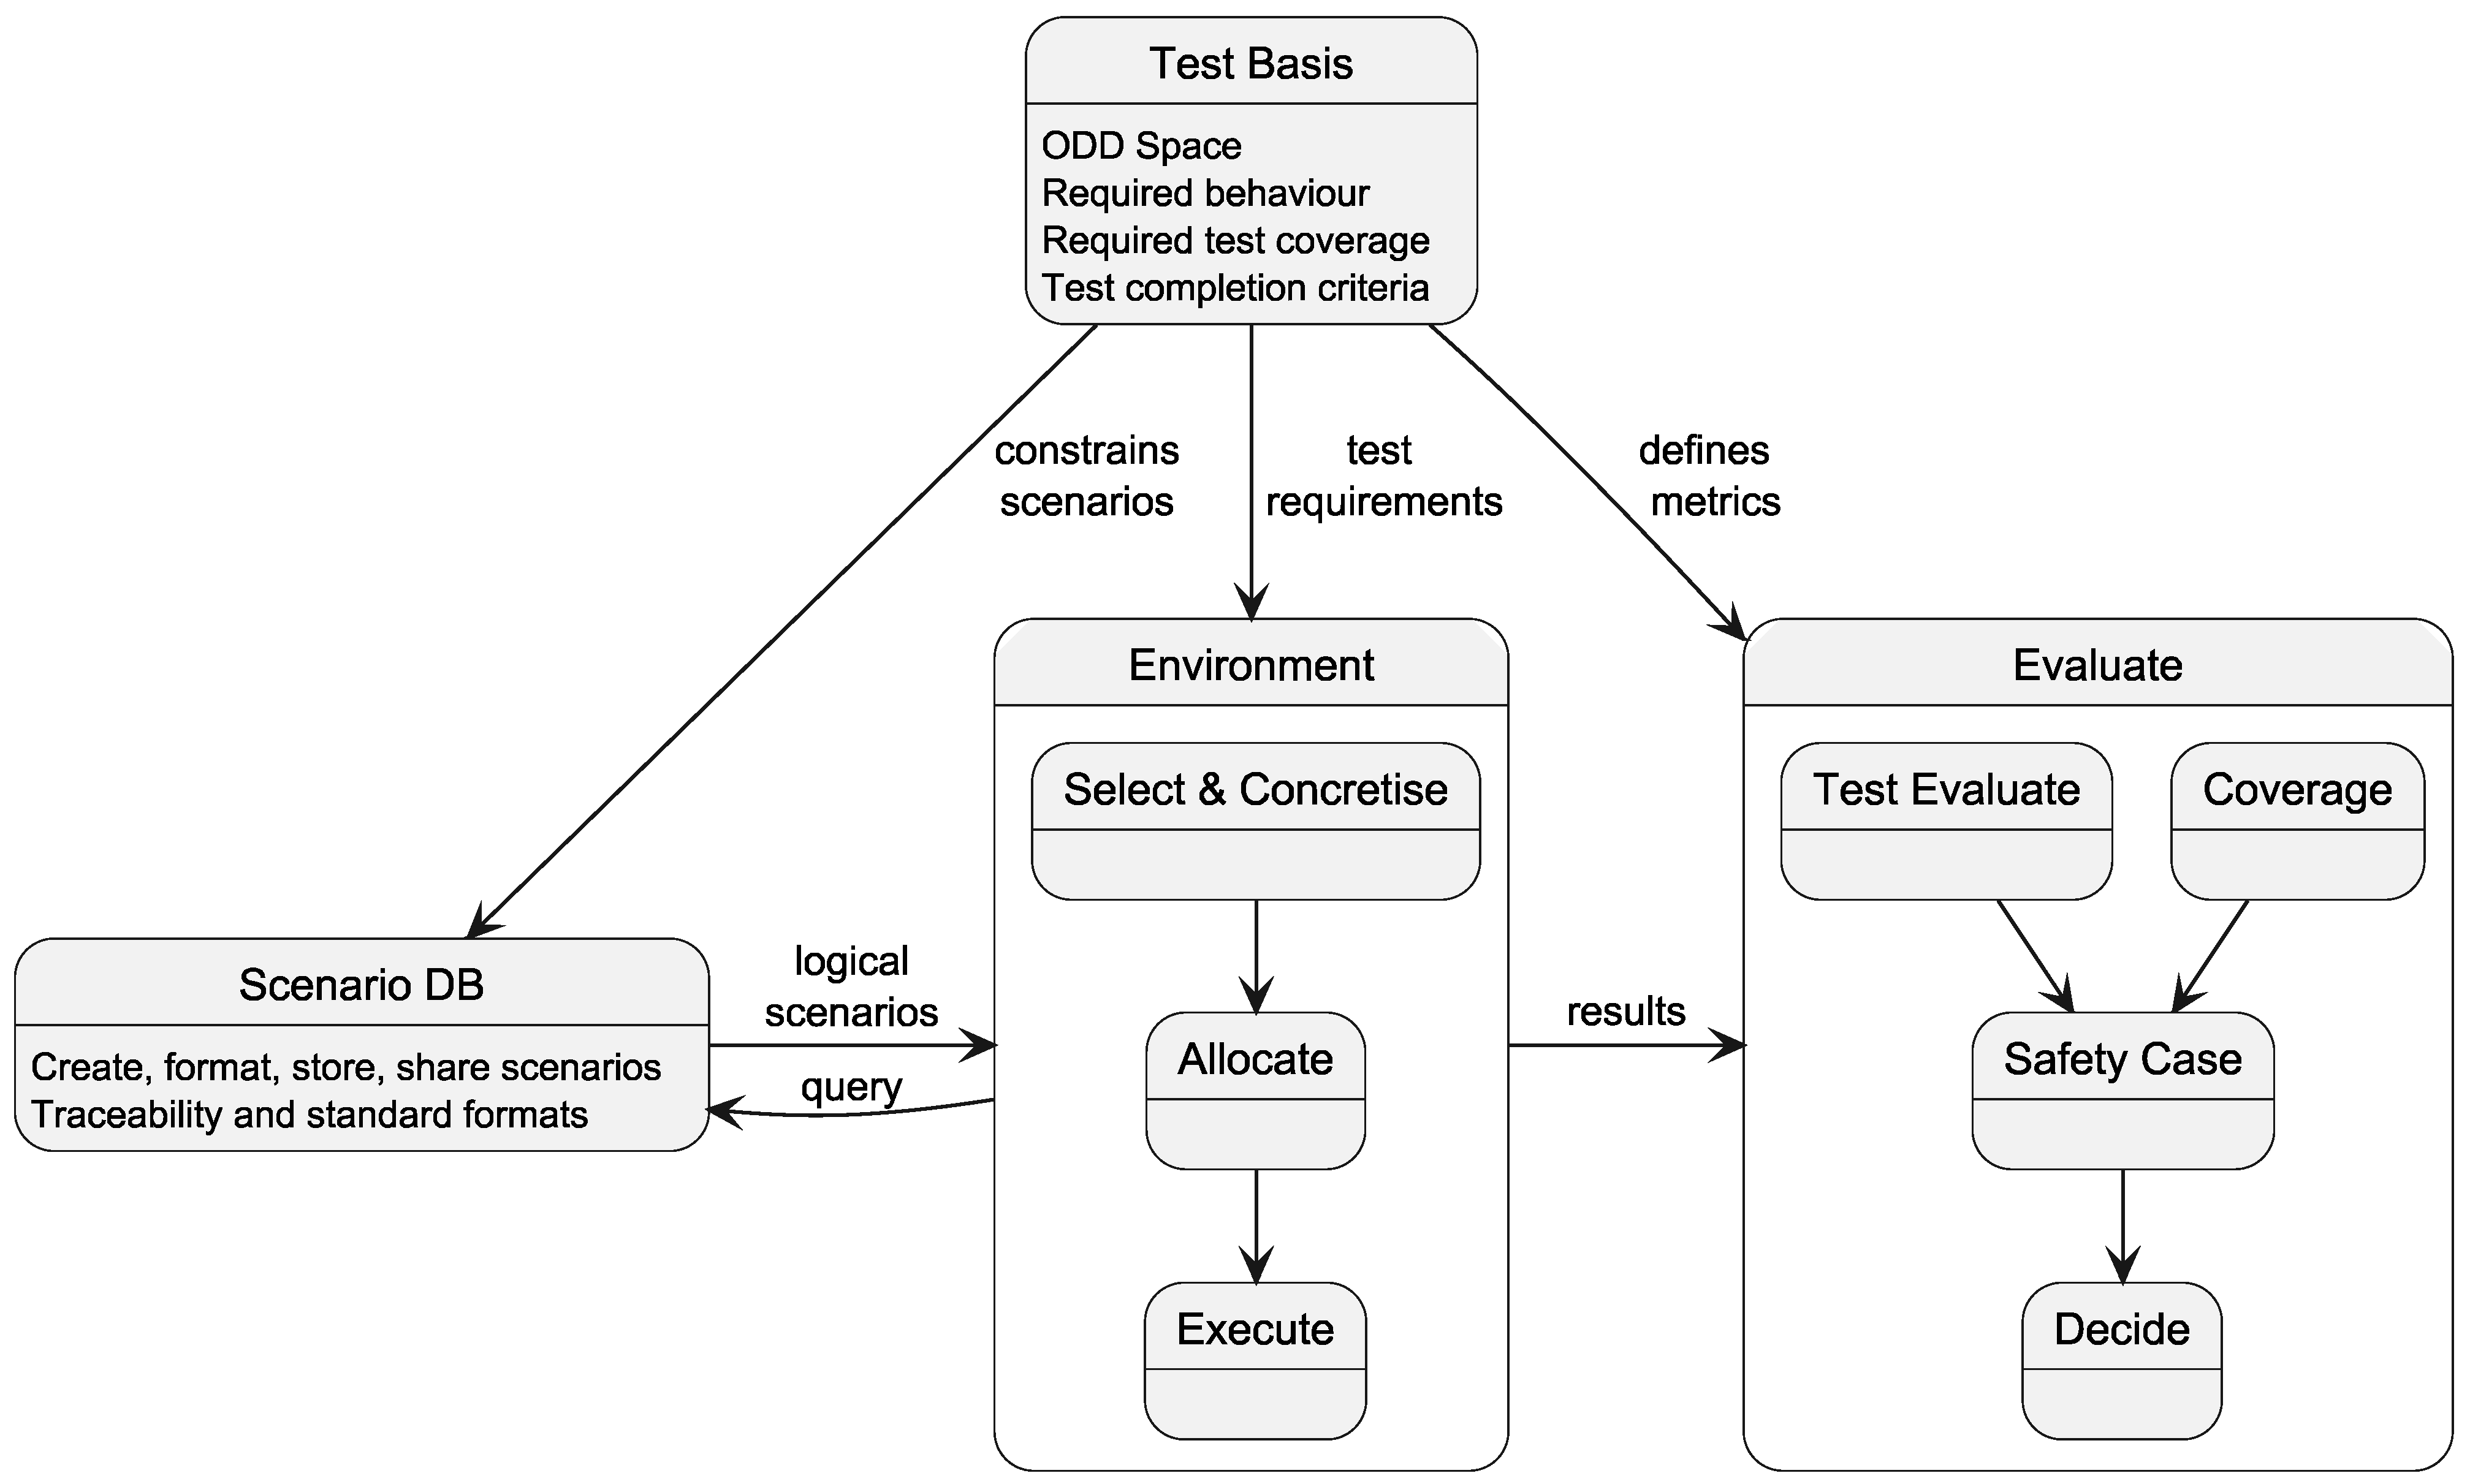
Figure 2, where requirements articulate the needs and decisions determine whether those needs are met. This yields a coherent workflow that supports consistent allocation, comparability of evidence across environments, and defensible claims about exercised scenarios and operational subspaces.
The value lies in the linkages and bidirectional traceability across the elements depicted in
Figure 2, where requirements articulate the needs and decisions determine whether those needs are met. This yields a coherent workflow that supports consistent allocation, comparability of evidence across environments, and defensible claims about exercised scenarios and operational subspaces.
To support this operationalisation, the paper presents the development of WayWiseR [
13], a ROS2-based [
14] rapid prototyping platform, and its integration with the CARLA simulation environment [
11]. By combining modular ROS 2 components, simulation environments such as CARLA, and scaled vehicle hardware, the platform enables rapid development, testing, and iteration of validation concepts. The artefacts are released for research use, enabling reproducible experiments and facilitating unified scenario execution across both simulation and hardware-in-the-loop configurations. While the system architecture of WayWiseR and initial results were introduced in earlier work [
15], this paper extends that work by presenting comprehensive results and demonstrating its role in enabling the validation of safety assurance framework concepts across both simulated and physical platforms.
The paper is organised as follows.
Section 1 introduces the problem;
Section 2 reviews background and related work;
Section 3 presents the tailored SAF instance;
Section 4 introduces the use case.
Section 5 describes the demonstrated cross-sections between the SAF and the use case;
Section 6 outlines the employed test environments.
Section 7 operationalises and evaluates the SAF, and
Section 9 discusses results and outlines directions for future work.
2. Background
Research on safety assurance for CCAM benefits from explicit alignment with the NATM [
3], which offers a regulator-oriented frame of reference that can enhance the relevance, comparability, and assessability of evidence across programs and jurisdictions. Developed by the UNECE WP.29/GRVA through its VMAD group, NATM provides a harmonised multi-pillar basis for assessment, supporting type-approval and in-service oversight. This approach addresses the limitations of isolated road testing by integrating audits, scenario-based evaluations, proving-ground trials, and monitored operations. For the United States, NHTSA’s scenario testing framework [
4] provides method-level guidance to structure ODD attributes and derive scenario-based tests across simulation, proving-ground, and limited on-road trials.
The SUNRISE [
6] SAF aims at serving both development, assessment, and regulation. The SAF integrates a method for structuring safety argumentation and managing scenarios and metrics, a toolchain for virtual, hybrid, and physical testing, and a data framework that federates external scenario sources, supports query-based extraction and allocation, and consolidates results. The project evaluates the SAF through urban, highway, and freight use cases spanning simulation and real-world assets to expose gaps, validate interfaces, and assess evidence generation. The work presented in this paper instantiates the SUNRISE SAF [
9] and details how each step of the tailored SAF process in
Section 3 can be made actionable for a use case in practice (
Section 4). Specifically, the instance clarifies how assumptions and inputs are made explicit, how claims are decomposed into verifiable objectives, how evidence is planned and synthesised with traceability, and how decision points for progression are justified. Together, this provides a concrete pathway from NATM’s high-level expectations to assessable, reproducible activities for the considered use case.
Scenario-based testing for automated driving has gained prominence, underpinned by the ISO 3450x series on test scenarios for automated driving systems [
12,
16,
17,
18,
19], which can be coupled with proven foundational and verification concepts, e.g., as introduced in ISO 29119 Software and systems engineering—Software testing [
20].
Vehicle technologies that integrate into the transport system infrastructure foster the need to validate the system. As Burden notes, such integration accentuates the challenge of reconciling technological innovation with existing regulatory frameworks [
21]. This tension underscores the broader demand for verification and validation of key enabling technologies, which serve as practical specifications of current challenges. Building on this, Sobiech et al. [
22] argue that assurance frameworks must evolve beyond purely technical considerations by embedding policy-level requirements, thereby aligning safety arguments with both regulatory expectations and societal concerns. The collective data from European stakeholders thus provides a valuable overview of prerequisites for both development and testing, and a harmonised validation framework that is grounded in the same data is imperative, particularly if that data defines the tests.
Operationalising NATM through scenario databases and multi-pillar testing has been outlined by den Camp and de Gelder [
23] in general terms, with particular emphasis on database interaction. The work presented here complements that contribution by addressing some challenges that remain, providing an end-to-end walk-through based on a concrete use case, demonstrating the tracing of external requirements to KPIs, the derivation of scenarios from ODD and DDT, the allocation of test cases, and, in particular, assessing whether a given test suite achieves sufficient coverage of the relevant test space is still difficult. A prudent way forward is to develop systematic methods that trace scenario requirements to operational design domain abstractions [
24,
25] and map them to the capabilities and limitations of heterogeneous test environments [
26,
27], thereby enabling principled test allocation [
28], comparable evidence across environments [
29], and defensible coverage claims [
30]. This paper advances that direction by tailoring the SUNRISE SAF to operationalise such systematic methods, demonstrating how coverage-oriented allocation can be evaluated in practice.
5. Demonstrating the Tailored SAF
The tailored SAF is applied to the automated parking use case introduced in
Section 4, focusing on performance within defined operational conditions and compliance with safety requirements. The demonstration follows the SAF workflow, from requirement definitions and ODD specifications to scenario development, allocation, execution, and evaluation.
5.1. Requirements
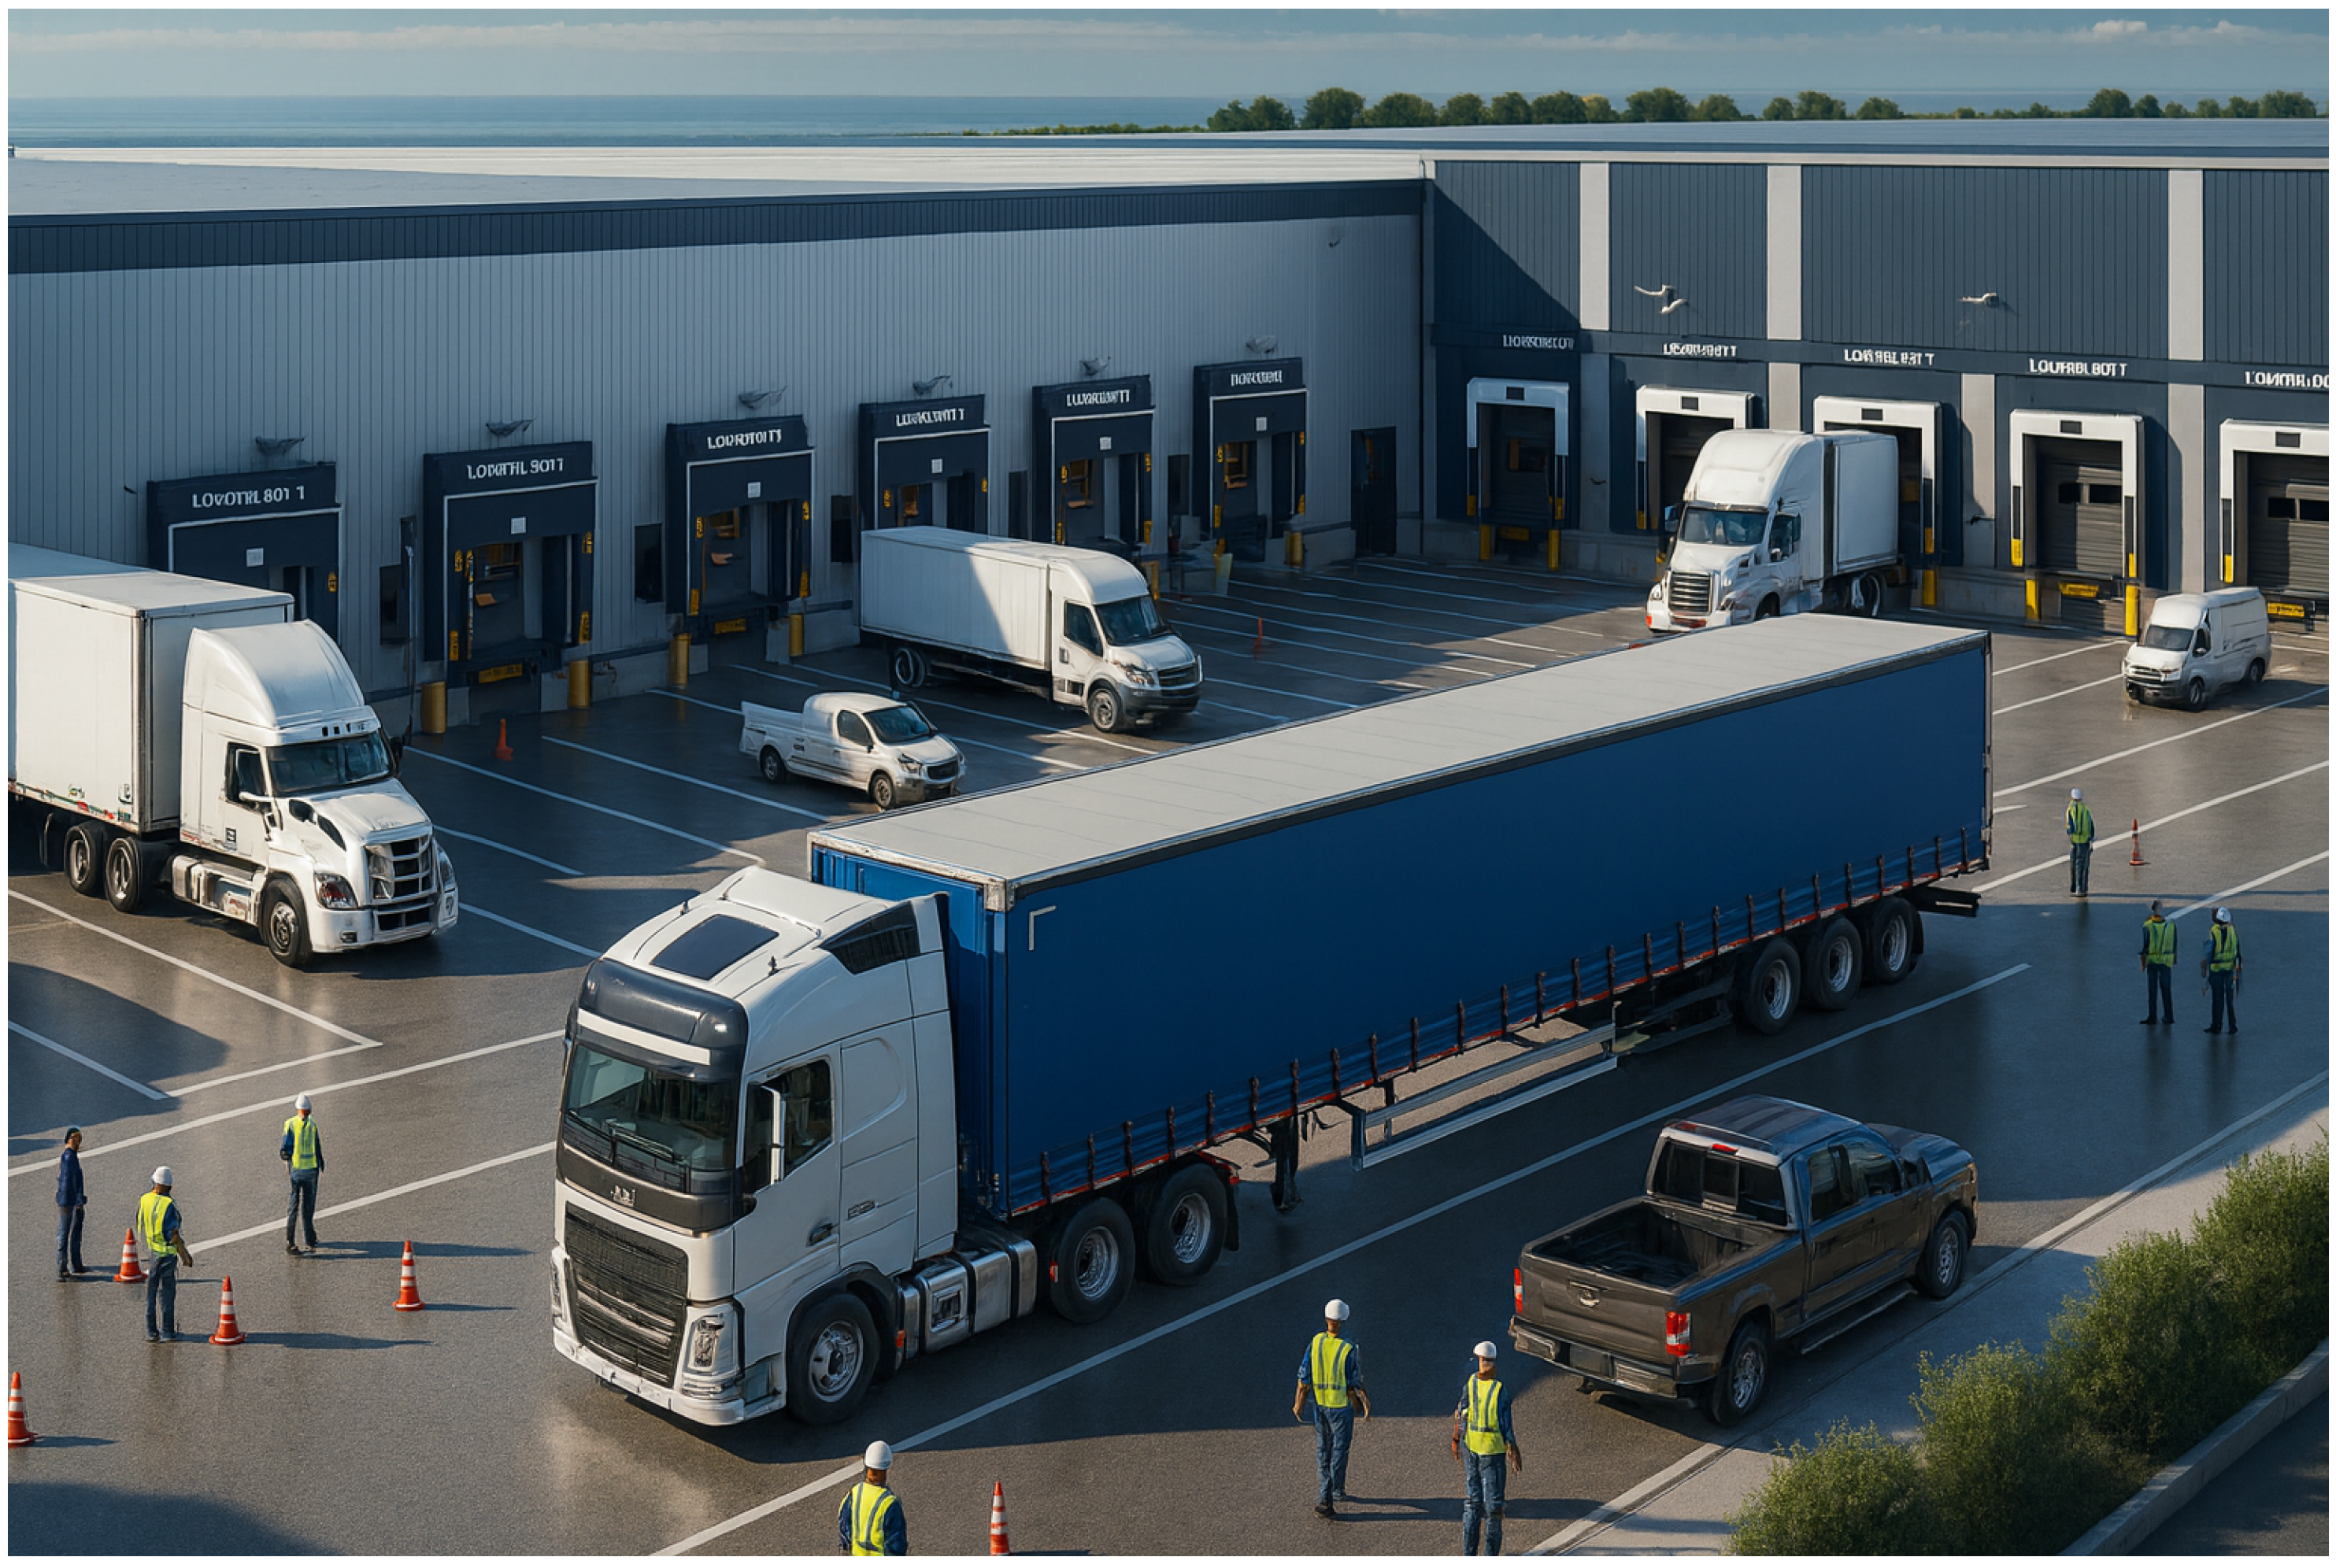
System requirements are derived from end-user needs and provide the foundation for subsequent scenario development and evaluation. The automated truck begins its manoeuvre from a designated staging area and must be able to traverse a busy logistics hub in a manner comparable to human-driven vehicles. Its behaviour shall be predictable and bounded, ensuring that other road users can anticipate its actions. The truck shall only engage the automated parking function when all required operating conditions are fulfilled. During the manoeuvre, the truck shall avoid collisions with static and dynamic objects. If the truck is unable to handle the situation, it shall always be capable of transitioning to a safe state by coming to a controlled stop. Finally, the truck shall be able to reverse into a docking position and park the trailer with high accuracy. A schematic view of the user needs is shown in
Figure 5 with numbers concluded based on discussions with truck drivers from Chalmers Revere.
5.2. Metrics
The safety goals (SGs) were identified through hazard analysis and risk assessment (HARA) [
43,
44]. From these, two goals were selected as particularly relevant, showcasing the substantiation of the claims that must be made to fulfil the system requirements. These goals serve as the basis for defining key performance indicators (KPIs) that support the systematic evaluation of safety criteria. The selected safety goals are as follows:
- SG 1
The vehicle shall not collide.
- SG 2
The vehicle shall not operate if the required conditions are not fulfilled.
Based on the identified safety goals, three KPIs were defined to operationalise the evaluation. Each KPI addresses a specific aspect of safe operation, ranging from docking precision to bounded manoeuvring and robustness under varying operational conditions. While KPIs can in principle be formulated for many purposes, in an independent performance assessment, they are best kept to a few in number, yet sufficiently detailed to provide meaningful resolution of safety performance in selected situations. In this implementation, we chose merged indicators closely tied to the use case rather than reporting raw vehicle performance measures such as speed, maximum steering angle, or steering frequency. These aspects are instead implicitly captured within the KPI definitions—for example, KPI 1 on docking precision and KPI 2 on safety zone infractions. Careful KPI selection is critical to ensure validity and measurability over time, making them relevant not only for one-time pre-market assessment but also for continuous monitoring and lifecycle assurance. In this way, the KPIs contribute both to demonstrating compliance at the point of release and to substantiating maintained compliance throughout operation.
- KPI 1
evaluates the docking precision of the semi-truck by repeatedly starting from the same position.
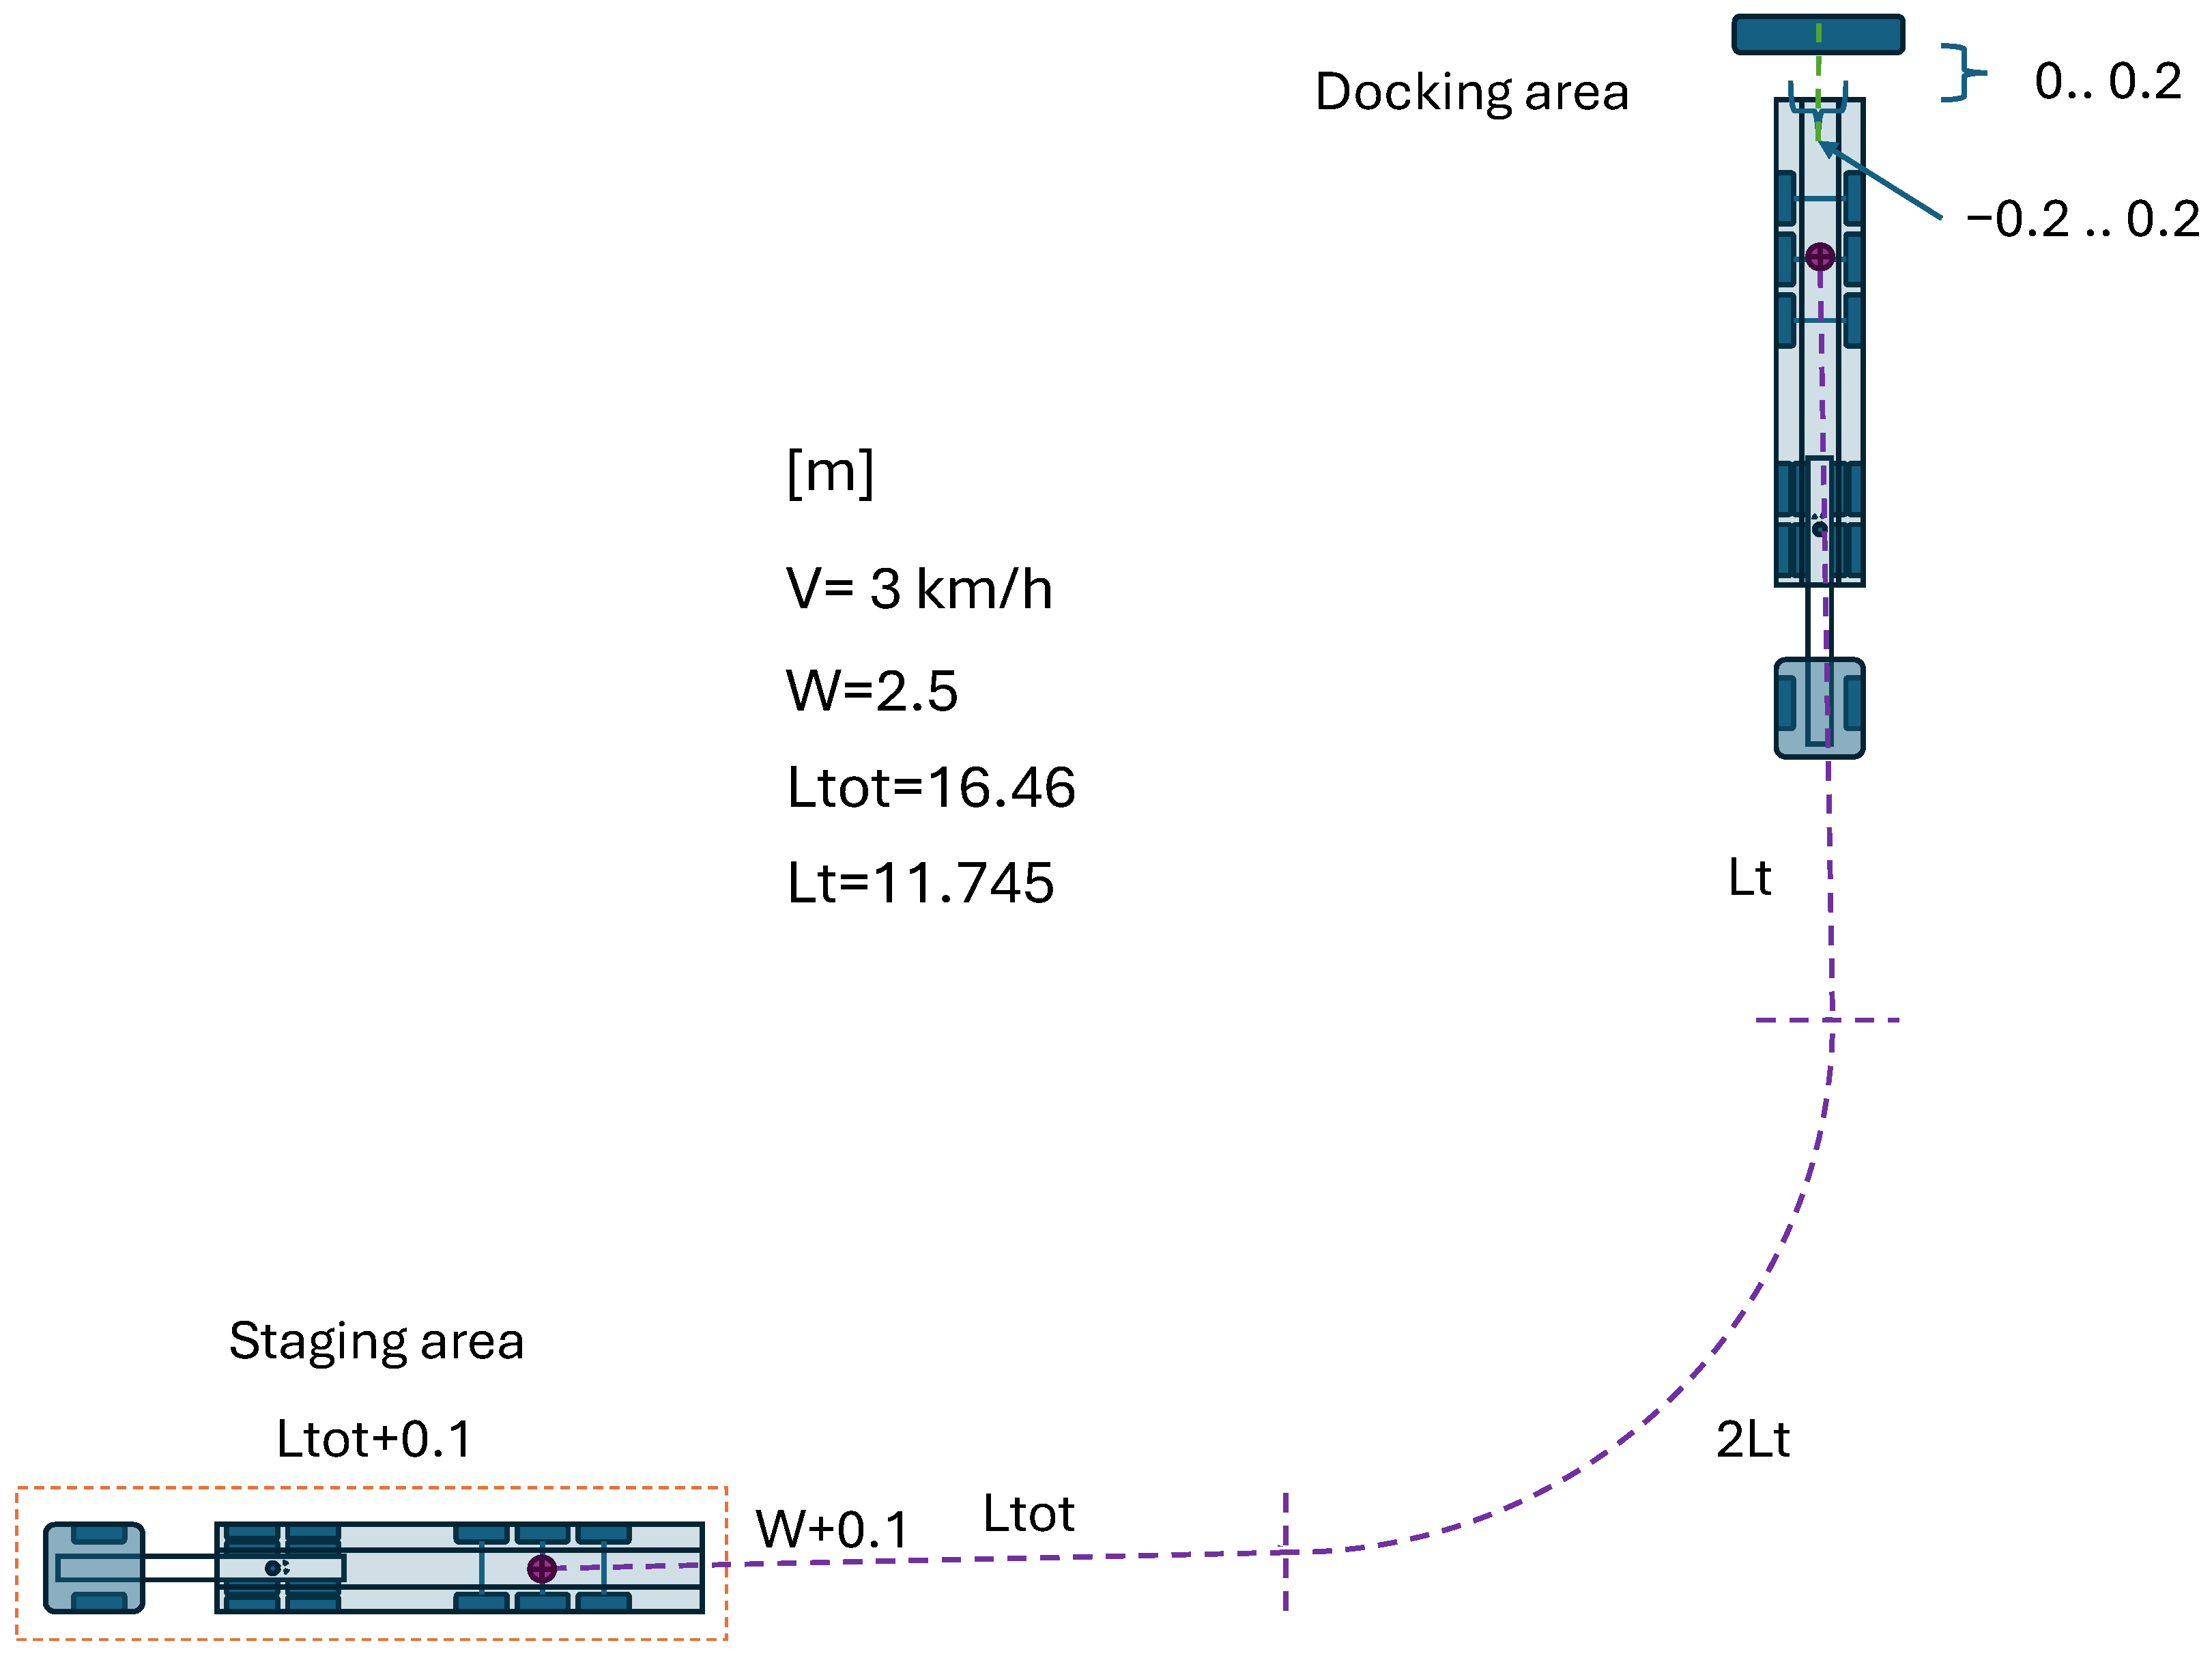
Figure 6 shows a schematic illustration of the test setup, where the light condition specified by the ODD is daylight.
- KPI 2
introduces a safety zone where the truck is expected to move. The starting position varies in this scenario, and the test examines whether the truck remains inside the safety zone. The indicator is schematically illustrated in
Figure 6, with sensor conditions optimised for daylight. To increase complexity, the ODD can be extended to include reduced-light scenarios, enabling the assessment of how the semi-truck performs in dimmed conditions.
- KPI 3
focuses on variations in the ODD by adding the presence of obstructing objects and altering environmental factors. As shown in
Figure 6, this setup allows for a deeper exploration of the truck’s performance under changing conditions to ensure robust compliance with safety requirements. (In this demonstrator, KPI 3 serves to show how formalised ODD parameters inform environment suitability for perception-related assessment within the SAF workflow; direct object-detection performance evaluation is intentionally not executed at this stage).
These KPIs are shown in
Figure 6 together with the safety zone introduced in KPI2.
5.3. Scenario Selection and Allocation
The complete scenario space for the automated parking function consists of all admissible combinations of operational design domain parameters, infrastructure constraints, internal system states, and dynamic interactions. In a full-scale implementation, subsets of this space would be retrieved through structured queries to a scenario database to ensure traceability and reproducibility.
Exploring the full space in physical testing is infeasible; therefore, representative subsets are derived using coverage and hazard relevance criteria in the Select & Concretise block. The result is a smaller test space to be handled in the Allocation block of the SAF, where scenarios are assigned to the most suitable test environments. This allows defensible evidence to be obtained with minimal effort by relying primarily on simulation, complemented with selected physical tests for validation. Nominal docking runs are typically executed in simulation, while edge cases, such as extreme starting angles or reduced visibility, are verified physically. If coverage gaps or uncertainties are identified, scenarios can be reallocated iteratively to alternative environments.
During this work, no scenario database was available. Instead, a logical scenario was defined from experiments with Chalmers Revere’s full-scale Volvo FH16 “Rhino” truck, supported by input from an experienced driver. Recorded GNSS trajectories of repeated parking manoeuvres are shown in
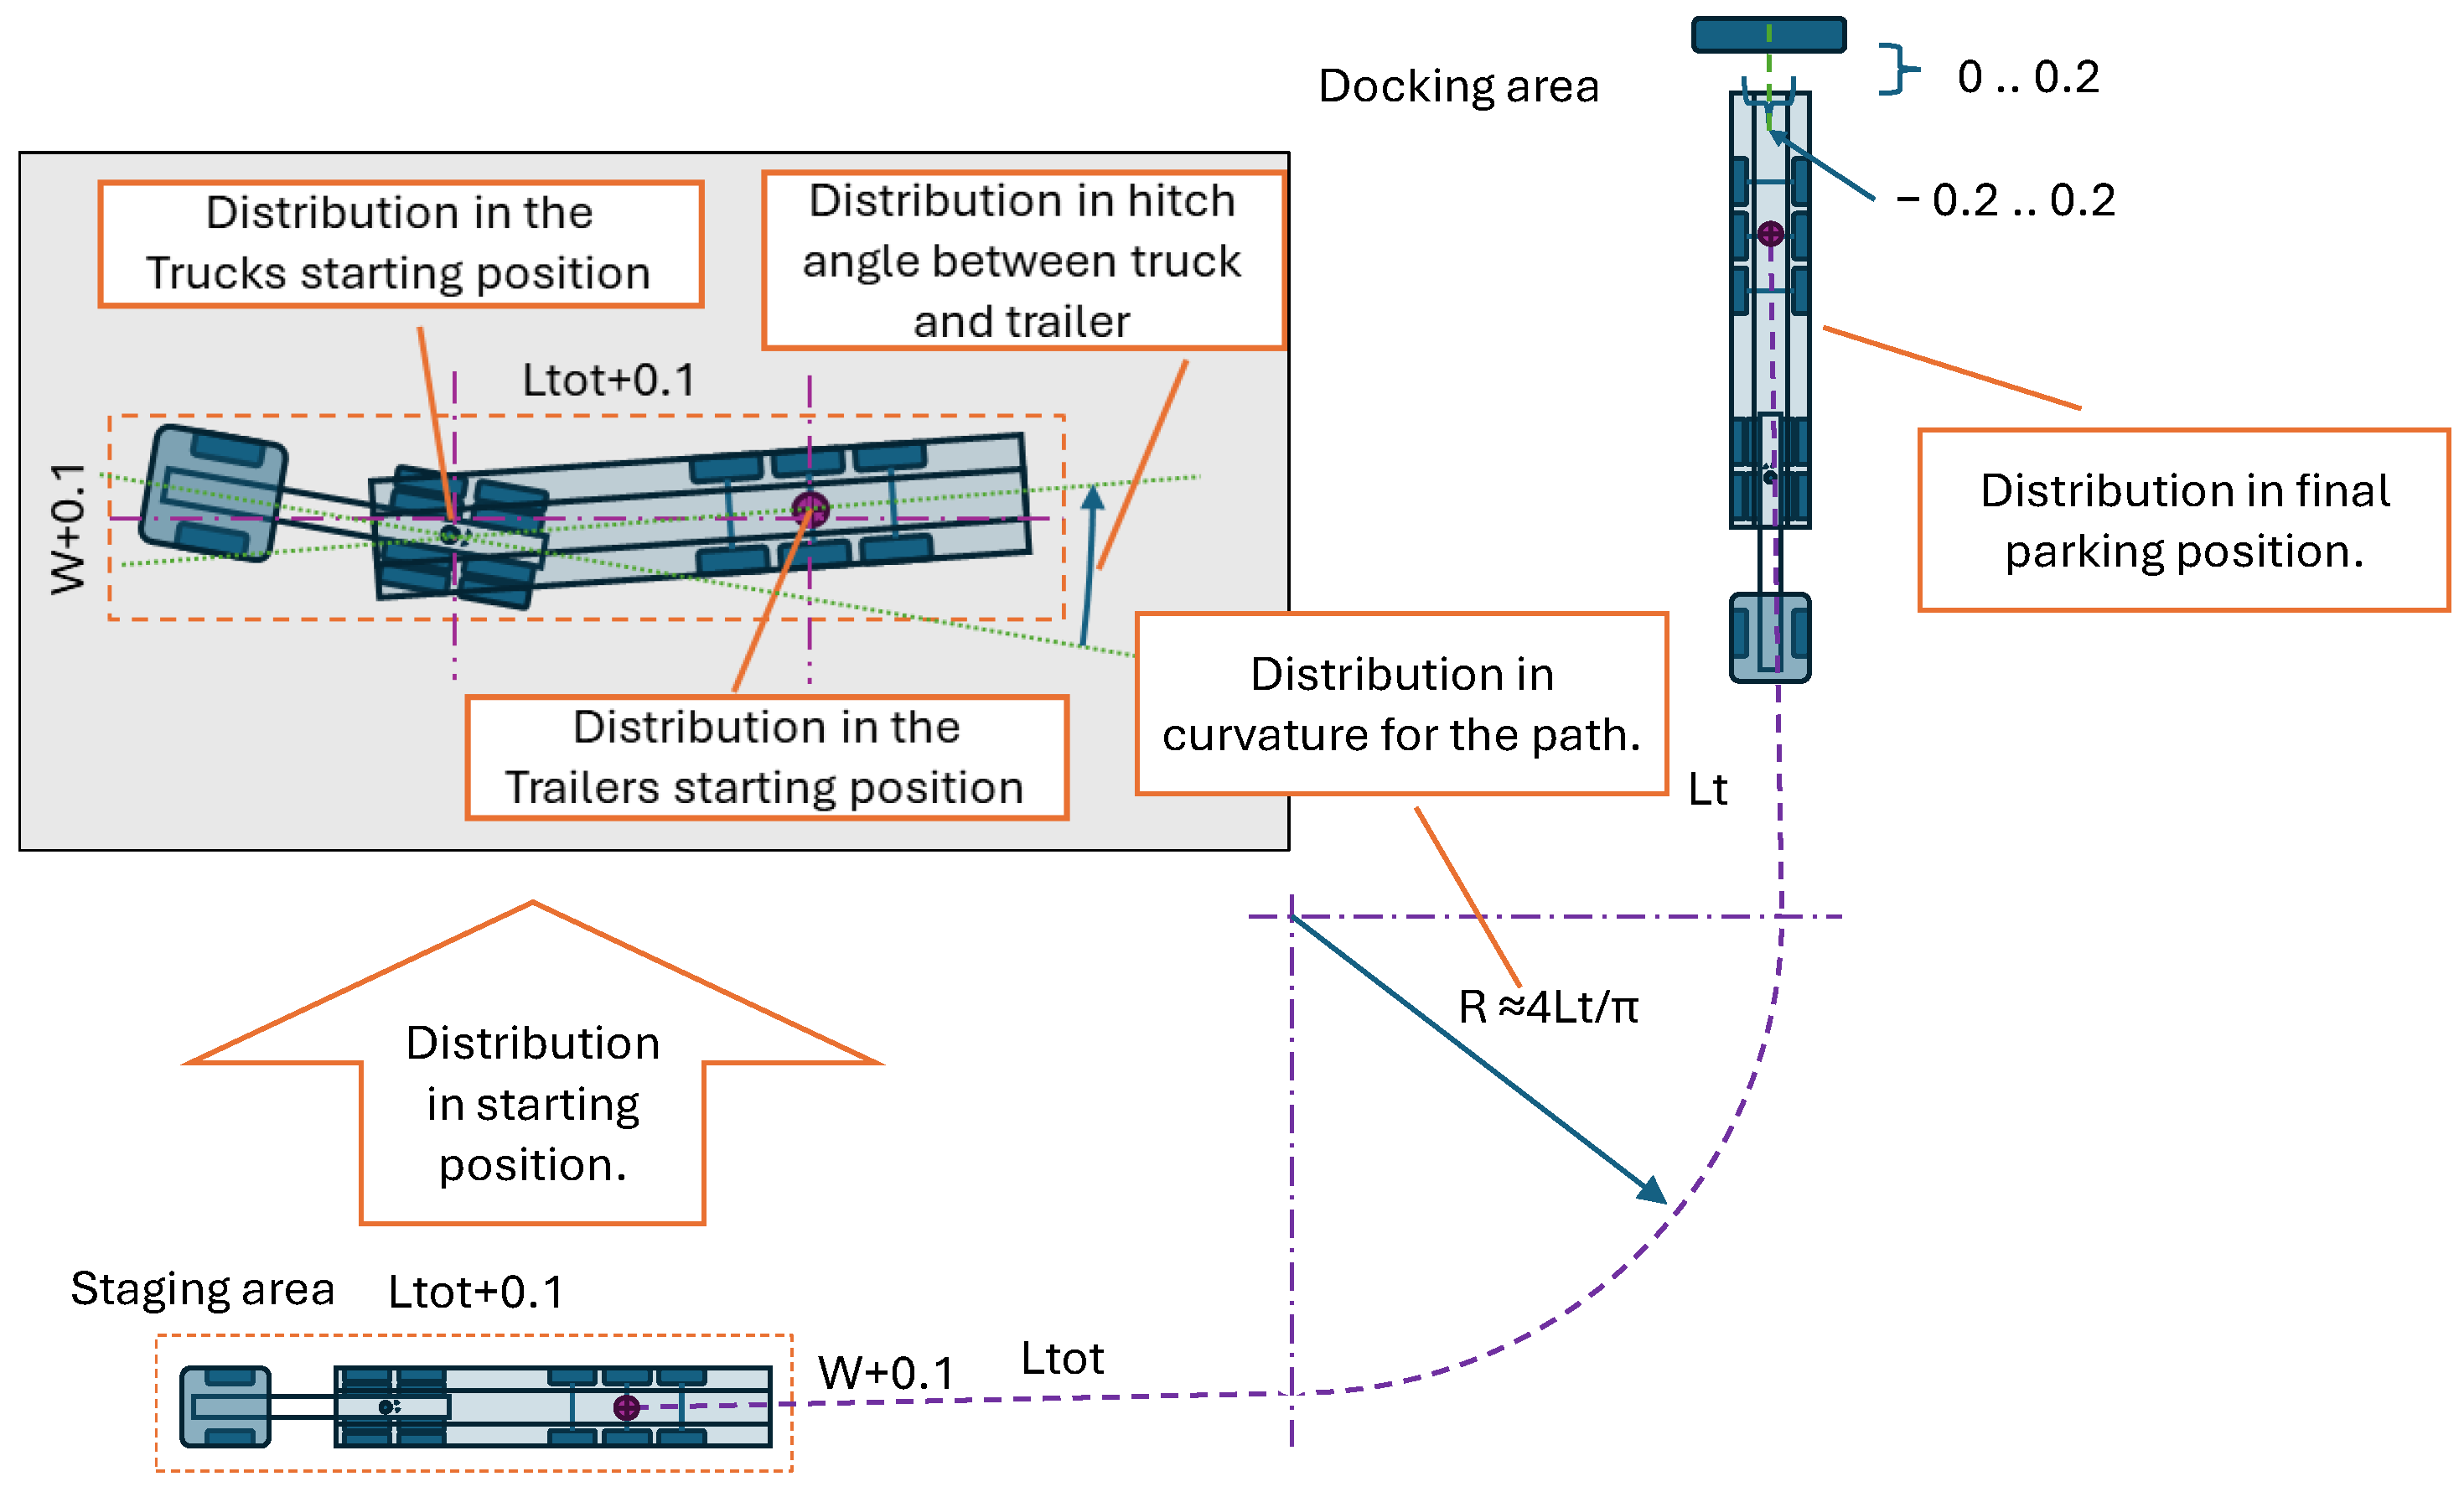
Figure 7. The logical scenario is illustrated in
Figure 8, covering possible positions and orientations of the truck and trailer within a square staging area, with environmental parameters set to baseline conditions.
The initial scenario allocation process defined in [
35] compares test case requirements with test environment capabilities to select the most suitable environment. Skoglund et al. [
25,
27] proposed an automated method for this comparison, using a formalised ODD with key testing attributes. In the tailored SAF, this ensures a systematic distribution of test cases and defensible evidence generation across simulation and physical testing, directly linking the
Allocation step to the subsequent
Coverage and
Decide blocks.
Concrete scenarios for physical testing were selected by varying the starting positions of the truck and trailer within the staging area (
Figure 8). A combinatorial testing approach [
35] was applied, including a nominal case where the truck and trailer were aligned at the centre, as well as 16 edge cases defined by corner starting positions. These cases are shown in
Figure 9.
6. Test Environment Setup
To validate the SAF, we used WayWiseR [
13,
15], an open source rapid prototyping platform internally developed by RISE for connected and automated vehicle (CAV) validation research. Built on ROS2, WayWiseR incorporates the WayWise library [
45] to provide direct access to motor controllers, servos, IMUs, and other low-level vehicle hardware. With its modular ROS2 architecture, WayWiseR supports unified testing across simulation and physical platforms, enabling the same implementation to run in CARLA and on the 1:14-scale truck.
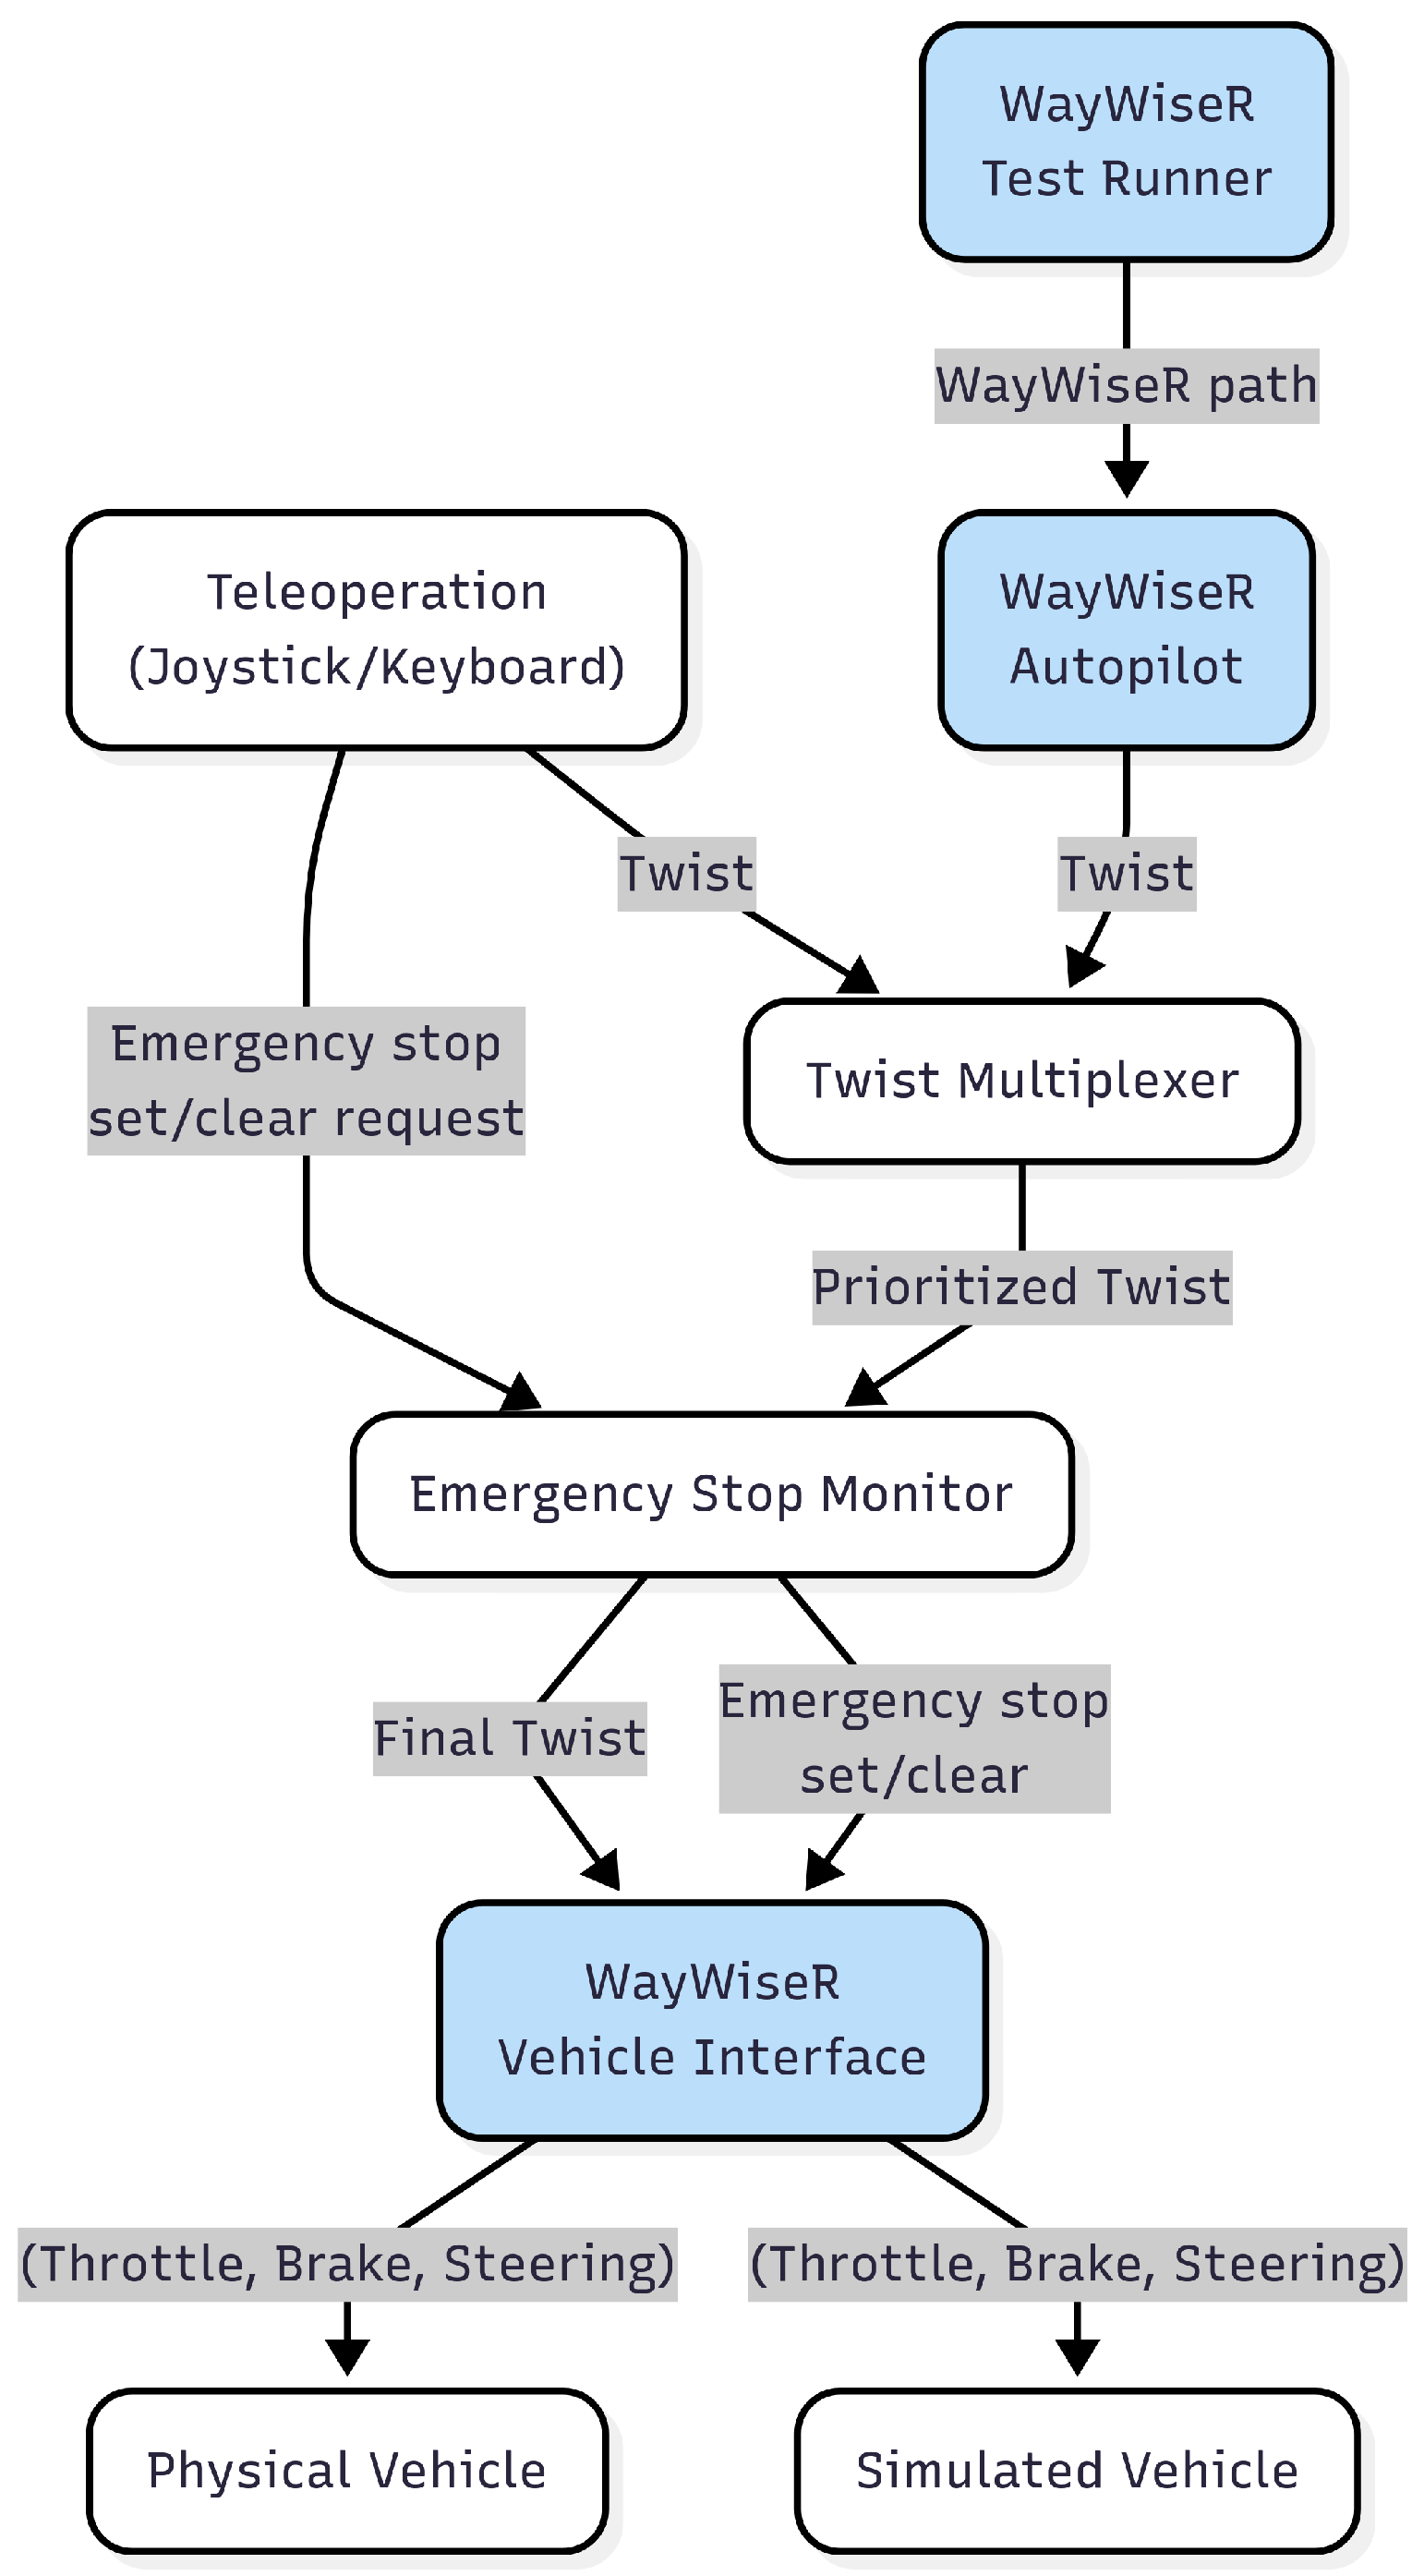
Figure 10 illustrates the WayWiseR test execution framework, showing its building blocks and control flow for unified physical and virtual testing. An automated reverse parking functionality for a semi-truck was implemented in the WayWise library and was wrapped into the WayWiseR autopilot ROS2 node. It should be noted that the implemented reversing function only has functionality necessary for the described demonstration; the implementation is not product-ready.
As previously described, there is work presented in the literature related to automated or assistant reversing of truck–trailer systems [
37,
38,
39,
40,
41,
42]. What they have in common is that they are all for low speed and assume that a simplified linear bicycle model is sufficient for kinematic modelling. Wheels on the same axis are approximated to one wheel in the middle of the axis, multiple axes at one end of the vehicle are approximated into a single axis, and no wheel slip is assumed. The vehicle position control is usually achieved through feedback of the hitch angle (the difference in heading between truck and trailer) based on a linearised system approximation. Path tracking is mostly carried out using variants of the pure pursuit algorithm [
46]. For the reversing function used in the paper, a similar algorithm using the Lyapunov controller [
47,
48] was found suitable.
For a first evaluation, the mathematical model of the reversing algorithm, together with a simplified kinematic model of the semi-truck, was implemented using Python. An example of using it is seen in
Figure 11, showing Monte Carlo simulations of the trajectories.
6.1. Simulation Environment
The simulation environment was implemented using CARLA v0.9.15 [
10], which was extended and customised to meet the requirements of the reversing use case. The base scenario was developed on the existing Town05 map, where one of its parking areas was modified to resemble a realistic logistics hub. As CARLA does not natively provide articulated trucks, new vehicle assets were introduced: a six-wheeled Scania R620 tractor and a compatible semi-trailer, both adapted from publicly available 3D CAD models. These models were adapted using Blender and subsequently imported into CARLA, allowing for visually and physically accurate representations of the vehicle combination.
To enable realistic articulation behaviour, a custom coupling mechanism was implemented within CARLA using its blueprint functionality. This mechanism introduces a physics constraint between the truck and the trailer, activated when both are positioned in proximity, so that they behave as a connected articulated vehicle during simulation. The simulation environment was fully integrated with the WayWiseR platform through a modified carla-ros-bridge, ported to ROS 2 Humble and deployed on Ubuntu 22.04.
Figure 12 illustrates the customised CARLA environment with the imported truck–trailer model, performing a reversing manoeuvrer.
6.2. Scaled Testing Environment
The scaled testing environment uses a 1:14-scale Tamiya Scania R620 model truck coupled with a matching Tamiya semi-trailer of the same scale. To closely mirror the simulated logistics hub, its 3D CAD model from CARLA was used to generate a 1:14-scale printout of the hub’s front facade, representing the docking environment in the scaled setup. A flat parking lot was used to recreate the hub area, with the staging area marked on the ground and the docking hub positioned according to the 1:14 scale and following scenario specifications. This setup, shown in
Figure 13 and
Figure 14, provided a controlled environment for the repeated tests involving docking manoeuvres with the model semi-truck.
Several modifications were made to the truck and semi-trailer models to enable the tests, including the installation of a GNSS antenna on the roof of the cabin, a magnetic angle sensor to measure the hitch angle, and a high-precision GNSS positioning module (u-blox ZED-F9R [
49]) that is capable of delivering centimetre-level accuracy. A brushless DC motor for driving and a servo motor for steering were installed, both controlled via an open source Vedder electronic speed controller (VESC) [
50] motor controller, which WayWiseR can interface with directly to regulate driving speed and steering. The truck model is equipped with a Raspberry Pi 5 running Ubuntu 24.04. Sensor readings, control loop execution, motor actuation, data logging, and test orchestration are all coordinated seamlessly by WayWiseR on this onboard computer.
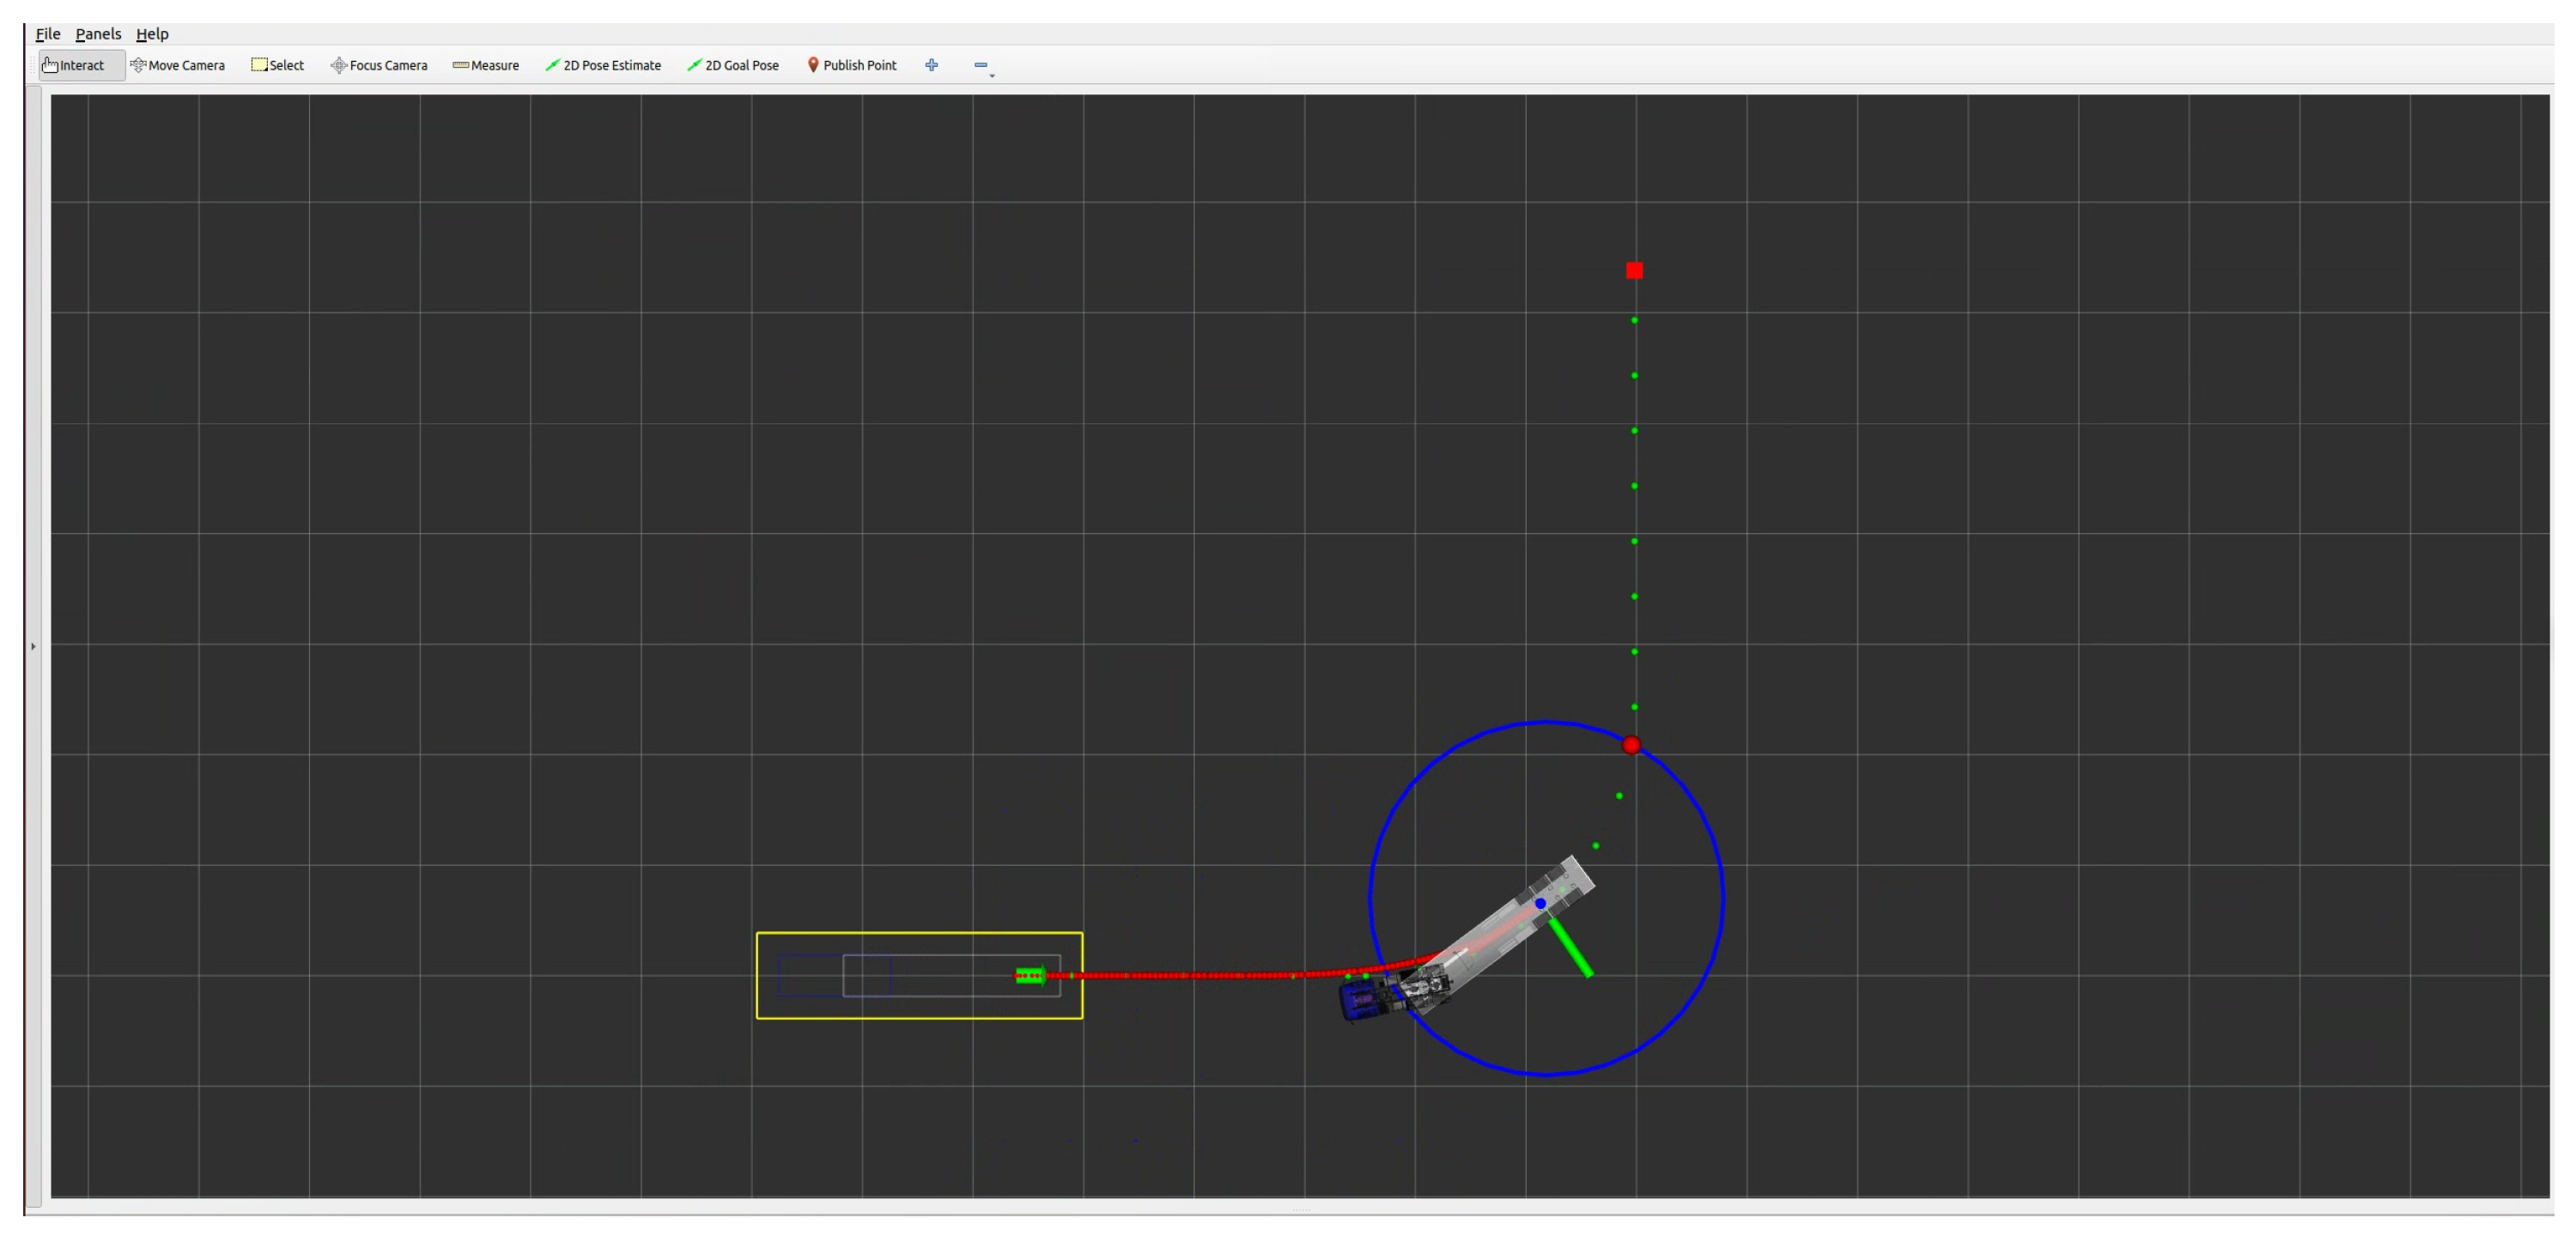
During each test execution, the truck was positioned in the staging area via manual control using a teleoperated joystick interfaced through WayWiseR, ensuring precise placement according to scenario specifications. Once positioned, the vehicle autonomously executed the reversing manoeuvre to the docking area following WayWiseR autopilot commands, while all sensor data, control signals, and state information were logged by WayWiseR Test Runner for subsequent validation. The ROS2 interface through WayWiseR also allowed remote monitoring of the test in real time through RViz, as shown in
Figure 15, with the ability to issue an emergency stop through the joystick if needed.
7. Results
KPI 1 demonstrates consistent docking precision with variability primarily due to sensor uncertainty. KPI 2 reveals stable manoeuvres with occasional safety-zone infractions caused by positioning inaccuracy. KPI 3 confirms that the tailored framework ensures sufficient coverage and fidelity of test environments for object-detection validation without direct testing.
Common for all performed tests is that the trucks start from the staging area. For the physical tests with the scaled model truck, the starting positions are limited to the positions shown in
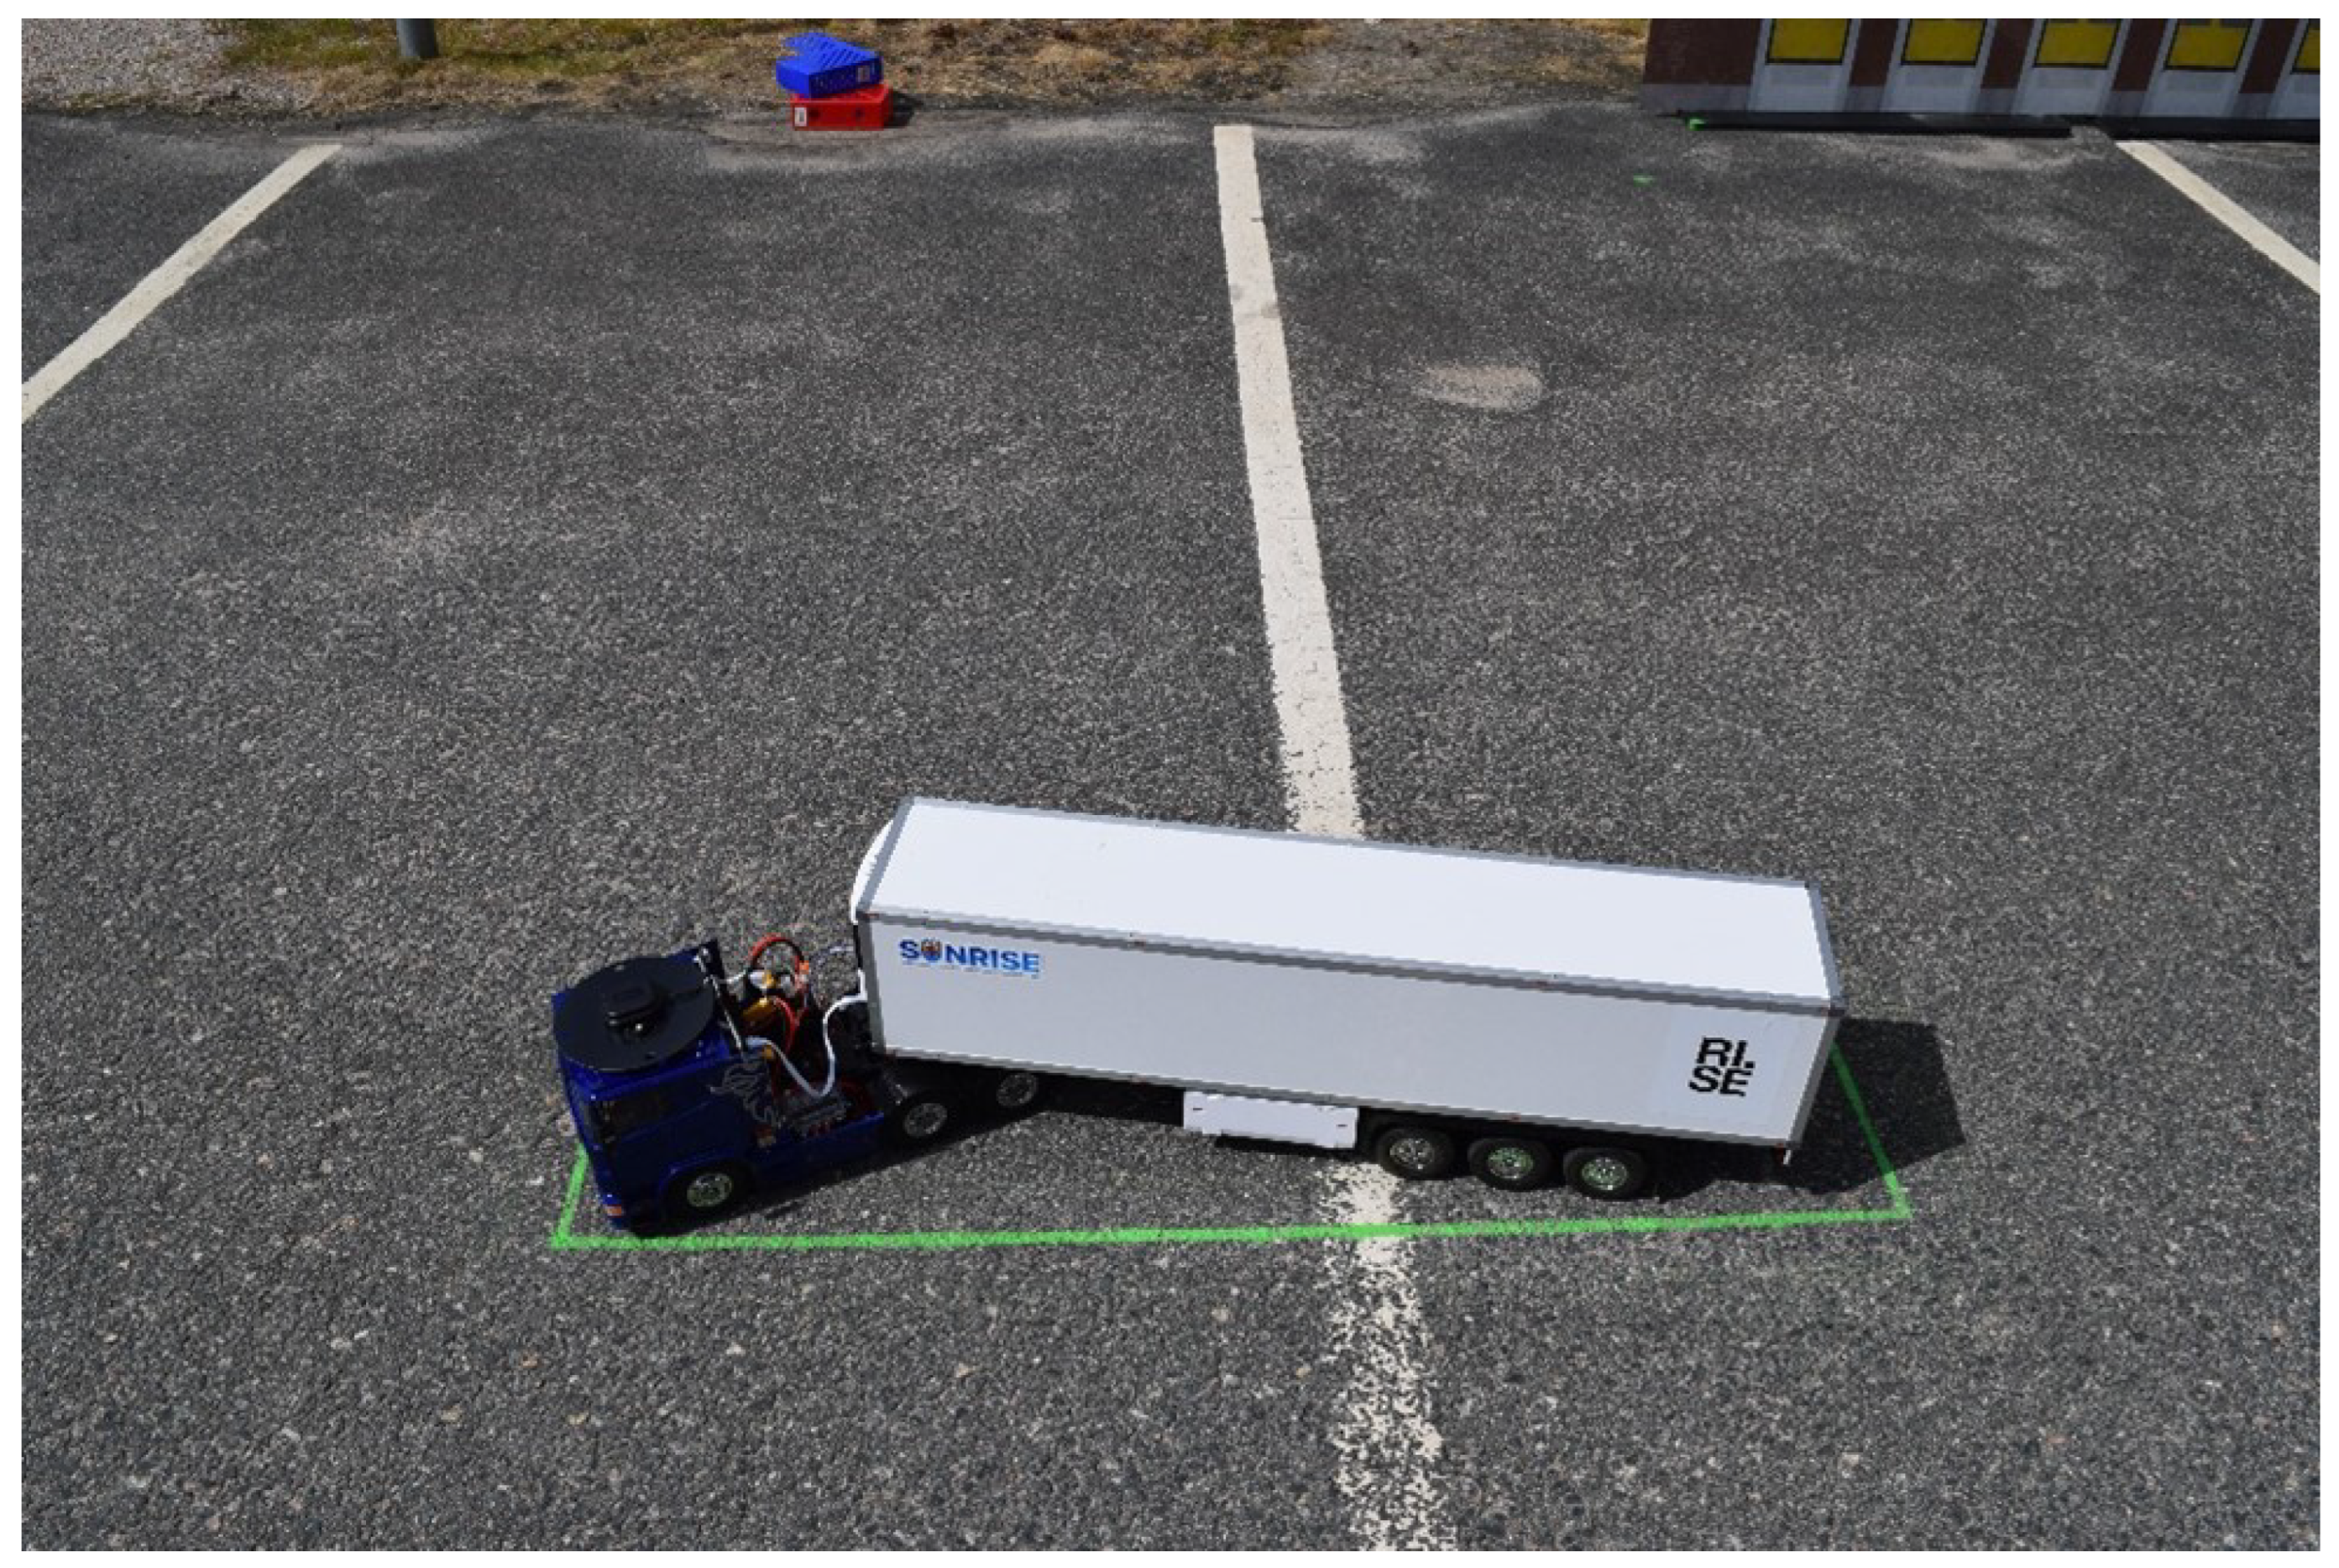
Figure 9. The same positions are used for the simulation, but are complemented with positions distributed over the staging area. A photo of the model truck parked in the staging area corresponding to one of the starting positions shown in
Figure 9 is shown in
Figure 16.
An important limitation is that the model truck depends on the GNSS position for navigation along the intended trajectory. To keep GNSS accuracy during the test, it is necessary to drive the truck into the desired position in the staging area and afterwards lift the trailer to the correct position. Manually lifting the truck and adjusting its position will result in lost GNSS position accuracy. Consequently, this limitation, regarding how precisely the truck can be parked, impacts the repeatability and accuracy of the physical tests with the model truck.
7.1. Evaluation of Docking Precision for KPI 1
KP 1 is defined in
Section 5.2 as the docking precision of the semi-truck when repeatedly starting from the same position. To evaluate this KPI, tests were conducted under clear, sunny daylight conditions in both a simulation and with the scaled model truck.
Figure 17 presents the results from 50 repeated tests in a simulation and 10 runs with the scaled truck with the nominal starting position in the staging area. It can be noted that the distribution of trajectories across runs is tightly clustered in both simulation and physical tests, indicating high precision in following the intended path when starting from the nominal position in the staging area.
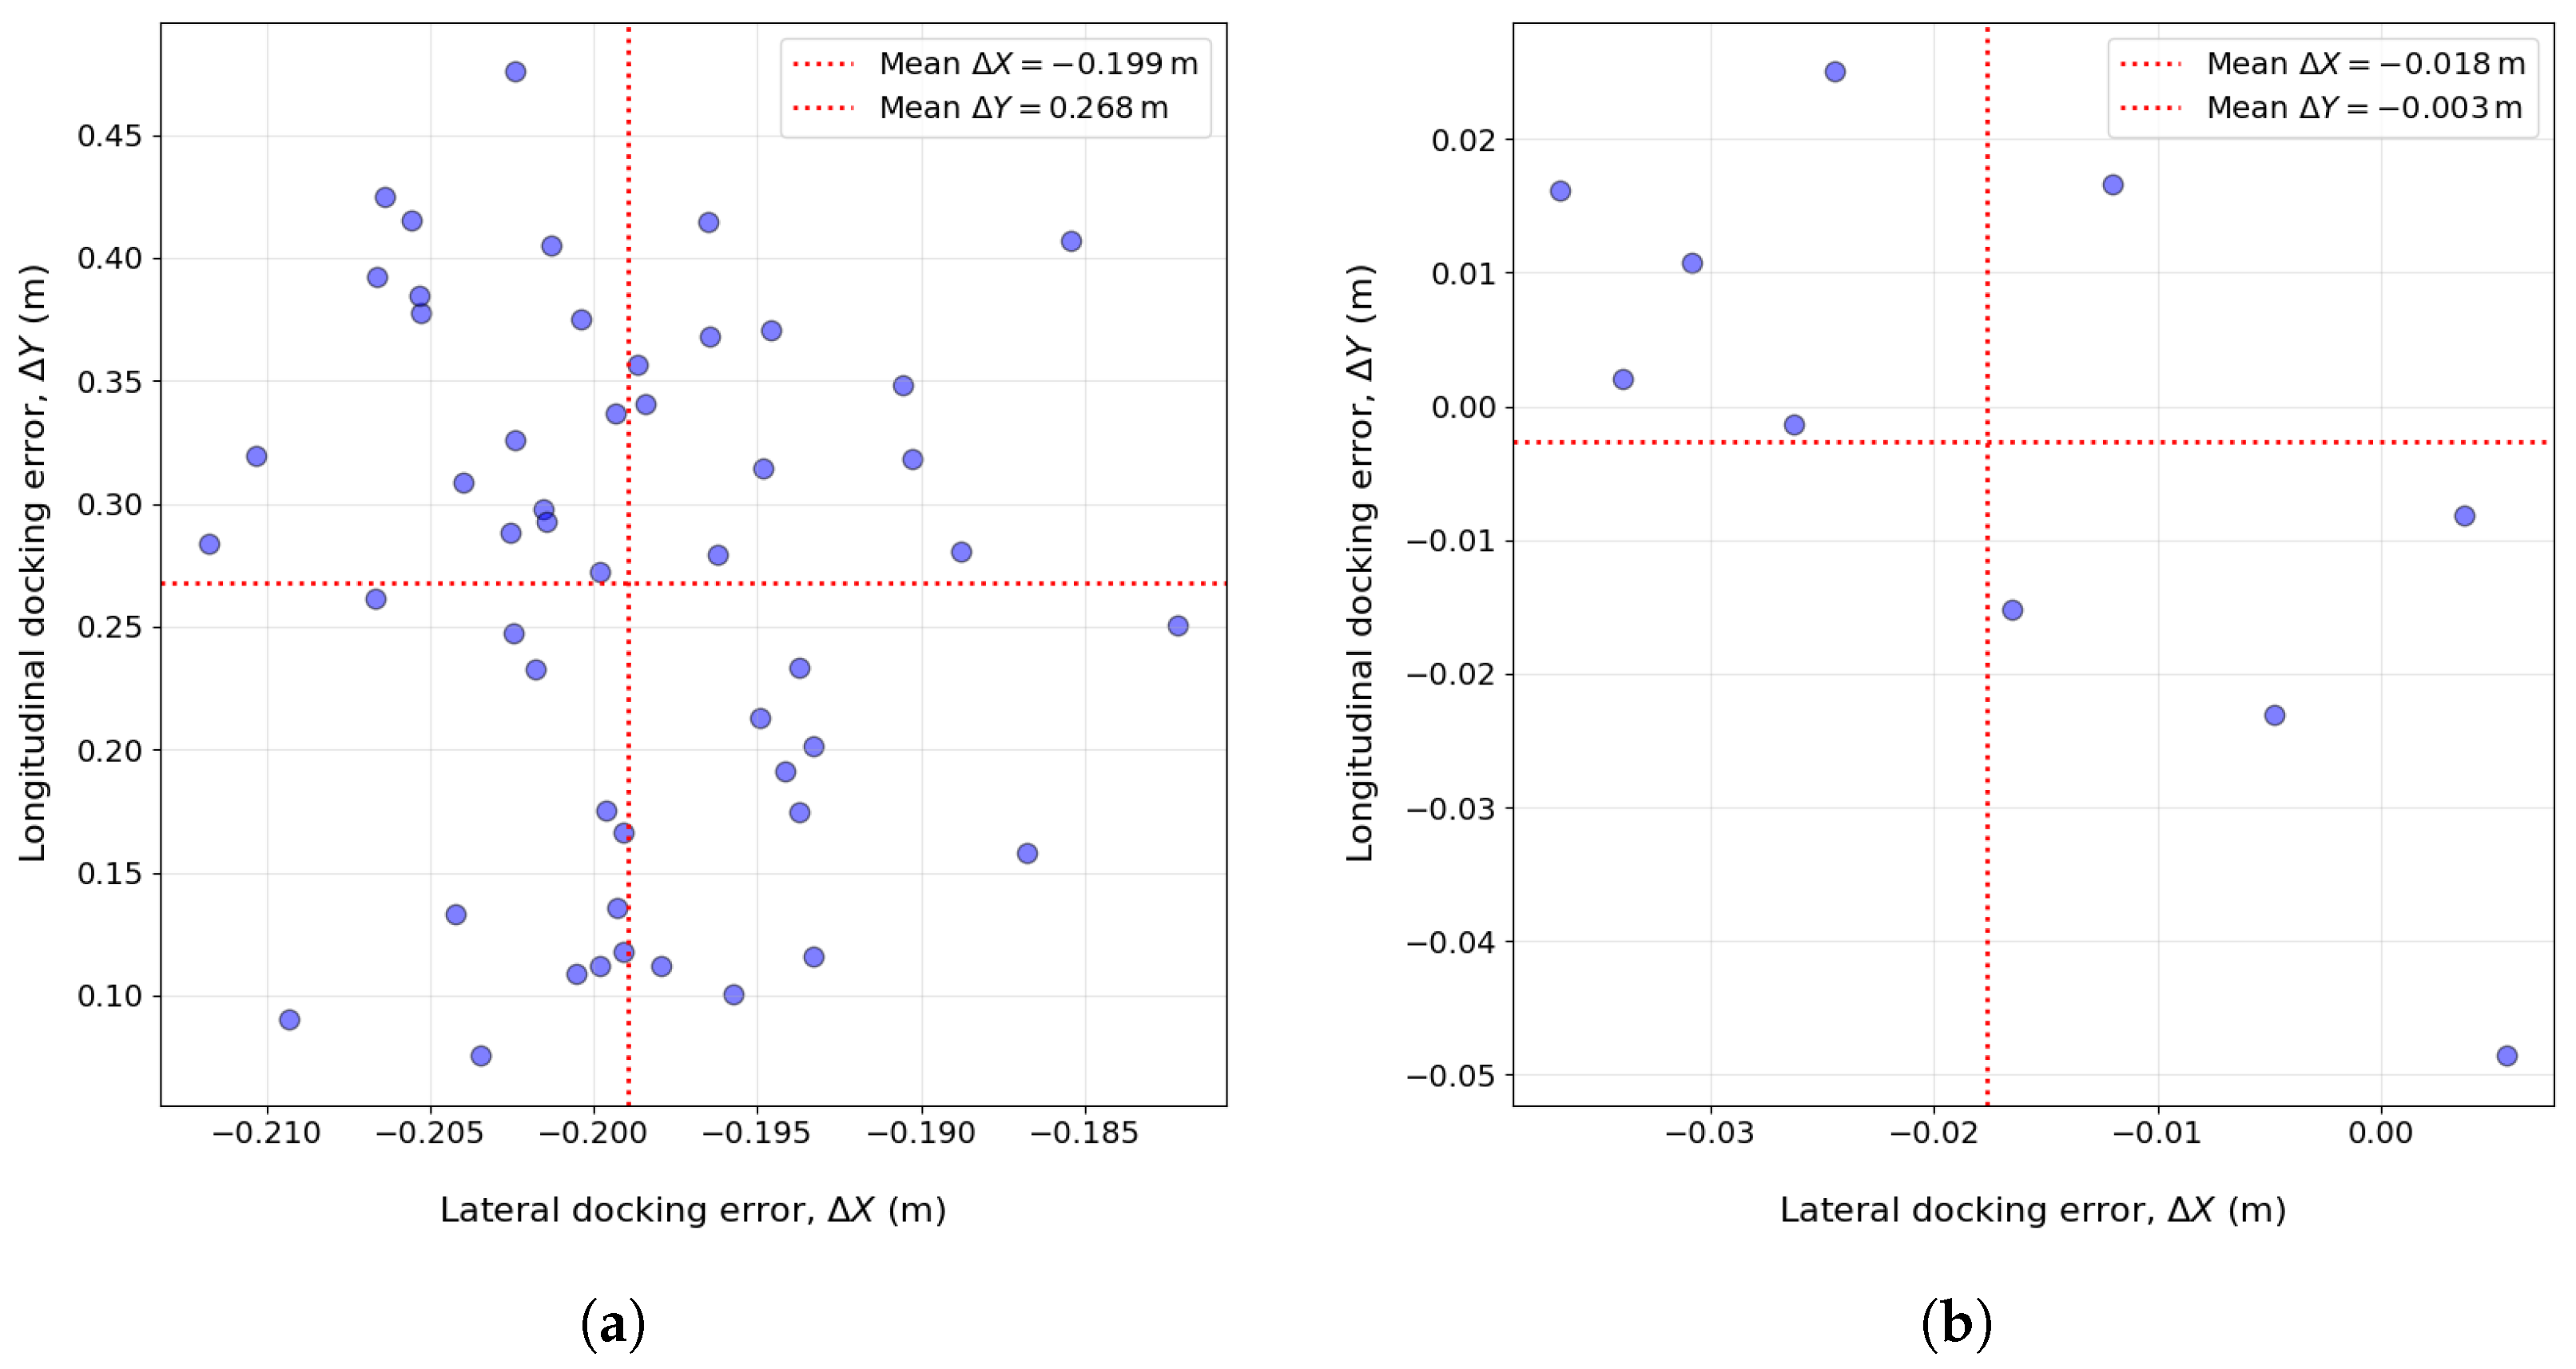
The distribution of semi-trailer’s docking errors for both simulation and real truck tests is illustrated in
Figure 18, and its statistics are summarised in
Table 1. In both environments, a small lateral shift to the left is observed. When accounting for scale, the lateral errors (
) are similar in both environments. However, the simulation exhibits larger positive longitudinal errors (
), which may be attributed to the higher momentum of the full-scale vehicle and the correspondingly longer braking distance. This suggests that minor adjustments between the physical scaled prototype and the simulation models may be needed to reproduce longitudinal stopping characteristics better. Overall, the narrow ranges of both lateral and longitudinal errors indicate that the docking manoeuvrers are executed with high precision and consistency across repeated runs in both environments.
7.2. Safety Zone Infractions Evaluated for KPI 2
The safety zone, as indicated in
Figure 13, is important for the safety evaluation of the AD function. It defines the geometrical area inside which the truck with a semi-trailer is expected to stay during the reverse parking manoeuvre. The exact dimensions of the safety zone will be a trade-off between the AD vehicle performance and the geometrical dimensions of the site where the vehicle will operate. The result here has a focus on the methodology rather than an exact numerical threshold.
For KPI 2, the starting position may be anywhere inside the staging area. The tests aim to determine whether the truck remains within the defined safety zone. In this evaluation, environmental conditions in the ODD are assumed to be nominal, i.e., no functional limitations from external factors, such as GNSS signal quality, are present. For a full systematic assessment, the ODD could be extended to include more challenging conditions, e.g., reduced GNSS signal reliability or other disturbances.
To evaluate this KPI, tests were conducted under clear, sunny daylight conditions using the implemented AD function in the WayWiseR platform in both simulation and with the scaled model truck.
Figure 19 presents the results for different test runs from simulations and physical tests with various start positions distributed across the staging area. To achieve broader coverage in the simulation, scenario-defining parameters (i.e., truck’s start position, truck heading, truck-trailer hitch angle) were discretised, and 200 scenarios were randomly generated. This set includes the 16 edge-case starting positions shown in
Figure 9, ensuring both typical and extreme conditions are represented in the analysis. For the physical tests using the scaled truck, 17 scenarios were selected, which include the nominal start position and the 16 edge-case starting positions from
Figure 9.
The results, shown in
Figure 19a,b, display similar overall behaviour across both environments. While most runs follow the target trajectory closely, some exhibit larger deviations, particularly for edge-case starting positions. In physical tests, additional variability arises from manual positioning of the scaled truck and from measurement uncertainties in the RTK-GNSS positioning system, which can be significant at the small scale of the model.
Figure 20 shows the deviations of the semi-trailer’s rear-axle middle positions from the planned trajectory along the path from the start to end for both simulation and scaled truck tests. In both environments, two prominent peaks are observed: one directly after the start due to variations in the initial heading and trailer angle, and another at the turn along the path. Although the overall shapes of the distributions are similar, the observed discrepancies, particularly in the second peak magnitude, highlight the need for further adjustments to better align the simulation model with the physical prototype.
7.3. Suitability of Test Environment and Validation Coverage for KPI 3
The evaluation does not directly specify or implement and test KPI 3 ODD conditions for object detection. Instead, it focuses on the adequacy of test environments required for such validation. Within the tailored SAF workflow (
Figure 3), test requirements derived from the ODD are constrained, from which scenarios are concretised, allocated, and executed across different environments. The resulting evidence is then evaluated with respect to coverage and its contribution to the assurance case.
To make the role of KPI 3 traceable within the SAF workflow, the scenario conditions associated with this indicator were not defined manually but generated as orthogonal combinations of ODD parameters derived from the machine-interpretable ODD schema presented in "Formalizing operational design domains with the Pkl Language" [
25]. This ensures that each variation corresponds to a declared ODD dimension rather than an arbitrary perturbation. These derived scenario configurations were then compared against test environment capability attributes using the allocation logic described in "Methodology for Test Case Allocation Based on a Formalized ODD" [
27], where suitability is determined based on representable ODD parameters, test safety factors, interaction complexity, and fidelity characteristics. The methodology was exemplified using the test scenarios in
Figure 21.This exemplifies that the simulation does not achieve adequate fidelity for evaluating camera-based sensing under oblique sunlight, as lens flare effects depend on real lens coating and geometry, making physical testing necessary.
For KPI 3 in this demonstrator, this mapping is used to show how the SAF can express readiness for future perception-related assessment. KPI 3 is therefore used as an indicator of structural interoperability between ODD formalisation, relevance filtering, environment allocation, and readiness reporting. Direct computation of perception metrics, such as detection accuracy or object diversity coverage, is not carried out here; instead, the required workflow integration steps are made explicit to support later execution within the same ODD-informed allocation model.
By systematically integrating these environmental attributes with formalised ODD parameters, the SAF provides a means of determining whether a given environment is suitable for supporting KPI 3 validation. Although direct object-detection testing is not performed, the framework ensures that the environmental conditions necessary for such assessments are adequately represented, traceable, and capable of generating credible evidence for the assurance case.
8. Limitations and Scope
The demonstration presented in this work has several limitations that should be acknowledged. First, the use case is confined to a restricted ODD, which simplifies many steps compared to an ADS function intended for deployment on public roads. The associated test space is intentionally kept minimal, resulting in relatively low combinatorial complexity between dynamic interactions and operational conditions. This reduction enables an exhaustive search strategy to be applied, which can serve as both a baseline and an oracle for evaluating more advanced search or selection methods in future studies. Consequently, broader challenges, such as large-scale scenario collection, systematic data curation, and the construction of comprehensive scenario databases, have not been addressed. These tasks involve ensuring coverage, completeness, and the inclusion of rare or critical edge cases, which are considerably more demanding.
Second, while the study illustrates how requirements, KPIs, ODD formalisation, and heterogeneous test environments can be connected in a traceable way, it does not address the subsequent challenge of integrating these fragments of evidence into a complete, correct, and defensible assurance case. In this context, KPI 3 functions only as a placeholder for perception-related performance, intended to demonstrate how an ODD-based structure can be used to indicate environmental adequacy within the SAF workflow rather than to validate perception fidelity. The integration shown for KPI 3 is therefore limited to demonstrating the structural linkage between ODD filtering, test-case relevance, environment suitability, and readiness reporting placeholders. A full evaluation of perception performance, including detection accuracy, object diversity coverage, and fidelity metrics, lies outside the scope of this demonstrator and remains an open issue for future work, where achieving coherence across heterogeneous evidence sources and ensuring a logically consistent cumulative argument will be essential.
Third, the scope of the present work is restricted to pure safety-related KPIs, with the number of indicators deliberately kept low to demonstrate the SAF workflow in a transparent manner. A complete assurance case must also consider other concerns, such as cybersecurity—including the interplay between safety and security [
51] and human interaction, including foreseeable misuse. Benchmarking against human driver performance was not systematically included, as the purpose here is not to calibrate risk levels but to demonstrate that the SAF process can be executed end-to-end. Nevertheless, human driver baselines may serve as a valuable reference in future work.
Finally, the level of methodological detail provided reflects the demonstration purpose of the paper rather than the requirements of a production-ready assurance case. Full specification of acceptance thresholds, formal statistical analyses, detailed controller design parameters, software artefacts, and sensor calibration data would all be necessary in a structured safety argument for a validated product. In this work, however, the intention is to demonstrate that the SAF process can be applied and traced across heterogeneous environments, not to deliver a final safety case. The results should therefore be interpreted as an illustration of process feasibility rather than as a complete assurance argument.
9. Conclusions
A commonly accepted safety assurance framework is essential for enabling harmonised assessment, which in turn is required for the large-scale deployment and acceptance of CCAM systems. Initiatives such as SUNRISE have established such frameworks, yet practical guidance on their application to CCAM functions remains limited. Key challenges include the definition of metrics and acceptance criteria, the collection and curation of data, the generation and selection of scenarios, and the allocation of tests across heterogeneous environments. Beyond these steps lies the challenge of integrating the resulting fragments of evidence into a complete, correct, and defensible safety case, ensuring that the cumulative argument is coherent and comprehensive. Addressing these aspects is fundamental for constructing a robust safety argument.
This paper has demonstrated how the SUNRISE safety assurance framework can be operationalised by applying it end-to-end to a specific CCAM use case across heterogeneous test environments. The contribution lies not in the ADS function itself but in showing that requirements, KPIs, ODD formalisation, test allocation, and evaluation can be systematically connected in a traceable and defensible process. While the study was intentionally limited to a simplified use case, it establishes a foundation for extending the approach to more complex ODDs, larger test spaces, additional concerns such as cybersecurity and human interaction, and the integration of in-service monitoring to ensure continued assurance validity under evolving operational conditions. In production-ready contexts, greater methodological rigour will be required to comply with all normative requirements in applicable functional safety and cybersecurity standards.


