Abstract
This paper presents an optimized vehicular reordering methodology designed to minimize energy consumption within heterogeneous cohorts operating at constant velocity on limited-access highways. The approach addresses the challenge of optimizing vehicle sequencing by considering both aerodynamic drag reduction benefits and the energy costs of reconfiguring a cohort from a stochastic initial state. This study provides empirical validation through on-road vehicle tests, demonstrating significant energy savings, achieving up to 10% reduction in axle energy for optimally configured cohorts compared to independent operation. A System of Systems (SoS) simulation environment, integrating micro-traffic, validated powertrain, and aerodynamic drag reduction models, was developed to simulate complex reconfiguration maneuvers and quantify associated energy expenditures. The methodology examines how powertrain characteristics influence optimal arrangements and quantifies the impact of individual vehicle placement on overall cohort efficiency. Findings indicate that while reconfiguration incurs a minor energy cost (typically <0.45% of total trip energy for a 20 km trip), the net energy savings over relevant travel distances are substantial. The study also highlights the sensitivity of drag reduction estimators for heterogeneous platoons and the current limitations in available models. Ultimately, a predictive optimization framework is proposed that leverages connectivity-enabled information to select the most energy-efficient cohort configuration, considering factors such as distance to destination and reconfiguration energy, thereby offering a practical strategy for enhancing fuel economy in future connected and automated transportation systems.
1. Introduction
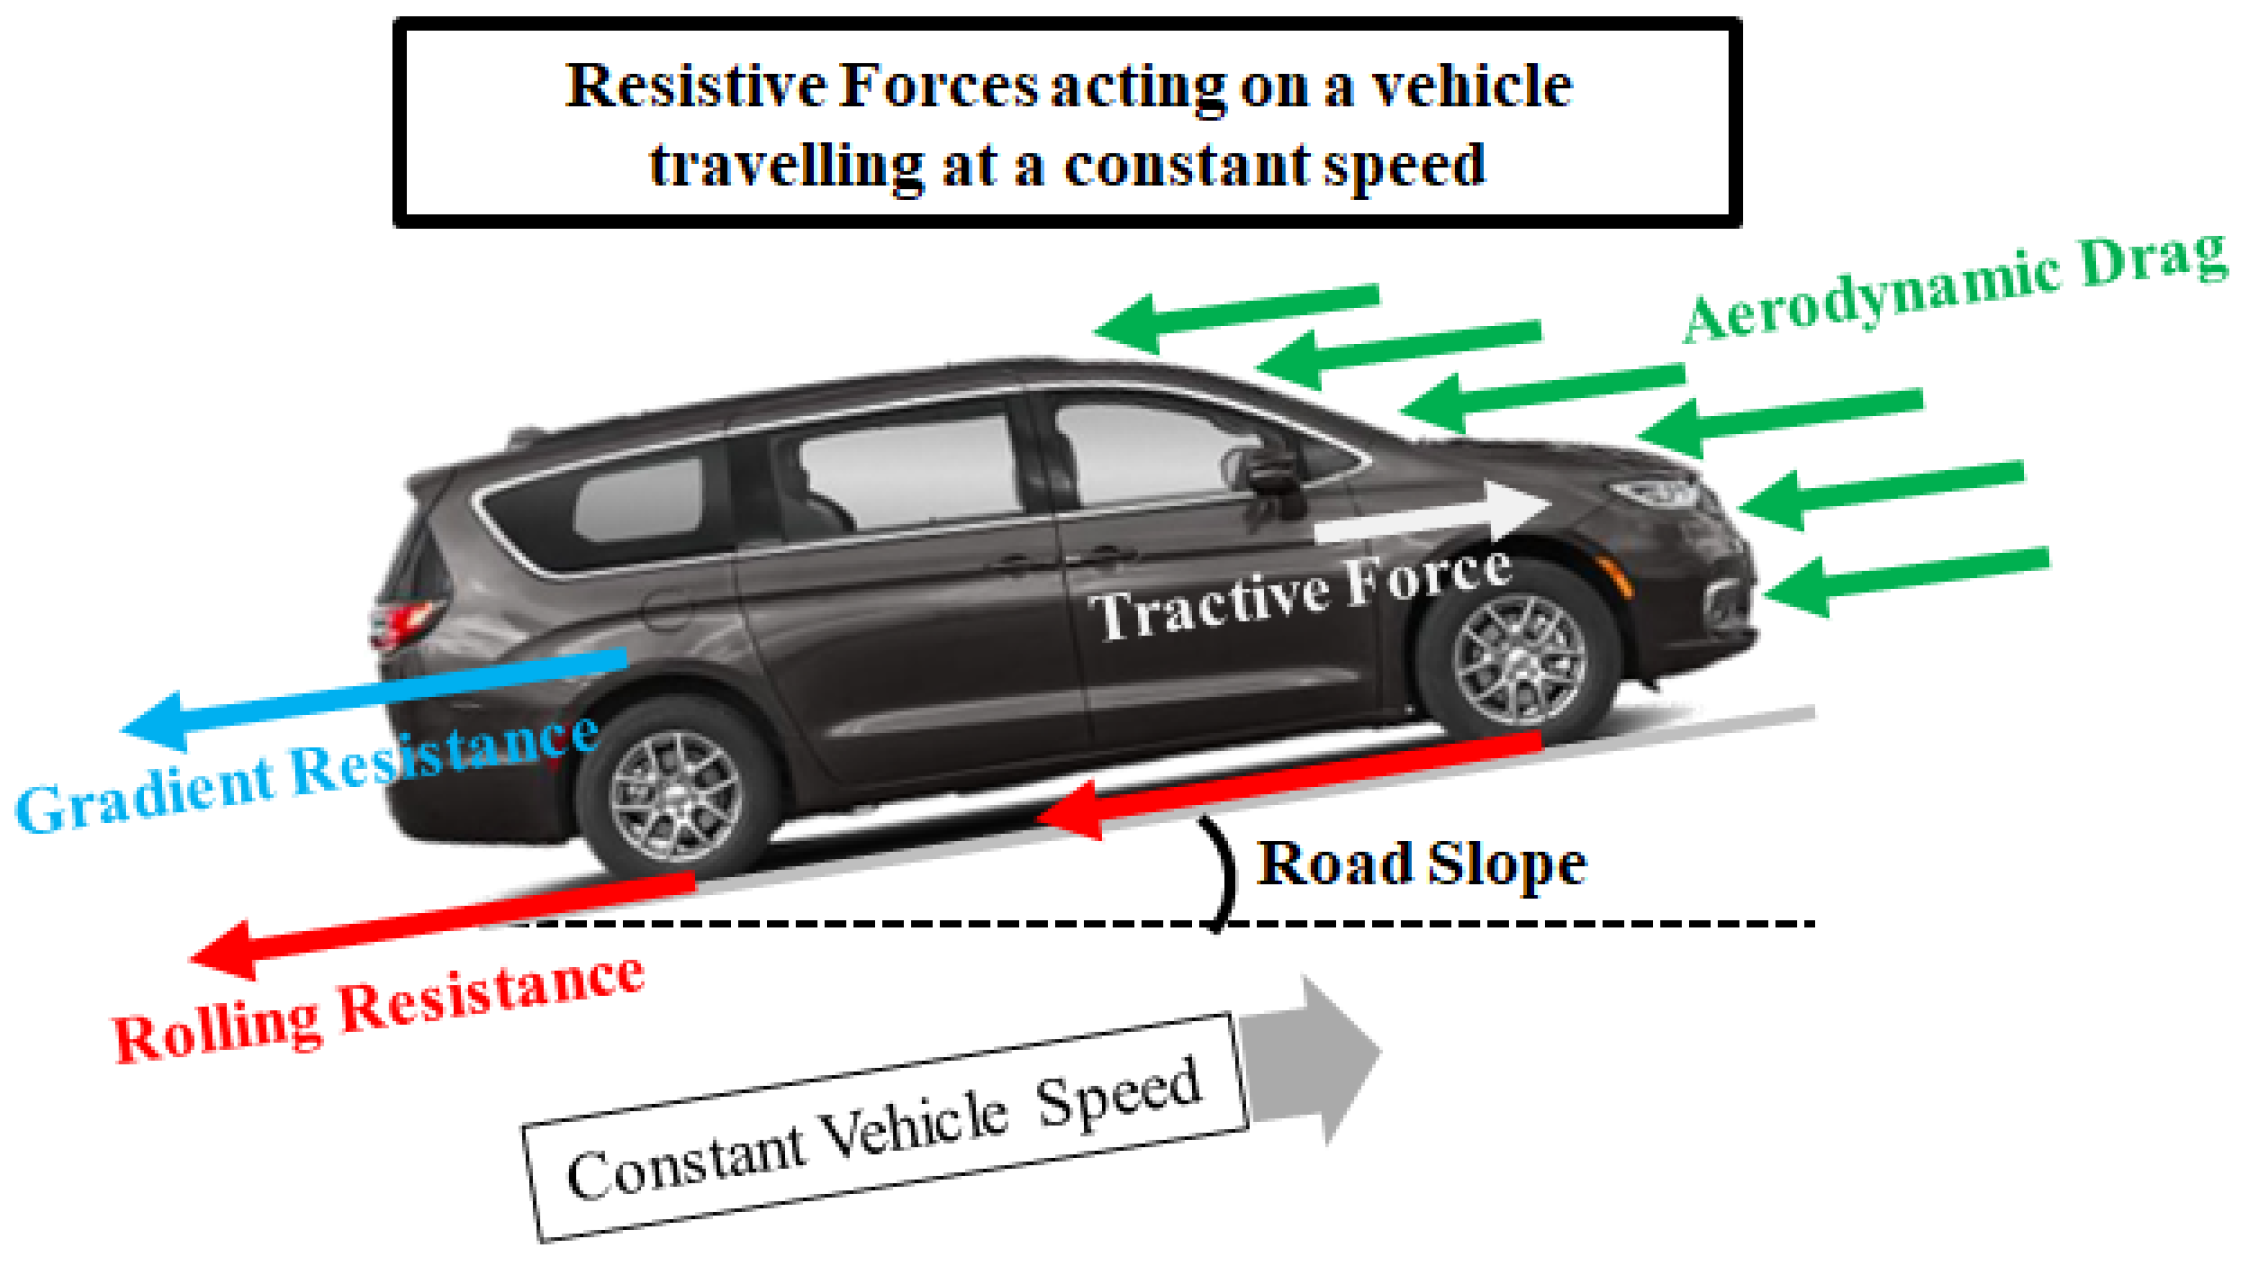
Selfish independently operated vehicles traversing a limited-access highway at a constant speed are subject to several resistive forces. These forces are broadly classified as gradient resistance, rolling resistance, and aerodynamic drag as shown in Figure 1. These resistive forces are estimated using Equation (1). To sustain a constant vehicle speed, the vehicle’s prime mover must generate a tractive force equivalent to these resistive forces. A reduction in these resistive forces consequently reduces the required tractive force, which in turn correlates to a reduction in the energy consumption of the vehicle. The energy source for vehicle propulsion is predominantly chemical (e.g., Internal Combustion Engine (ICE) vehicles), electrical (e.g., Electric Vehicles (EVs)), or a hybrid combination (e.g., Hybrid Electric Vehicles (HEVs) and Plug-In Hybrid Electric Vehicles (PHEVs)). The actual energy cost, environmental and economic, is contingent upon its source. The US Department of Energy (DOE) has published equivalency factors to compare the cost of gasoline with electrical energy sources [1].
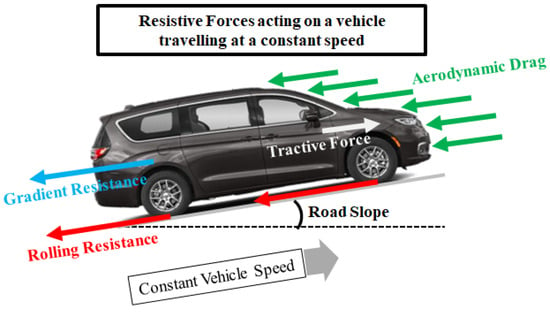
Figure 1.
Resistive forces experienced by a vehicle maintaining a constant speed.
Several innovative and niche methodologies exist in the literature aimed at mitigating the resistive forces encountered by on-road vehicles [2,3]. Gradient forces are dependent upon the vehicle’s mass and the road grade. From a vehicular perspective, the scope for implementable options to mitigate gradient resistance is primarily confined to mass reduction strategies. The rolling resistance experienced by a vehicle results from the interaction between its tires and the road surface. Several investigations have been conducted to develop more energy-efficient tires [4,5], to mitigate this effect. The final major classification of resistive forces is aerodynamic drag. This force results from both frictional forces acting on the vehicle’s surface and pressure differentials across a bluff body (vehicle) traversing a fluid medium (air). The magnitude of aerodynamic drag acting on a vehicle is a function of several factors, mainly the size and shape of the vehicle, ambient temperature, atmospheric pressure and travel speed. Equation (1) provides the general expression for estimating the resistive forces acting on a vehicle maintaining at a constant speed. The term represents the resistive force due to road grade, , denotes the static rolling resistance factor, and represents the dynamic rolling resistance factor. quantifies the aerodynamic drag force acting on a vehicle, where A is the cross-sectional area of the vehicle, is the density of air, V is the relative velocity of the vehicle with respect to the ambient air, and is an empirically determined property of the vehicle that correlates the drag force to the dynamic pressure and cross-sectional area [6]. Comprehensive reviews of various aerodynamic drag reduction techniques found in the literature are presented in articles [7,8].
One of the prominent techniques for aerodynamic drag reduction is vehicular platooning [9]. Platooning involves the formation of a group of closely spaced vehicles, arranged sequentially, where the trailing vehicles benefit from the low-pressure zone created by the preceding vehicle, thereby reducing their individual aerodynamic drag. When the trailing vehicle is at a sufficiently close gap to remain within the wake of its preceding vehicle, it experiences a reduced aerodynamic drag force compared to operating independently in an undisturbed column of air [10]. This reduction in aerodynamic drag can be quantified as a change in the drag coefficient () value. It is dependent on several factors including inter-vehicular gap, speeds, and the dimensions of the vehicles involved. Multiple vehicles can be configured in series to form a cohort to take advantage of this effect. The wake generated by each preceding vehicle is dependent upon its shape and dimensions, and therefore, the magnitude of benefit for the trailing vehicles is dependent on the characteristics of the preceding vehicle and, to a lesser extent, the type of the follower vehicle. Therefore, the sequence in which vehicles are arranged in the cohort influences the magnitude of reduction in the drag forces.
1.1. Literature Review
Throughout the years, numerous studies have been conducted on vehicular platooning and its benefits and challenges. Ref. [11] conducts an extensive review of energy saving methodologies in automotive platooning. It cites various studies conducted using field-tests, wind tunnel experiments and Computational Fluid Dynamics (CFD) simulations. It highlights that field-tests offer the closest approximation to real-world scenarios but at a potentially high cost. It also categorizes most energy-saving methods in platooning into two broad classifications: aerodynamic optimization and speed optimization. Aerodynamic methods tend to improve energy savings by regulating inter-vehicular spacing within platoons, while speed optimization methodologies generally aim to reduce acceleration and deceleration transients among vehicles in the platoon. The magnitude of aerodynamic drag generally tends to decrease with smaller inter-vehicular spacing and higher speeds as referenced in [10,12,13]. Furthermore, a majority of existing studies focus on heavy duty vehicles and trucks, and their fleet-wide application primarily due to the ease of implementation and the greater potential for energy savings [11,14,15]. In contrast, the present study focuses on a heterogeneous composition of light-duty, connected, and automated vehicles operating on a limited-access highway. Various platooning studies have also addressed additional aspects of platooning including travel time reduction [16], vehicle safety [17], string stability [18], path planning, and maneuvering [17,19,20]. A significant challenge to the widespread deployment of platooning technologies is the current low penetration rate of CAVs within the current vehicular ecosystem. CAVs will be required to operate alongside human-driven vehicles, whose behavior is inherently more difficult to estimate and predict. Ref. [21] presents an investigation into the impact of such “mixed” vehicle platoons on energy and traffic efficiencies and proposes a method for the spatial distribution of CAVs to improve these efficiencies. Ref. [22] also investigates enhancing traffic efficiencies and energy consumption for heterogeneous powertrains at signalized intersections. These studies support the viability of operating heterogeneous CAVs alongside human-driven vehicles.
Platoon formation constitutes another major aspect of vehicle platooning. The process by which vehicle platoons are formed has undergone extensive investigation over the years. The majority of the studies previously described approach this problem from the perspective of control, communication, and stability within homogeneous vehicle platoons. However, in a realistic driving scenario, a significant proportion of the vehicles traversing together on a given stretch of road may not be of the same type in terms of size, shape, and powertrain type. Each of these factors has an influence on the energy consumption of a platoon. Refs. [23,24] focus on mitigating the challenges of controlling such vehicle platoons with heterogeneous powertrains. However, only a limited number of studies have specifically focused on addressing the aspect of energy consumption in heterogeneous platoons. Ref. [25] represents one such rare study that investigates heterogeneous fleets of electric vehicles for energy savings. This particular study was conducted on trucks, where the heterogeneity was derived from the sizes of the trucks in the platoon. Electric trucks of three distinct sizes—small, medium, and large—were utilized for the purposes of the investigation. The use case of the study involved leveraging trucks of diverse sizes owned by a consortium of companies to form energy-efficient platoons for a fixed driving route. A key finding from this study underscores the importance of vehicle arrangement in platoons to achieve higher energy efficiency.
1.2. Objective and Impact of the Study
The objective of this study is to leverage the difference in aerodynamic drag among various vehicle configurations to minimize the cohort’s cumulative energy consumption. This investigation incorporates the size and shape of the individual vehicles, alongside their powertrain characteristics, to derive an optimal cohort order, based on the estimated distance the cohort is expected to remain intact. Since powertrain characteristics are considered, the optimal order can vary depending on the operational mode of the vehicle’s powertrain. This study also employs various drag reduction prediction models in a modular fashion, enabling it to be updated as further research in this field is conducted. Unlike other studies, this research also accounts for the energy cost associated with reconfiguring a cohort from a stochastic initial state to its optimized target configuration.
The current study uses an aerodynamic drag reduction estimator model for heterogeneous vehicle cohorts. While a majority of the research in this domain focuses on homogeneous vehicle cohorts, very few drag reduction estimators exist for heterogeneous cohorts. Three prospective models found in the literature were considered for integration into this study. Ref. [10] developed a prediction formula for aerodynamic drag reduction based on wake analysis and on-road experimentation. Although the on-road experiments were conducted using only a single type of vehicle, the prediction formula was extended to multi-vehicle-type platoons by leveraging dimensionless wake properties. Ref. [12] demonstrated a successful fit of the prediction formula from [10] to a two-vehicle empirical test case, yet it failed to fit the prediction formula to a three-vehicle test case with a light-duty truck within the platoon. Consequently, ref. [12] proceeded to update the coefficients of the prediction formula for a three-vehicle test case utilizing empirical on-road data collected by its author. Another relevant aerodynamic drag reduction estimator for heterogeneous platoons is presented in [26]. The research utilized CFD software to determine the drag coefficients for various vehicle types and configurations. Subsequently, a hybrid algorithm combining a Backpropagation Neural Network (BPNN) and Particle Swarm Optimization (PSO) was developed to optimize the model parameters of a non-linear numerical drag reduction estimator model.
The aforementioned aerodynamic drag reduction models were evaluated against in-house platooning test data. It was observed that all models correlated with certain test cases conducted at Michigan Tech, but none provided a complete fit across the entire dataset. Therefore, a decision was made to select the drag reduction estimator model that demonstrated the highest degree of correlation with the experimental data, which was the model presented in [26].
Given a group of randomly ordered connected and automated vehicles, initially traversing a limited-access highway at the speed limit, a methodology was developed for optimizing the vehicular sequence within the cohort to minimize cumulative effective energy consumption, depending upon the estimated travel distance of the cohort. The proposed methodology evaluates all the feasible configurations (final cohort order) that can be formed from the given set of vehicles. For each prospective final cohort configuration, it estimates the cost incurred during the transition from the stochastic initial configuration. This cost is then compared against the achievable energy benefits over the anticipated travel distance, leading to the selection of a final cohort order that maximizes the net energy benefit. Furthermore, the methodology integrates the powertrain characteristics (ICE, HEV, PHEV or EV) of each individual vehicle into the decision-making process. The effectiveness of this methodology is subsequently validated through simulation of a design of experiments utilizing a System of Systems simulation environment.
Section 2 begins by familiarizing the reader with the test vehicles employed in this study and their properties. Subsequently, the on-road test data collected to characterize the energy consumption of various cohort configurations is presented in Section 3. Section 4 introduces the simulation environment developed for simulating cohort reconfiguration and highway driving. Section 5 details the results derived from these simulations, specifically the associated cost and benefits of cohort reconfiguration. The paper also discusses the reliability of the drag reduction estimator models used to quantify the aerodynamic interactions within heterogeneous vehicles cohorts. Finally, an optimization logic is presented, which leverages connectivity-enabled information exchange to predict the optimal cohort configuration, given a set of constraints pertaining to lane availability and the distance that vehicles can travel together.
2. Vehicle Testing
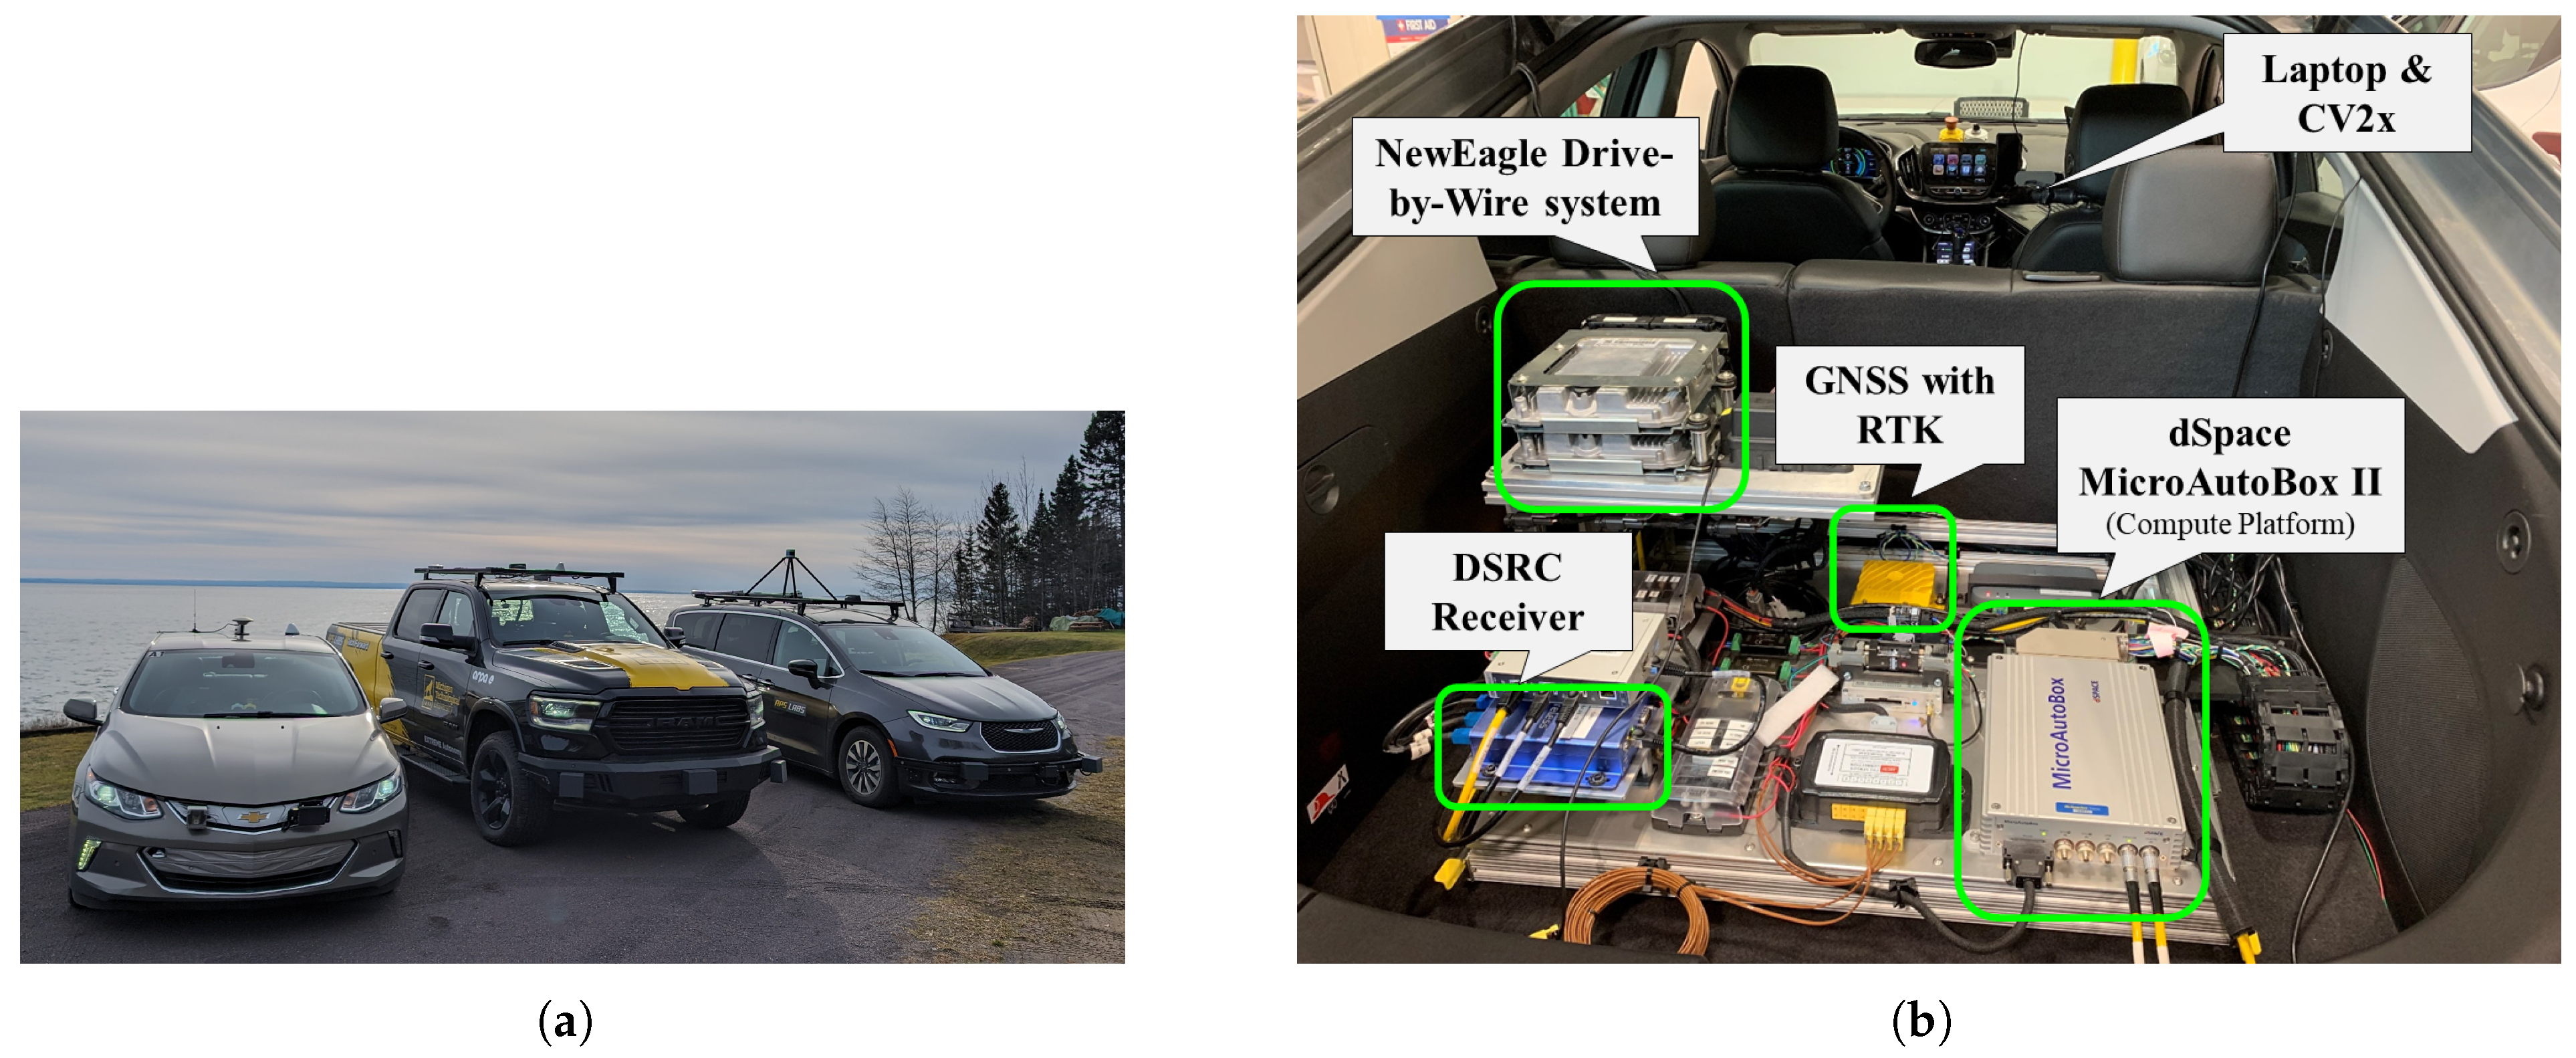
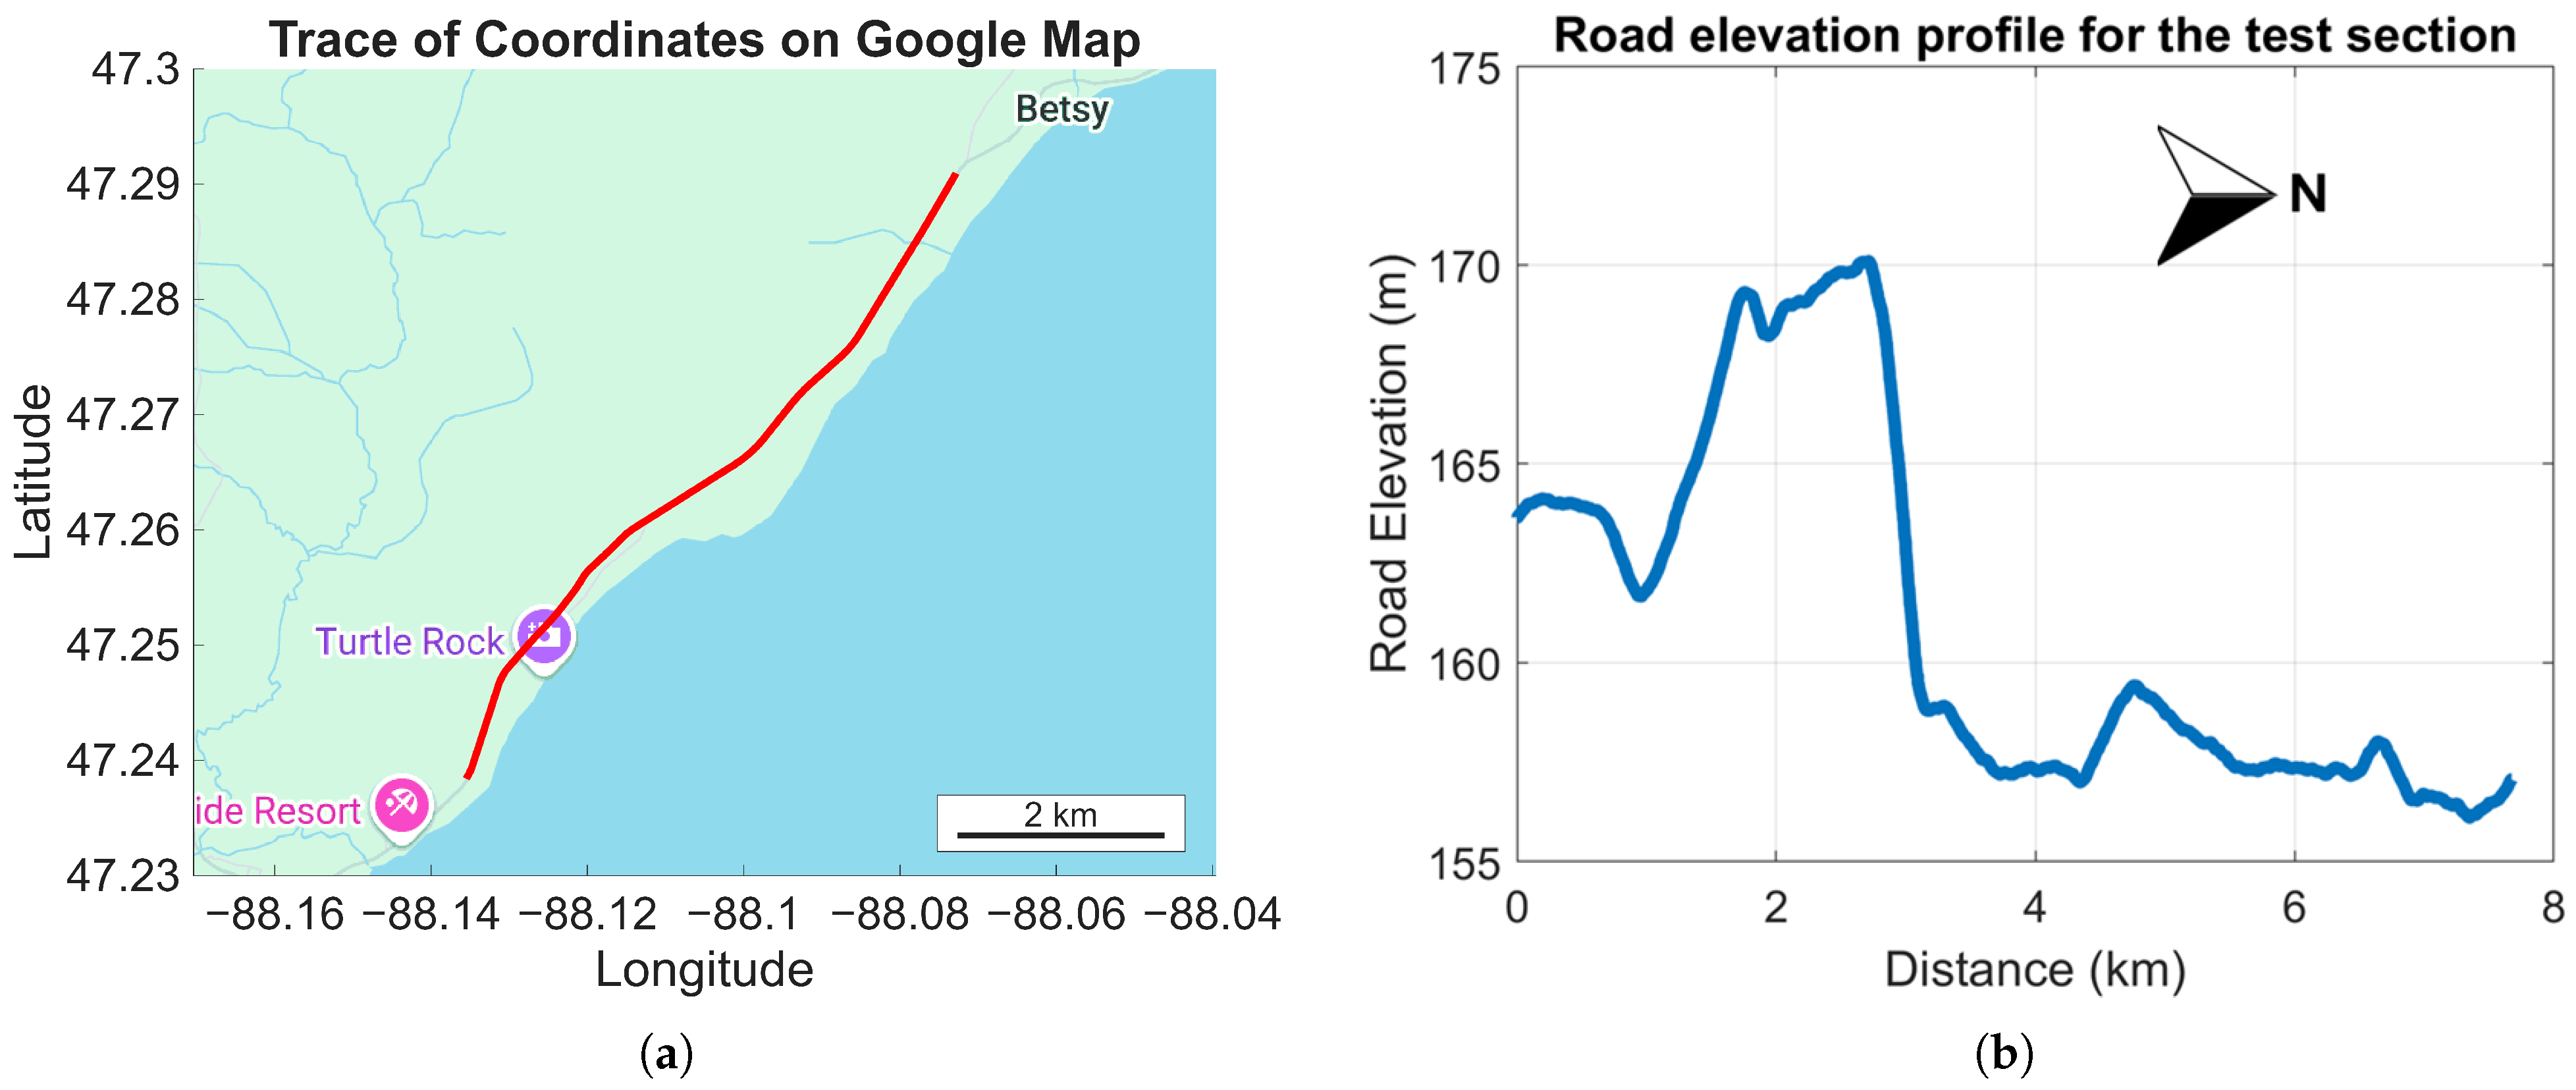
To investigate the energy savings potential of heterogeneous vehicular cohorts operating under various configurations, a series of on-road vehicle tests were conducted utilizing multiple vehicles. Three distinct vehicles—a Generation II Chevrolet Volt, a Stellantis Pacifica PHEV, and a Stellantis Ram 1500 mHEV as shown in Figure 2a—were tested on an 8 km (5 mi) roadway segment with a posted speed limit of 88.5 km/h (55 MPH). The geographical overlay of the test section and its corresponding elevation profile are shown in Figure 3. This specific section of the roadway was selected due to its low-traffic environment. The test day was chosen for its overcast skies and low-wind conditions to minimize the influence of temperature and wind on the results. All tests were conducted within a six-hour window on the same day, during periods of minimal to no external traffic. Any test runs where external traffic could have interfered with the data were excluded from the results. Each vehicle was instrumented with a high-precision GNSS + RTK systems and a Microautobox II/III for acquiring vehicular data at a sampling rate of 100 Hz. Although the vehicles were equipped with Level 4 autonomous hardware (Figure 2b), only their data acquisition capabilities and factory-installed Adaptive Cruise Control (ACC) feature were employed for this study, given the public roadway testing environment. A comprehensive summary of the vehicle characteristics and powertrain specifications is provided in Table 1.
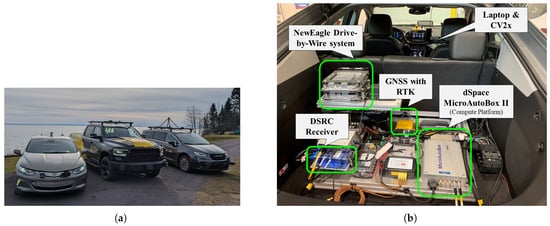
Figure 2.
Test vehicles with its available instruments: (a) Vehicles used for on-road data collection. (b) Test vehicle instruments.
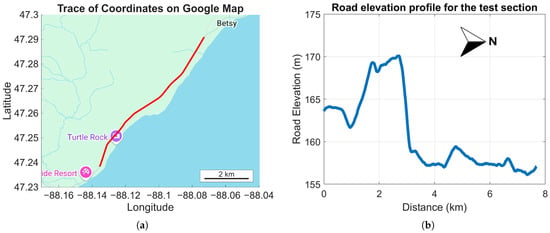
Figure 3.
Roadway characteristics utilized for vehicle tests: (a) Roadway segment. (b) Elevation profile.

Table 1.
Vehicles and its powertrain properties.
- Chevrolet Volt Gen II (Detroit, MI, USA): The Chevrolet Generation II Volt is classified as a Plug-in Hybrid Electric Vehicle (PHEV), capable of operating in a pure Electric Vehicle (EV) mode for a practical driving range of approximately 64 km (40 miles). Its powertrain architecture supports two all-electric Charge Depleting (CD) operating modes and three hybrid Charge Sustaining (CS) modes [27].
- Stellantis Pacifica (Detroit, MI, USA): The Stellantis Pacifica functions as a Plug-in Hybrid Electric Vehicle (PHEV), with comparatively reduced all-electric driving range of approximately 51 km (32 miles) relative to the Volt. The Pacifica also has a multi-mode powertrain with two operating modes for forward propulsion [28]: an all-electric Charge Depleting (CD) operating mode and a Charge Sustaining (CS) hybrid operating mode.
- Stellantis Ram 1500 (Detroit, MI, USA): The Stellantis Ram 1500 is characterized as a full-sized light-duty (LD) Mild Hybrid Electric Vehicle (mHEV) pickup truck. It incorporates an engine start/stop functionality and an e-motor torque assist. The vehicle does not possess the capability of all-electric propulsion; however, its e-motor can deliver supplementary power to assist the internal combustion engine during periods of high torque demand.
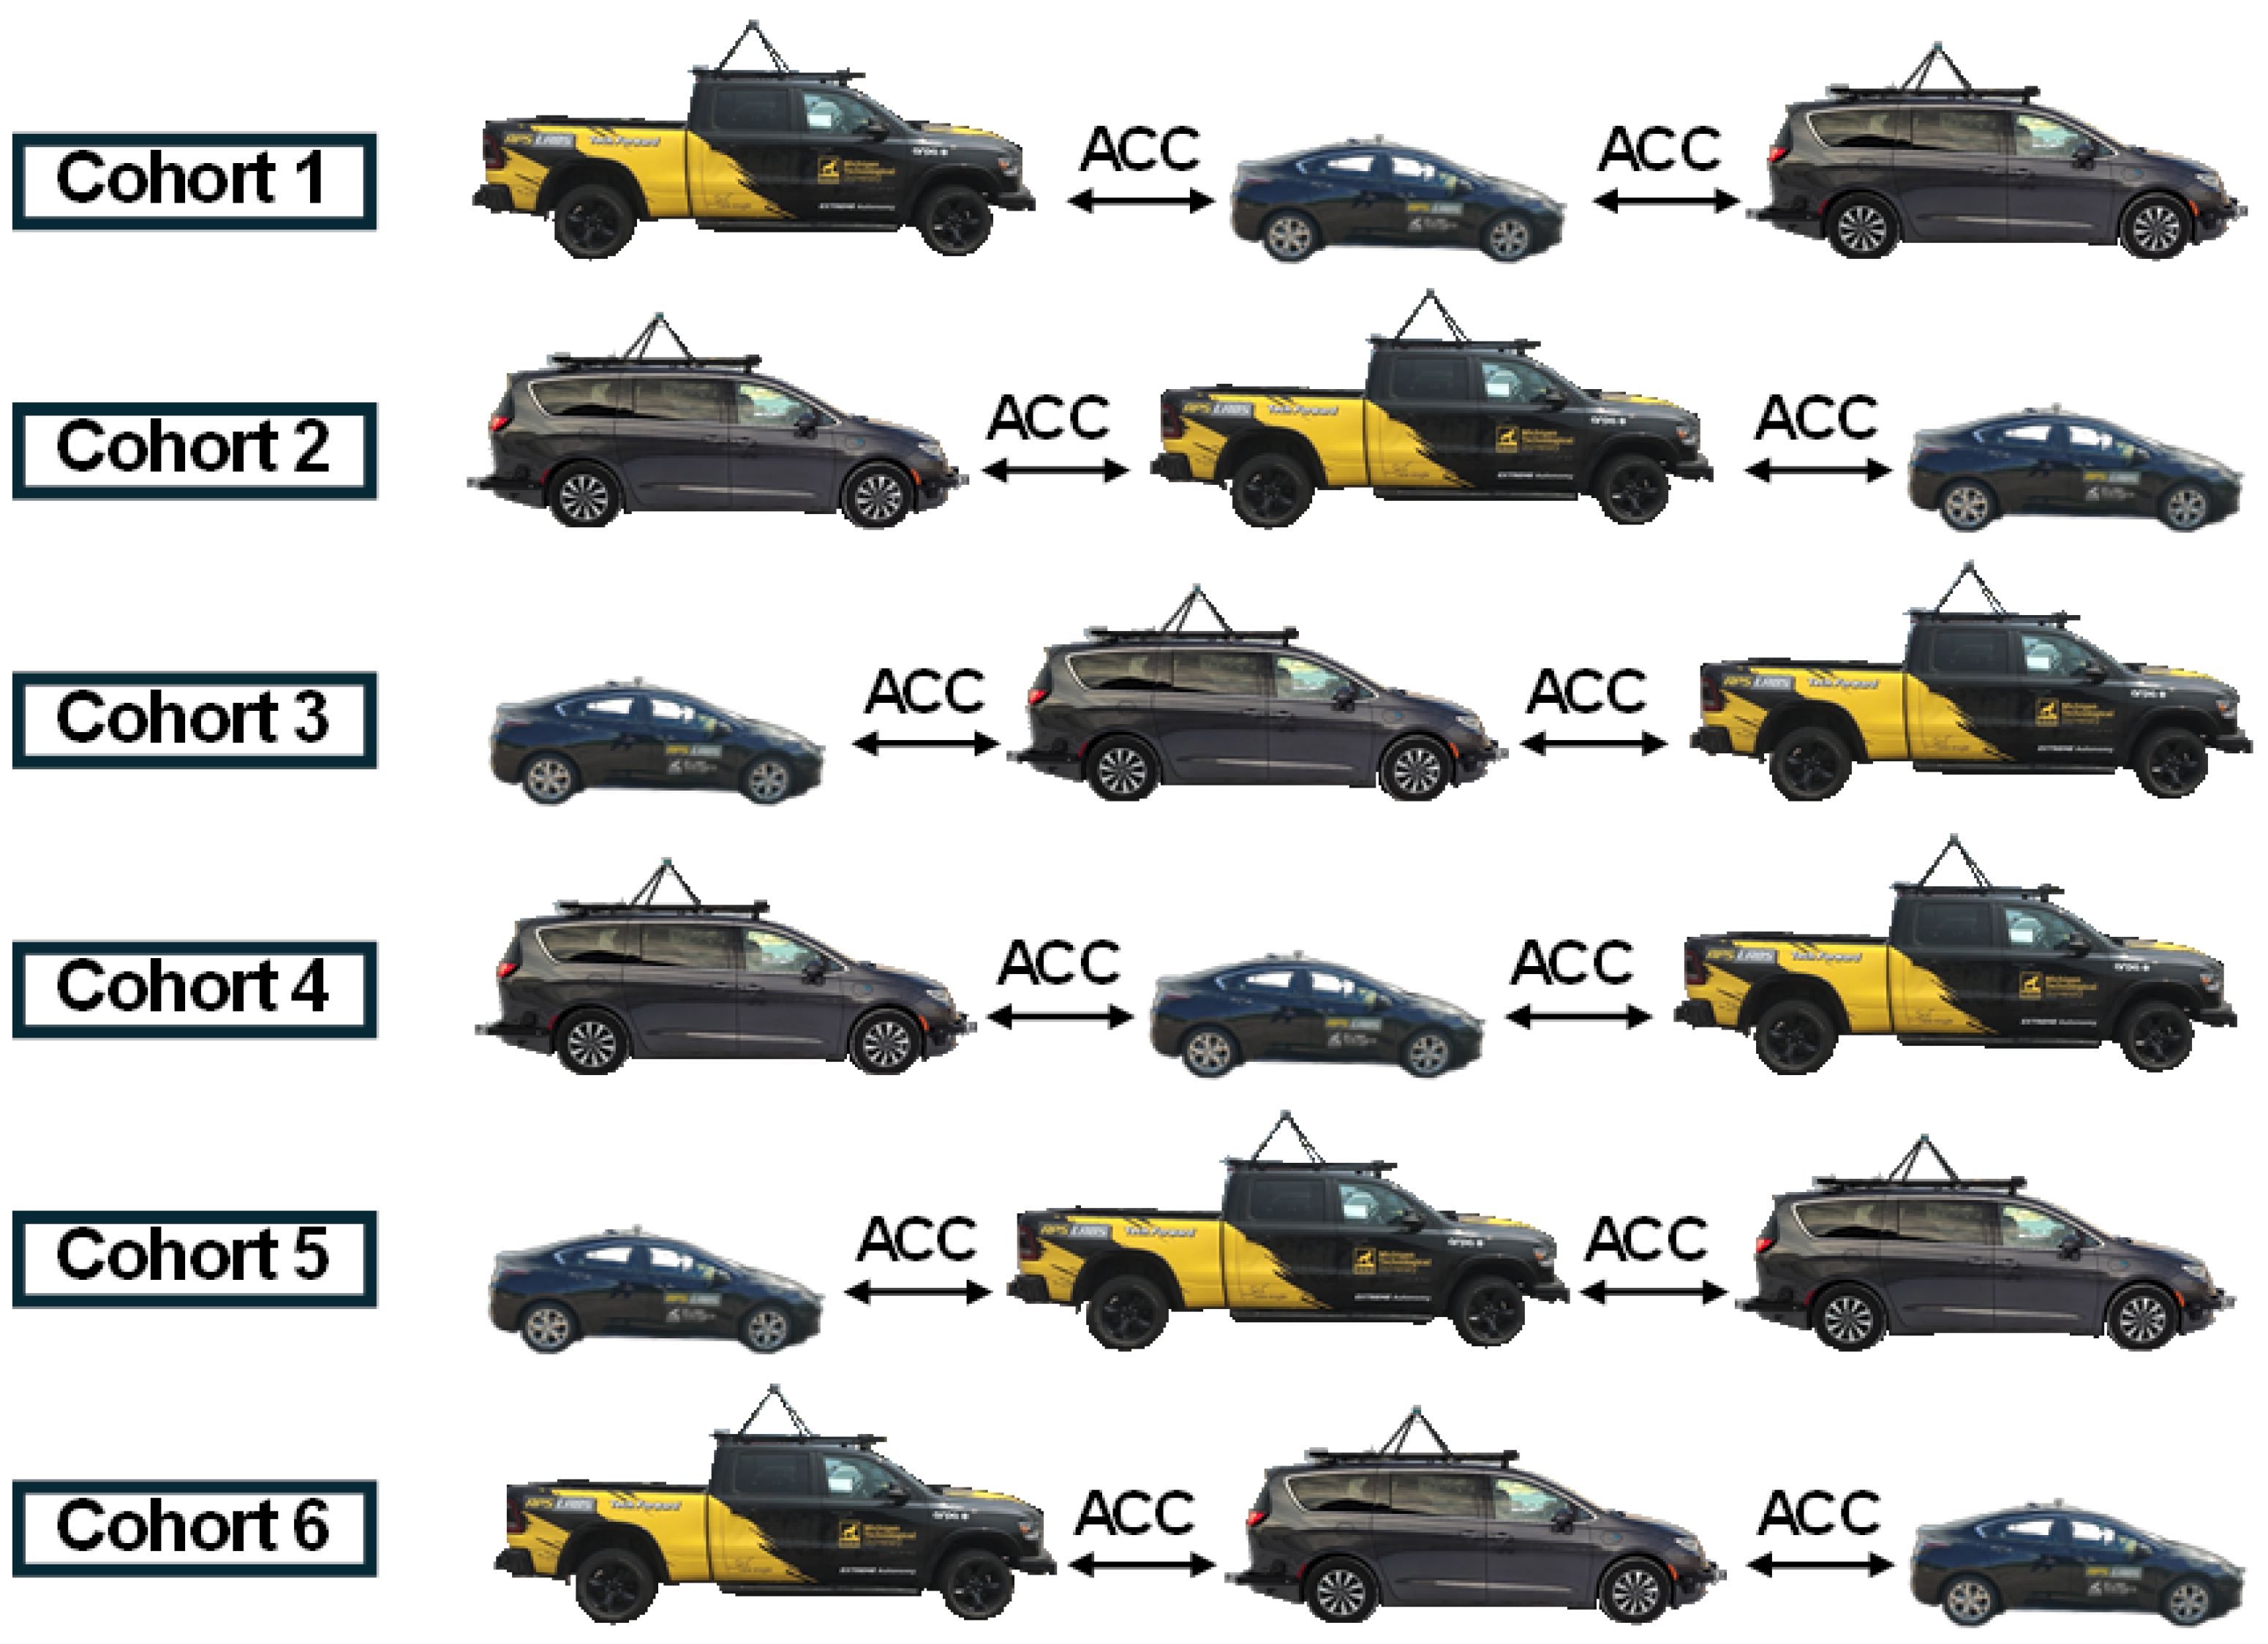
Given the availability of three different vehicles for testing, a total of six unique cohort configurations could be possible. Each specific cohort configuration was assigned a corresponding label as illustrated in Figure 4.
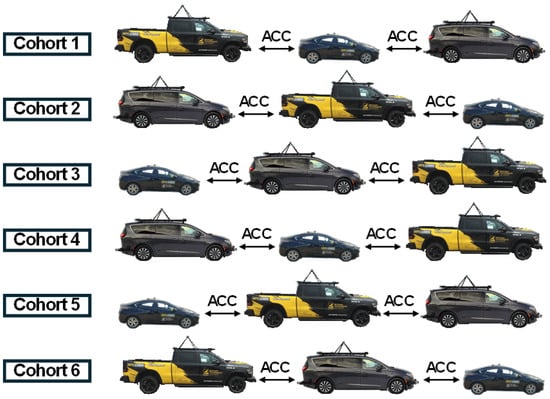
Figure 4.
Vehicle configurations assigned for on-road testing.
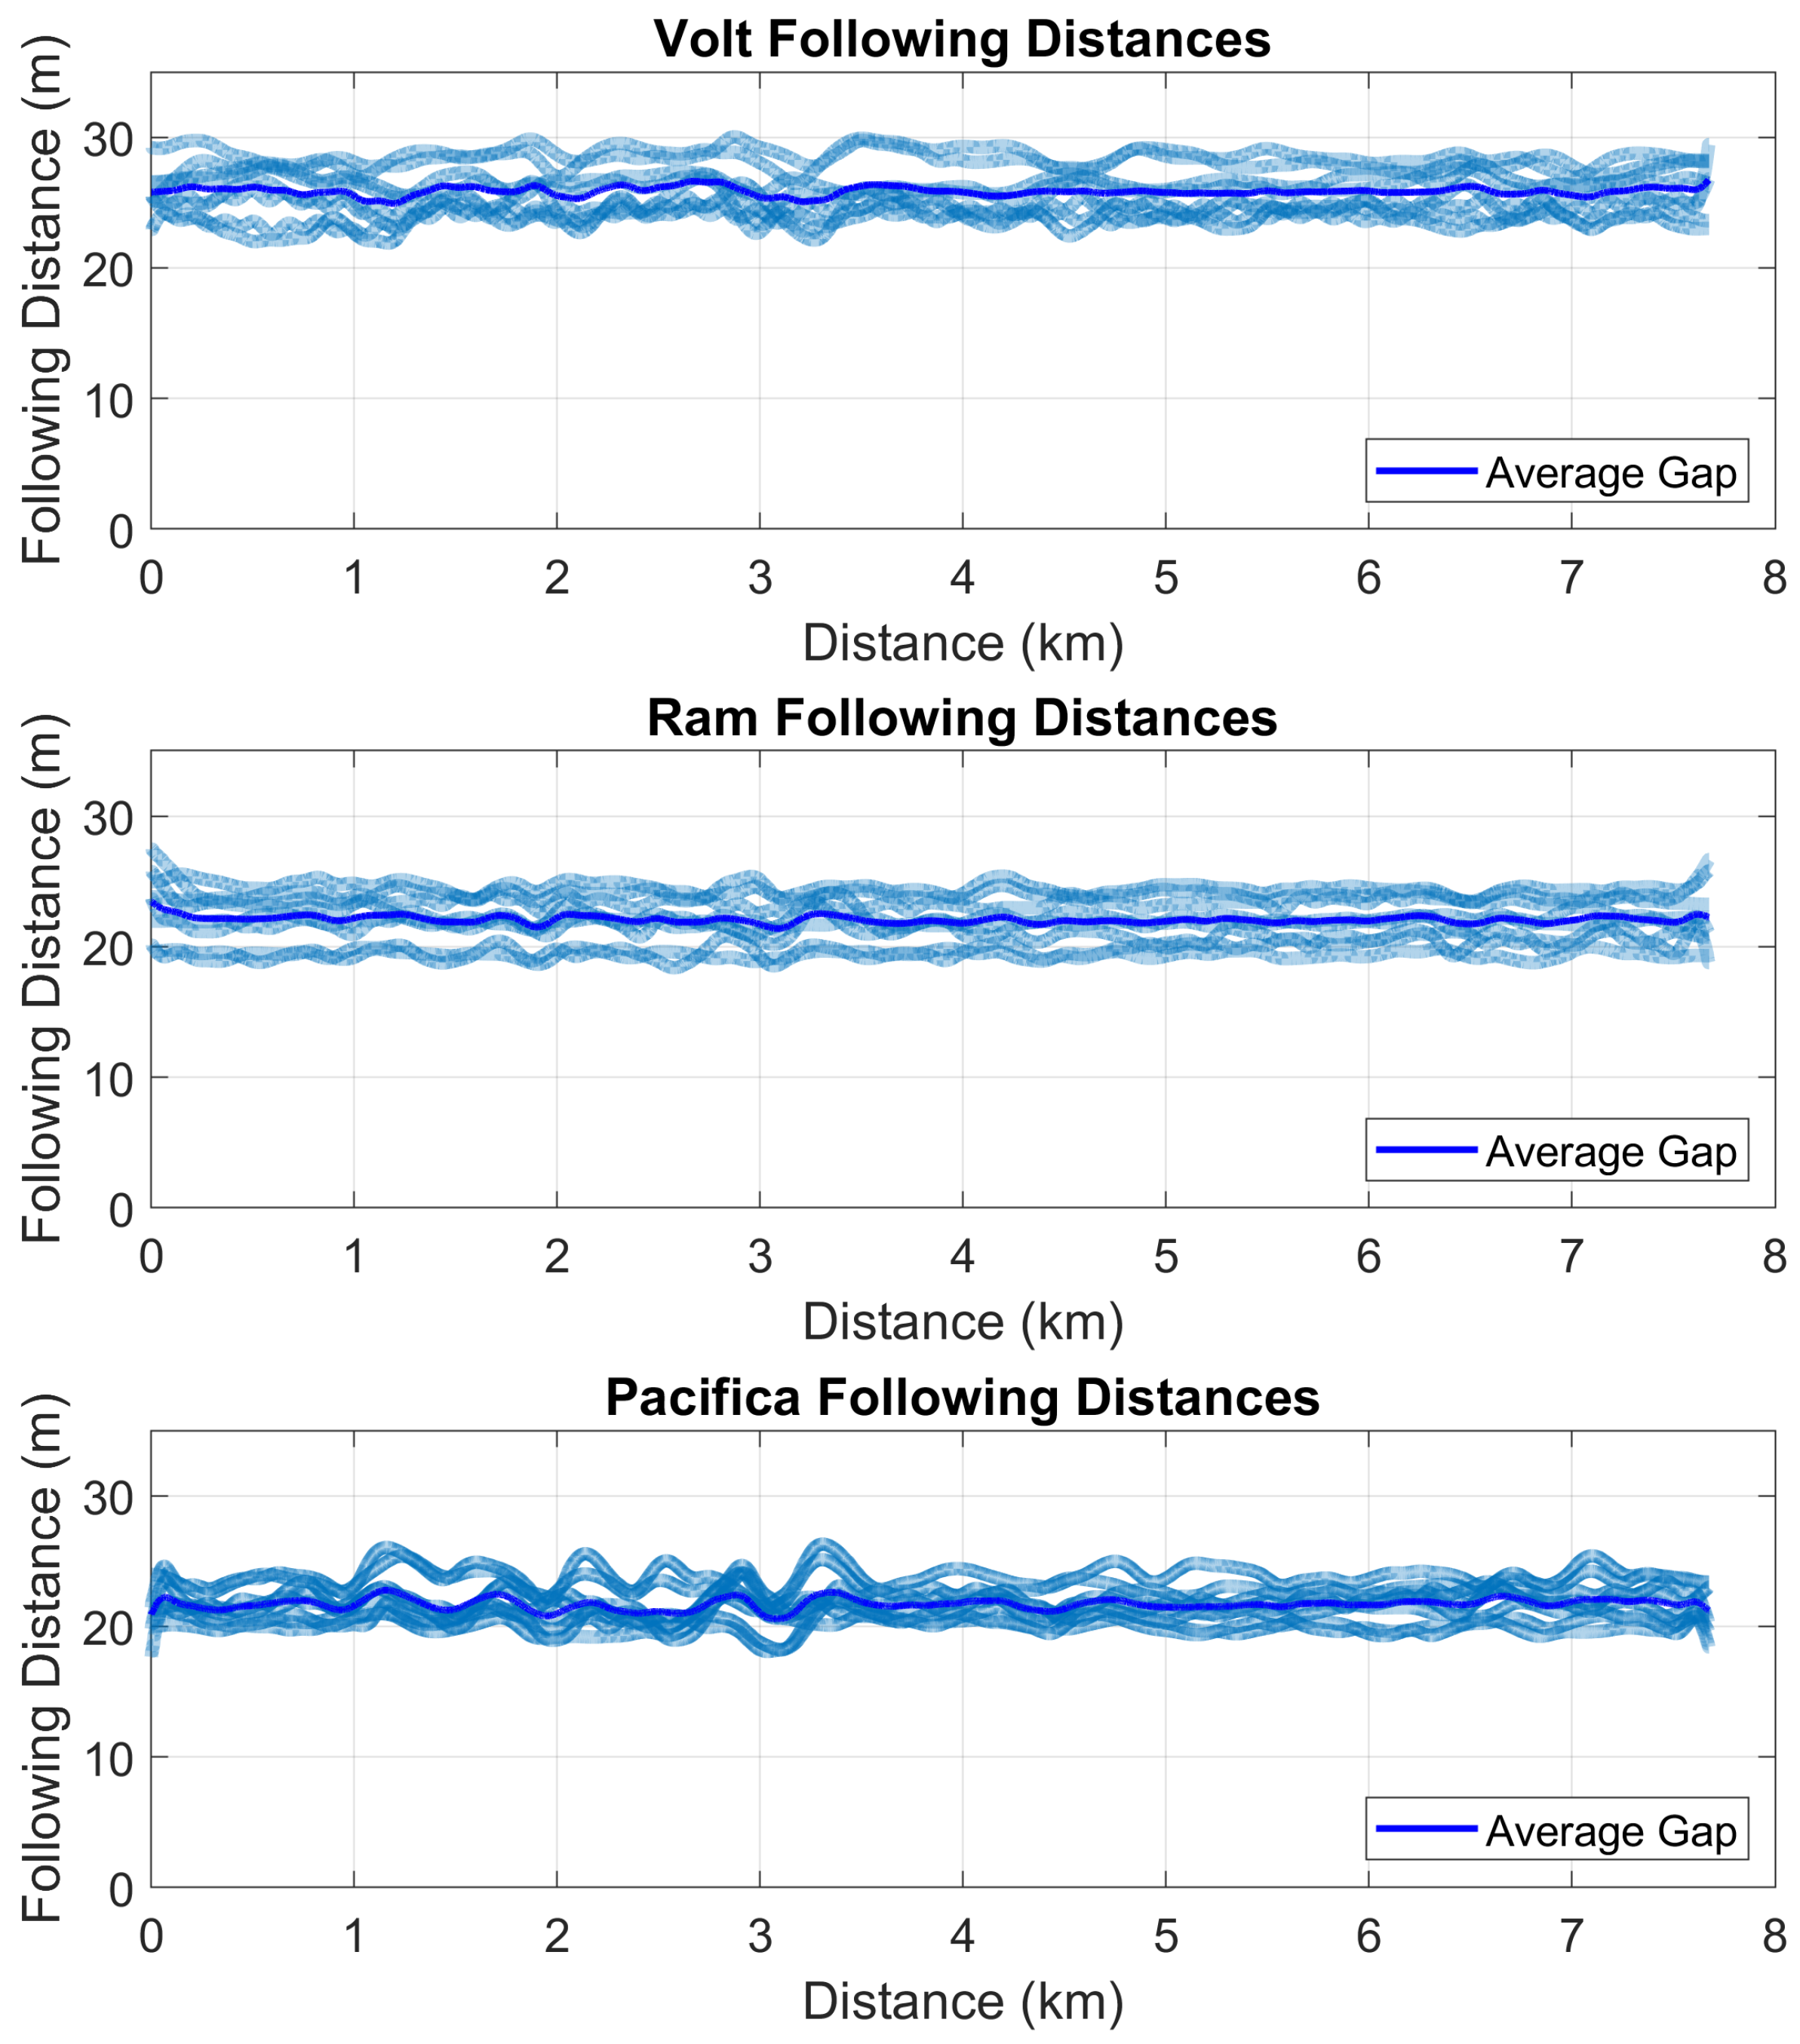
Each vehicle was operated at the speed limit (88.5 km/h (55 MPH)) utilizing its factory-installed Adaptive Cruise Controller (ACC) system, configured to its minimum inter-vehicular gap setting. Discrepancies in controller tuning across the distinct vehicle models resulted in slightly varied average inter-vehicular gaps (26 m for the Volt, 22 m for the Pacifica, and 22 m for the Ram 1500). The factory-installed ACC controllers of the vehicles used in this study used a speed adjusted time-headway controller. Because all the tests were conducted at the same speed, this resulted in a fixed inter-vehicular gap across all runs. Ideally, all vehicles would have Vehicle-to-Vehicle (V2V) communication capability to allow for a Cooperative Adaptive Cruise Controller (CACC), which enables users to specify the exact spacing they need. This would eliminate any variations in inter-vehicular spacing. Since a CACC was unavailable for this study, we had to use the factory-installed ACCs. The employment of a CACC would allow for safer operation at closer gaps, likely leading to greater energy savings than what was observed in this study.
A maximum standard deviation of approximately 1 m in inter-vehicular gap from the average was observed across all vehicles. This variance can be attributed to both external factors, such as road grade changes and cohort dynamic interactions, and internal factors, including powertrain operating modes and cruise controller calibration. The inter-vehicular gap trace for each vehicle, correlated to specific GPS coordinates on the test track, is shown in Figure 5. To mitigate the influence of road grade, each test case was replicated in both the northbound and southbound directions.
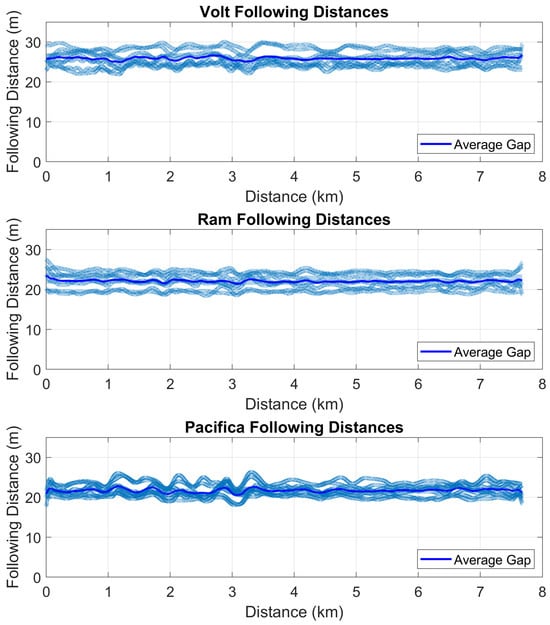
Figure 5.
Inter-vehicle gap among different test vehicles across all test cases.
3. Test Results
The energy consumption derived from the tests can be categorized into two: the influence of relative positional assignment of each vehicle within the cohort on its individual energy consumption and the cumulative energy consumption of the entire cohort under various configurations.
3.1. Overall Energy Savings from Cohorts
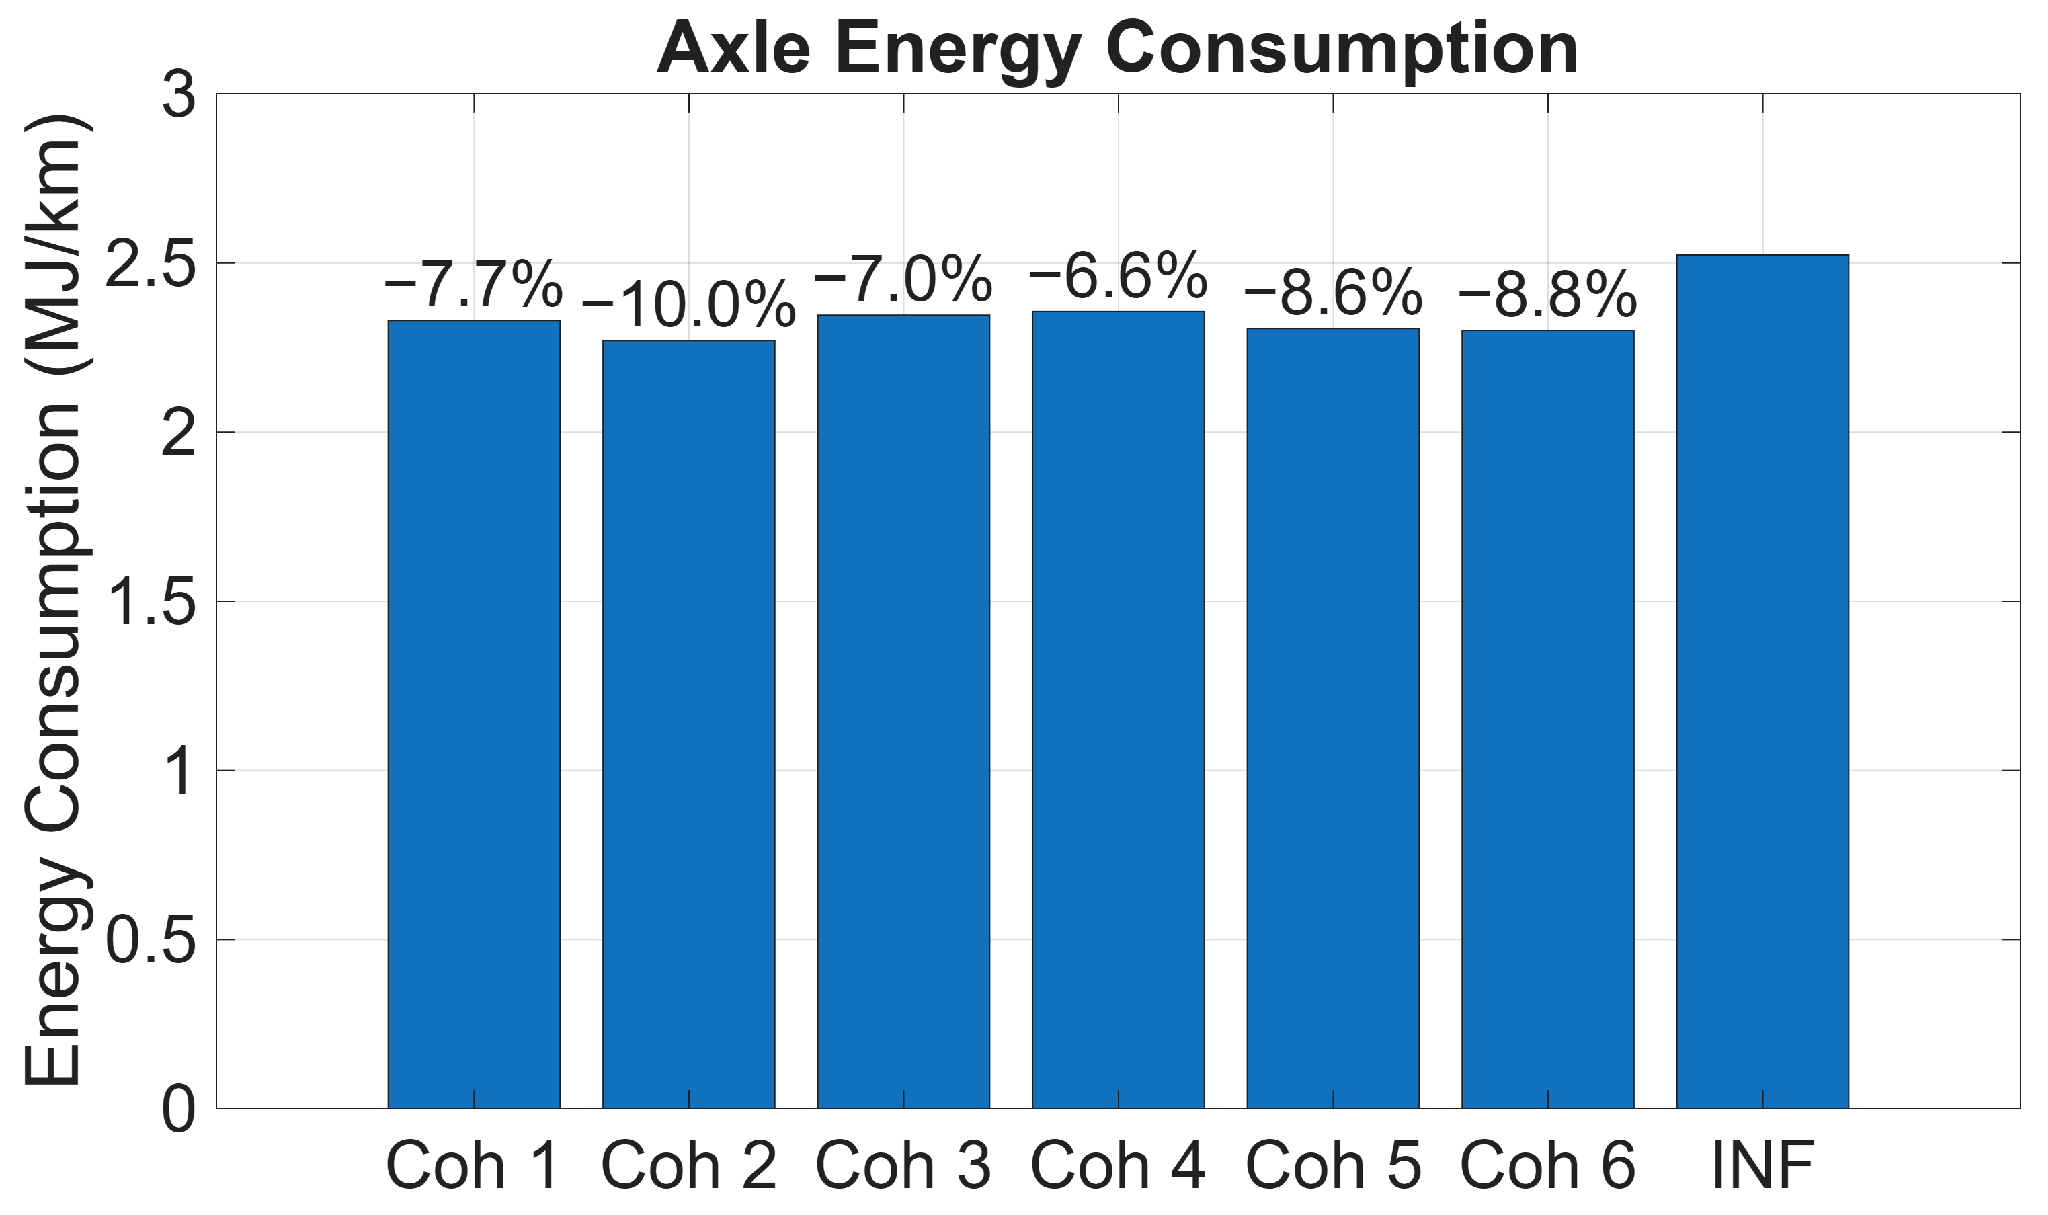
The cohort-wide reduction in axle energy is shown in Figure 6. This figure illustrates the reduction in axle energy consumption at the cohort level for various configurations. The designation ‘INF’ denotes the cumulative axle energy consumption when a vehicle operates independently at a substantial inter-vehicular distance (>200 m), thereby ensuring no aerodynamic interaction. It is observed that the total axle energy demand varies significantly for various configurations. From a purely axle energy perspective, independent of specific powertrain characteristics, Cohort 2 (Volt-Ram-Pacifica) exhibits the most substantial energy savings savings among all feasible combinations. This knowledge can be leveraged to operate this particular set of vehicles in the second configuration to attain maximal energy benefits on a limited-access highway.
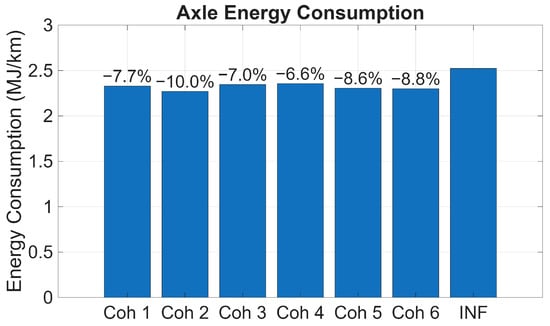
Figure 6.
Axle energy consumption of different cohort configurations during tests relative to traveling independently.
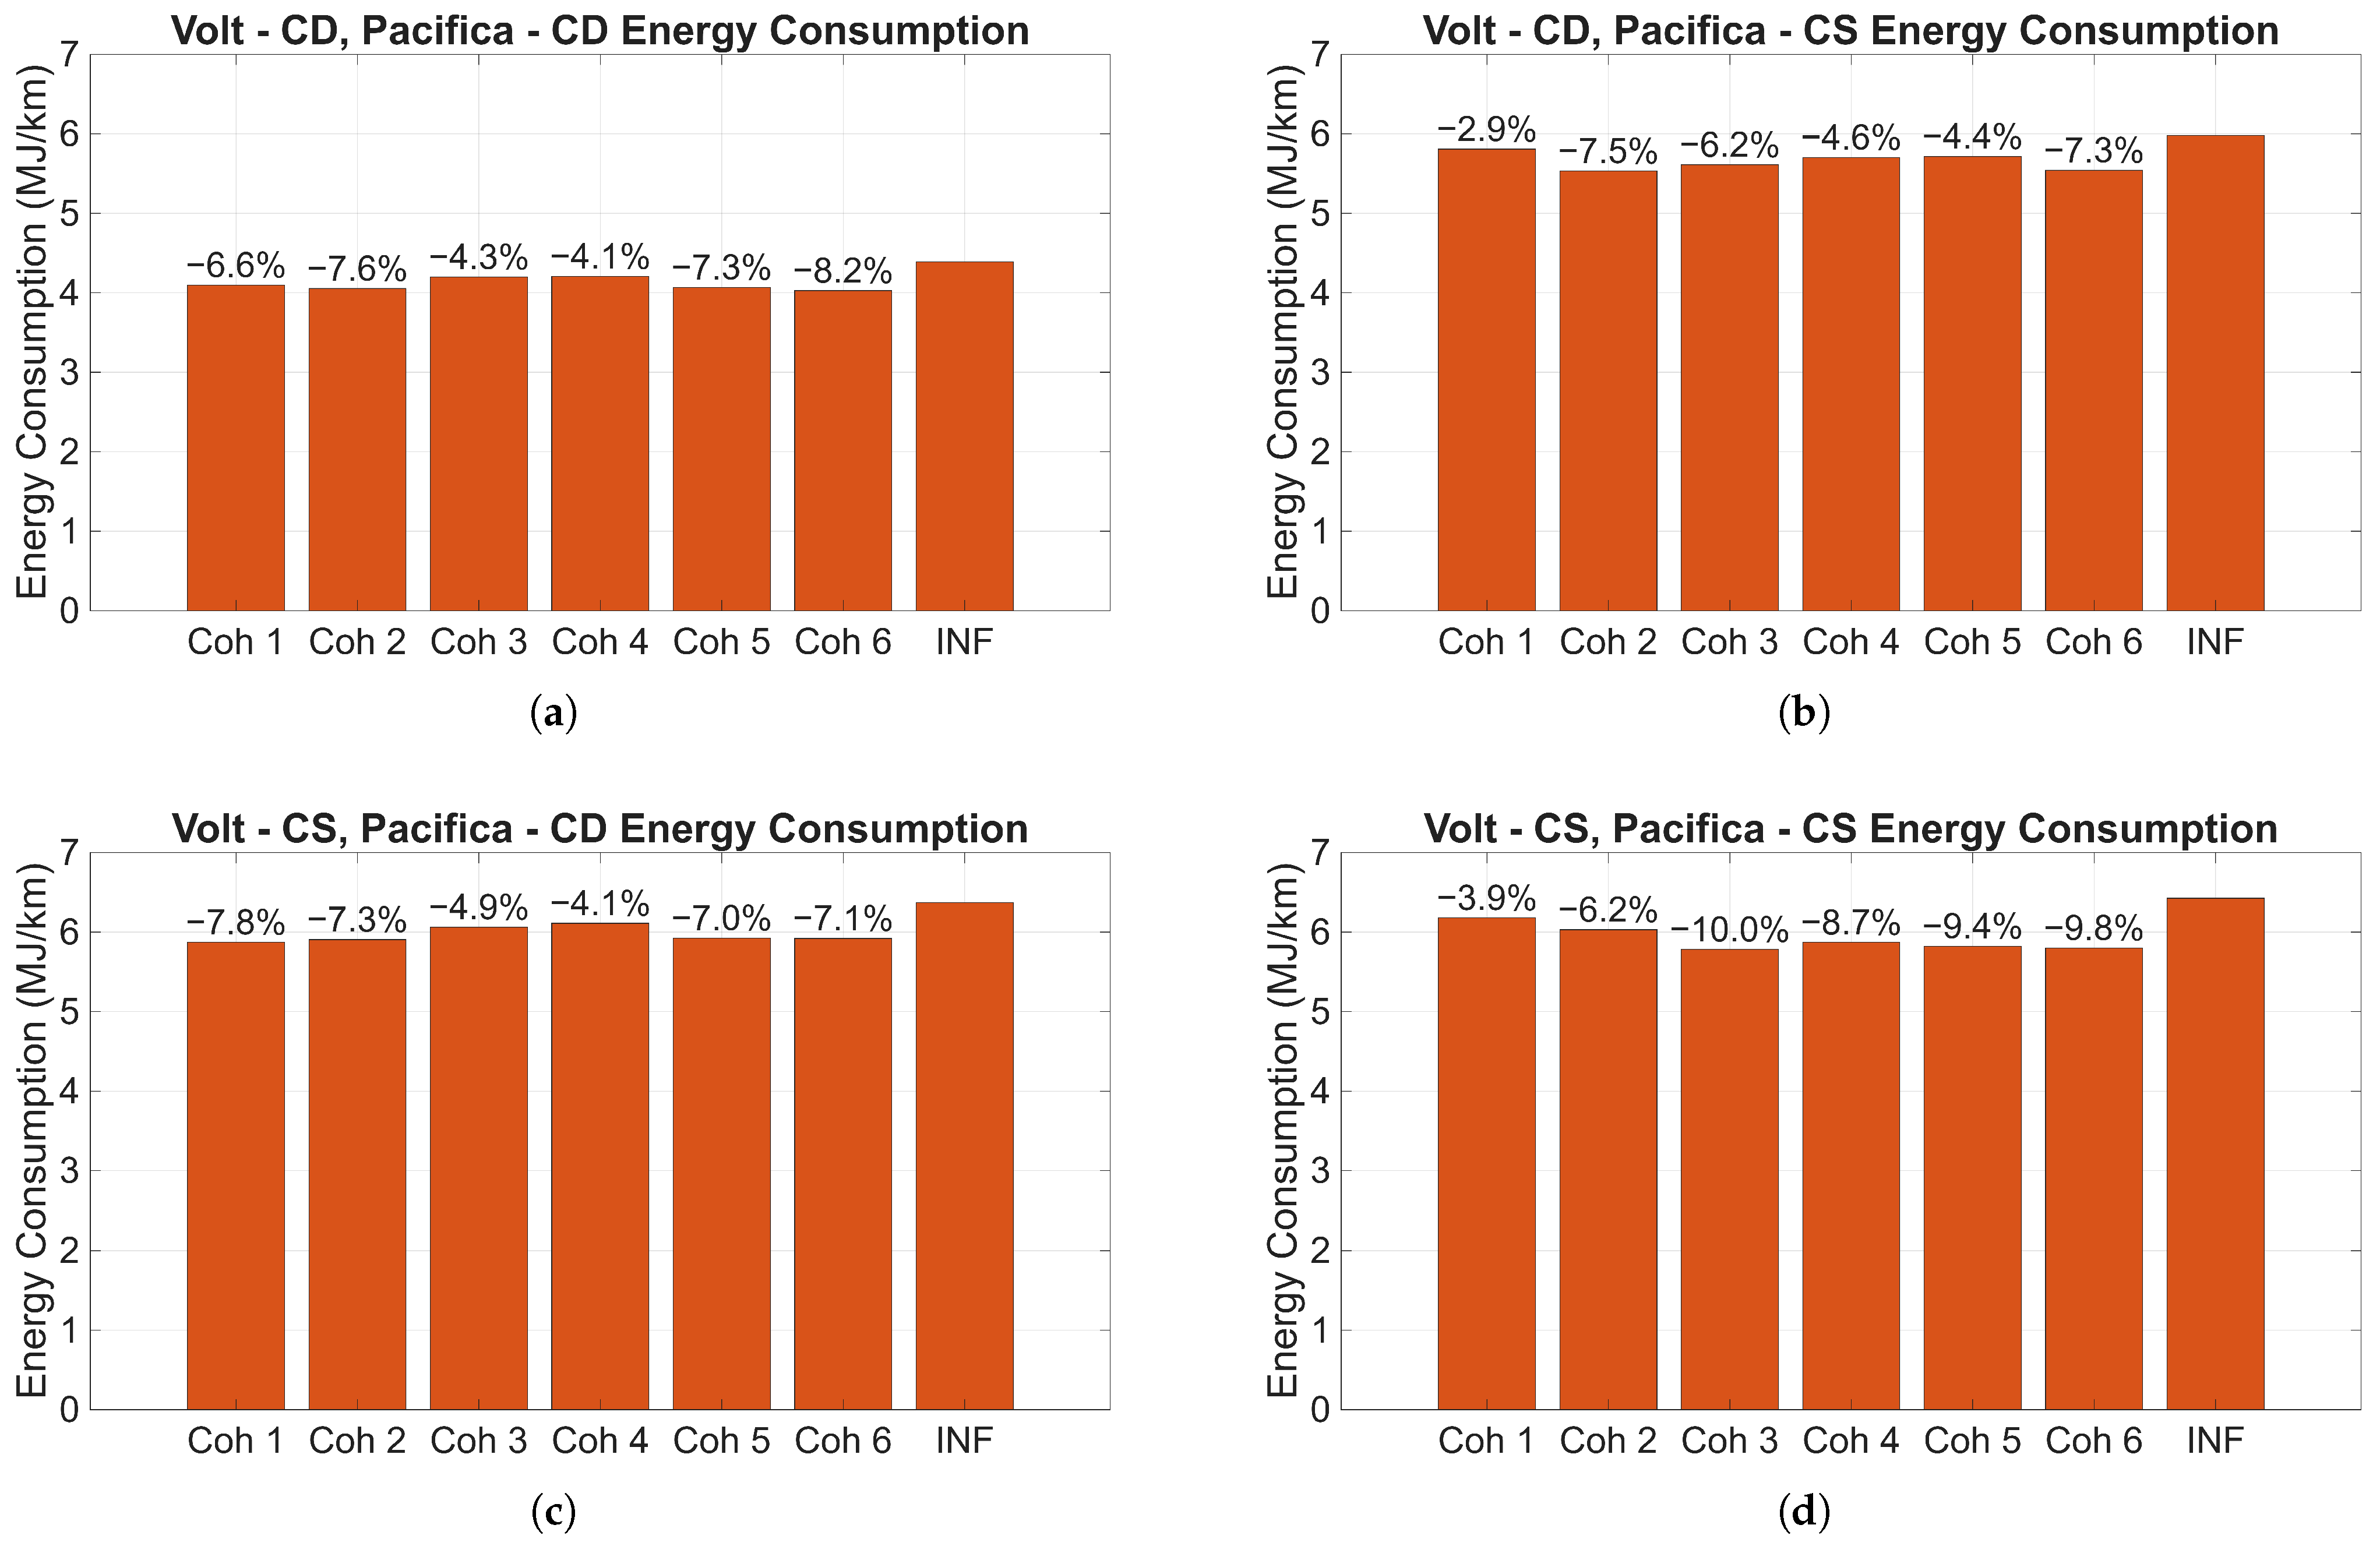
The optimal sequencing of a cohort can vary significantly when considering the powertrain characteristics of each constituent vehicle. Directly testing every possible configuration across different powertrain operational modes would lead to an exponential increase in the number of tests. To circumvent this, recorded axle torque and vehicle speed data from on-road tests was leveraged. This data was then used to estimate the energy consumption of each vehicle under different powertrain operating modes. The variations in drag force reduction across different cohort configurations are captured in the axle torque measurements for each vehicle. This axle torque data, combined with corresponding vehicle speed, is fed into each vehicle’s energy estimator models (detailed later in the article). This process allows for the estimation of energy consumption across different powertrain operating modes. The influence of powertrain modes on energy consumption is evident in Figure 7. For instance, when both the Volt and Pacifica operate in CD mode, Cohort 6 (Volt-Pacifica-Ram), shown in Figure 7a, yields the highest overall energy efficiency, demonstrating approximately 8.2% less energy consumption compared to independent operation. This is attributed to the considerable lower energy cost associated with CD mode compared to IC engine operation. Consequently, in this particular configuration, the CD vehicles are “sacrificed” by positioning them at the front of the cohort to maximize the aerodynamic benefit for the larger IC engine vehicle.
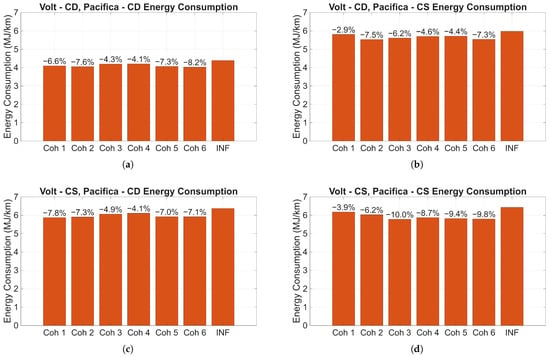
Figure 7.
Effect of powertrain operating modes on the energy savings potential of various cohorts: (a) Volt-CD, Pacifica-CD. (b) Volt-CD, Pacifica-CS. (c) Volt-CS, Pacifica-CD. (d) Volt-CS, Pacifica-CS.
Conversely, in case both the Volt and Pacifica operate in Charge Sustaining (CS) mode, Cohort 3 (Ram-Pacifica-Volt) yields the most energy savings, achieving up to 10% reduction relative to each vehicle running independently. Similarly, when the Volt is operated under Charge Depleting (CD) conditions and the Pacifica under CS conditions, the most efficient configuration is Cohort 2 (Volt-Ram-Pacifica), demonstrating 7.5% energy savings, closely followed by Cohort 6 with 7.3% energy savings. Conversely, in scenarios where the Pacifica operates under CD conditions and the Volt under CS, Cohort 1 (Pacifica-Volt-Ram) emerges as the most optimal configuration with approximately 7.8% energy savings.
3.2. Positional Effects on Individual Vehicle Aerodynamic Drag Reduction Within a Cohort
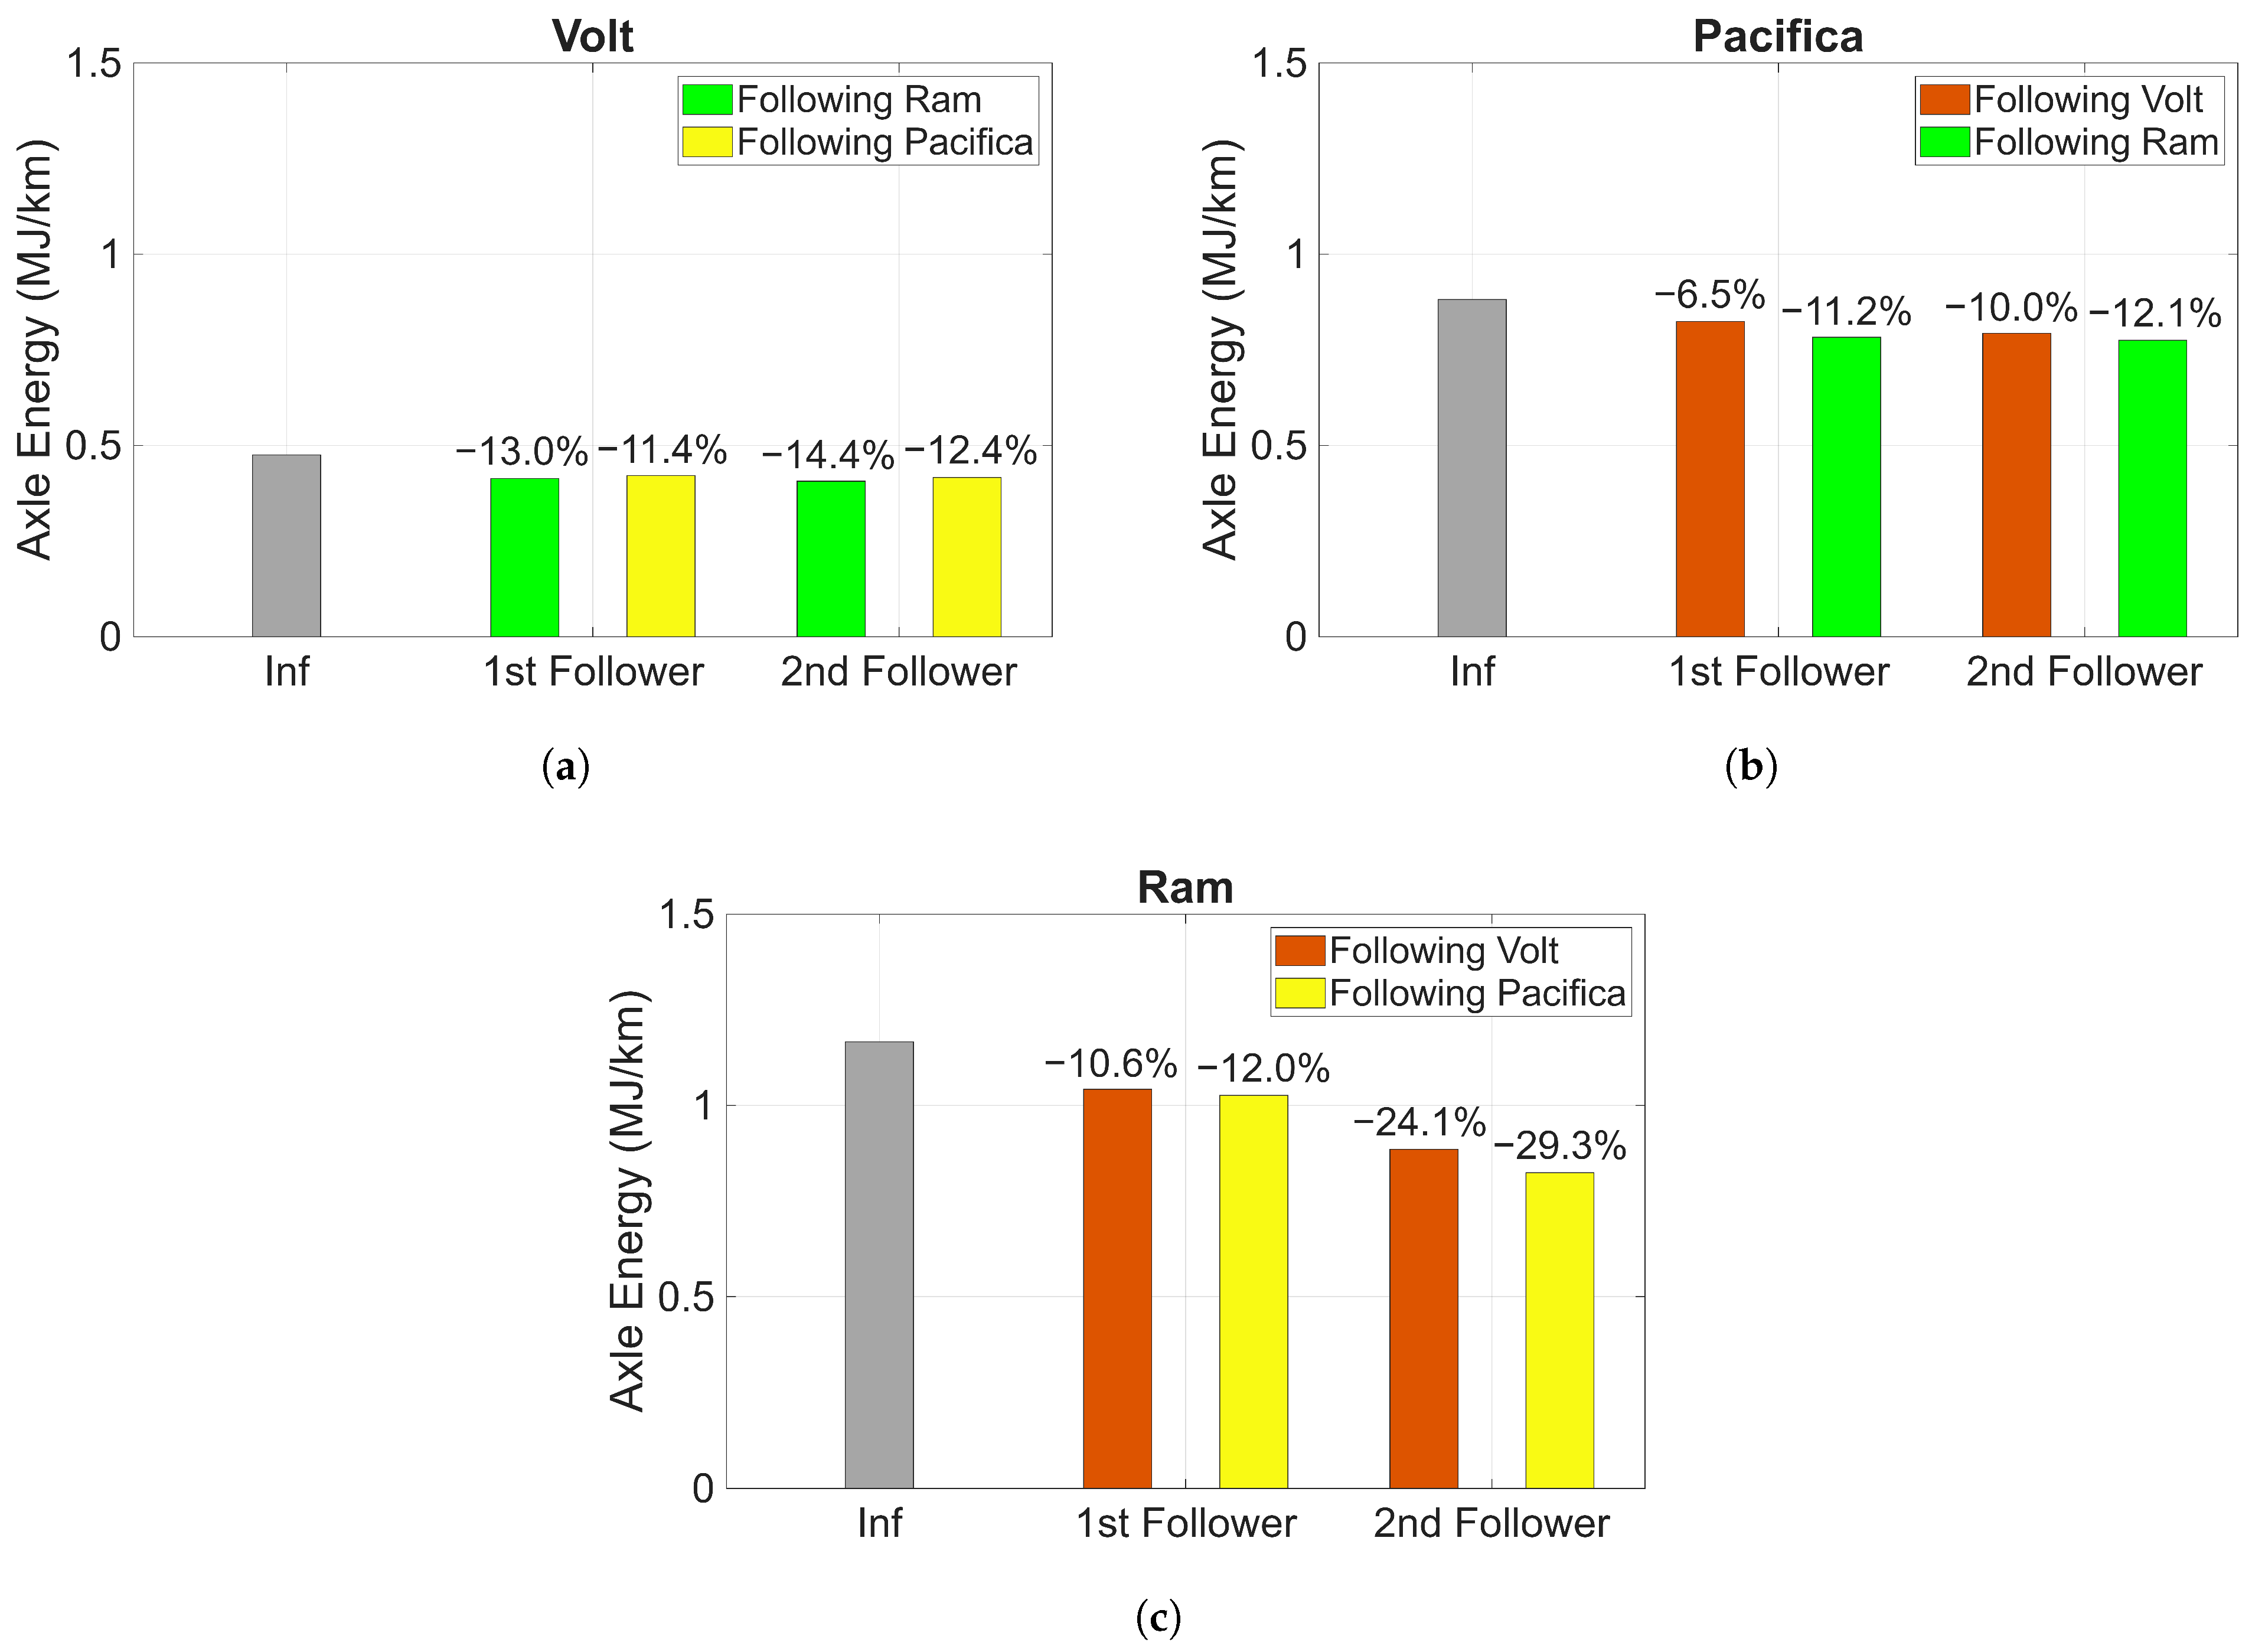
In addition to the energy savings across the cohort attributed to platooning, the individual axle energy consumption characteristics of vehicles within the cohort at different positions was also investigated. Figure 8 shows the difference in axle energy per kilometer for the test vehicles based on their relative position within the cohort and type of preceding vehicle. Specifically, the gray bar denotes the energy consumption of the respective vehicles when operating in unperturbed air flow (i.e., without any following or leading vehicles). Conversely, the colored bars represent the energy consumption observed when the vehicle is trailing a specific preceding vehicle.
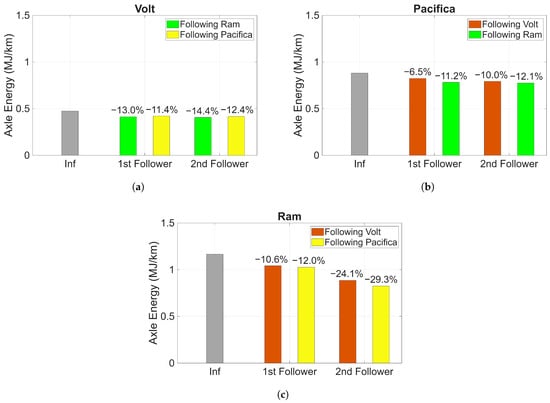
Figure 8.
Effect of various positions of the vehicle in the cohort on the axle energy consumption: (a) Volt. (b) Pacifica. (c) Ram 1500.
It is evident from the data that all vehicles save more energy when in the third position within the cohort at the tested gap, compared to being in the middle or front. While some of the literature suggests that at closer inter-vehicular distances, middle vehicles can show greater energy savings due to reduced wake-induced back pressure from trailing vehicles [10,26], our findings for the tested gaps consistently favor the trailing position.
For the Volt, we observed comparable energy savings when it trailed either the Ram or the Pacifica. However, it achieved a 1.6% greater energy saving when in the second position behind the Ram, and this benefit increased to 2% in the third position, likely due to the similar sizes of the Ram and Pacifica. The Pacifica showed a notable difference in energy savings depending on whether it followed the Volt or the Ram in the second position, saving 4.7% more energy when trailing the Ram. In the third position, this difference became less pronounced, as the Pacifica benefited from both the leading Ram and the intermediate Volt, though it still saved more energy when the Ram was closer.
For the Ram, its position within the cohort had a much greater impact on energy savings than the specific preceding vehicle type. While there was a 1.4% difference in energy consumption in the second position when following the Pacifica versus the Volt (increasing to 5.2% in the third position), the most significant gains came from changes in its own position. For example, a substantial 17.3% jump in energy savings was observed when the Ram moved from the second to the third position behind the Pacifica, and a 13.5% increase when behind the Volt. A cumulative savings of 24.1% was achieved when the Ram trailed the Volt in the third position, partly due to the Pacifica leading the cohort. Overall, vehicles with high road load and high specific energy consumption propulsion systems consistently demonstrated the most significant energy savings through optimal cohort configuration compared to other vehicle types.
This dataset additionally underscores the inherent complexities in accurately quantifying the effects of the vehicle type and the position of a vehicle within the cohort on the energy consumption reduction.
4. Simulation Environment
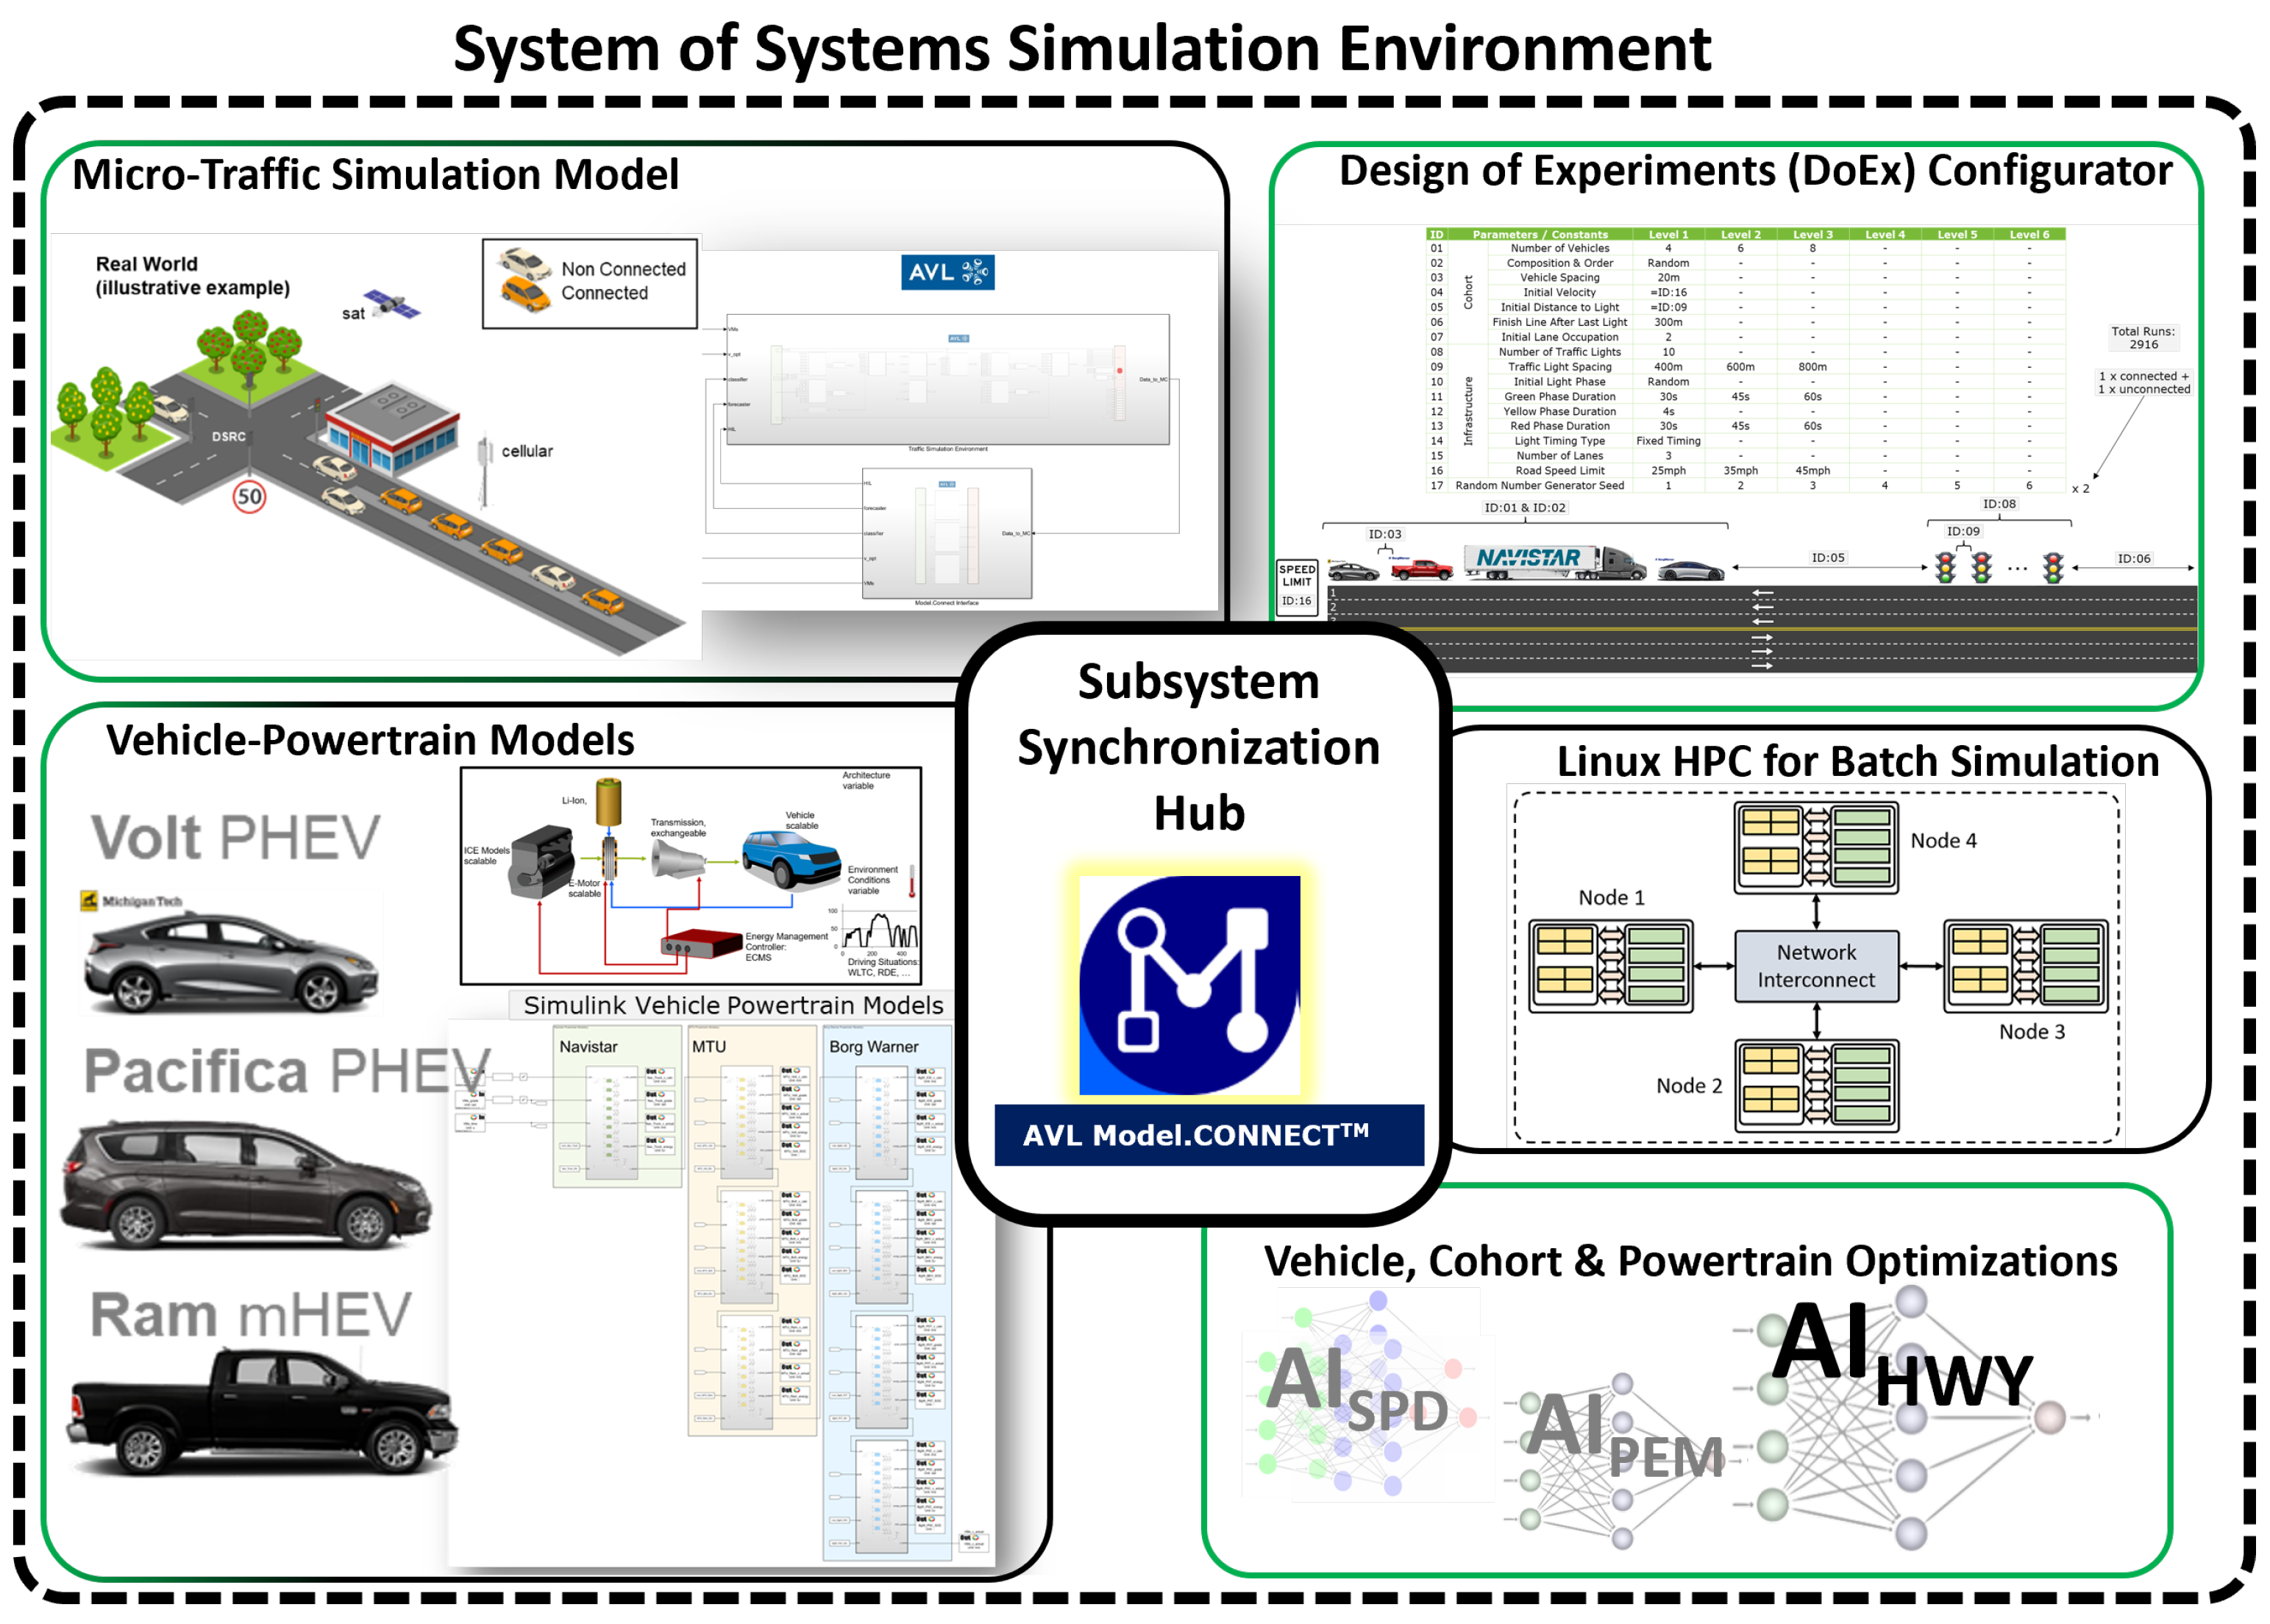
The study utilized a Simulink-based simulation environment which served as a platform for evaluating the complex dynamics of cohort reconfiguration and energy consumption. Developed in collaboration with AVL Mobility Technologies and leveraging their ModelConnect software, this System of Systems (SoS) framework enabled the co-simulation of critical subsystems, including micro-traffic flow, vehicle powertrains, and an optimization module. Its capability to time-synchronize these diverse components and facilitate seamless data exchange was crucial for accurately modeling vehicle interactions during reordering maneuvers. Given the inherent risks and costs associated with extensive on-road testing for every possible cohort configuration and powertrain mode, the simulation environment provided a safe, efficient, and scalable means to conduct a comprehensive design of experiments, allowing for the precise quantification of reconfiguration energy costs and the long-term energy benefits derived from optimized cohort arrangements. The overall architectural design of the simulation environment is shown in Figure 9. This environment was developed and validated as part of a larger project, and the details of that can be found in [29].
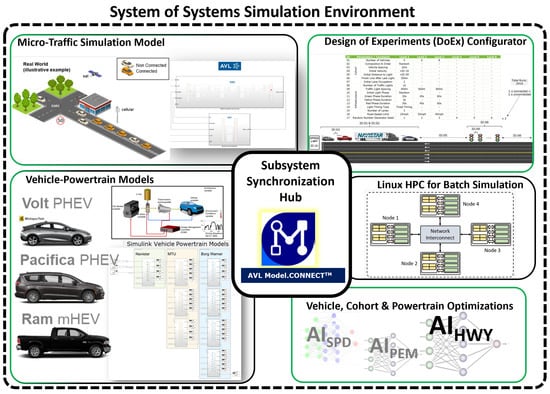
Figure 9.
AVL System of Systems simulation environment.
4.1. Vehicle Powertrain Subsystem
The Vehicle Powertrain Subsystem serves as the repository for the powertrain models used to estimate the energy consumption of various vehicles executing different maneuvers. This subsystem encompasses several validated vehicle powertrain models representative of different classes of vehicles including sedans, SUVs, minivans, light-duty and semi-trucks.
For the scope of this study, only three specific types of vehicles were considered: a Generation II Chevrolet Volt PHEV, a Stellantis Pacifica PHEV, and a Stellantis Ram 1500 mHEV. Energy estimator models for all three aforementioned powertrains were available within the Vehicle Powertrain Subsystem.
All three powertrain models were developed in-house at Michigan Tech utilizing validated methodologies. For a comprehensive description of the model development methodology used for developing the Volt powertrain model, which represents the most complicated powertrain among the three selected vehicles, readers are directed to [30]. A similar approach was applied to the development of the energy models for the other vehicles used in this study.
4.2. Micro-Traffic Simulation Subsystem
The traffic model, developed by AVL North America, was engineered to simulate a set of micro-traffic environments. The traffic model possesses the capability to simulate traffic flow through single-lane intersections, multi-lane arterial roads, and limited-access highways. Given that the scope of this study is restricted to operations on limited-access highways, only that specific component of the traffic model was leveraged.
The traffic model controlled the movement of all vehicles and traffic entities like traffic lights within the simulation environment. The traffic model comprises several components listed below:
- Driver Model: This component is based on the Improved Intelligent Driver Model (IIDM) [31]. It controls the vehicle kinematics and longitudinal behavior of all vehicles in the cohort.
- Cohort Manager: This model facilitates the grouping of vehicles into distinct cohorts for travel through intersections and on highways. Its functionalities include cohort tracking, the dynamic adjustment of driver model parameters for cohort members, managing cohort splitting and merging, etc.
- Vehicle and Traffic Light Detectors: These modules track information regarding surrounding vehicles and traffic light states for each simulated vehicle.
- Lane Change Model: This model is required for the successful and collision-free execution of lane change maneuvers.
- Optimizer Models: This module houses the various optimizer models, which we subject to evaluation under different testing conditions.
4.3. The Design of Experiments Configurator
The Design of Experiments configurator facilitated the automation and batch execution of multiple test cases by enabling the systematic modification of various test scenarios and model parameters, including but not limited to the number of vehicles, speed limit, roadway classification, and desired inter-vehicular gaps.
4.4. System of Systems Simulation Environment
The System of Systems (SoS) environment facilitated the co-simulation of all the aforementioned subsystems by time-synchronizing each component and enabling inter-system data communication.
5. Simulation of Cohort Reconfiguration
The simulation environment allowed for the comprehensive and safe simulation of cohort reconfigurations, including transitions from all possible initial vehicle arrangements to all potential final configurations. The primary objective of these simulations was to accurately quantify the energy cost associated with reordering and estimate the powertrain-specific energy consumption by each cohort.
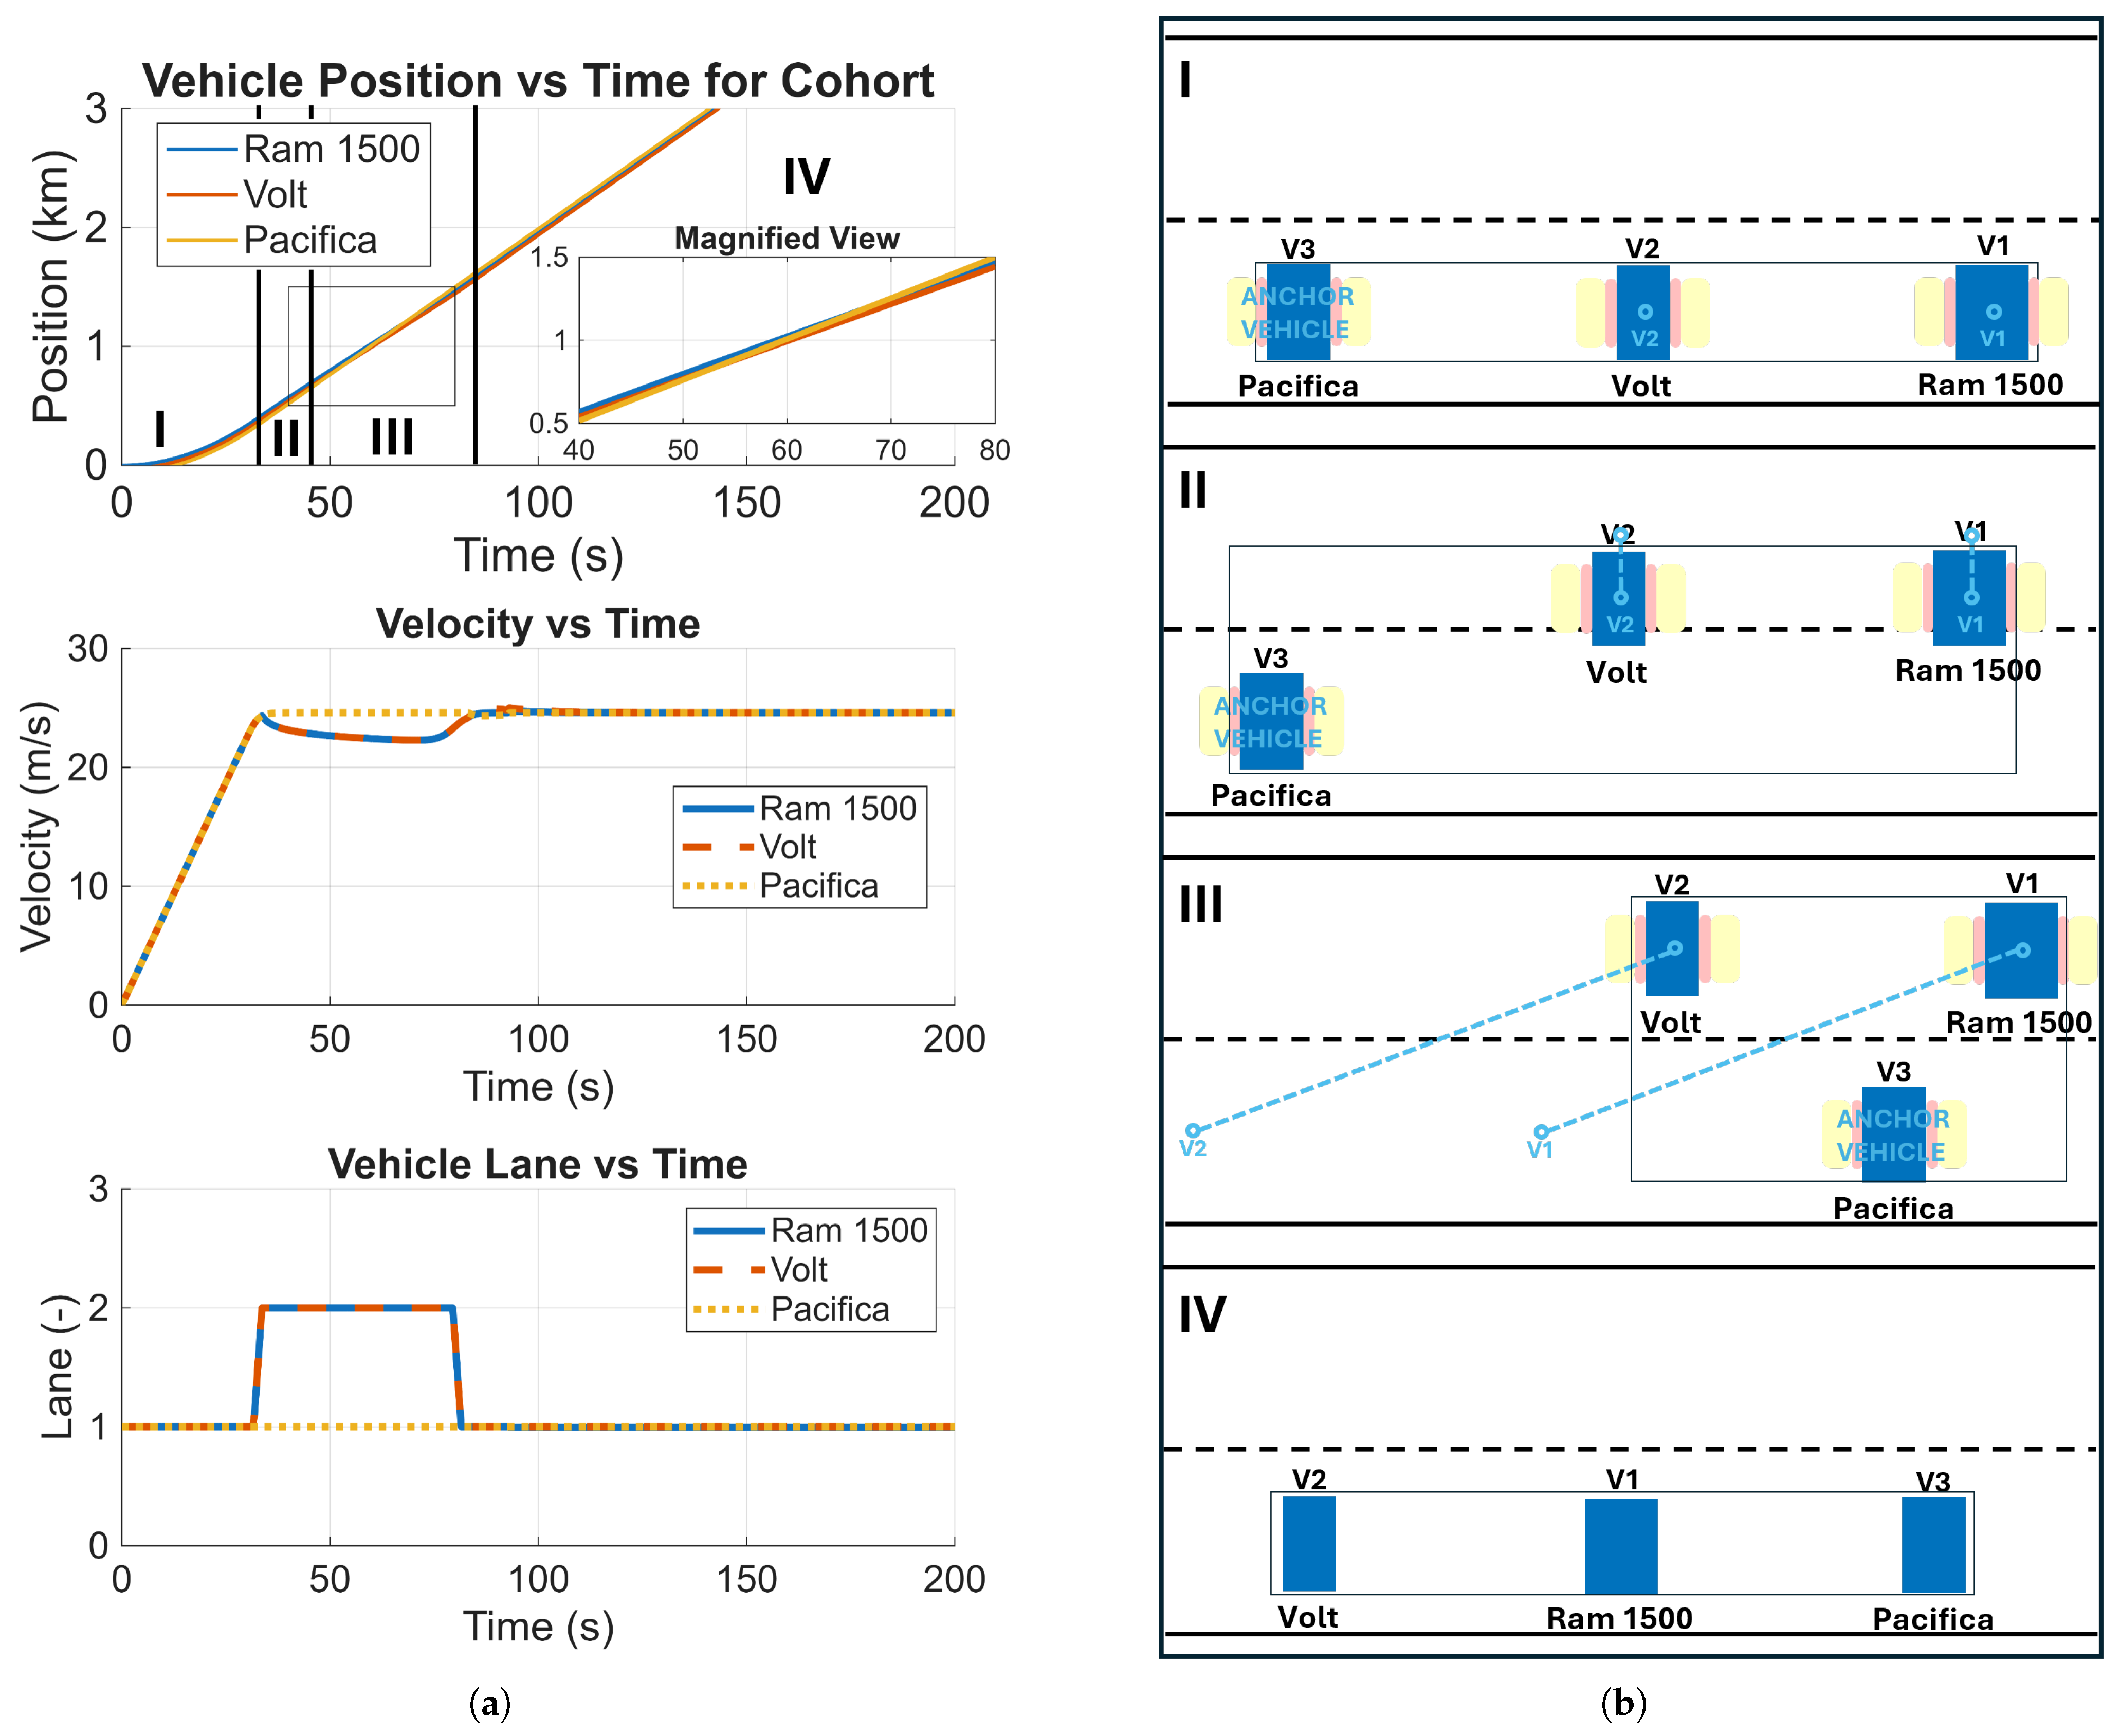
Figure 10a shows the vehicular location vs. time graph along with the velocity and lane occupancy, for a cohort undergoing reconfiguration from Cohort 4 to Cohort 5. Figure 10b provides a schematic illustration of the progression of the reconfiguration process. In the figure, the initial cohort configuration is Ram–Volt–Pacifica (Cohort 4) with the desired final configuration being Pacifica–Ram–Volt (Cohort 5). The highway reordering algorithm in the SoS environment generates a set of intermediate states, derived from the initial and final configurations, through which the simulation must traverse in order to reconfigure the cohort. This series of states is unique for each cohort reconfiguration. The pseudo-code governing the state update and cohort reconfiguration is provided in Algorithm 1. In the example shown in Figure 10, the Pacifica is designated as the anchor vehicle, meaning its velocity remains constant throughout the reconfiguration maneuver. Consequently, the target for the Ram and Volt is to transition to the second lane. All non-anchor vehicles, whose relative positions require adjustment, execute maneuvers relative to this anchor vehicle. Upon completion of this step, new target positions are established for the non-anchor vehicles. This process is visually represented as the cross-over of the Ram and Volt’s location traces with that of Pacifica. Once these vehicles attain their target locations, their target lanes are reset to their original lanes, and they re-merge into those respective lanes. Following the completion of these maneuvers, all non-anchor vehicles accelerate to the speed limit to move as a cohort. Throughout the entire maneuver, secondary safety systems are active to monitor the inter-vehicle gaps and lane boundaries, thereby ensuring collision avoidance.
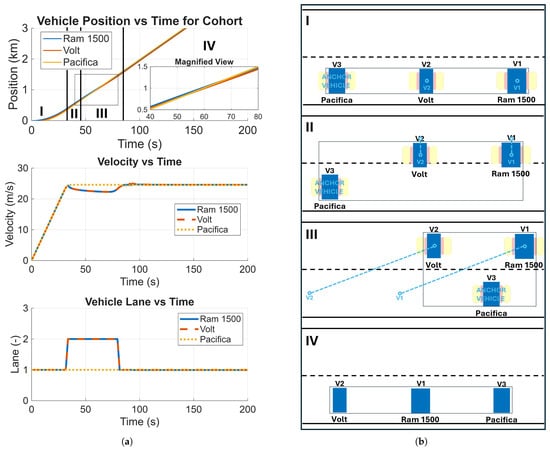
Figure 10.
Data trace and illustration of vehicles in a cohort during reconfiguration (I) Initial vehicle configuration, (II) Lane change at the start of the reconfiguration, (III) Updated target locations for each vehicle, (IV) Final configuration: (a) Cohort reconfiguration data trace. (b) Cohort reconfiguration illustration.
5.1. The Cost of Reconfiguration
Section 3 detailed the potential energy savings achievable through various cohort configurations, considering diverse powertrain operating modes. The energy metrics discussed previously assumed that the vehicles in a particular configuration were already in that configuration to begin with. However, in a more realistic scenario, a set of vehicles traveling in a specific direction will likely begin in a random order. The most reasonable strategy to form a cohort is to retain their relative locations while reducing the inter-vehicular gaps. This initial arrangement, however, may not represent the most optimal configuration for that particular set of vehicles and their respective powertrain operating modes.
In such a scenario, a decision has to be made whether to maintain the initial vehicle order or to reorder the vehicles to a more optimal configuration. Several factors influence this decision process. The primary consideration is the cost–benefit ratio associated with altering the vehicle sequence from its initial state to the desired configuration. The energy cost of reordering primarily stems from the need to accelerate and decelerate vehicles to change its relative position. It is further influenced by which vehicles would need to adjust their speed and whether those vehicles possess regenerative braking capabilities. Conversely, the benefit of this reordering is the energy savings per kilometer achieved due to the reduced aerodynamic drag between the initial and desired optimal order.
Once the reordering cost and the energy difference per kilometer are quantified, the information shared among vehicles can be leveraged to determine how far a cohort combination can be maintained until one of the vehicles has to depart the cohort. Upon establishing the departure point, the energy difference per kilometer can be used to estimate the total energy savings achievable through reordering. If these projected energy savings exceed the cost incurred for reordering, a command can then be transmitted to the vehicles to execute the reconfiguration maneuver:
| Algorithm 1 Cohort reconfiguration update. |
|
Given that coordinating vehicular reordering on public roadways is a high-risk task, the System of Systems (SoS) simulation environment, as detailed in Section 4.4, was used to simulate all permutations of vehicle reorders from every possible initial configuration to every possible final configuration. The reconfiguring process is initiated when the vehicles attain an initial state characterized by the road speed limit, specific relative positions, and a pre-determined desired initial inter-vehicular gap. During the reordering simulation, the vehicles would transition from an initial order through a series of intermediate states to achieve the desired final order. Concurrently, the identical initial vehicle cohort is simulated in parallel without reordering the vehicles to establish a baseline for energy consumption. The reordering process is deemed complete once all vehicles are positioned in the same lane at their target relative positions and exhibit no further change in inter-vehicular gap. Subsequent to the reorder, the vehicles are simulated traversing in their optimal configuration for a preset distance. The difference in energy consumption is quantified using the convention shown in Equation (2). The energy consumed in the unaltered initial cohort configuration is subtracted from the energy consumed in the reconfigured scenario. Consequently, a negative represents energy savings attributable to the reconfiguration, while a positive indicates an increase in energy consumption compared to maintaining the original configuration.
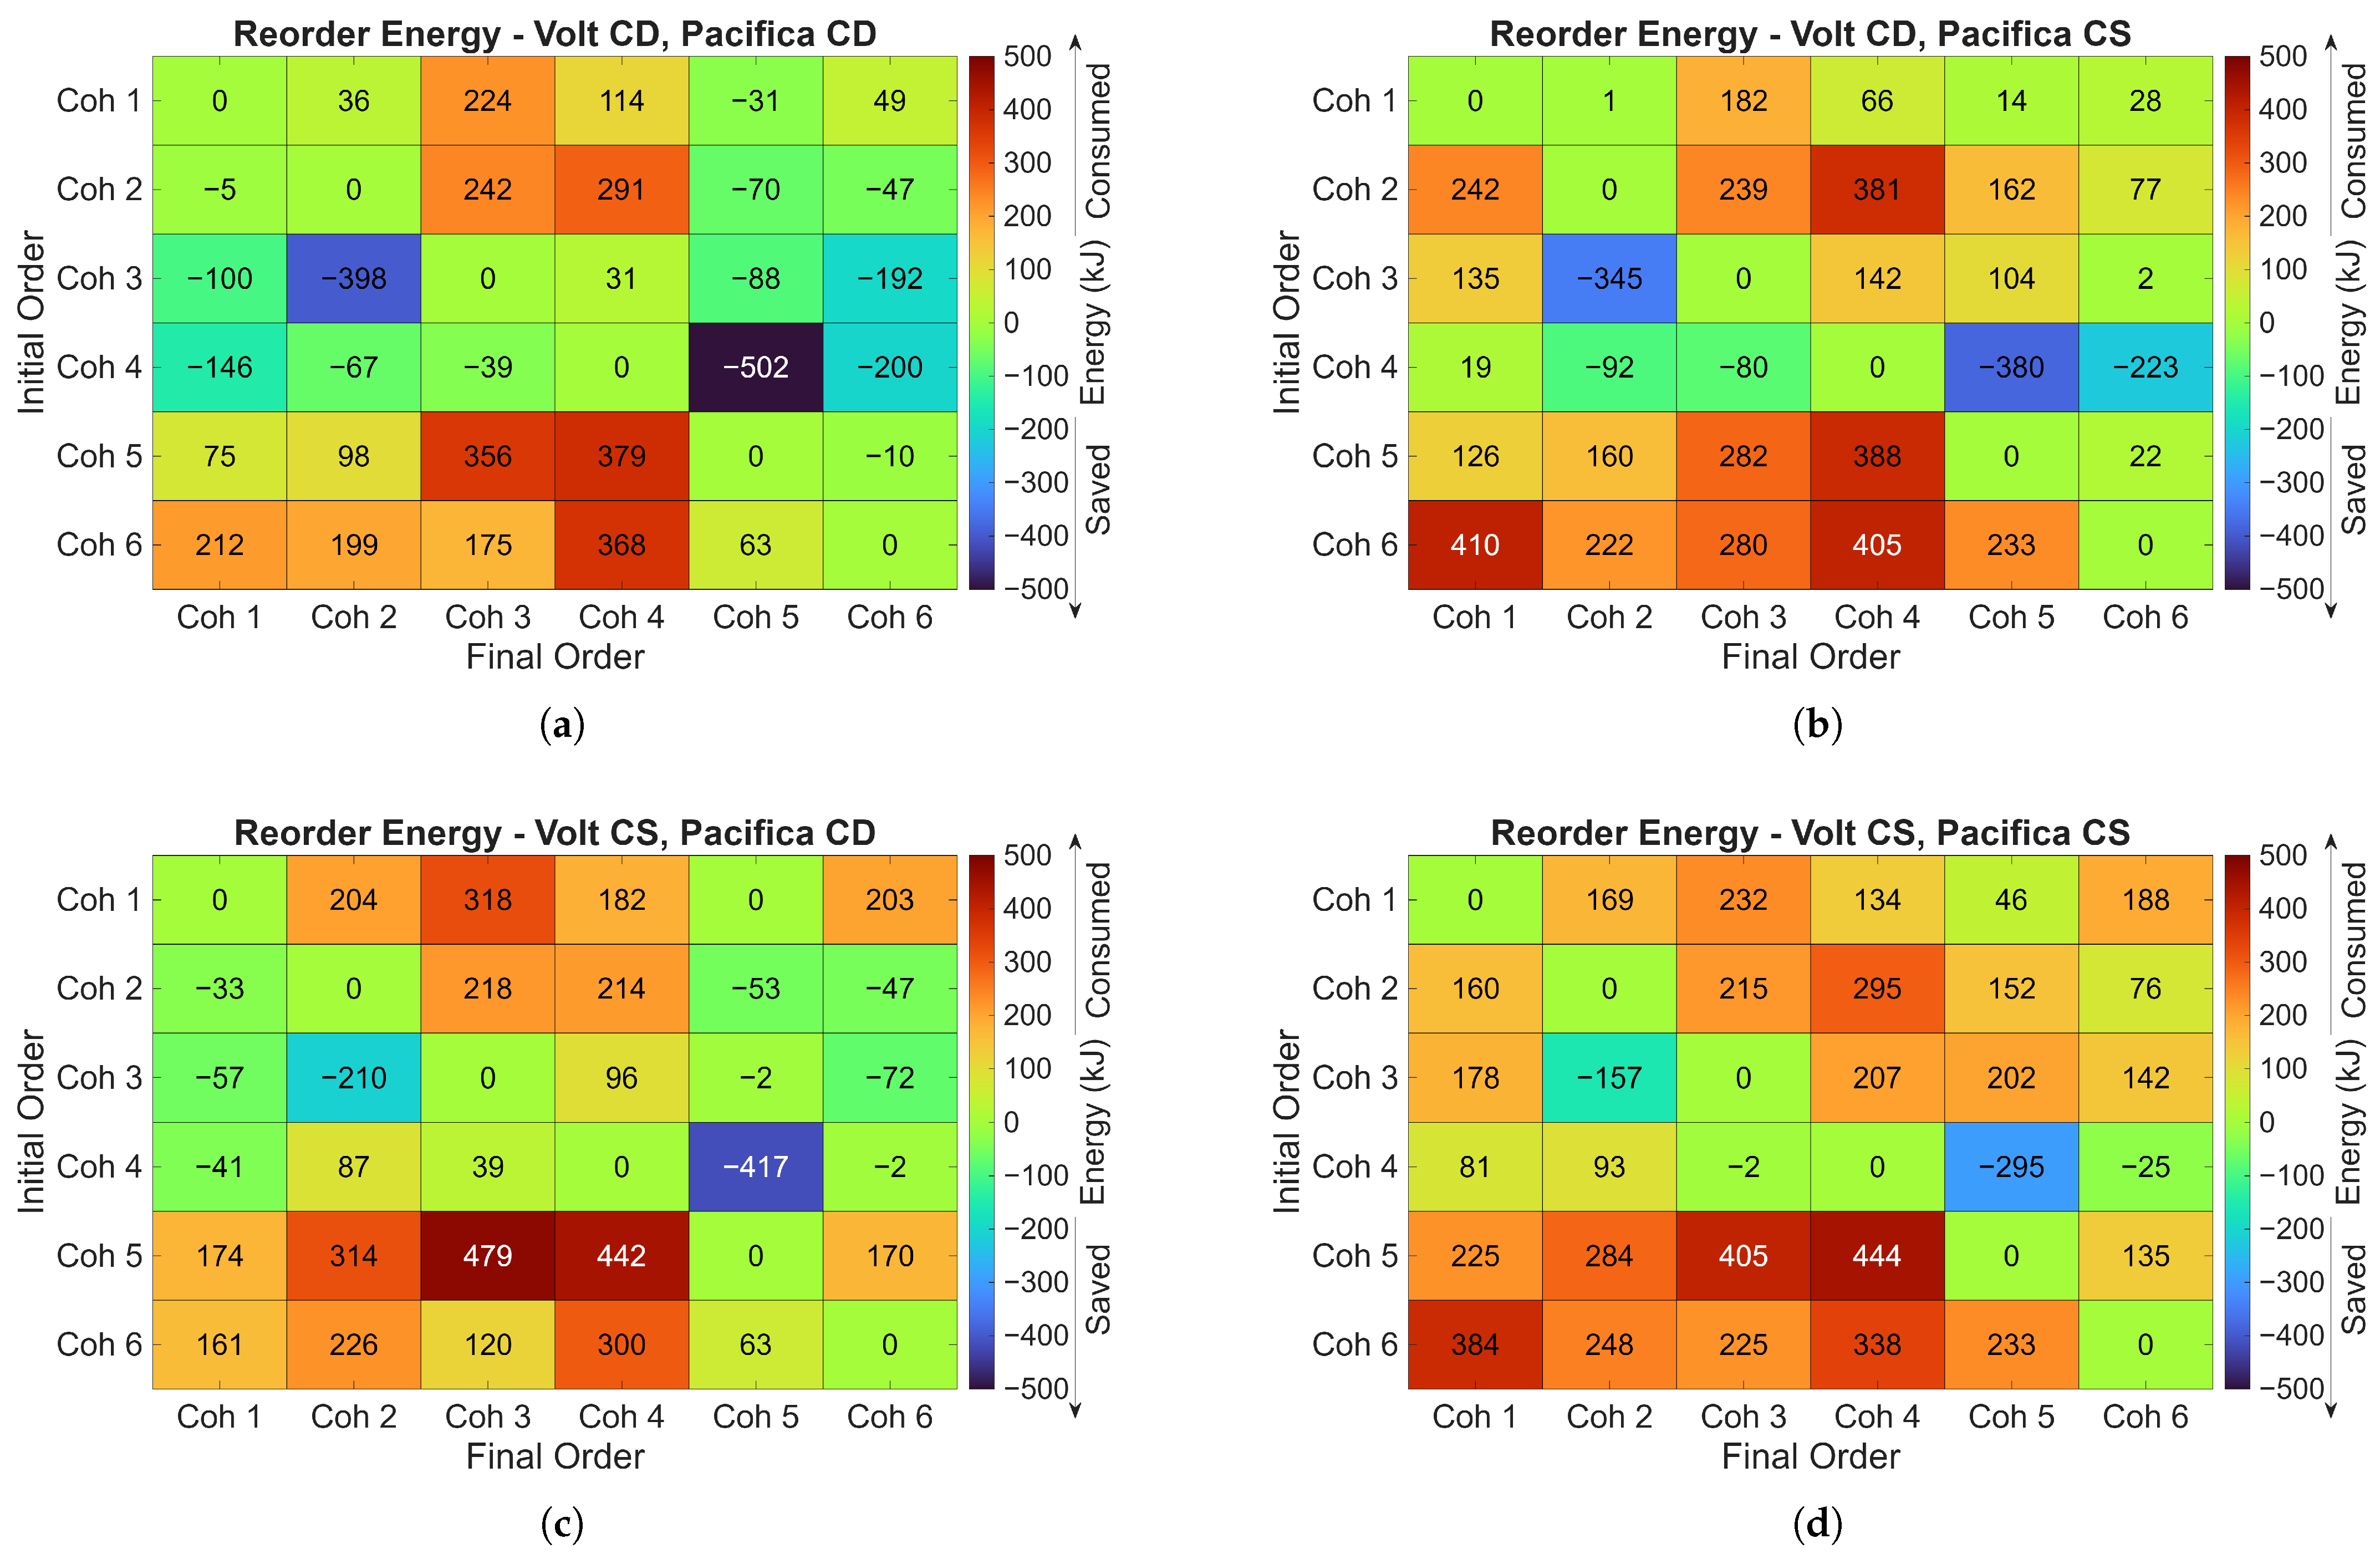
The SoS environment was utilized to simulate these cases across multiple powertrain operating modes of the Volt and Pacifica. The results for each of these vehicle reordering is shown in Figure 11. It was determined that the maximum reordering energy required to transition from any given configuration to any other configuration constitutes less than 0.45% of the cohort’s total energy consumption over a 20 km route.
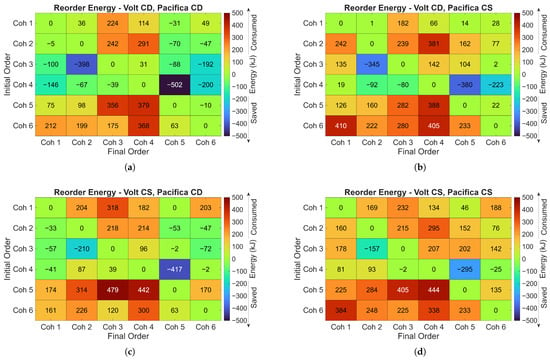
Figure 11.
Energy required for reordering a cohort from one configuration to another for various powertrain operating modes: (a) Volt-CD, Pacifica-CD. (b) Volt-CD, Pacifica-CS. (c) Volt-CS, Pacifica-CD. (d) Volt-CS, Pacifica-CS.
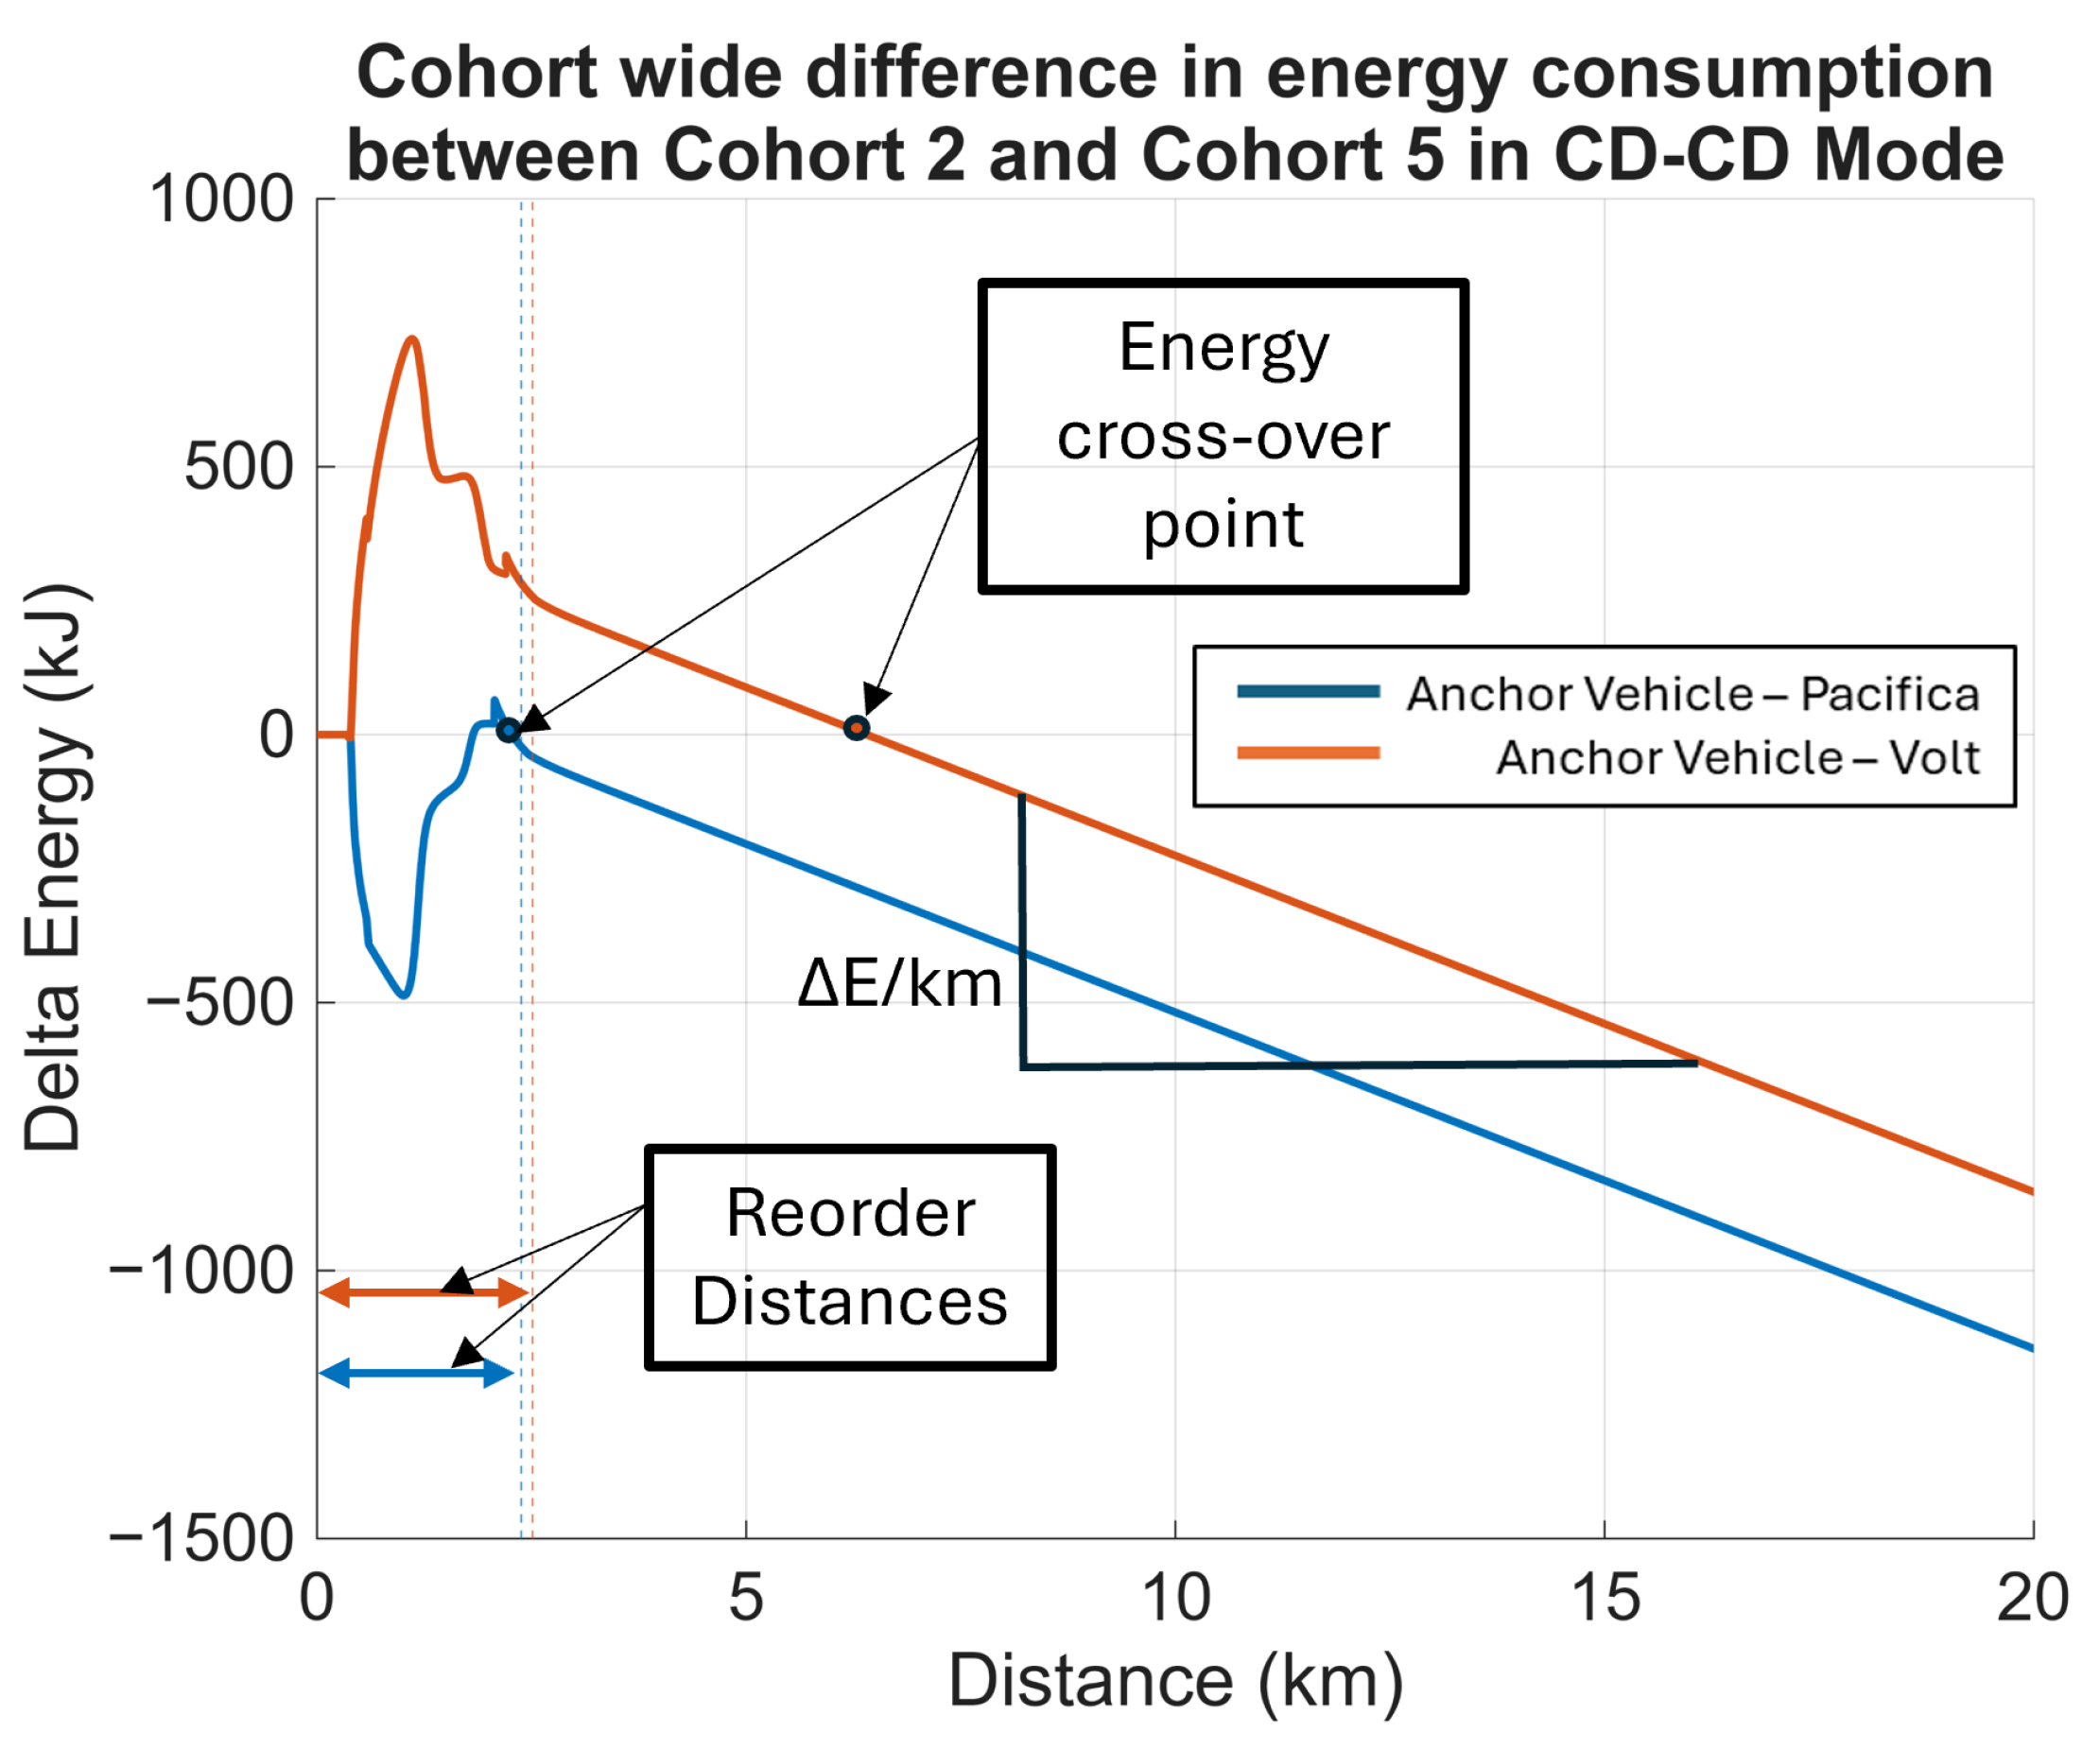
The cost of reordering can also depend on the designated anchor vehicle during the reconfiguration process. Figure 12 shows the progression of energy consumption during a cohort reconfiguration from Cohort 2 to Cohort 5, specifically when two distinct anchor vehicles are used. It is evident from the offset between the two energy traces that the cohort reconfiguration using Volt as an anchor vehicle incurs a higher energy expenditure compared to using Pacifica. This selection of an anchor vehicle is influenced by a combination of factors, including the required change in target relative positions, the mass of the vehicles involved, their respective powertrain operating modes, and their regenerative braking capabilities.
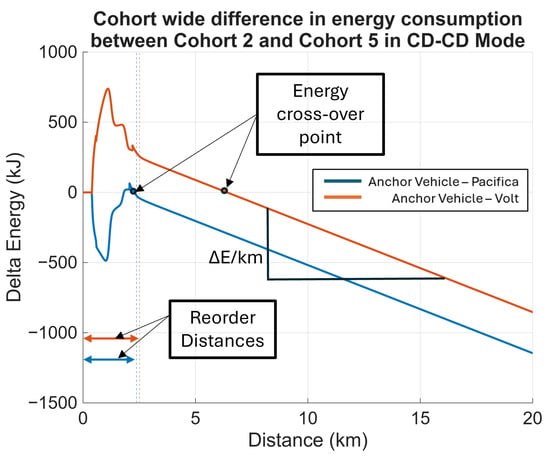
Figure 12.
Progression of energy consumption showing the effect of different anchor vehicles.
5.2. The Benefits of Reconfiguration
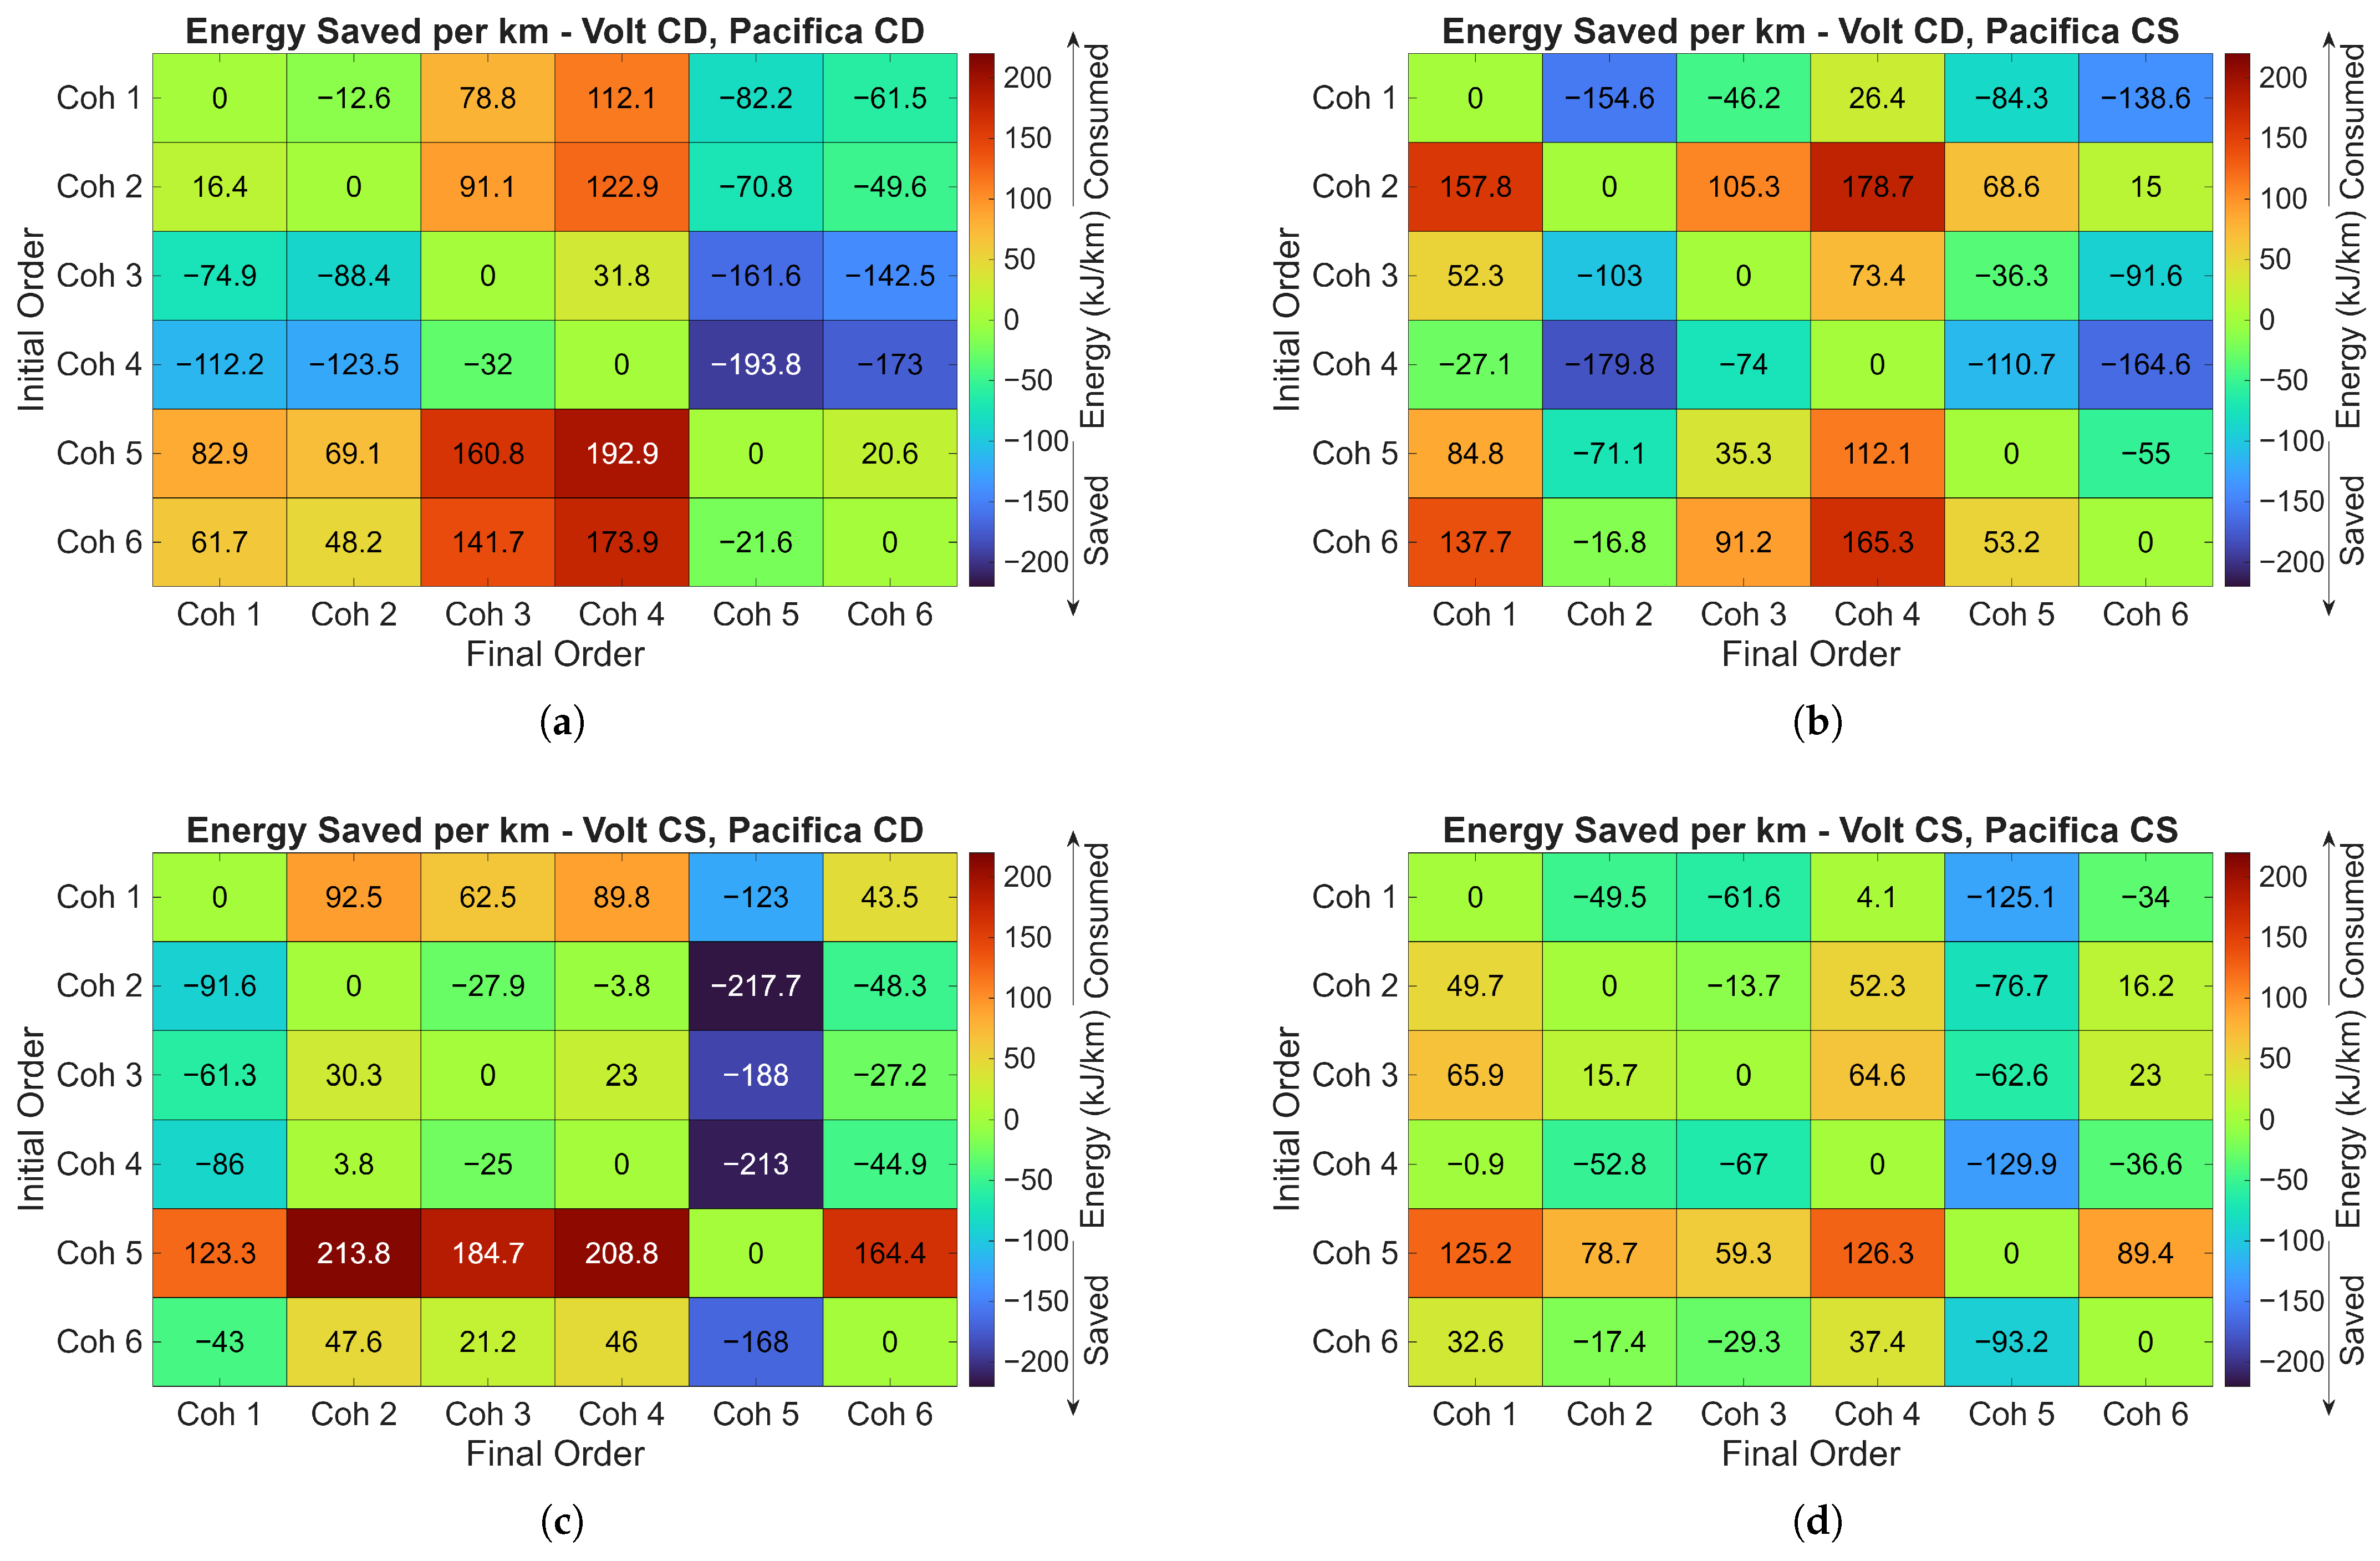
This section discusses the potential benefits that can be achieved through cohort reconfiguration. Figure 13 shows the cohort-wide energy difference per kilometer attainable through reordering. Upon closer examination, it can be seen that, based on the energy estimator used, certain configurations exhibit higher energy efficiency than others.
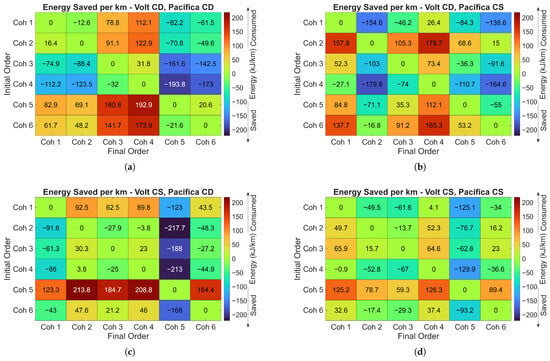
Figure 13.
Energy saved per kilometer after reordering a cohort from one configuration to another for various powertrain operating modes: (a) Volt-CD, Pacifica-CD. (b) Volt-CD, Pacifica-CS. (c) Volt-CS, Pacifica-CD. (d) Volt-CS, Pacifica-CS.
Combining the energy difference per kilometer shown in Figure 13 with the cost to reorder a cohort shown in Figure 11, and incorporating information regarding the vehicle destinations and powertrain operating modes, a strategy can be formulated to yield the maximal cohort-wide energy benefit for a given combination of factors.
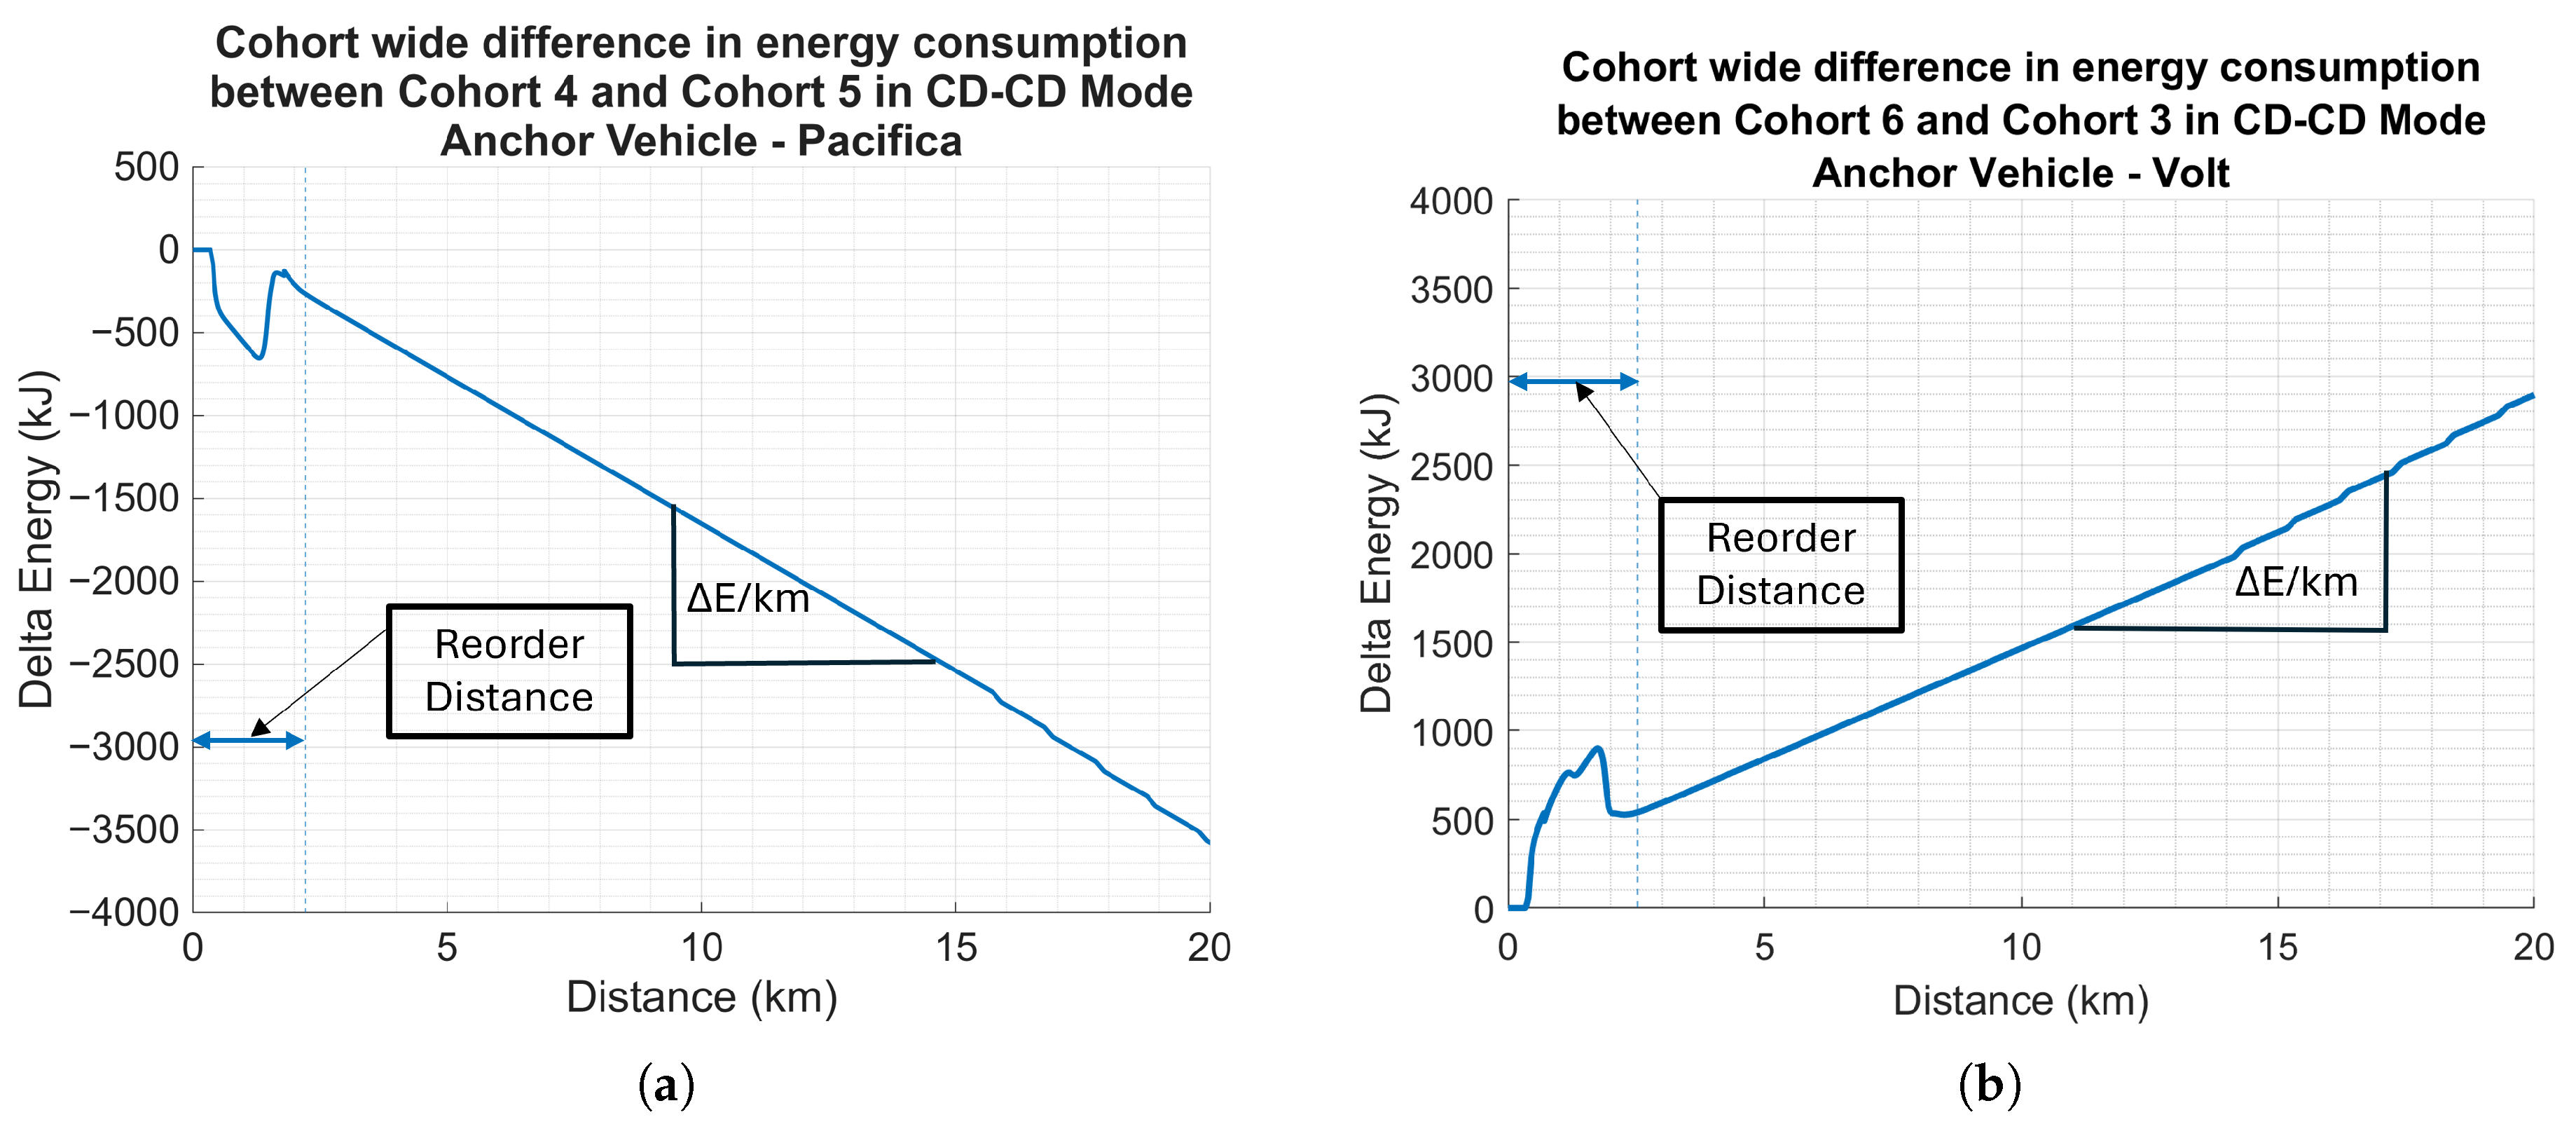
Figure 14 shows a detailed visualization of the energy consumption progression of two distinct cohort reconfigurations. Specifically, Figure 14a shows a reconfiguration from an initial cohort combination of Cohort 4 to Cohort 5 with the Pacifica designated as the anchor vehicle. Conversely, Figure 14b depicts the reconfiguration from Cohort 6 to Cohort 3, utilizing the Volt as the anchor vehicle. These two scenarios represent two extreme cases of the application, in which Cohort 5 is a highly aerodynamically efficient cohort, while Cohort 4 represents an inefficient one, under the condition where the Volt and Pacifica are operating in Charge Depleting (CD) mode. The difference in energy consumption as presented in these figures is quantified using the convention shown in Equation (2).
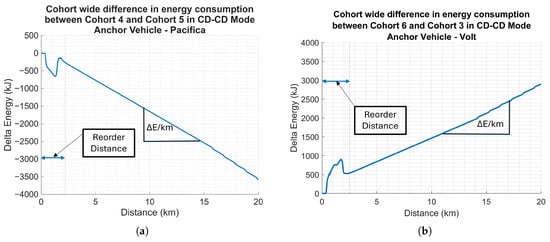
Figure 14.
Two extreme cases showing the difference in the progression of energy consumption while going from one cohort combination to another: (a) Higher energy savings on cohort reorder from 4 to 5. (b) Higher energy consumption on cohort reorder from 5 to 4.
In Figure 14a, Cohort 4 requires approximately 2.2 km to reconfigure into Cohort 5. This reconfiguration is achieved by decelerating the non-anchor vehicles, resulting in a net energy savings evident in the delta energy trace when compared to a baseline scenario where Cohort 4 maintains its initial configuration throughout the highway segment. Upon the non-anchor vehicles reaching their respective relative positions, they re-accelerate up to the speed limit. This re-acceleration is observed as an increase in the delta energy in the latter phase of the reordering process. Once the reordering process is complete, a net savings in energy consumption per kilometer is consistently observed due to Cohort 5’s superior efficiency. This sustained energy benefit is reflected by the slope of the graph beyond the reordering distance.
In Figure 14b, Cohort 6 undergoes reconfiguration into Cohort 3, which represents a comparatively inefficient cohort configuration. Hence, following the reconfiguration, a consistent increase in energy consumption is observed relative to the initial configuration (Cohort 6) as indicated by the positive slope of the graph.
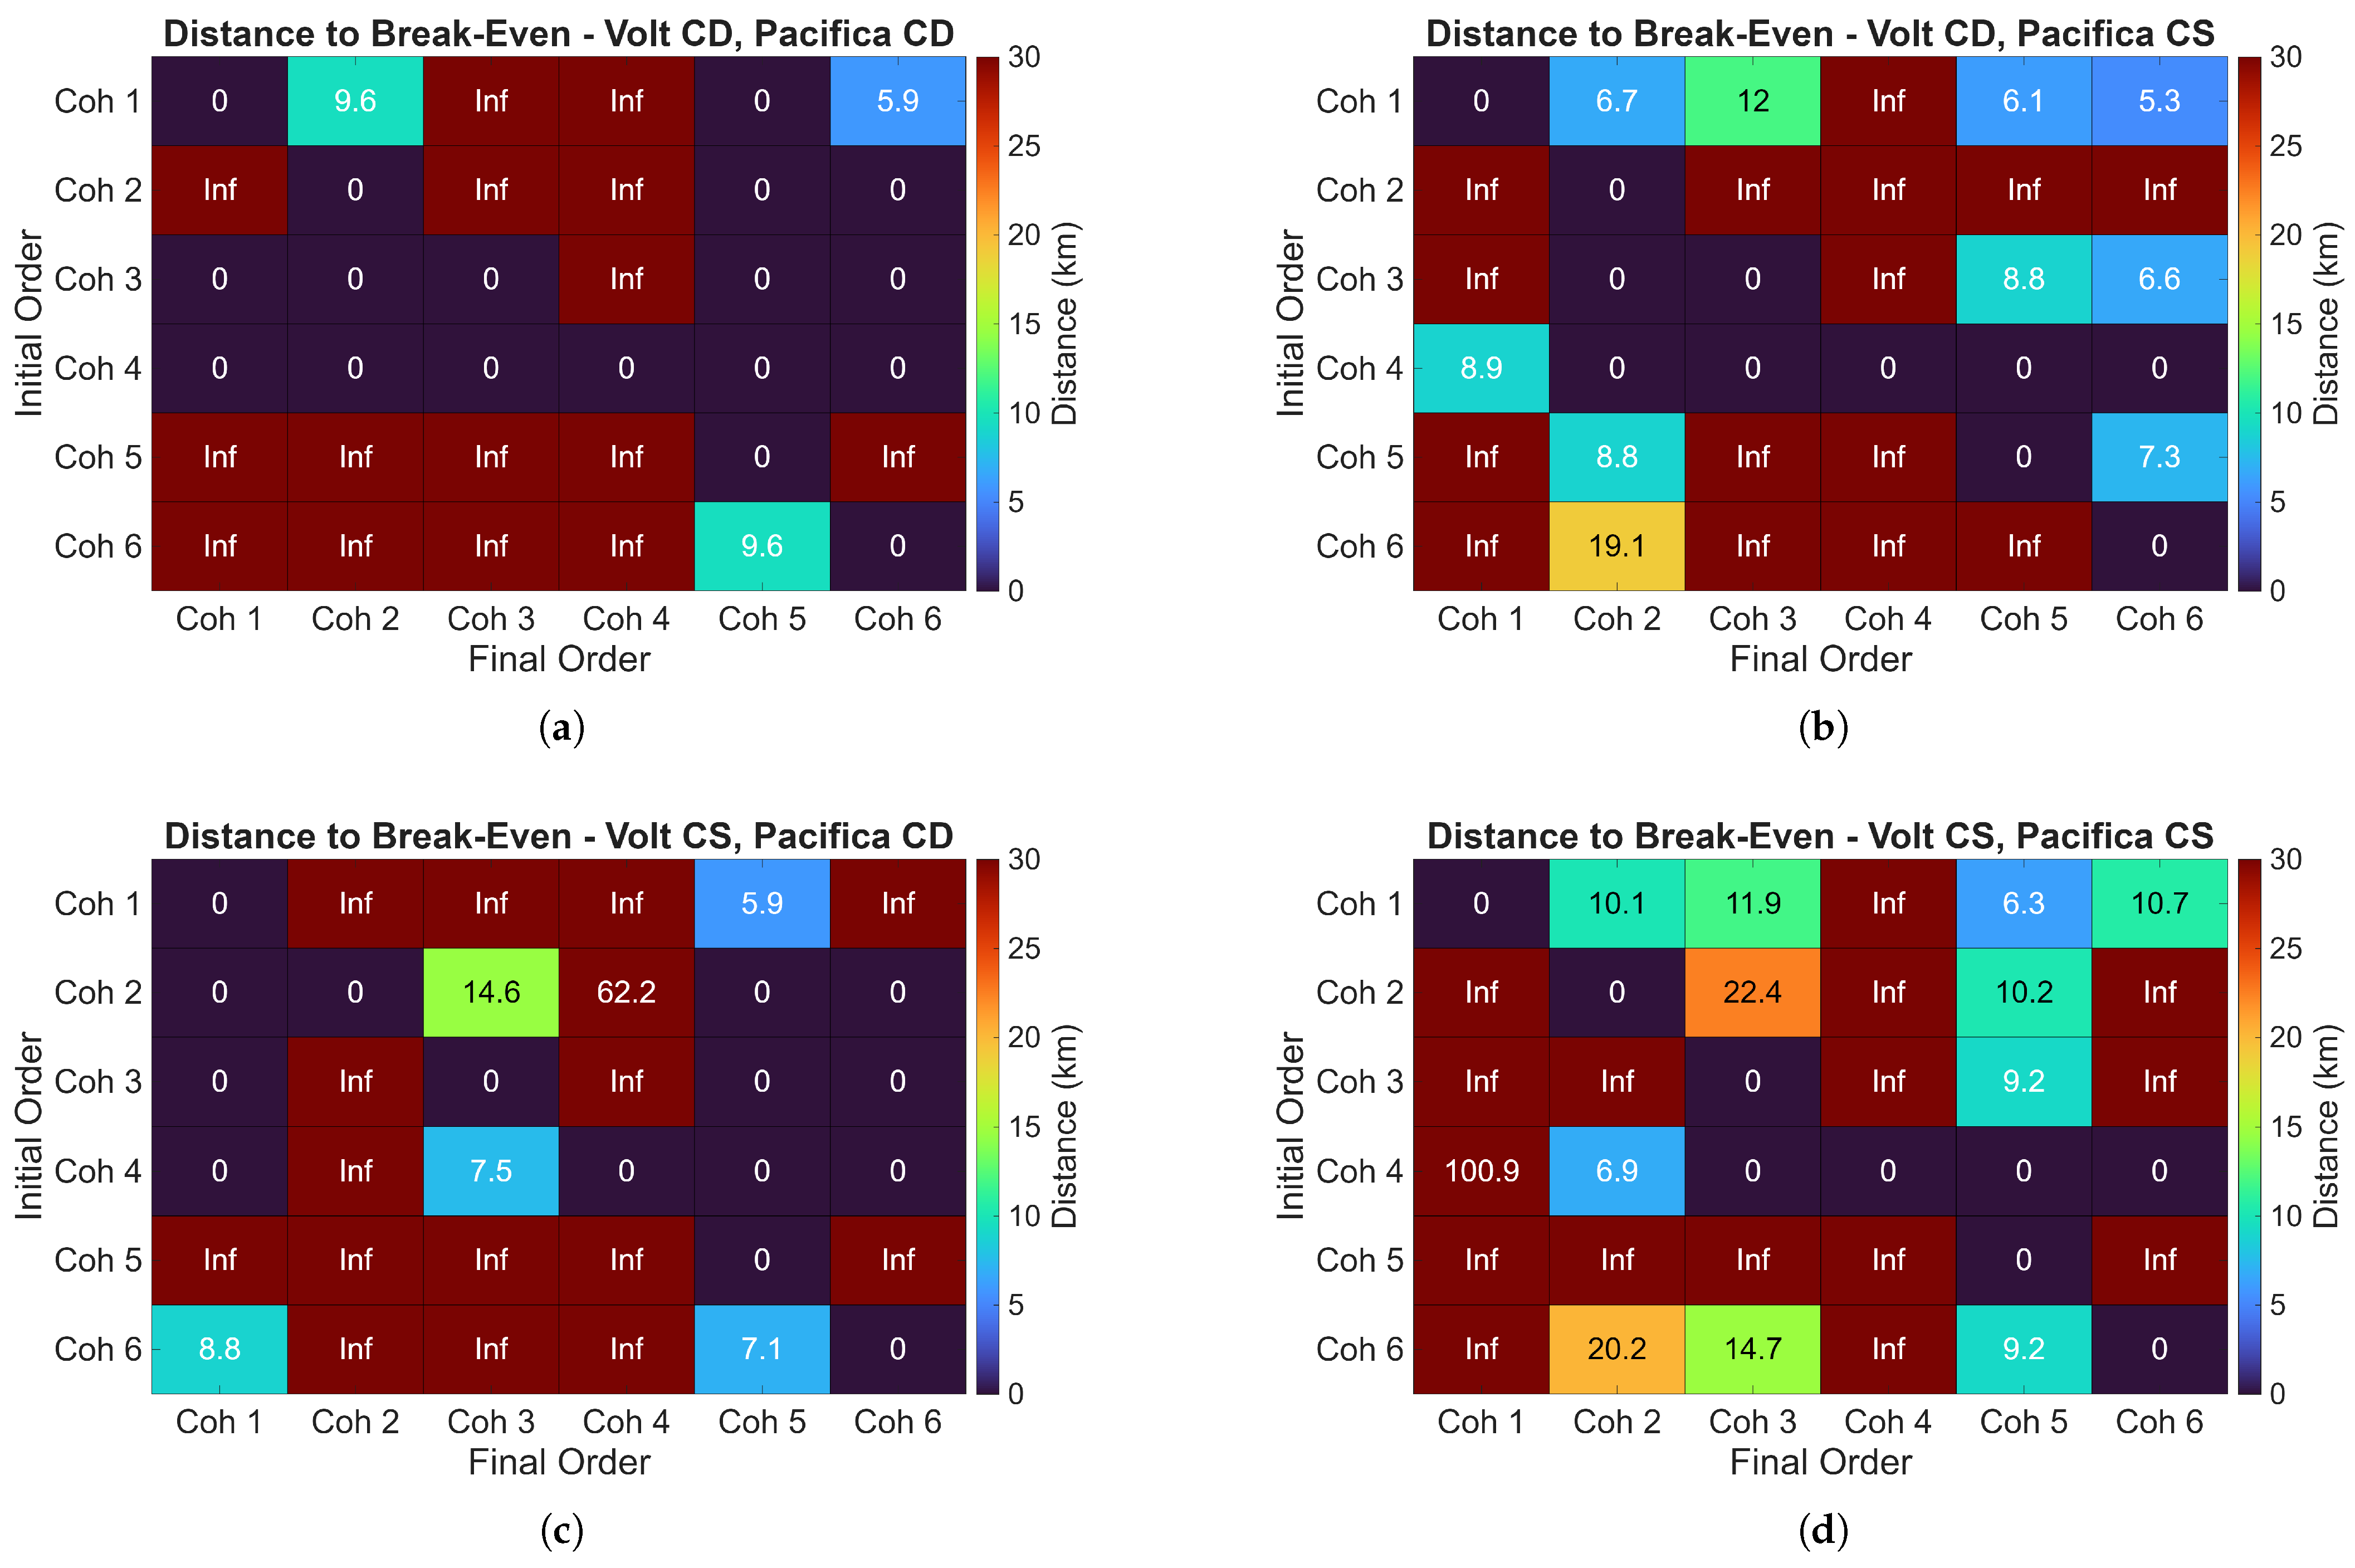
From Figure 12 and the preceding discussion, it is evident that certain cohort reconfigurations consume more energy during the transition process. In such instances, the reconfigured vehicles must maintain their new configuration for a minimum specified distance to yield a net energy savings. This minimum distance is unique to each cohort configuration and powertrain operating mode as illustrated in Figure 15. Each cell in the figure represents the minimum distance a cohort must sustain its target configuration (columns) when originating from a cohort specified in each row. The designation “Inf” indicates reconfigurations where the target configuration exhibits lower energy efficiency compared to the initial configuration and, therefore, can never save energy compared to the initial configuration. Conversely, some reconfigurations result in energy savings even prior to the completion of the reconfiguring process, and these cases are represented by “0” in Figure 15.
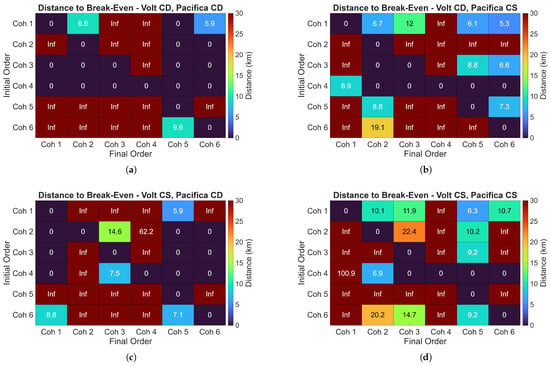
Figure 15.
The minimum distance the cohort has to stay together after reconfiguring in order to save energy compared to the starting configuration: (a) Volt-CD, Pacifica-CD. (b) Volt-CD, Pacifica-CS. (c) Volt-CS, Pacifica-CD. (d) Volt-CS, Pacifica-CS.
6. Reliability of Drag Reduction Estimators
A significant challenge encountered during the development of this work was the absence of a reliable aerodynamic drag reduction estimator model specifically tailored for heterogeneous on-road vehicles that aligned with the on-road test data collected within this study. For this investigation, three major bodies of work were primarily considered: Refs. [10,12,26]. Ref. [10] tried to numerically and experimentally quantify the drag reduction experienced by vehicles in a cohort composed of different vehicle types. To achieve this, they utilized experimental data from homogeneous cohorts to estimate the parameters of a drag reduction model, subsequently extending it to heterogeneous platoons through wake analysis and physics-based solutions.
Ref. [26] employed three-dimensional scaled Computational Fluid Dynamics (CFD) models of various vehicle types to quantify the aerodynamic influence exerted by a leading vehicle and a trailing vehicle on a designated reference vehicle. Subsequently, each vehicle was categorized into distinct bins based on the type of platoon and the vehicle’s position within that platoon. For each such category, a drag reduction formula was proposed enabling the estimation of the modified drag coefficient.
In [12], the author tried to address the scarcity of test data in [10] by conducting on-road tests with three different distinct vehicle types. This particular study utilized a sedan, an SUV, and a truck, traveling together as a platoon on a closed test track. Notably, although a light-duty truck was part of the tests, it was not utilized as a follower due to the absence of an integrated Adaptive Cruise Controller (ACC). The extension of the drag reduction model for the third vehicle, considering both sedans and SUVs, appears promising in our tests.
In the testing scenario pertinent to the current study, a light-duty (LD) truck was part of the data collection, serving as both a leader and a follower. This inclusion was made because LD trucks comprise a large portion of the vehicles found on-road in the US [1]. Unfortunately, none of the drag reduction works reviewed by the authors comprehensively addressed the integration of an LD truck either in the mix at all, or as a follower. To determine which of the aforementioned models best fits the collected test data, all models were evaluated and compared with the experimental data in Figure 6 relative to individual vehicle and cohort energy consumption on the road segment. Model [26] was selected as the most suitable due to its analysis encompassing a wider range of vehicle types, and it provided the least error for the tested cohort permutations. However, developing a more complex and robust drag reduction estimator model is beyond the scope of this study, as the primary goal is to demonstrate the effectiveness of such a model for optimizing vehicle order in a platoon.
7. Methodology for Optimal Cohort Reconfiguration
The cohort reconfiguration methodology begins with an initial cohort vehicle order. Given a cohort comprising n distinct vehicles, a total of unique vehicle configurations can be formed. The method then selects a final cohort configuration from this set of permutations that minimizes the combined energy consumption of all vehicles over a preset travel distance.
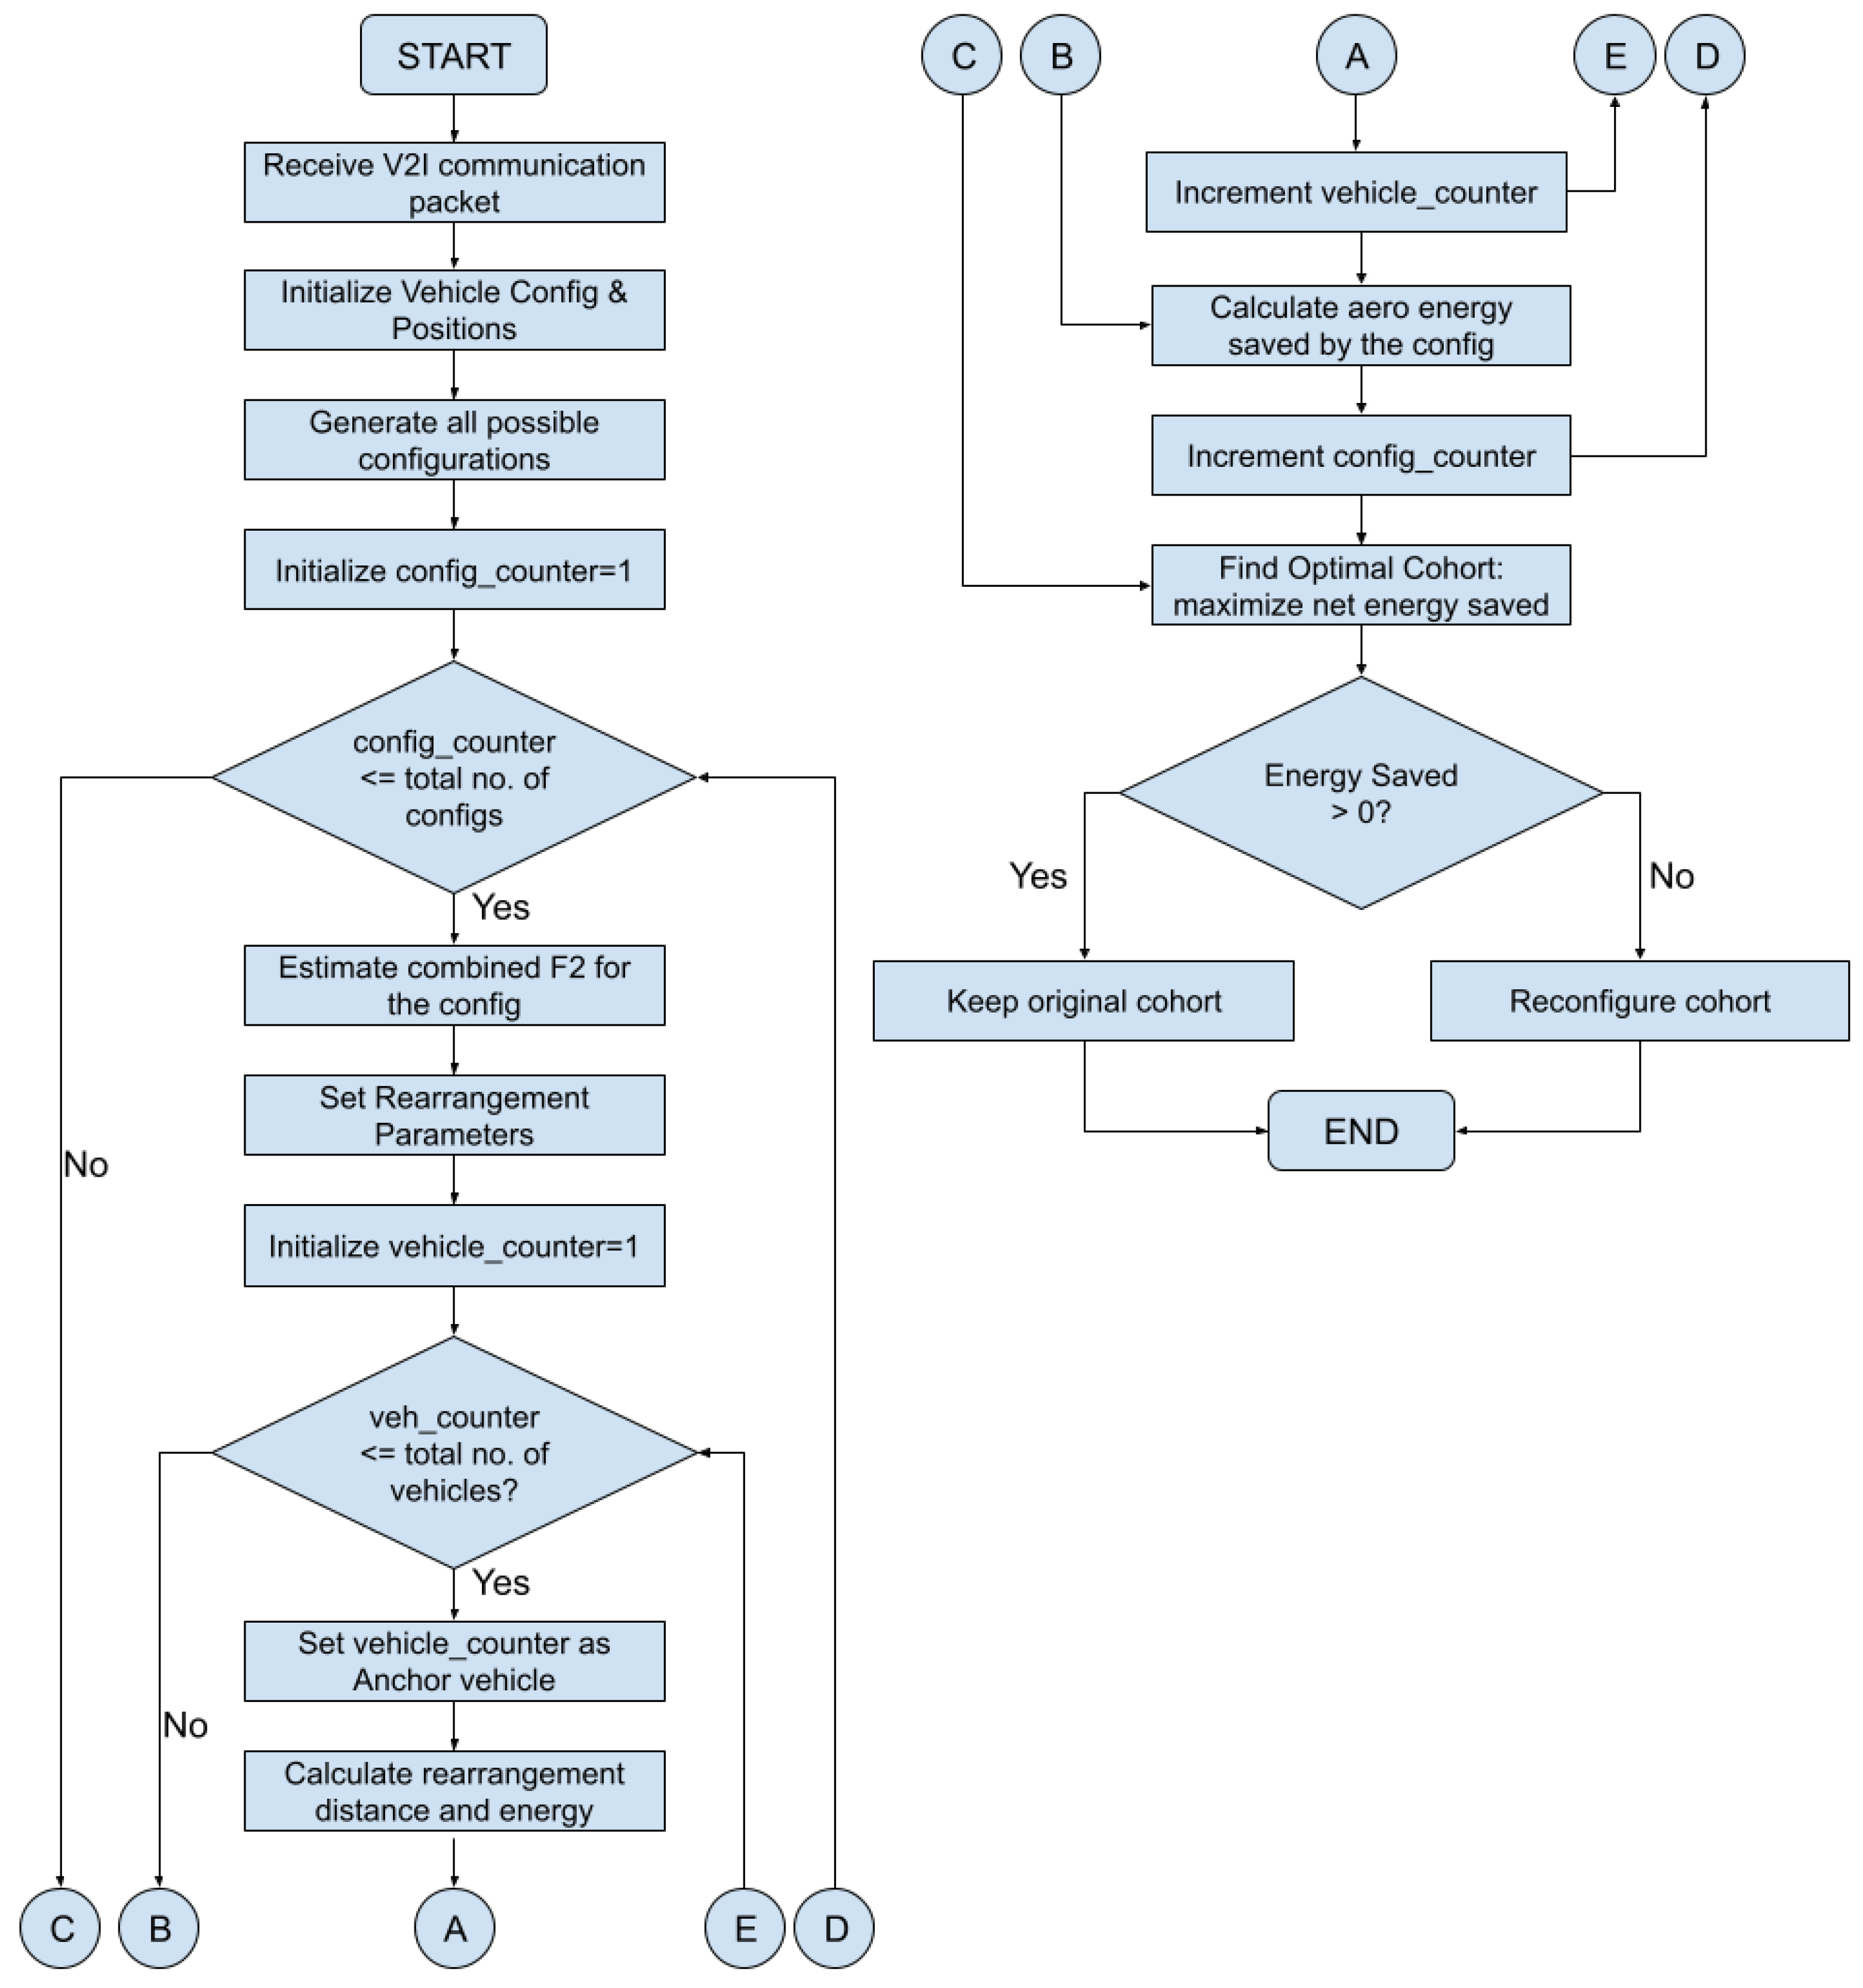
Figure 16 shows the decision logic underlying the selection of an optimal cohort configuration given an initial starting configuration. The optimization process is initiated upon the reception of a set of vehicle-to-infrastructure (V2I) communication packets by a centralized optimizer. From the pool of vehicles on the road, a subset of proximate vehicles can be selected for cohort formation based on shared destination information. Once a group of CAVs is selected, additional information contained in their communicated packets—including powertrain type, vehicle mass, aerodynamic drag coefficients, frontal area and distance to destination—are transmitted to the optimizer. Upon determining the optimal relative positions, the optimizer communicates these targets to the individual vehicle controllers. This enables each vehicle’s autonomous controller to take the necessary actions to achieve its designated position within the platoon. The ability to reliably execute these tasks is well-established, with several autonomous systems already deployed on U.S. roadways.
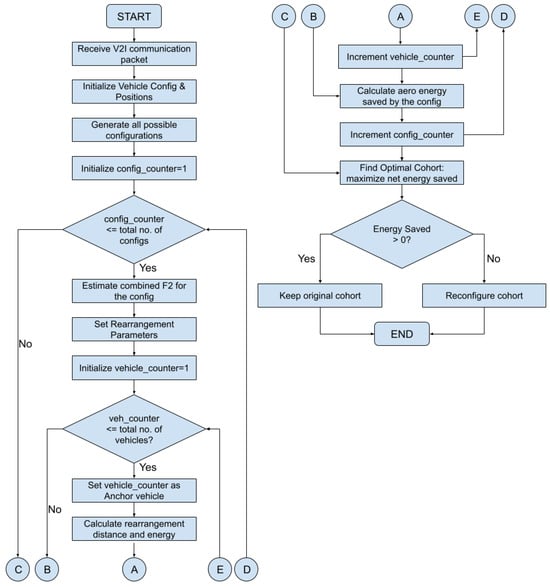
Figure 16.
Flowchart showing the efficient cohort prediction methodology.
7.1. Aerodynamically Efficient Cohort Ranking
After generating a set of possible cohort configurations from the initial arrangement, the optimizer ranks each configuration based on magnitude of energy reduction achievable over the projected travel distance. This can be achieved by leveraging the existing literature that addresses the estimation of the Coefficient of Drag () for vehicles operating within platoons composed of diverse sizes and shapes. Studies providing relatively reliable results in this area are limited [10,12,26]. For the purpose of this study, the article by [26] was selected to serve as our drag reduction estimator because it had the best correlation with our empirical on-road test data. A key advantage of the methodology proposed in this article is the inclusion of the aero-drag reduction estimation model as a standalone dependency, allowing for its relatively easy replacement with alternative estimators. The equations utilized to estimate the aero-drag reduction from [26] are provided as
where is the drag coefficient when the vehicle part of a platoon, , denotes the drag coefficient when the vehicle is operating independently, and is the drag correction factor for vehicles in the platoon. The formula for estimating the drag correction factor is provided by
where , , and denote the drag correction factors for vehicles at the front, rear, and all intermediate positions within the platoon, respectively. is the area of the cross-section of the immediately preceding vehicle, and is the cross-sectional area of the immediately trailing vehicle relative to the reference vehicle. A is the area of the cross-section of the reference vehicle, and x signifies its inter-vehicular gap to the vehicle directly in front.
The resistive forces acting on a vehicle are defined by Equation (1). The product of this force and the cohort’s required travel distance yields the energy consumption component attributable to aerodynamic drag. This value is subsequently multiplied by an equivalency factor, , to account for the energy equivalency stemming from each vehicle’s powertrain type. The energy equivalency factor is explained in Section 7.3.
7.2. Cohort Rearrangement Energy Ranking
Once the energy consumption attributable to aerodynamic drag for each cohort configuration has been estimated, the next step involves quantifying the energy required to rearrange the cohort from its initial configuration. A cohort can achieve a desired configuration through various reconfiguration trajectories. This reconfiguration process can be conceptualized as a change in the relative positional assignments of the vehicles within the cohort. Consequently, the energy required to reconfigure a cohort is equal to the energy required to move the vehicles to their new relative positions. The optimizer simultaneously analyzes multiple reconfiguration paths through matrix calculations to estimate this required energy. For this purpose, an anchor vehicle is designated. The concept of the anchor vehicle is described in Section 5.
The reconfiguration energy can vary depending on the designated anchor vehicle. To alter its position, a non-anchor vehicle traveling at the same speed as the anchor vehicle would need to change lanes followed by either an acceleration or a deceleration phase to attain its target position and subsequently decelerate or accelerate to match the anchor vehicle’s speed. For vehicles equipped with regenerative braking capabilities, a fraction of the kinetic energy required to accelerate can be recouped during the deceleration maneuver. This recoverable energy fraction can be represented as a regenerative efficiency value, which the optimizer can then leverage. To summarize, the total energy expenditure for cohort reconfiguration can be derived as the sum of energy required to accelerate all non-anchor vehicles subtracted by the energy recoverable during braking events. Given that vehicles are only required to alter their speed by a minimal margin (a few meters per second), the steady-state energy consumption for traversing the roadway segment during reconfiguration can be approximated to be the same as that of the initial configuration.
7.3. Effect of Powertrain Operating Modes
To incorporate the effect of powertrain type on energy consumption into the optimizer, an equivalency factor was estimated. This equivalency factor scales the axle energy required for a specific vehicle maneuver, thereby yielding an estimate of the corresponding powertrain energy consumption. For an electric vehicle, this equivalency factor will have a smaller value compared to a powertrain operating in a charge-sustaining mode or during pure internal combustion (IC) engine operation.
For the vehicles used in this study, as part of sister projects, a large dataset was collected on-road in different powertrain operating modes under different driving conditions. Representative examples of this data collection efforts are documented in [13,32,33]. From these datasets, the recorded axle torque and vehicle velocity enabled the estimation of axle energy required for driving under different powertrain modes. Concurrently, a high-voltage battery current and voltage were recorded for electrified powertrains, alongside fuel consumption data for vehicles equipped with IC engines. The powertrain energy equivalency factor for each vehicle is derived as the ratio of its average powertrain energy consumption to its average axle energy consumption across all analyzed driving cycles. Table 2 presents the estimated energy equivalency factors for all vehicles included in this study under different powertrain operating modes.

Table 2.
The energy equivalency factor of test vehicles used to estimate energy consumption in each operating mode.
Once the aerodynamic drag energy consumption and the energy required for cohort reconfiguration from its initial configuration have been estimated, concurrently incorporating the energy equivalency factor, the optimizer can render a decision on whether there is any benefit in reconfiguring the cohort. Since the optimizer can estimate how far the cohort can travel together, coupled with its estimates of the energy consumption for each configuration and the energy expenditure for reconfiguration, it can select a configuration that minimizes cumulative energy consumption over the predicted travel distance.
Consider a trip from Toledo, Ohio to Parsippany, New Jersey, on Interstate 80 in the United States. This 850 km (528-mile) segment of limited-access highway, which is part of a busy corridor that connects Detroit, Michigan to New York, serves as a relevant operational example for the application discussed in this paper. Should the vehicles utilized in this study operate as a cohort in the Cohort 4 configuration, with both Volt and Pacifica in Charge Sustaining mode, the simulation predicts a cumulative energy saving of 329.8 MJ (at 388 kJ/km) for the entire cohort, relative to independent vehicle operation. This translates to 10.4 L (2.75 gallons) of fuel saved over the duration of the trip (assuming E10 gasoline of 0.75 kg/L density [1] and a lower heating value of 42.3 MJ/kg [1]). But if the vehicles were to reconfigure into Cohort 5 instead of maintaining Cohort 4, an additional 3.2 L (0.85 gallons) of fuel could be conserved. It is imperative for the reader to note that this scenario exclusively considers a single cohort comprising three vehicles. The magnitude of these energy savings would proportionally increase with the integration of additional vehicles into the cohort and the formation of a greater number of cohorts.
Another application scenario of this methodology is the proposed 63 km (39 miles) Connected and Automated Vehicle Corridor on Interstate 94 in Michigan [34]. With an estimated average daily vehicle count of 100,000 utilizing the westbound section of I-94, even a modest application of this strategy yields significant benefits. A three-vehicle cohort, similar to the one discussed in this study, making this commute five days a week for the 46 working weeks, annually amounts to approximately 460 commutes. This translates to 28,871 km traversed on the corridor per year. By simply engaging in platooning, such a cohort could conserve at least 353 L of fuel annually. Furthermore, by applying the proposed methodology to optimize the cohort order, these savings could increase to approximately 462 L of fuel per year. This optimized fuel efficiency, in turn, can prevent the emission of up to 1085 kg of CO2 into the atmosphere for just this single three-vehicle platoon [35]. As the penetration of CAVs increases, these individual platoon savings can scale substantially, leading to widespread energy and emissions reductions across the entire transportation network. A consolidated result of the aforementioned scenario is presented in Table 3.

Table 3.
Energy and fuel savings in two platooning scenarios for the discussed three-vehicle platoon.
The presented study was limited to a cohort of three instrumented vehicles, chosen to represent a typical mix of U.S. road vehicles. However, the modular methodology allows for expansion to larger cohorts, including heavy-duty vehicles, provided that reliable drag reduction estimator models are available. The inclusion of heavy-duty vehicles would likely yield greater energy savings for the cohort due to their larger dimensions. This is consistent with the findings of [10,26], which mention that its drag reduction estimator models can be extended to include vehicles of larger dimensions.
8. Conclusions
This research embarked on the development and empirical validation of an optimized vehicular reordering methodology for heterogeneous cohorts operating at a constant velocity on limited-access highways, aimed at reducing energy consumption. On-road vehicle tests demonstrated energy savings of up to 10% reduction in axle energy for optimally configured cohorts compared to independent vehicle operation, in contrast to the 6.6% energy savings observed for a non-optimal cohort configuration under the same scenario.
The study quantified the powertrain-dependent energy consumption characteristics across diverse vehicle configurations, revealing how variations in powertrain operating modes directly influence the optimal cohort arrangement. Furthermore, the in-depth analysis of individual vehicle energy consumption explained the substantial impact of positional assignment within the cohort, particularly highlighting the pronounced benefits for propulsion systems characterized by high road load and specific energy consumption when optimally positioned.
A key contribution of this study is the quantification of both the costs and benefits of reordering. A System of Systems (SoS) simulation environment was instrumental in quantifying the energy costs associated with cohort reconfiguration maneuvers, integrating a micro-traffic model, reduced-order powertrain models, and an adaptable aerodynamic drag reduction estimator. This modular approach ensured the adaptability of the methodology to incorporate future advancements in drag reduction modeling. The investigation underscored that while reconfiguration incurs an energy cost, the net energy savings over a sufficient travel distance can be substantial, with the maximum reordering energy typically representing a negligible fraction (<0.45%) of the total energy consumed over a 20 km route. The choice of anchor vehicle during reconfiguration was also shown to critically influence this energy expenditure. A key challenge identified was the sensitivity of reliable drag reduction estimator models for heterogeneous vehicular cohorts that accurately align with empirical on-road data.
Ultimately, this work presents a comprehensive optimization framework that leverages vehicle-to-infrastructure (V2I) communication to predict the most energy-efficient cohort configuration. By considering initial stochastic arrangements, reconfiguration costs, distance to destination, and diverse powertrain characteristics, the proposed methodology offers a strategy for minimizing cumulative energy consumption in connected and automated vehicle platoons. The widespread market penetration of CAVs is crucial for the broad implementation of such reordering strategies. As CAVs become more prevalent, the ability to form and dynamically reconfigure heterogeneous cohorts will enable the widespread deployment of this methodology, leading to a substantial increase in cumulative energy savings across the transportation network. Future work will explore the integration of Cooperative Adaptive Cruise Control (CACC) to enable closer inter-vehicular following, potentially yielding even greater energy efficiencies, and further efforts will be directed towards mitigating the impact of estimator uncertainties on simulation outcomes.
Author Contributions
Conceptualization, P.S. and D.R.; Formal analysis, P.S.; Funding acquisition, D.R.; Investigation, P.S.; Methodology, P.S. and D.R.; Project administration, D.R.; Resources, D.R.; Software, D.K.; Supervision, D.R., J.N. and J.B.; Validation, P.S.; Visualization, P.S. and D.K.; Writing—original draft, P.S.; Writing—review and editing, D.R., D.K., J.N. and J.B. All authors have read and agreed to the published version of the manuscript.
Funding
This research was partially funded by the U.S. Department of Energy’s Office of Energy Efficiency and Renewable Energy (EERE) under the Vehicle Technologies Office (VTO) award number DE-EE0009209.
Data Availability Statement
The original contributions presented in this study are included in the article. Further inquiries can be directed to the corresponding author.
Acknowledgments
The authors would like to thank Erin Boyd, Daniel Nardozzi, and Danielle Chou at the Department of Energy for their support and guidance. During the preparation of this manuscript, the authors used Gemini 1.5 Pro for the purposes of sentence restructuring and ensuring tone consistency. The authors have reviewed and edited the output and take full responsibility for the content of this publication.
Conflicts of Interest
Author Daniel Knopp was employed by the AVL Mobility Technologies. The remaining authors declare that the research was conducted in the absence of any commercial or financial relationships that could be construed as a potential conflict of interest.
Abbreviations
The following abbreviations are used in this manuscript:
| ACC | Adaptive Cruise Control |
| BPNN | Backpropagation Neural Network |
| CACC | Cooperative Adaptive Cruise Control |
| CAV | Connected and Automated Vehicle |
| CD | Charge Depleting |
| CFD | Computational Fluid Dynamics |
| CO2 | Carbon Dioxide |
| CS | Charge Sustaining |
| DoE | Design of Experiments |
| DOE | U.S. Department of Energy |
| EV | Electric Vehicle |
| GNSS | Global Navigation Satellite System |
| HEV | Hybrid Electric Vehicle |
| ICE | Internal Combustion Engine |
| IIDM | Improved Intelligent Driver Model |
| LD | Light-Duty |
| mHEV | Mild Hybrid Electric Vehicle |
| PHEV | Plug-in Hybrid Electric Vehicle |
| PSO | Particle Swarm Optimization |
| RTK | Real-Time Kinematic |
| SoS | System of Systems |
| V2I | Vehicle-to-Infrastructure |
References
- Davis, S.C.; Boundy, R.G. Transportation Energy Data Book: Edition 39; Technical report; Oak Ridge National Laboratory (ORNL): Oak Ridge, TN, USA, 2021. [Google Scholar]
- Kobayashi, S.; Plotkin, S.; Ribeiro, S.K. Energy efficiency technologies for road vehicles. Energy Effic. 2009, 2, 125–137. [Google Scholar] [CrossRef]
- Martyushev, N.V.; Malozyomov, B.V.; Khalikov, I.H.; Kukartsev, V.A.; Kukartsev, V.V.; Tynchenko, V.S.; Tynchenko, Y.A.; Qi, M. Review of methods for improving the energy efficiency of electrified ground transport by optimizing battery consumption. Energies 2023, 16, 729. [Google Scholar] [CrossRef]
- Zhang, P.; Morris, M.; Doshi, D. Materials development for lowering rolling resistance of tires. Rubber Chem. Technol. 2016, 89, 79–116. [Google Scholar] [CrossRef]
- Hall, D.E.; Moreland, J.C. Fundamentals of rolling resistance. Rubber Chem. Technol. 2001, 74, 525–539. [Google Scholar] [CrossRef]
- Gillespie, T. Fundamentals of Vehicle Dynamics; SAE International: Warrendale, PA, USA, 2021. [Google Scholar]
- Sudin, M.N.; Abdullah, M.A.; Shamsuddin, S.A.; Ramli, F.R.; Tahir, M.M. Review of research on vehicles aerodynamic drag reduction methods. Int. J. Mech. Mechatronics Eng. 2014, 14, 37–47. [Google Scholar]
- Mukut, A.M.I.; Abedin, M.Z. Review on aerodynamic drag reduction of vehicles. Int. J. Eng. Mater. Manuf. 2019, 4, 1–14. [Google Scholar] [CrossRef]
- Bergenhem, C.; Shladover, S.; Coelingh, E.; Englund, C.; Tsugawa, S. Overview of platooning systems. In Proceedings of the 19th ITS World Congress, Vienna, Austria, 22–26 October 2012. [Google Scholar]
- Tadakuma, K.; Doi, T.; Shida, M.; Maeda, K. Prediction formula of aerodynamic drag reduction in multiple-vehicle platooning based on wake analysis and on-road experiments. SAE Int. J. Passeng. Cars-Mech. Syst. 2016, 9, 645–656. [Google Scholar] [CrossRef]
- Pi, D.; Xue, P.; Wang, W.; Xie, B.; Wang, H.; Wang, X.; Yin, G. Automotive platoon energy-saving: A review. Renew. Sustain. Energy Rev. 2023, 179, 113268. [Google Scholar] [CrossRef]
- Duoba, M. Empirical Equations of Changes in Aerodynamic Drag Based on Direct On-Track Road Load Measurements for Multi-Vehicle Platoons. SAE Int. J. Adv. Curr. Pract. Mobil. 2023, 5, 2344–2353. [Google Scholar] [CrossRef]
- Poovalappil, A.; Robare, A.; Schexnaydre, L.; Santhosh, P.; Bahramgiri, M.; Bos, J.P.; Chen, B.; Naber, J.; Robinette, D. On-Road Investigation of Energy Saving Opportunity for Autonomous Light-Duty Vehicles Through Automated Vehicle-Following in Safe Distance Scenarios; Technical report; SAE Technical Paper; SAE International: Warrendale, PA, USA, 2025. [Google Scholar]
- Liang, K.Y.; Mårtensson, J.; Johansson, K.H. Heavy-duty vehicle platoon formation for fuel efficiency. IEEE Trans. Intell. Transp. Syst. 2015, 17, 1051–1061. [Google Scholar] [CrossRef]
- Balador, A.; Bazzi, A.; Hernandez-Jayo, U.; de la Iglesia, I.; Ahmadvand, H. A survey on vehicular communication for cooperative truck platooning application. Veh. Commun. 2022, 35, 100460. [Google Scholar] [CrossRef]
- Burov, M.; Mehr, N.; Smith, S.; Kurzhanskiy, A.; Arcak, M. Platoon formation algorithm for minimizing travel time. In Proceedings of the 2020 IEEE 23rd International Conference on Intelligent Transportation Systems (ITSC), Rhodes, Greece, 20–23 September 2020; pp. 1–6. [Google Scholar]
- Cai, M.; Xu, Q.; Chen, C.; Wang, J.; Li, K.; Wang, J.; Zhu, Q. Formation control for connected and automated vehicles on multi-lane roads: Relative motion planning and conflict resolution. IET Intell. Transp. Syst. 2023, 17, 211–226. [Google Scholar] [CrossRef]
- Feng, S.; Zhang, Y.; Li, S.E.; Cao, Z.; Liu, H.X.; Li, L. String stability for vehicular platoon control: Definitions and analysis methods. Annu. Rev. Control 2019, 47, 81–97. [Google Scholar] [CrossRef]
- El Ganaoui-Mourlan, O.; Camp, S.; Hannagan, T.; Arora, V.; De Neuville, M.; Kousournas, V.A. Path planning for autonomous platoon formation. Sustainability 2021, 13, 4668. [Google Scholar] [CrossRef]
- Liu, X.; Zhao, G.; Masoud, N.; Zhu, Q. Trajectory planning for connected and automated vehicles: Cruising, lane changing, and platooning. arXiv 2020, arXiv:2001.08620. [Google Scholar] [CrossRef]
- Dong, H.; Shi, J.; Zhuang, W.; Li, Z.; Song, Z. Analyzing the impact of mixed vehicle platoon formations on vehicle energy and traffic efficiencies. Appl. Energy 2025, 377, 124448. [Google Scholar] [CrossRef]
- Viadero-Monasterio, F.; Meléndez-Useros, M.; Zhang, H.; Boada, B.L.; Boada, M.J.L. Signalized Traffic Management Optimizing Energy Efficiency Under Driver Preferences for Vehicles with Heterogeneous Powertrains. IEEE Trans. Consum. Electron. 2025, 71, 3454–3464. [Google Scholar] [CrossRef]
- Viadero-Monasterio, F.; Meléndez-Useros, M.; Jiménez-Salas, M.; Boada, B.L. Robust Adaptive Control of Heterogeneous Vehicle Platoons in the Presence of Network Disconnections with a Novel String Stability Guarantee. IEEE Trans. Intell. Veh. 2025; early access. [Google Scholar] [CrossRef]
- Viadero-Monasterio, F.; Meléndez-Useros, M.; Jiménez-Salas, M.; Boada, B.L. Robust adaptive heterogeneous vehicle platoon control based on disturbances estimation and compensation. IEEE Access 2024, 12, 96924–96935. [Google Scholar] [CrossRef]
- Lee, W.J.; Kwag, S.I.; Ko, Y.D. The optimal eco-friendly platoon formation strategy for a heterogeneous fleet of vehicles. Transp. Res. Part D Transp. Environ. 2021, 90, 102664. [Google Scholar] [CrossRef]
- Luo, Q.; Li, J.; Zhang, H. Drag coefficient modeling of heterogeneous connected platooning vehicles via BP neural network and PSO algorithm. Neurocomputing 2022, 484, 117–127. [Google Scholar] [CrossRef]
- Miller, M.A.; Holmes, A.G.; Conlon, B.M.; Savagian, P.J. The GM “Voltec” 4ET50 multi-mode electric transaxle. SAE Int. J. Engines 2011, 4, 1102–1114. [Google Scholar] [CrossRef]
- Pittel, M.; Martin, D. eFlite Dedicated Hybrid Transmission for Chrysler Pacifica; Technical report; SAE Technical Paper; SAE International: Warrendale, PA, USA, 2018. [Google Scholar]
- Robinette, D. Energy Optimization of Light and Heavy-Duty Vehicle Cohorts of Mixed Connectivity, Automation and Propulsion System Capabilities via Meshed V2V-V2I and Expanded Data Sharing (Final Scientific and Technical Report); Technical report; Michigan Technological University: Houghton, MI, USA, 2023. [Google Scholar] [CrossRef]
- Rama, N.; Robinette, D. Computationally Efficient Reduced-Order Powertrain Model of a Multi-Mode Plug-in Hybrid Electric Vehicle for Connected and Automated Vehicles; Technical report; SAE Technical Paper; SAE International: Warrendale, PA, USA, 2019. [Google Scholar]
- Treiber, M.; Kesting, A. Traffic Flow Dynamics: Data, Models and Simulation; Springer: Berlin/Heidelberg, Germany, 2013. [Google Scholar] [CrossRef]
- Robinette, D.; Kostreva, E.; Krisztian, A.; Lackey, A.; Morgan, C.; Orlando, J.; Rama, N. PHEV real world driving cycle energy and fuel and consumption reduction potential for connected and automated vehicles. Soc. Automot. Eng. Tech. Pap. Ser. 2019, 1. [Google Scholar] [CrossRef]
- Santhosh, P.; Robinette, D. Engine on/off Optimization for an xHEV During Charge Sustaining Operation on Real World Driving Routes Using Connectivity Data; Technical report; SAE Technical Paper; SAE International: Warrendale, PA, USA, 2021. [Google Scholar]
- Cavnue. Michigan. Available online: https://www.cavnue.com/michigan (accessed on 9 July 2025).
- U.S. Environmental Protection Agency. Greenhouse Gas Emissions from a Typical Passenger Vehicle. 2023. Available online: https://www.epa.gov/greenvehicles/greenhouse-gas-emissions-typical-passenger-vehicle (accessed on 9 July 2025).
Disclaimer/Publisher’s Note: The statements, opinions and data contained in all publications are solely those of the individual author(s) and contributor(s) and not of MDPI and/or the editor(s). MDPI and/or the editor(s) disclaim responsibility for any injury to people or property resulting from any ideas, methods, instructions or products referred to in the content. |
© 2025 by the authors. Licensee MDPI, Basel, Switzerland. This article is an open access article distributed under the terms and conditions of the Creative Commons Attribution (CC BY) license (https://creativecommons.org/licenses/by/4.0/).

