Abstract
Pyrochlore Bi1.8Mn0.5Ni0.5Ta2O9-Δ (sp.gr. Fd-3m, a = 10.5038(9) Å) was synthesized by the solid-phase reaction method and characterized by vibrational and X-ray spectroscopy. According to scanning electron microscopy, the ceramics are characterized by a porous microstructure formed by randomly oriented oblong grains. The average crystallite size determined by X-ray diffraction is 65 nm. The charge state of transition element cations in the pyrochlore was analyzed by soft X-ray spectroscopy using synchrotron radiation. For mixed pyrochlore, a characteristic shift of Bi4f and Ta4f and Ta5p spectra to the region of lower energies by 0.25 and 0.90 eV is observed compared to the binding energy in Bi2O3 and Ta2O5 oxides. XPS Mn2p spectrum of pyrochlore has an intermediate energy position compared to the binding energy in MnO and Mn2O3, which indicates a mixed charge state of manganese (II, III) cations. Judging by the nature of the Ni2p spectrum of the complex oxide, nickel ions are in the charge state of +(2+ζ). The relative permittivity of the sample in a wide temperature (up to 350 °C) and frequency range (25–106 Hz) does not depend on the frequency and exhibits a constant low value of 25. The minimum value of 4 × 10⁻³ dielectric loss tangent is exhibited by the sample at a frequency of 106 Hz. The activation energy of conductivity is 0.7 eV. The electrical behavior of the sample is modeled by an equivalent circuit containing a Warburg diffusion element.
1. Introduction
Compounds with a pyrochlore-type structure are still of great interest due to a wide range of practically useful properties. Oxide pyrochlores exhibit ferro- and ferrimagnetism, giant magnetoresistance, superconductivity and spin glass state, and are promising as photocatalysts and dielectrics [1,2,3,4,5,6]. The cubic crystal structure of oxide pyrochlores with the general formula A2B2O6O’ allows iso- and heterovalent substitutions of ions in the cationic sublattices of A2O’ and B2O6 and oxygen vacancies in A2O’ [7,8], which makes it possible to significantly vary the chemical composition of pyrochlores and obtain many combinations of compositions with various physicochemical properties. Octahedral cationic positions of the B2O6 sublattice are occupied by relatively small electronegative penta- or tetravalent cations (Ti4+, Nb5+, Ta5+); more electropositive and larger di- or trivalent ions (Bi3+, Ca2+) are distributed in eight-coordinated positions of the A2O sublattice. The doping of pyrochlores with 3d-element cations leads to the formation of mixed pyrochlores, where the dopant atoms are distributed over two cation sublattices in an arbitrary, often reproducible, molar ratio. Cations of transition elements are predominantly distributed in octahedral positions of the B2O6 sublattice due to the size factor (correspondence of the radii of the B and 3d-element cations) and the proximity of polarization properties [9,10,11,12,13]. The mixed distribution of transition element ions over two cation sublattices of pyrochlore arises due to the limited capacity of the octahedral sub-lattice for 3d-element cations. The limited capacity of the B2O6 sublattice is due to the strain of the octahedral framework, due to the placement of heterovalent and incommensurate 3d-element ions in the tantalum (V) sublattice. A feature of bismuth-containing pyrochlores doped with 3d-ions is the partial vacancy of the bismuth sublattice and the distribution of dopants in both cation sublattices of bismuth and tantalum, which is the cause of relaxation processes in ceramics [14,15]. As stated above, bismuth-containing pyrochlores are promising as high-frequency dielectrics. We have not found any information on the dielectric properties of manganese-containing pyrochlores based on bismuth tantalate. Nickel-containing pyrochlore Bi3Ni1.4Ta3O13.4 shows an average permittivity of 44.85 (RT, 105 Hz) [16], and for Bi2NiTa2O9, the permittivity does not exceed 32 at 30 °C and 1 MHz [17]. Replacing some of the nickel (II) ions with magnesium (II) ions leads to a decrease in the permittivity. According to [18], the dielectric permittivity and the dielectric loss tangent are 24–28 (x(Mg) = 0.7–0.3) and 0.002 (RT, 1 MHz) for Bi1.4(Mg1-xNix)0.7Ta1.4O6.3 (x ≤ 0.7) ceramics. New studies of pyrochlores based on bismuth tantalate have shown that multi-element pyrochlores are successfully synthesized in the octahedral sublattice, of which ions of several transition elements can be simultaneously located. In the articles [19,20,21], the possibility of synthesis and the process of phase formation of multi-element pyrochlores based on bismuth tantalate, simultaneously doped with transition element ions in equimolar amounts, were described for the first time. Studies of oxide pyrochlore showed that low-porosity ceramics with moderate values of permittivity and low dielectric losses are formed. As study [20] showed, the relative permittivity of pyrochlore Bi2-1/3Cr1/6Mn1/6Fe1/6Co1/6Ni1/6Cu1/6Zn1/6Ta2O9+Δ is small and equal to 49, and the dielectric losses are low, at 0.004. Despite the growing interest of researchers in multi-element oxide systems, the degree and nature of the interaction of dissimilar ions with each other and their influence on the properties of oxide ceramics as a whole have not been fully clarified. At the same time, many scientists note the prospect of using such materials as photocatalysts and cathodes for alkaline batteries [22,23,24,25]. The presented work shows the possibility of solid-phase synthesis of phase-pure pyrochlore Bi1.8Mn0.5Ni0.5Ta2O9-Δ with an equivalent content of manganese and nickel; based on X-ray spectroscopy data (NEXAFS, XPS), the oxidation states of transition element ions in ceramics were analyzed and their electrical properties were studied. It should be noted that the stoichiometric formula Bi1.8Mn0.5Ni0.5Ta2O9-Δ is formal and in fact reflects a composition Bi1.2(Mn0.3Ni0.3Ta1.3)O7-q close to the traditional pyrochlore A2B2O7.
2. Experimental Part
For solid-phase synthesis of Bi2-xMn0.5Ni0.5Ta2O9-Δ (x = 0; 0.193) samples, stoichiometric amounts of bismuth (III), tantalum (V), manganese (III) and nickel (II) oxides of analytical grade were used. The stoichiometric mixture of oxides was thoroughly homogenized in an agate mortar for one hour, then pressed into disks using a manual plexiglass press (pressure 5 MPa). The samples were successively calcined in four stages at temperatures of 650, 850, 950 and 1050 °C for 15 h at each stage of heat treatment. The temperature regime was selected based on the results of a study of the phase formation of bismuth tantalate-based pyrochlores [17,18,19,20]. After each calcination stage, the sample was thoroughly homogenized and pressed again in the form of disks to ensure tight contact of the ceramic grains. X-ray data were obtained using a Shimadzu 6000 X-ray diffractometer (Tokyo, Japan) (CuKα radiation; 2θ = 10–80°; scanning speed 2.0°/min). Rietveld analysis and calculation of the unit cell parameters were performed in the Topas 5.0 program using the Pawley approach [26]. The background was described by 12 Chebyshev polynomials, and the peak shape was modeled by the Thompson–Cox–Hastings pseudo-Voigt function. The microstructure, local chemical analysis and elemental mapping of the sample surface were studied using scanning electron microscopy and energy-dispersive X-ray spectroscopy (Tescan VEGA 3LMN scanning electron microscope, INCA Energy 450 energy-dispersive spectrometer) (Tescan, Brno, Czech Republic). The crystallite size was calculated using the Scherrer formula: d = Kλ/βcos θ, where d is the average size of coherent scattering regions (domains, crystallites), which can be less than or equal to the grain size; K is the dimensionless particle shape factor (Scherrer constant); λ is the X-ray wavelength; β is the Laue half-height width (in radians and in 2θ units); and θ is the diffraction angle (Bragg angle). The coefficient K can take different values depending on the particle shape. For example, for spherical particles, K is usually taken to be 0.97. The NEXAFS spectroscopy studies were carried out at the NanoPES station of the KISI synchrotron source at the Kurchatov Institute (Moscow). NEXAFS spectra were obtained by total electron yield (TEY) recording with an energy resolution of 0.5 eV and 0.7 eV in the region of the Cr2p and Co2p absorption edges, respectively. An X-ray photoelectron spectroscopy (XPS) study was performed on a Thermo Scientific ESCALAB 250Xi X-ray spectrometer (Thermo Fisher Scientific, East Grinstead, UK). An AlKα X-ray tube (1486.6 eV) was used as a source of ionizing radiation. In the experiments, an ion–electron charge compensation system was used to neutralize the charge of the sample. All peaks were calibrated with respect to the C1s peak at 284.6 eV. The experimental data were processed using the ESCALAB 250 Xi software-V5.35). To study the electrical properties, silver electrodes were applied to the disk ends (1.64 mm thick, 13.55 mm in diameter) on both sides by burning in silver paste at 650 °C for an hour. The measurements were performed using a Z-1000P impedance meter (Minsk, Belarus) (1–106 Hz window) in a wide frequency range of 25 Hz to 20 MHz and a temperature range of 25 to 450 °C. The sample temperature in the measuring cell was monitored using a chromel-alumel thermocouple (temperature measurement accuracy ± 1 °C). The samples were studied by Raman spectroscopy using a high-resolution Ramos M520 Raman microscope (SOL instruments, Minsk, Belarus) in the range of 80–3500 cm−1. A 600 line/mm grating and a 532-nm solid-state laser were used to record the spectra; the spectral recording power was 0.6 mW, and a 50× objective lens of a Nexcope NE910 microscope was used. The spectral and spatial resolutions were about 5 cm−1 and 2 μm, respectively. The spectra were recorded at room temperature. Recording times of up to 60 s were used for ceramic samples and initial oxides without visible damage to their surface or changes in the shape of the spectra. Raman spectra were recorded at different points for each sample.
3. Results and Discussion
3.1. Synthesis and Microstructure, Raman Spectroscopy
According to the X-ray phase analysis, the synthesized sample Bi2Mn0.5Ni0.5Ta2O9+Δ, in addition to the main phase of cubic pyrochlore (Figure S1), contains an impurity phase of bismuth orthotantalate of the triclinic modification β-BiTaO4 (sp. gr. P-1) in an amount of 9.65 mol.% [27,28] (Figure 1). As previously established [20], the formation of bismuth orthotantalate as an impurity phase is associated with the placement of a portion of the doped ions of transition elements in the bismuth (III) position in excess of its maximum capacity. Low-charge cations, the ionic radius of which is significantly greater than the ionic radius of tantalum (V) or preferring tetrahedral coordination, will be distributed into the crystallographic positions of bismuth. In works [20,29], it is shown that a single-phase sample of a given qualitative composition is formed by creating additional vacancies in the bismuth sublattice by an amount proportional to the amount of β-BiTaO4 impurity.
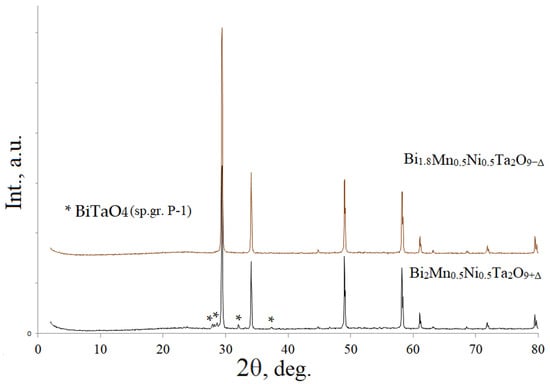
Figure 1.
X-ray powder diffraction patterns of Bi1.8Mn0.5Ni0.5Ta2O9-Δ and Bi2Mn0.5Ni0.5Ta2O9+Δ. *—an impurity phase( BiTaO4).
For our case, based on the calculation of the exact value of the impurity mole fraction of 9.65 mol.% β-BiTaO4, the defective bismuth composition of the single-phase ceramics Bi2-xMn0.5Ni0.5Ta2O9-Δ was calculated at x = 0.191 or ~0.2. The solid-phase synthesis of the Bi1.8Mn0.5Ni0.5Ta2O9-Δ samples was carried out under the same conditions as for Bi2Mn0.5Ni0.5Ta2O9+Δ and was described in the experiment. The diffraction patterns of the samples are shown in Figure 1 for comparison. As shown by the full-profile Rietveld analysis (Figure 2), the synthesized sample Bi1.8Mn0.5Ni0.5Ta2O9-Δ is single-phase. Taking into account that the previously synthesized Bi2NiTa2O9 composition is single-phase [17], the impurity content may be due to the distribution of part of the manganese ions in the bismuth sublattice, given that the radius of manganese (II) ions is larger than the ionic radii of nickel (II) and tantalum (V) (R(Ni(II))c.n-6 = 0.69 Å, R(Mn(II))c.n-6 = 0.83 Å, R(Ta(V))c.n-6 = 0.64 Å) [30]. In addition, the synthesis of the solid solution Bi2MnxMg1-xTa2O9 showed [31] that the amount of bismuth orthotantalate impurity increases with an increase in the proportion of manganese in the solid solutions (from 7.9 (x(Mn) = 0.3) to 23.8 mol. % (x(Mn) = 0.7)), which indirectly indicates the distribution of manganese cations in the bismuth sublattice.
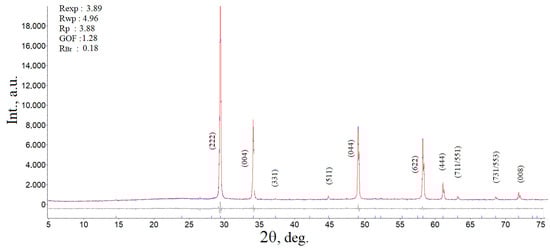
Figure 2.
Experimental and different X-ray powder diffraction patterns of Bi1.8Mn0.5Ni0.5Ta2O9-Δ (refinement X-ray parameters are shown on the left).
As a result of calculating the unit cell parameter of pyrochlore Bi1.8Mn0.5Ni0.5Ta2O9-Δ, a value of 10.5038(9) Å was obtained, comparable with the cell parameters for the pyrochlore phase in the Bi2MgxMn1-xTa2O9.5-Δ and Bi2ZnxMn1-xTa2O9.5-Δ samples [31], which vary from 10.5248(8)/10.5325(5) (x(Mn) = 0.3) to 10.4970(8)/10.4895(5) Å (x(Mn) = 0.7), respectively. From the literature [12], the unit cell parameter a = 10.478 Å is known for niobium pyrochlore Bi1.6Mn1.2Nb1.2O7, which is comparable with our calculation. In [32], a calculation was performed for the pyrochlore phase in samples of the compositions Bi2Mn0.5Nb2.5O9+y (a = 10.438(3) Å), Bi2MnNb2O9+y (10.421(4) Å), Bi2Mn2NbO9+y (10.451(6) Å); smaller values of the unit cell constant may be associated with a mismatch in the stoichiometry of the compounds. The calculated value of the unit cell parameter is significantly smaller than the value of the cell constant for nickel-containing pyrochlores Bi2NiTa2O9 a = 10.5343 Å [17], Bi1.667Ni0.75Nb1.5O7.0 a = 10.5440 Å [13] and solid solutions Bi1.4(Mg1–xNix)0.7Ta1.4O6.3 (x = 0.3, 0.5, 0.7) a = 10.5319(1)–10.5391(1) Å (with decreasing index x) [18]. Elemental mapping of the Bi1.8Mn0.5Ni0.5Ta2O9-Δ sample showed a uniform distribution of element atoms over the sample surface (Figure 3), and the EMF analysis confirmed that the experimental composition of the sample corresponded to the specified one. According to the EDS spectrum, the chemical composition of the sample corresponds to the formula Bi1.82Mn0.49Ni0.51Ta2O9-Δ and the theoretically specified nominal composition.
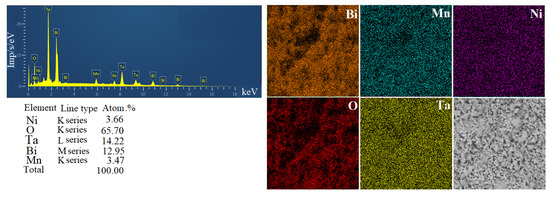
Figure 3.
EDS spectrum and elemental maps of the Bi1.8Mn0.5Ni0.5Ta2O9-Δ sample.
Microphotographs of the surface of the sample synthesized at a temperature of 1050 ○C are shown in Figure 4. The porous, loose microstructure is formed by partially intergrown grains. Individual small crystallites and large agglomerates up to 8 μm are recorded as a result of grain intergrowth. The average crystallite size, determined by X-ray diffraction using the Scherers formula, is ~65 nm, while larger crystallites in the range of 0.5–2 μm were recorded using a scanning electron microscope (SEM).
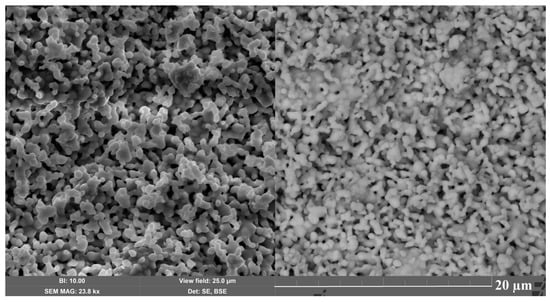
Figure 4.
Microphotograph of the Bi1.8Mn0.5Ni0.5Ta2O9-Δ surface in the secondary and elastically reflected electron mode.
Evidently, the crystallites in the micrographs are aggregated grains of ceramics of significantly smaller pyrochlore; they have almost the same crystallite size and the nature of their packing in the ceramics. According to [17], the microstructure of nickel pyrochlore Bi2NiTa2O9 is porous and granular, and is formed by rounded crystallites with an average longitudinal size varying in the range of 0.5–2 μm according to SEM. The grain size calculated by the Scherrer formula is ∼49 nm. Evidently, manganese ions in the pyrochlore do not have a sintering effect on the microstructure of the ceramics.
The Raman spectroscopy method confirmed the formation of a phase-pure sample with a pyrochlore structure. Figure 5 shows the Raman spectra of Bi1.8Mn0.5Ni0.5Ta2O9-Δ in the range of 0–1400 cm−1 at three arbitrary points of the sample. As Figure 5 shows, all the spectra are identical, indicating the same phase composition of the preparations. The appearance of the spectra themselves and their main peaks are generally characteristic of the pyrochlore structure, which means that the synthesis of pyrochlore was successful, and the sample is homogeneous in phase composition.
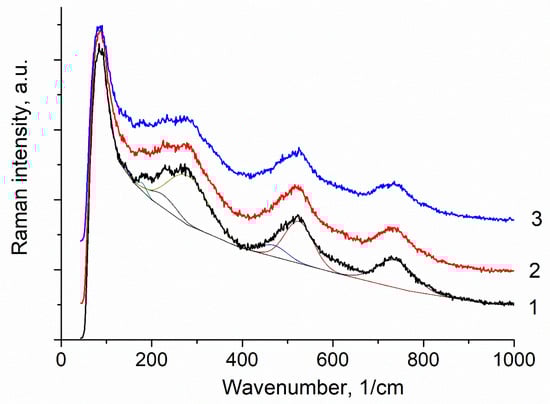
Figure 5.
Raman spectra at three arbitrary points (1–3) of Bi1.8Mn0.5Ni0.5Ta2O9-Δ ceramics synthesized at a temperature of 1050 °C.
The face-centered cubic structure of pyrochlores consists of two independent and interpenetrating sublattices: B2O6 and A2O’. The cationic sublattice of B2O6 is formed by octahedra [BO6] connected at the corner. The sublattice of A2O’ has an anticristobalite structure formed by tetrahedra [O’A4]. Group-theoretical analysis for the ideal pyrochlore structure indicates the existence of 25 vibrational modes [33,34,35,36,37,38,39,40,41,42,43], as shown below:
Г = A1g (R) + Eg (R) + 4F2g (R) + 7F1u (IR) + 4F2u + 2F1g + 3A2u + 3Eu
Among all 25 optical modes, only 6 (A1g, Eg and 4F2g) are Raman-active (R) and include vibrations of oxygen atoms. Vibrations of A and B cations and oxygen ions are observed in the IR spectrum. Structural disordering of the pyrochlore crystal lattice leads to a decrease in the positional symmetry of the A and O’ atoms [35]. As a result of the weakening of the selection rules, new bands appear in the Raman spectra due to the splitting of optical modes, as well as bands active in the IR spectra. A change in the size and mass of the transition metal in the A and B positions changes the force constants for the A-O, A-O’ and B-O vibrational modes and leads to the observed shifts of the bands in the Raman spectra [34]. Identification of the vibrational modes and their symmetry was made on the basis of an analysis of literary data [33,34,35,36,37,38,39,40,41,42,43]. In the Raman spectra of ideal pyrochlores, the Raman bands lie in the region above 200 cm−1 [41,43]. In this regard, the bands below 200 cm−1 are attributed to the F1u modes active in the IR spectra, the appearance of which is associated with the disordering of the crystal lattice of pyrochlores [40,42]. The vibrations of oxygen ions associated with heavy bismuth cations lie in this frequency range [36,42]. In the Raman spectrum, in the region up to 200 cm−1, intense bands appear at 135–136 cm−1 (O-Bi-O’, F1u) and 168–175 cm−1 (Bi-BO6, F1u) (Figure 5, Table 1). In the region of 200–400 cm−1, in particular, weak intensity at 221–223 cm−1 and 265–267 cm−1 vibrations are associated with F2g and Eg + F2g modes, respectively [41]. In the same frequency range, IR-active modes at 290 cm−1 (O-B-O, Fu1) can appear. Vibrations in the range of 400–700 cm−1 are usually attributed to [BO6] octahedra. A wide composite band near 520 cm−1 is a superposition of two closely located bands at 477–480 and 511–517 cm−1. The intensity of the bands correlates with the concentrations of tantalum and transition elements in octahedral positions. In this regard, these bands can be attributed to the A1g + F2g vibrational modes of the corresponding octahedra: 477–480 cm−1—[TaO6], 511–517 cm−1—[BO6] (B-Mn,Ni). It is interesting to note the absence of an intense band at 395 cm−1, attributed to the F2g vibration and found in bismuth pyrochlores [35]. A broad composite intense band at 723–728 cm−1, observed in the Raman spectra of various bismuth-containing bismuth pyrochlores and responsible for B-O vibrations, is attributed to the high-frequency F2g vibration [41]. The appearance of composite bands in the region of octahedral vibrations indicates the distribution of dopants mainly in octahedral positions.

Table 1.
Frequencies of vibrational modes in the spectra of Bi1.8Mn0.5Ni0.5Ta2O9-Δ.
3.2. XPS and NEXAFS Spectroscopy
The XPS spectra of Mn,Ni-codoped bismuth tantalate (Bi1.8Mn0.5Ni0.5Ta2O9-Δ) are shown in Figure 6a–e. When comparing the XPS Bi4f and Bi5d spectra of the studied sample and the Bi2O3 oxide, it can be noted (Figure 6b,c) that the shape of the peaks clearly indicates that all bismuth atoms are in the same charge state (there is no splitting or distortion of the peaks), but, at the same time, the energy position of the peaks has a characteristic shift towards lower energies compared to the binding energy in trivalent bismuth oxide Bi2O3.
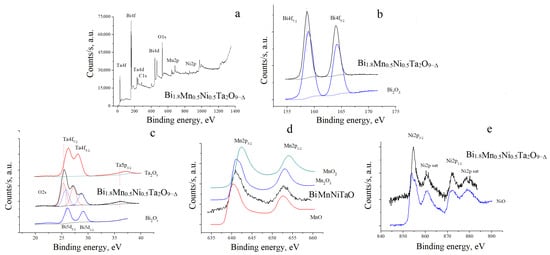
Figure 6.
Survey XPS spectra of Bi1.8Mn0.5Ni0.5Ta2O9-Δ (MnNi) (a), XPS Bi4f spectra of Bi2O3 and MnNi (b); XPS spectra of tantalum and bismuth in Bi2O3 and Ta2O5, MnNi (c); XPS Mn2p spectra of MnO, Mn2O3 and MnO2, MnNi (d); XPS Ni2p spectra of NiO and MnNi (e).
The shift towards lower energies is characteristic of a decrease in the effective positive charge; in particular, for the Bi4f and Bi5d spectra presented by us, this energy shift is ΔE = 0.25 eV. This, in turn, allows us to assume that bismuth atoms have the same effective charge +(3-ζ). When examining the spectra of tantalum atoms (Figure 6c), a similar situation can be observed: the energy position of the peaks has a characteristic shift towards lower energies compared to the binding energy in pentavalent tantalum oxide Ta2O5. In particular, for the Ta4f and Ta5p spectra presented by us, the energy shift is ΔE = 0.9 eV. This also suggests that tantalum atoms have the same effective charge +(5-ζ). The decrease in the effective charge of Bi (III) and Ta (V) cations may be due to the distribution of low-charge cations of transition elements in the bismuth and tantalum positions. The greater shift of the Ta4f and Ta5p spectra of tantalum, compared to the spectra of bismuth, may indicate a preferential distribution of transition element cations in the octahedral positions of tantalum (V). Let us move on to examining the XPS Mn2p spectra shown in Figure 6d. Comparison of the spectra of the composite with the spectra of the oxides MnO [44], Mn2O3 [45] and MnO2 [46] known from the literature shows that the spectrum of Bi1.8Mn0.5Ni0.5Ta2O9-Δ coincides in shape with the spectra of MnO and Mn2O3, but in this case, the energy position of the main peaks is intermediate compared to the binding energy in MnO and Mn2O3. This indicates that the manganese atoms in the pyrochlore composition may have a mixed charge state of Mn2+ and Mn3+. The XPS Ni2p spectra are shown in Figure 6e. When comparing the spectrum pyrochlore with the NiO spectra we obtained, we can see, as in all the cases considered above, that all nickel atoms are in the same charge state. In this case, the energy position of the peaks has a slight shift towards higher energies compared to the binding energies for these levels in divalent nickel oxide NiO, which is characteristic of an increase in the effective positive charge, i.e., the effective charge of nickel cations was +(2+ζ). The obtained results on the shifts in the binding energy compared to the initial oxides allow us to assume that transition element atoms can be introduced into both tantalum and bismuth positions. The proportion of doped 3d atoms occupying tantalum positions is greater than that introduced into bismuth positions. This is expressed in the fact that the energy shift of the binding energies of tantalum atoms compared to oxides is significantly greater than in the case of bismuth atoms. In other words, the redistribution of electron density (effective charge on atoms) in the process of doping with 3d atoms in tantalum atoms is more pronounced.
When comparing the NEXAFS Ni2p3/2 spectrum of pyrochlore and the spectrum of NiO (Figure 7), it is evident that the energy position and intensity ratio of the absorption bands at 853.5 and 855.5 eV in pyrochlore coincide with the characteristics of the bands in the Ni2p3/2 spectrum of NiO oxide, which indicates the charge state of nickel ions mainly as Ni (II). In the Mn2p3/2 spectrum of pyrochlore, characteristic peaks appear at 640.5 and 641.5, 644 eV, which in terms of energy position and intensity ratio correlate well with the main features of the MnO spectrum. However, the Mn2p3/2 spectrum of the oxide shows a shoulder at 639 eV, which is vaguely traced in the spectrum of pyrochlore; in addition, the ratio of the relative intensities of the peaks at 640.5 and 641.5 in pyrochlore is smaller than in manganese (II) oxide. These faint features may indicate the presence of a significantly smaller proportion of manganese (III) ions in pyrochlore, which is also evident in the XPS analysis. Based on this, we can conclude that manganese ions in the pyrochlore Bi1.8Mn0.5Ni0.5Ta2O9-Δ are predominantly in the Mn (II) state and that manganese (III) ions are present. A similar conclusion about the charge state of manganese cations in pyrochlores was made based on the study of the Bi2O3:Mn2O3±x:Nb2O5 system using magnetic susceptibility and EELS spectroscopy. EELS spectra for this pyrochlore were consistent with an Mn oxidation between 2+ and 3+ [12].
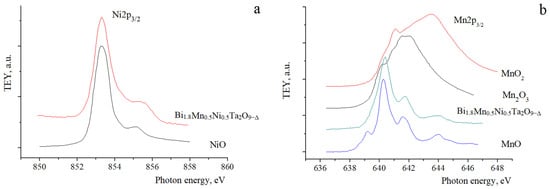
Figure 7.
NEXAFS Ni2p3/2 (a) and Mn2p3/2 (b) spectra of Bi1.8Mn0.5Ni0.5Ta2O9-Δ sample.
3.3. Electrical Properties
The electrical characteristics of the Bi1.8Mn0.5Ni0.5Ta2O9-Δ sample were studied—dielectric permittivity and dielectric loss tangent in the frequency range of 25 Hz–20 MHz (Figure 8, Figure 9, Figure 10 and Figure 11) when heated to 450 °C.
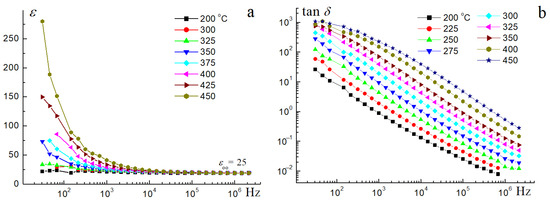
Figure 8.
Dielectric permittivity (a) and dielectric loss tangent (b) of the Bi1.8Mn0.5Ni0.5Ta2O9-Δ sample at 200–450 °C.
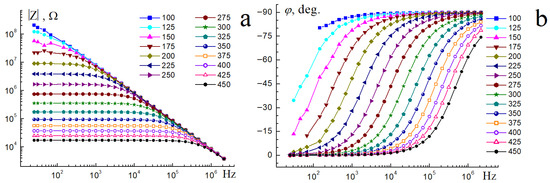
Figure 9.
Frequency dependences of the impedance modulus (a) and phase angle (b) for Bi1.8Mn0.5Ni0.5Ta2O9-Δ in the temperature range of 100–450 °C.
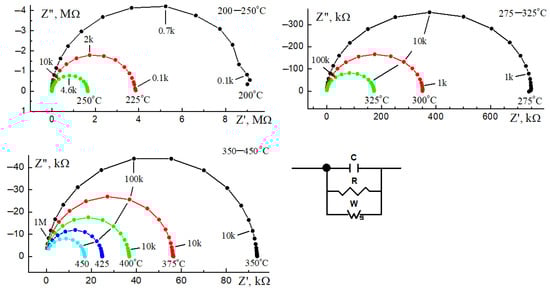
Figure 10.
Impedance hodographs of Bi1.8Mn0.5Ni0.5Ta2O9-Δ in the temperature range of 200–450 °C and the equivalent circuit.
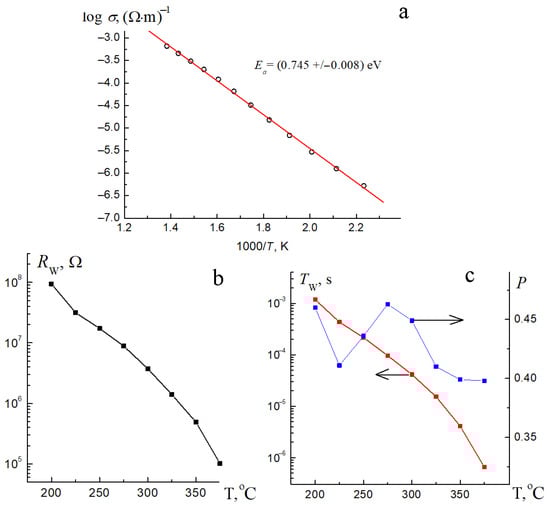
Figure 11.
Temperature dependences of the specific through conductivity (a) and the parameters of the finite diffusion impedance RW (b), TW and PW (c) for Bi1.8Mn0.5Ni0.5Ta2O9-Δ.
Measurements of the electrical properties of the sample showed that the relative permittivity of the sample in a wide temperature (up to 350 °C) and frequency range (25–106 Hz) does not depend on the frequency and exhibits a constant low value of ε = 25. Low values of permittivity indicate the flow of polarization currents, which is characteristic of typical dielectrics. With increasing temperature and decreasing frequency, the dielectric permittivity is not constant and increases, reaching values over 250 at 25 Hz and 450 °C. The increase in dielectric permittivity with decreasing frequency and increasing temperature can be associated with the increasing contribution of through conductivity associated with the movement of charge carriers. The temperature dependences of the dielectric loss tangent are almost parallel and linearly dependent on the frequency, and the loss tangent values are inversely proportional to the frequency. In a logarithmic scale, the dependence of the dielectric loss tangent on frequency is straight parallel lines. With the same scale on both axes, the slope angle will be 45°. Therefore, the product RC (R is the active resistance, C is the capacitance) does not depend on the frequency in the first approximation. The sample exhibits a minimum value of 4 × 10⁻³ of the dielectric loss tangent at a frequency of 106 Hz and 200 °C. With increasing temperature and frequency, dielectric losses increase, which is associated with the activation of through conductivity. As shown in [17], Ni-doped bismuth tantalate also belongs to dielectrics and exhibits comparable values of relative permittivity ∼32, and low dielectric losses, ∼2 × 10⁻³ at 1 MHz and ∼30 °C. Substitution of nickel cations by magnesium ions in Bi1.4(Mg1-xNix)0.7Ta1.4O6.3 (x = 0.3, 0.5, 0.7) samples [18] led to a decrease in dielectric permittivity ∼24–28 (depending on x) and comparable tangent dielectric losses ∼0.002 at 1 MHz and 21 °C. It follows from this that manganese cations do not significantly affect the electrical properties and, as shown above, the microstructure of nickel pyrochlore; it follows from this that manganese-containing preparations will have comparable dielectric characteristics. Figure 9a,b show the frequency dependences of the impedance modulus and phase angle depending on the temperature. As Figure 9a shows, the impedance modulus of the sample up to 125 °C in the entire frequency range is proportional to the current frequency, which confirms the conclusions about the flow of capacitive current at low temperatures of the sample. With increasing temperature, the through conductivity begins to prevail over the capacitive one, which is reflected in the frequency independence of the impedance modulus. The above is evidenced by the change in the phase angle depending on the frequency and temperature (Figure 8b). As we can see, at low frequencies and temperatures, the phase angle is close to a right angle, confirming the conclusion about the manifestation of reactive resistance caused by the capacitive current. At high frequencies, the phase angle maintains a value of 90°, indicating that predominantly displacement currents flow. Such behavior of the impedance module indicates that the sample under study exhibits dielectric properties.
Based on the analysis of the hodograph shape, an equivalent electrical circuit was modeled that simulates the electrical behavior of the sample in the entire studied temperature range. The hodographs of the sample have the shape of an almost ideal semicircle (Figure 10), or more precisely, an arc, the center of curvature of which falls below the real part of the impedance modulus, in the negative half-plane. Therefore, the equivalent circuit of the sample will be a parallel RC two-terminal network with an additional element—the finite diffusion Warburg impedance (finite length Warburg—short circuit terminus) [47,48]. This element is also known as a generalized finite Warburg element (GFW). It is an extension of another more common element, the finite-length Warburg (FLW). When calculating the impedance, new parameters appear: RW—impedance resistance at direct current; TW—time constant and Pw—dimensionless parameter (1 > Pw >0) responsible for the polarization homogeneity of the sample. Table 2 shows the parameters of the equivalent circuit, and the Supplementary Material contains detailed calculation data (Table S1).
Table 2.
Parameters of the equivalent circuit for Bi1.8Mn0.5Ni0.5Ta2O9-Δ at 200–450 °C.
Calculation of the value of the activation energy of conductivity in the sample showed a relatively low value of 0.745(8) eV (Figure 11a), which is more typical for semi-conductors than dielectrics. In the case of nickel pyrochlore Bi2NiTa2O9, the value of the activation energy was Ea = 2.27(6) eV [17], and for solid solutions Bi1.4(Mg1–xNix)0.7Ta1.4O6.3, the activation energy varied from 2.0 to 2.3 eV [18]. A significant decrease in the activation energy of conductivity in the studied sample Bi1.8Mn0.5Ni0.5Ta2O9-Δ compared to the composition Bi2NiTa2O9 is associated with the emergence of oxygen vacancies due to a deficiency of bismuth cations and the activation of ionic (oxygen) conductivity. This is indirectly evidenced by the need to include a finite Warburg diffusion element in the electrical circuit, which is responsible for the diffusion process. The specific electrical conductivity of Bi1.8Mn0.5Ni0.5Ta2O9-Δ changes with increasing temperature from 3.2 × 10⁻⁷ Ohm−1 ·m−1 (450 °C) to 5.6 × 10⁻⁴ Ohm−1·m−1 (700 °C). Meanwhile, for nickel pyrochlore Bi2NiTa2O9, the specific electrical conductivity ranges from 3.2 × 10⁻⁷ Ohm−1·m−1 (625 °C) to 1 × 10⁻⁵ Ohm−1·m−1 (725 °C), and for solid solutions Bi1.4(Mg1–xNix)0.7Ta1.4O6.3 it varies from 2 × 10⁻⁷ Ohm−1·m−1 (645 °C) to 1.2 × 10⁻⁵ Ohm−1·m−1 (715 °C) [17,18]. An assessment of the parameters of the final diffusion impedance—Tw and Pw showed (Figure 11c) that in the sample, with increasing temperature, the rate of polarization processes increases (the parameter Tw decreases), and the resistance of the diffusion impedance at direct current decreases (the parameter Rw decreases), which indicates the presence of a diffusion process at high temperatures, and this indirectly indicates the contribution of the ionic component of conductivity. The flow of diffusion current is also indicated by the parameter associated with the polarization inhomogeneity of the sample (Pw). As can be seen from the graph, in the entire temperature range, on average, it does not change and is close to the value of 0.5, which ideally corresponds to the calculation of the diffusion impedance associated with the diffusion process performed by ions.
4. Conclusions
Mn-Ni bismuth tantalate pyrochlores of the composition Bi2-xMn0.5Ni0.5Ta2O9-Δ (x = 0; 0.19) were studied by soft X-ray spectroscopy using synchrotron radiation and impedance spectroscopy. According to X-ray diffraction data, the phase-pure pyrochlore is oxide Bi1.8Mn0.5Ni0.5Ta2O9-Δ (sp. gr. Fd-3m). The Bi2Mn0.5Ni0.5Ta2O9+Δ sample contains an admixture of bismuth orthotantalate. According to XPS data, a characteristic shift of Ta4f and Ta5p spectra to the region of lower energies by 0.9 eV is observed. The effective charge of tantalum cations is +(5-ζ). In pyrochlore, the Bi4f shift was 0.25 eV, and the charge of bismuth cations was +(3-ζ). Manganese cations in pyrochlore have a charge of predominantly +2, +3. According to XPS, the effective charge of nickel cations was +(2+ζ). The sample exhibited low values of permittivity (25) and a dielectric loss tangent of 4 × 10⁻³. The activation energy of conductivity was 0.7 eV. The electrical behavior of a single-phase sample was analyzed by impedance spectroscopy and modeled by an equivalent circuit containing a finite Warburg diffusion element used to describe diffusion processes.
Supplementary Materials
The following supporting information can be downloaded at: https://www.mdpi.com/article/10.3390/chemistry7040119/s1, (Unit cell of the Bi1.8Mn0.5Ni0.5Ta2O9-Δ pyrochlore, Equivalent circuit and its parameters depending on temperature, Parameters of the equivalent circuit for Bi1.8Mn0.5Ni0.5Ta2O9-Δ at 200–450 °C.
Author Contributions
Conceptualization, S.V.N. and N.A.Z.; formal analysis, O.V.P.; investigation, N.A.Z., S.V.N., B.A.M., M.G.K., K.N.P., A.V.K. and N.A.S.; resources, M.G.K., B.A.M., A.V.K. and N.A.S.; validation, N.A.Z., S.V.N., B.A.M., N.A.S., M.G.K. and K.N.P.; visualization, N.A.Z., S.V.N., N.A.S. and M.G.K.; writing—original draft, N.A.S., N.A.Z. and S.V.N. All authors have read and agreed to the published version of the manuscript.
Funding
This research was funded by Ministry of Science and Higher Education of Russia, grant number 075-15-2025-455.
Data Availability Statement
The original contributions presented in the study are included in the article/Supplementary Materials, further inquiries can be directed to the corresponding author.
Acknowledgments
Structure analysis was carried out at the Center for X-Ray Diffraction Studies of the Research Park of St. Petersburg State University within the project 125021702335-5. The XPS studies were performed on the equipment of the Resource Center “Physical methods of surface investigation” of the Scientific Park of St. Petersburg University. The NEXAFS studies were performed on the synchrotron radiation from station “NanoPES” storage ring (National Research Center “Kurchatov Institute”) within the framework of the state budget topic 125020501562-1, as well as with the financial support of the Ministry of Science and Higher Education of Russia within the framework of agreement No. 075-15-2025-455.
Conflicts of Interest
The authors declare that there are no conflicts of interest.
References
- Bongers, P.F.; Van Meurs, E.R. Ferromagnetism in Compounds with Pyrochlore Structure. J. Appl. Phys. 1967, 38, 944–945. [Google Scholar] [CrossRef]
- Hiroi, Z.; Yamaura, J.I.; Yonezawa, S.; Harima, H. Chemical trends of superconducting properties in pyrochlore oxides. Phys. C Supercond. Appl. 2007, 460–462, 20–27. [Google Scholar] [CrossRef]
- Greedan, J.E. Frustrated rare earth magnetism: Spin glasses, spin liquids and spin ices in pyrochlore oxides. J. Alloys Comp. 2006, 408–412, 444–455. [Google Scholar] [CrossRef]
- Murugesan, S.; Huda, M.N.; Yan, Y.; Al-Jassim, M.M.; Subramanian, V. Band-Engineered Bismuth Titanate Pyrochlores for Visible Light Photocatalysis. J. Phys. Chem. C 2010, 114, 10598–10605. [Google Scholar] [CrossRef]
- Giampaoli, G.; Siritanon, T.; Day, B.; Li, J.; Subramanian, M.A. Temperature in-dependent low loss dielectrics based on quaternary pyrochlore oxides. Prog. Solid State Chem. 2018, 50, 16–23. [Google Scholar] [CrossRef]
- Du, H.; Yao, X. Structural trends and dielectric properties of Bi-based pyrochlores. J. Mater. Sci. Mater. Electron. 2004, 15, 613–616. [Google Scholar] [CrossRef]
- McCaule, R.A. Structural Characteristics of Pyrochlore Formation. J. Appl. Phys. 1980, 51, 290–294. [Google Scholar] [CrossRef]
- Subramanian, M.A.; Aravamudan, G.; Subba Rao, G.V. Oxide pyrochlores—A review. Prog. Sol. St. Chem. 1983, 15, 55–143. [Google Scholar] [CrossRef]
- Matteucci, F.; Cruciani, G.; Dondi, M.; Baldi, G.; Barzanti, A. Crystal structural and optical properties of Cr-doped Y2Ti2O7 and Y2Sn2O7 pyrochlores. Acta Mater. 2007, 55, 2229–2238. [Google Scholar] [CrossRef]
- Hector, A.L.; Wiggin, S.B. Synthesis and structural study of stoichiometric Bi2Ti2O7 pyrochlore. J. Solid State Chem. 2004, 177, 139–145. [Google Scholar] [CrossRef]
- Lufaso, M.W.; Vanderah, T.A.; Pazos, I.M.; Levin, I.; Roth, R.S.; Nino, J.C.; Provenzano, V.; Schenck, P.K. Phase formation, crystal chemistry, and properties in the system Bi2O3-Fe2O3-Nb2O5. J. Sol. St. Chem. 2006, 179, 3900–3910. [Google Scholar] [CrossRef]
- Vanderah, T.A.; Lufaso, M.W.; Adler, A.U.; Levin, I.; Nino, J.C.; Provenzano, V.; Schenck, P.K. Subsolidus phase equilibria and properties in the system Bi2O3:Mn2O3 ± x:Nb2O5. J. Sol. St. Chem. 2006, 179, 3467–3477. [Google Scholar] [CrossRef]
- Nguyen, H.B.; Noren, L.; Liu, Y.; Withers, R.L.; Wei, X.R.; Elcombe, M.M. The disordered structures and low temperature dielectric relaxation properties of two misplaced-displacive cubic pyrochlores found in the Bi2O3-MO-Nb2O5 (M = Mg, Ni) systems. J. Sol. St. Chem. 2007, 180, 2558–2565. [Google Scholar] [CrossRef]
- Valant, M. Dielectric Relaxations in Bi2O3-Nb2O5-NiO Cubic Pyrochlores. J. Am. Ceram. Soc. 2009, 92, 955–958. [Google Scholar] [CrossRef]
- Zhuk, N.A.; Sekushin, N.A.; Krzhizhanovskaya, M.G.; Kharton, V.V. Multiple relaxation, reversible electrical breakdown and bipolar conductivity of pyrochlore–type Bi2Cu0.5Zn0.5Ta2O9 ceramics. Sol. St. Ion. 2022, 377, 115868. [Google Scholar] [CrossRef]
- Abdullah, A.; Wan Khalid, W.E.F.; Abdullah, S.Z. Synthesis and Characterization of Bismuth Nickel Tantalate Pyrochlore. Appl. Mech. Mater. 2015, 749, 30–35. [Google Scholar] [CrossRef]
- Zhuk, N.A.; Krzhizhanovskaya, M.G.; Koroleva, A.V.; Nekipelov, S.V.; Kharton, V.V.; Sekushin, N.A. Thermal Expansion, XPS Spectra, and Structural and Electrical Properties of a New Bi2NiTa2O9 Pyrochlore. Inorg. Chem. 2021, 60, 4924–4934. [Google Scholar] [CrossRef]
- Zhuk, N.A.; Krzhizhanovskaya, M.G.; Sekushin, N.A.; Kharton, V.V.; Koroleva, A.V.; Nekipelov, S.V.; Sivkov, D.V.; Sivkov, V.N.; Makeev, B.A.; Lebedev, A.M.; et al. Novel Ni-Doped Bismuth–Magnesium Tantalate Pyrochlores: Structural and Electrical Properties, Thermal Expansion, X-ray Photoelectron Spectroscopy, and Near-Edge X-ray Absorption Fine Structure Spectra. ACS Omega 2021, 6, 23262–23273. [Google Scholar] [CrossRef]
- Rylchenko, E.P.; Makeev, B.A.; Sivkov, D.V.; Korolev, R.I.; Zhuk, N.A. Features of phase formation of pyrochlore-type Bi2Cr1/6Mn1/6Fe1/6Co1/6Ni1/6Cu1/6Ta2O9+Δ. Lett. Mater. 2022, 12, 486–492. [Google Scholar] [CrossRef]
- Parshukova, K.N.; Sekushin, N.A.; Makeev, B.A.; Krzhizhanovskaya, M.G.; Koroleva, A.V.; Zhuk, N.A. Synthesis and dielectric properties, XPS spectroscopy study of high-entropy pyrochlore. Lett. Mater. 2022, 12, 469–474. [Google Scholar] [CrossRef]
- Zhuk, N.A.; Makeev, B.A.; Sivkov, D.V.; Rylchenko, E.P.; Parshukova, K.N. Features of bismuth tantalate based high-entropy pyrochlores preparation. Ceram. Intern. 2022, 48, 31723–31727. [Google Scholar] [CrossRef]
- Gilev, A.R.; Kiselev, E.A.; Sukhanov, K.S.; Korona, D.V.; Cherepanov, V.A. Evaluation of La2-x(Ca/Sr)xNi1-yFeyO4+δ (x = 0.5, 0.6; y = 0.4, 0.5) as cathodes for proton-conducting SOFC based on lanthanum tungstate. Electrochim. Acta 2022, 421, 140479. [Google Scholar] [CrossRef]
- Shevchenko, V.A.; Komayko, A.I.; Sivenkova, E.V.; Samigullin, R.R.; Skvortsova, I.A.; Abakumov, A.M.; Nikitina, V.A.; Drozhzhin, O.A.; Antipov, E.V. Effect of Ni/Fe/Mn ratio on electrochemical properties of the O3–NaNi1-x-yFexMnyO2 (0.25 ≤ x,y ≤ 0.75) cathode materials for Na-ion batteries. J. Power Sources 2024, 596, 234092. [Google Scholar] [CrossRef]
- Aksenova, T.V.; Mysik, D.K.; Cherepanov, V.A. Crystal Structure and Properties of Gd1-xSrxCo1-yFeyO3-δ Oxides as Promising Materials for Catalytic and SOFC Application. Catalysts 2022, 12, 1344. [Google Scholar] [CrossRef]
- Sun, S.; Xue, Y.; Yang, D.; Pei, Z.; Fang, L.; Xia, Y.; Ti, R.; Wang, C.; Liu, C.; Xiong, B.; et al. Bismuth pyrochlores with varying Fe/Co ratio for efficient Multi-Functional Catalysis: Structure evolution versus Photo- and Electro-catalytic activities. Chem. Engin. J. 2022, 448, 137580. [Google Scholar] [CrossRef]
- Bruker AXS. Topas, 5.0. General Profile and Structure Analysis Software for Powder Diffraction Data. Bruker AXS: Karlsruhe, Germany, 2014.
- Roth, R.S.; Waring, J.L. Synthesis and stability of bismutotantalite, stibiotantalite and chemically similar ABO4 compounds. Am. Mineral. 1963, 48, 1348–1356. [Google Scholar] [CrossRef]
- Zhuk, N.A.; Krzhizhanovskaya, M.G.; Belyy, V.A.; Kharton, V.V.; Chichineva, A.I. Phase transformations and thermal expansion of α- and β-BiTaO4 and the high-temperature modification γ-BiTaO4. Chem. Mater 2020, 32, 5493–5501. [Google Scholar] [CrossRef]
- Zhuk, N.A.; Krzhizhanovskaya, M.G.; Sekushin, N.A.; Sivkov, D.V.; Abdurakhmanov, I.E. Crystal structure, dielectric and thermal properties of cobalt doped bismuth tantalate pyrochlore. J. Mater. Res. Technol. 2023, 22, 1791–1799. [Google Scholar] [CrossRef]
- Shannon, R.D. Revised effective ionic radii and systematic studies of interatomic distances in halides and chalcogenides. Acta Crystallogr. A. 1976, 32, 751–767. [Google Scholar] [CrossRef]
- Zhuk, N.A.; Makeev, B.A.; Koroleva, A.V.; Lebedev, A.M.; Petrova, O.V.; Nekipelov, S.V.; Sivkov, V.N. XPS and NEXAFS Characterization of Mg/Zn and Mn Codoped Bismuth Tantalate Pyrochlores. Inorganics 2024, 12, 74. [Google Scholar] [CrossRef]
- Piir, I.V.; Prikhodko, D.A.; Ignatchenko, S.V.; Schukariov, A.V. Preparation and structural investigations of the mixed bismuth niobates, containing transition metals. Sol. St. Ion. 1997, 101–103, 1141–1146. [Google Scholar] [CrossRef]
- Brown, S.; Gupta, H.C.; Alonso, J.A.; Martinez-Lope, M.J. Vibrational spectra and force field calculation of A2Mn2O7(A=Y, Dy, Er, Yb) pyrochlores. J. Raman Spectrosc. 2003, 34, 240–243. [Google Scholar] [CrossRef]
- Fischer, M.; Malcherek, T.; Bismayer, U.; Blaha, P.; Schwarz, K. Structure and stability of Cd2Nb2O7 and Cd2Ta2O7 explored by ab initio calculations. Phys. Rev. B 2008, 78, 014108. [Google Scholar] [CrossRef]
- Patterson, C.H. First-principles calculation of the structure and dielectric properties of Bi2Ti2O7. Phys. Rev. B 2010, 82, 155103. [Google Scholar] [CrossRef]
- Krayzman, V.; Levin, I.; Woicik, J.C. Local structure of displacively disordered pyrochlore dielectrics. Chem. Mater. 2007, 19, 932–936. [Google Scholar] [CrossRef]
- Jana, Y.M.; Nand, S.; Gupta, H.C. Lattice dynamics and force constant calculation for the Raman and infra-red wave numbers of cubic bismuth-based pyrochlore compounds. J. Mol. Struct. 2018, 1154, 463–468. [Google Scholar] [CrossRef]
- Sudheendran, K.; Raju, K.C.J.; Singh, M.K.; Katiyar, R.S. Microwave dielectric and Raman scattering studies on bismuth zinc niobate thin films. J. Appl. Phys. 2008, 104, 104104. [Google Scholar] [CrossRef]
- Rahman, R.A.U.; Ruth, D.E.J.; Ramaswamy, M. Emerging scenario on displacive cubic bismuth pyrochlores (Bi,M)MNO7-δ (M = transition metal, N = Nb, Ta, Sb) in context of their fascinating structural, dielectric and magnetic properties. Ceram. Int. 2020, 46, 14346–14360. [Google Scholar] [CrossRef]
- Zhuk, N.A.; Nekipelov, S.V.; Petrova, O.V.; Makeev, B.A.; Isaenko, S.I.; Krzhizhanovskaya, M.G.; Parshukova, K.N.; Korolev, R.I.; Simpeleva, R.A. Synthesis, Phase Formation, and Raman Spectroscopy of Ni and Zn(Mg) Codoped Bismuth Stibate Pyrochlore. Chemistry 2025, 7, 110. [Google Scholar] [CrossRef]
- Gupta, H.C.; Brown, S.; Rani, N.; Gohel, V.B. Lattice dynamic investigation of the zone center wavenumbers of the cubic A2Ti2O7 pyrochlores. J. Raman Spectrosc. 2001, 32, 41–44. [Google Scholar] [CrossRef]
- Arenas, D.J.; Gasparov, L.V.; Qiu, W.; Nino, J.C.; Patterson, C.H.; Tanner, D.B. Raman study of phonon modes in bismuth pyrochlores. Phys. Rev. B Condens. Matter Mater. Phys. 2010, 82, 214302. [Google Scholar] [CrossRef]
- Chen, M.; Tanner, D.B.; Nino, J.C. Infrared study of the phonon modes in bismuth pyrochlores. Phys. Rev. B 2005, 72, 054303. [Google Scholar] [CrossRef]
- Grissa, R.; Martinez, H.; Cotte, S.; Galipaud, J.; Pecquenard, B.; Cras, F.L. Thorough XPS analyses on overlithiated manganese spinel cycled around the 3V plateau. Appl. Surf. Sci. 2017, 411, 449–456. [Google Scholar] [CrossRef]
- Stranick, M.A. Mn2O3 by XPS. Surf. Sci. Spectra 1999, 6, 39–46. [Google Scholar] [CrossRef]
- Gri, F.; Bigiani, L.; Gasparotto, A.; Maccato, C.; Barreca, D. XPS investigation of F-doped MnO2 nanosystems fabricated by plasma assisted-CVD. Surf. Sci. Spectra 2018, 25, 024004. [Google Scholar] [CrossRef]
- Lasia, A. Electrochemical Impedance Spectroscopy and Its Applications; Springer Science + Business Media: New York, NY, USA, 2014; p. 369. [Google Scholar] [CrossRef]
- Barsoukov, E.; Macdonald, J.R. Impedance Spectroscopy: Theory, Experiment and Application; Wiley—Interscience: Hoboken, NJ, USA, 2005; p. 606. [Google Scholar]
Disclaimer/Publisher’s Note: The statements, opinions and data contained in all publications are solely those of the individual author(s) and contributor(s) and not of MDPI and/or the editor(s). MDPI and/or the editor(s) disclaim responsibility for any injury to people or property resulting from any ideas, methods, instructions or products referred to in the content. |
© 2025 by the authors. Licensee MDPI, Basel, Switzerland. This article is an open access article distributed under the terms and conditions of the Creative Commons Attribution (CC BY) license (https://creativecommons.org/licenses/by/4.0/).