Higgs Boson Searches at the LHC Beyond the Standard Model


Abstract
1. Introduction
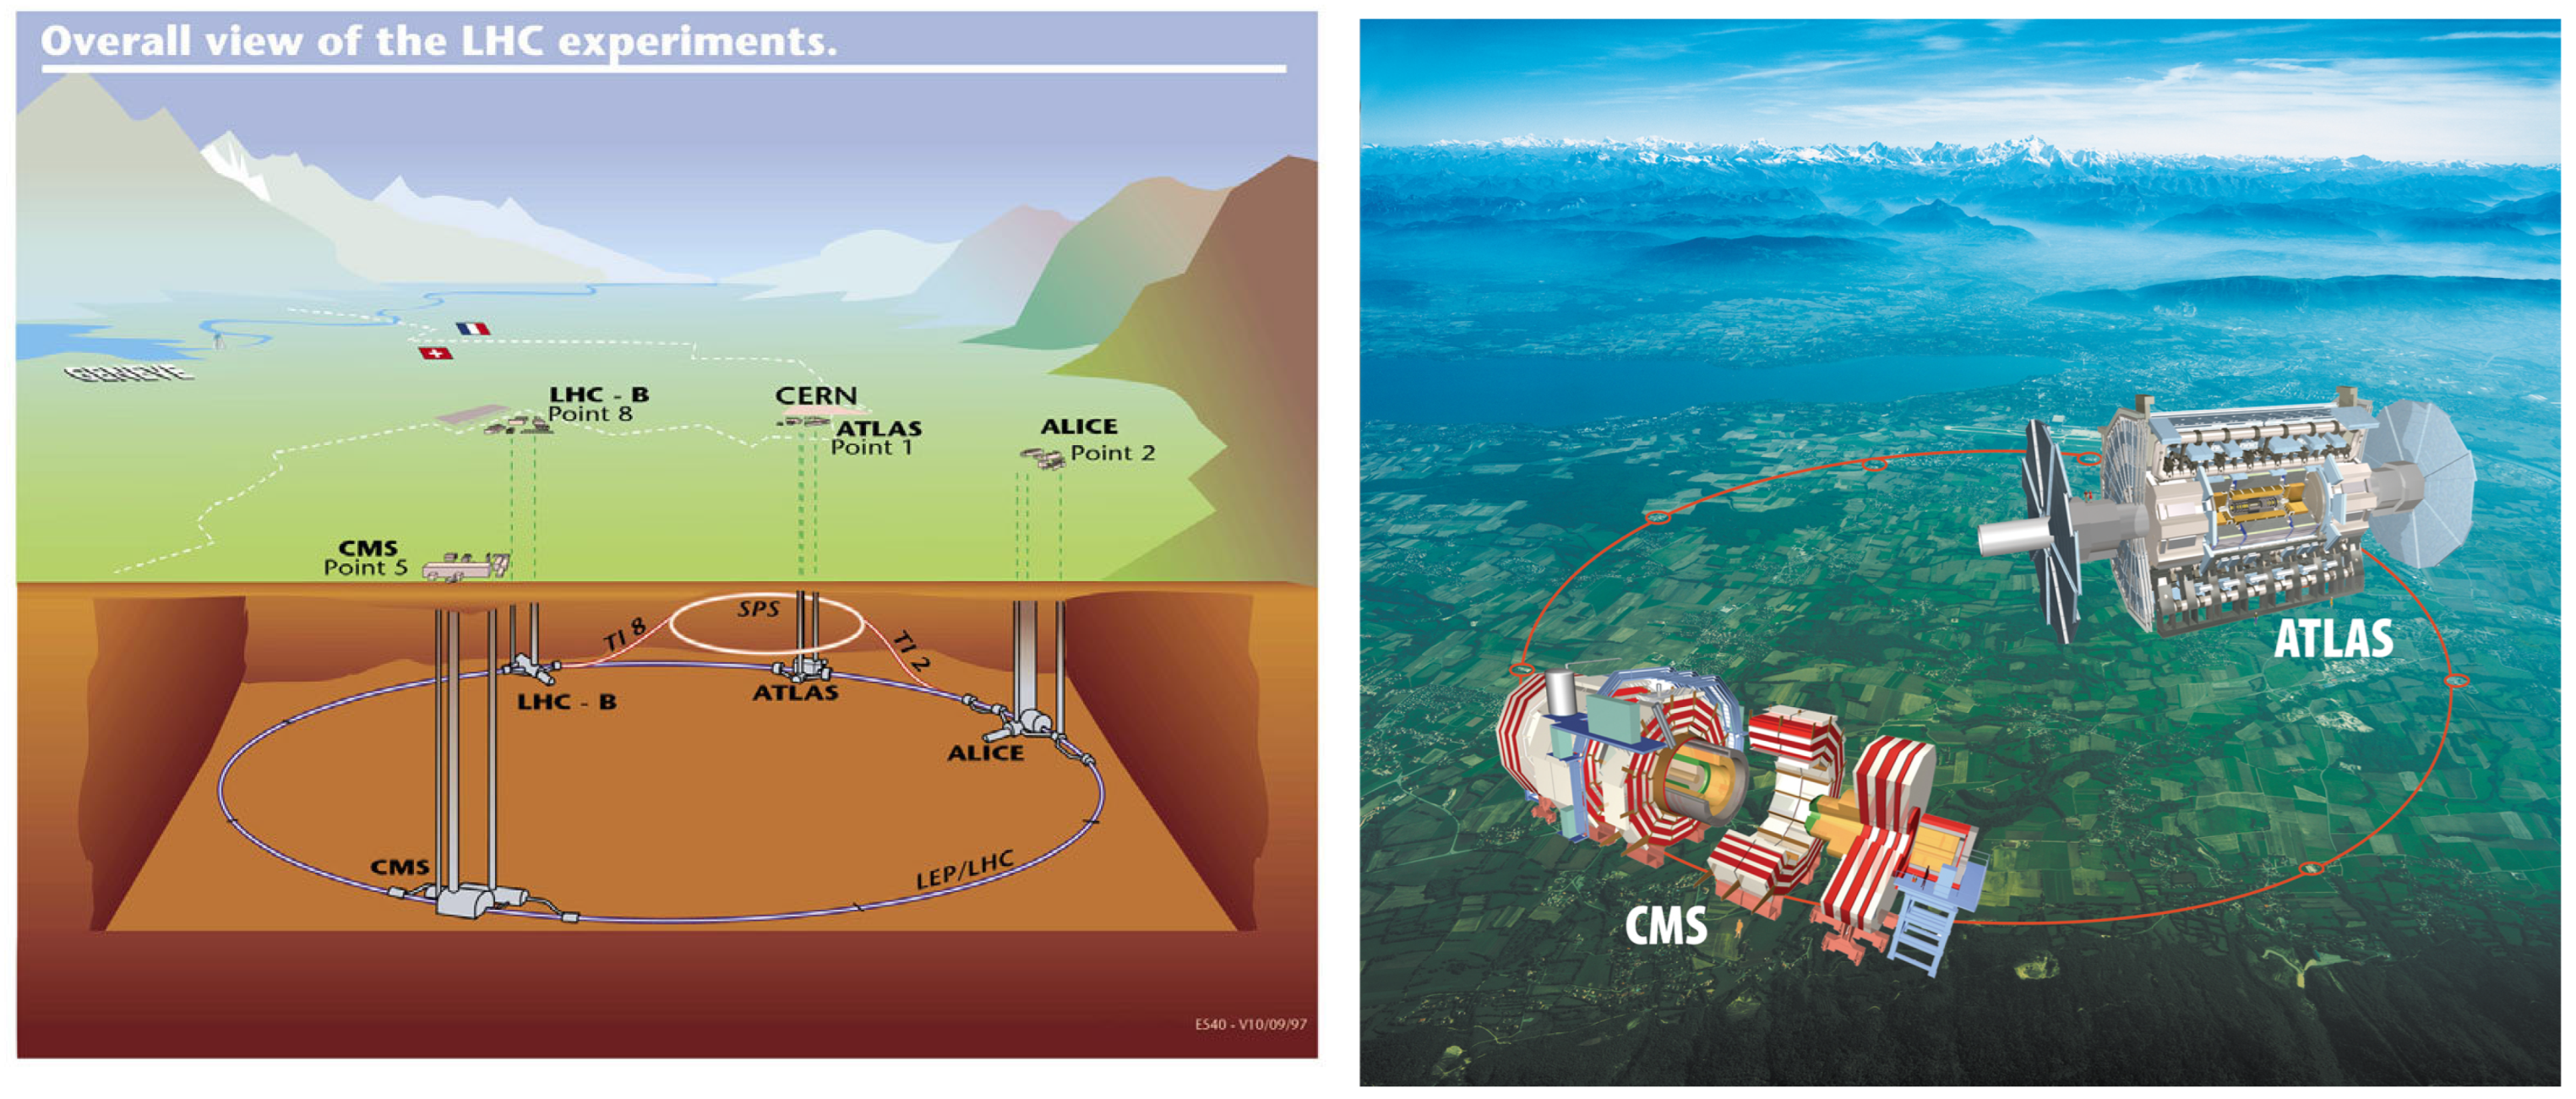
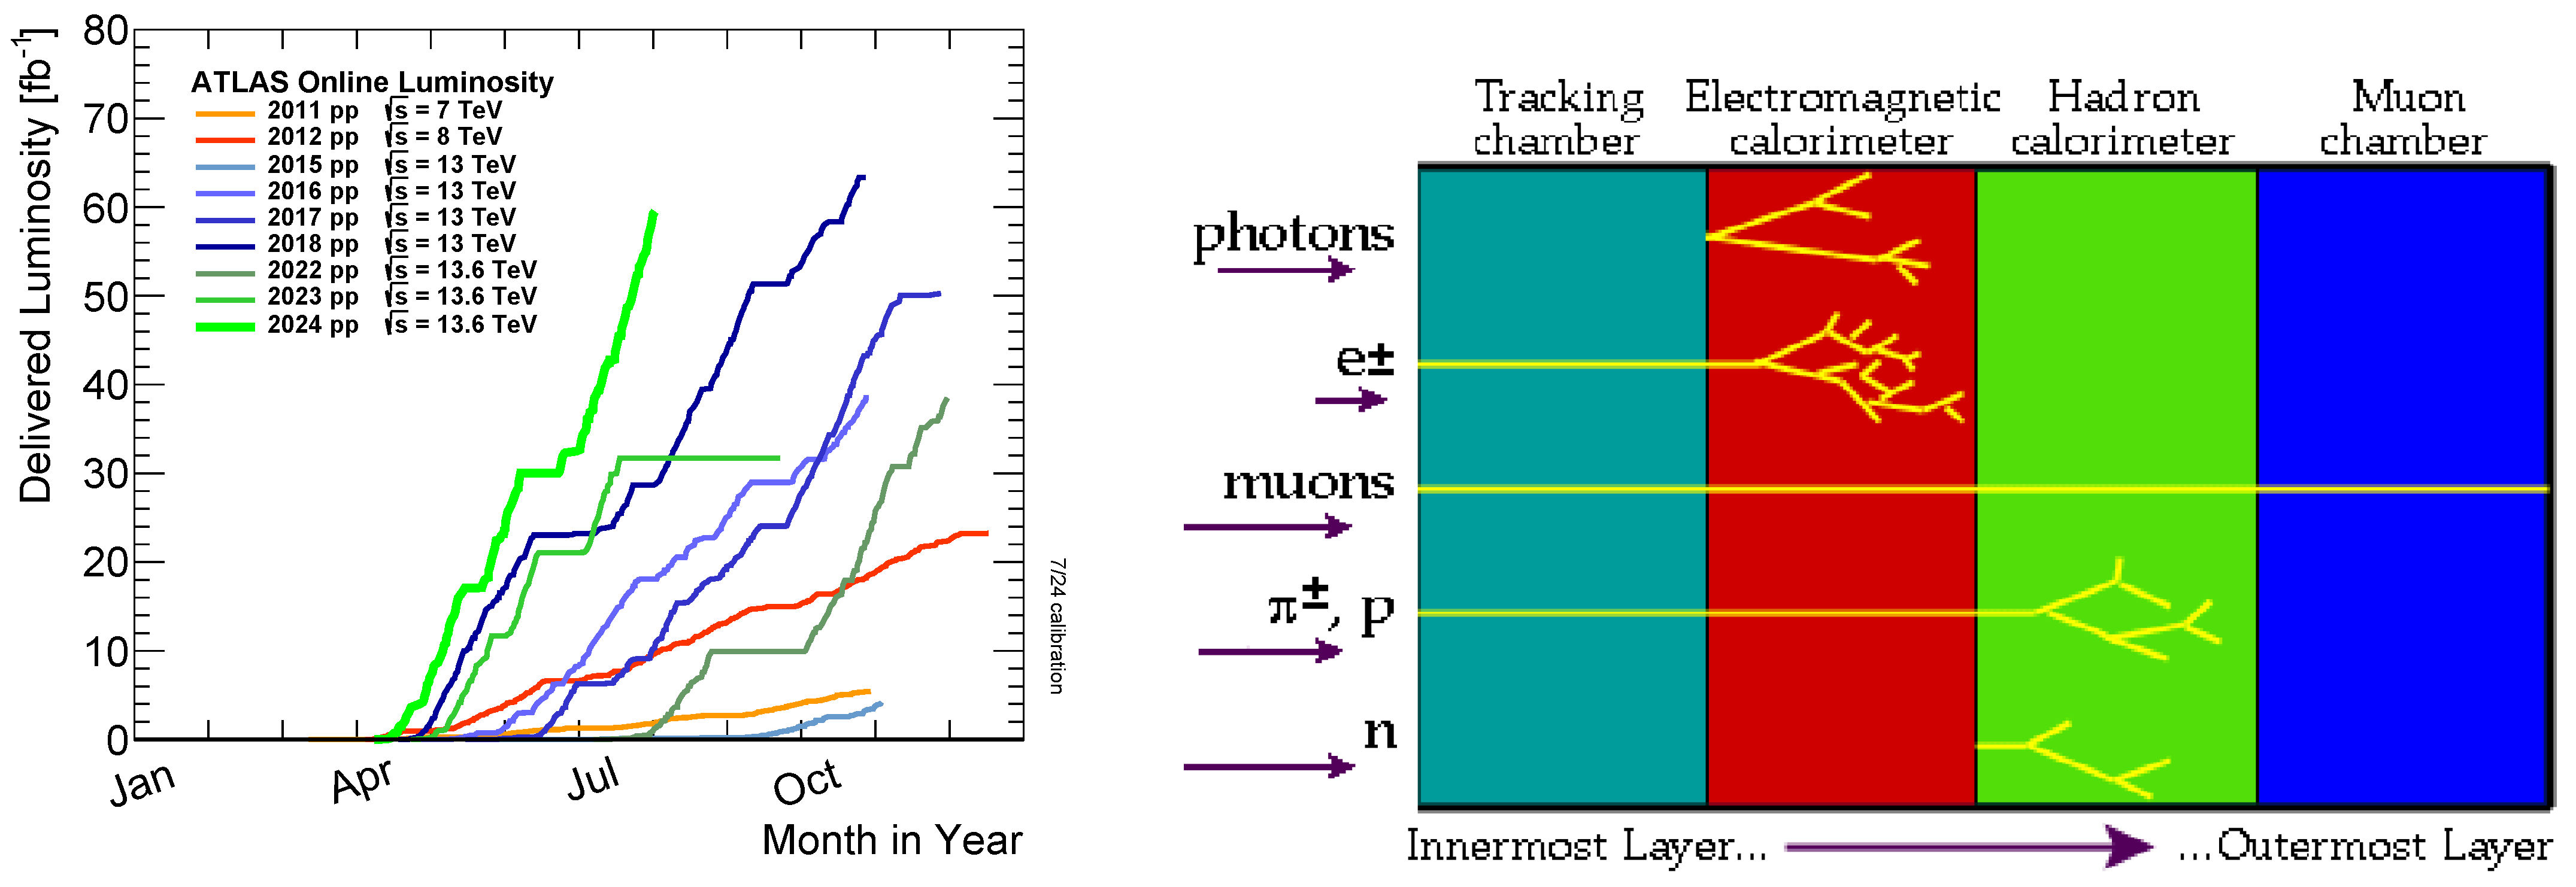
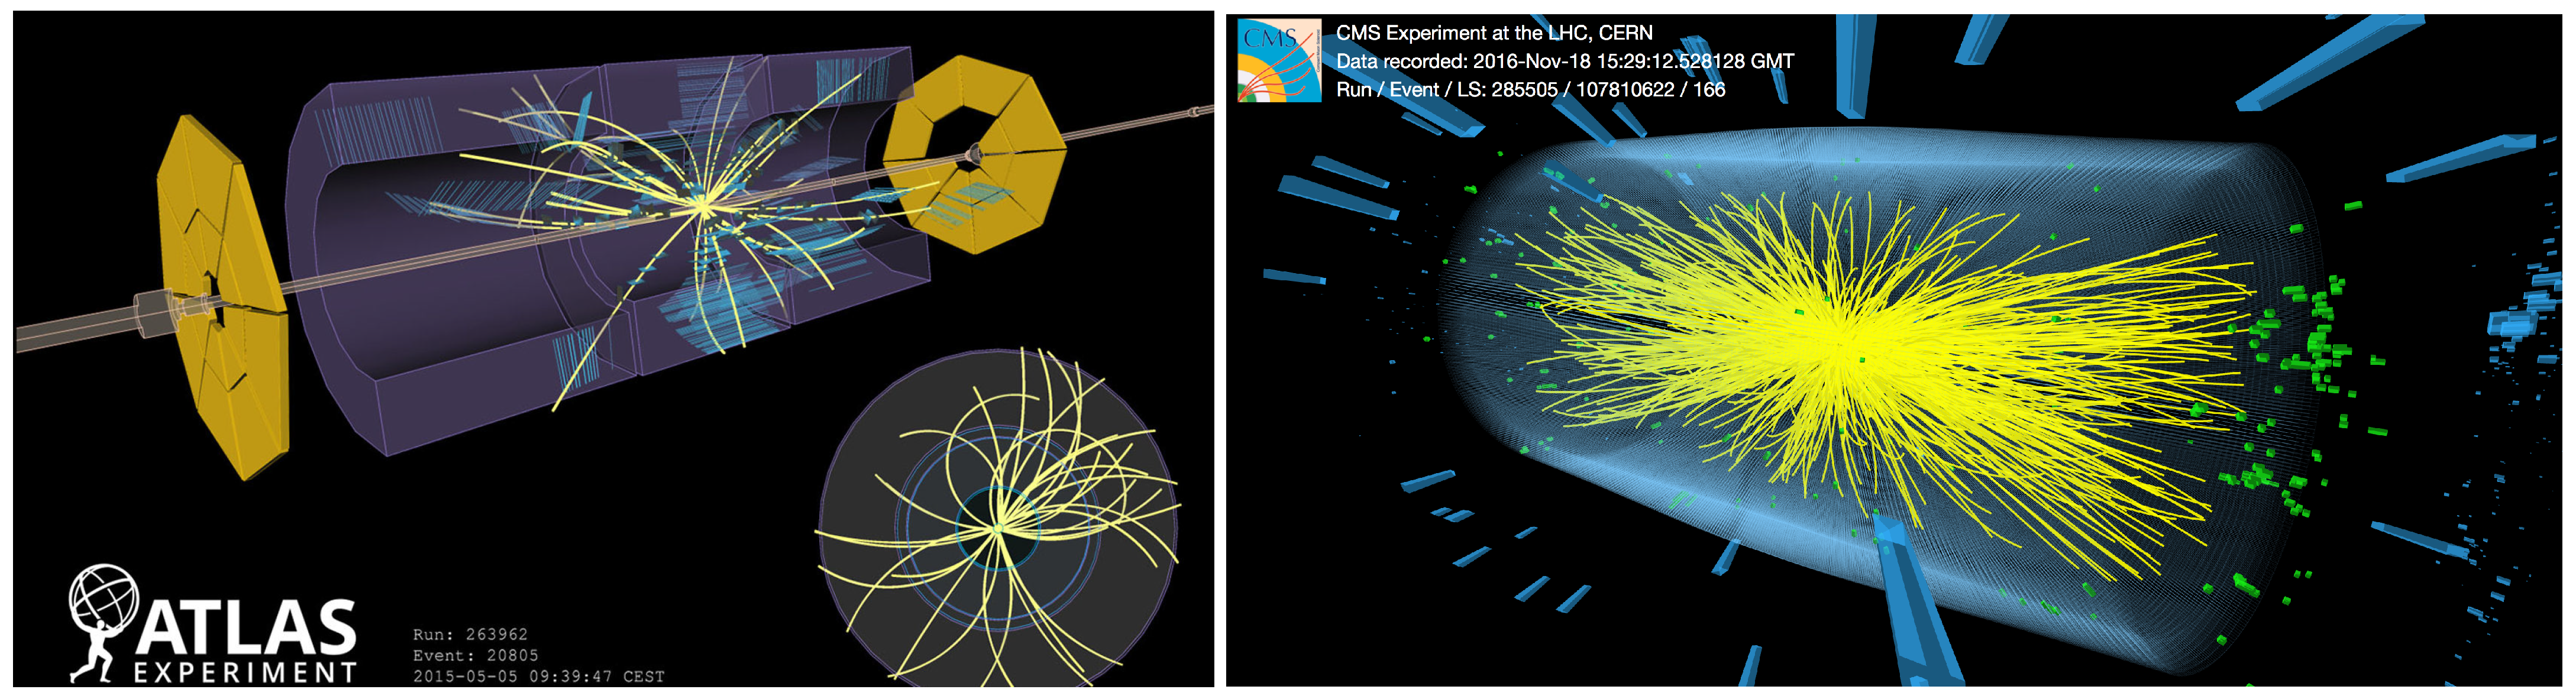
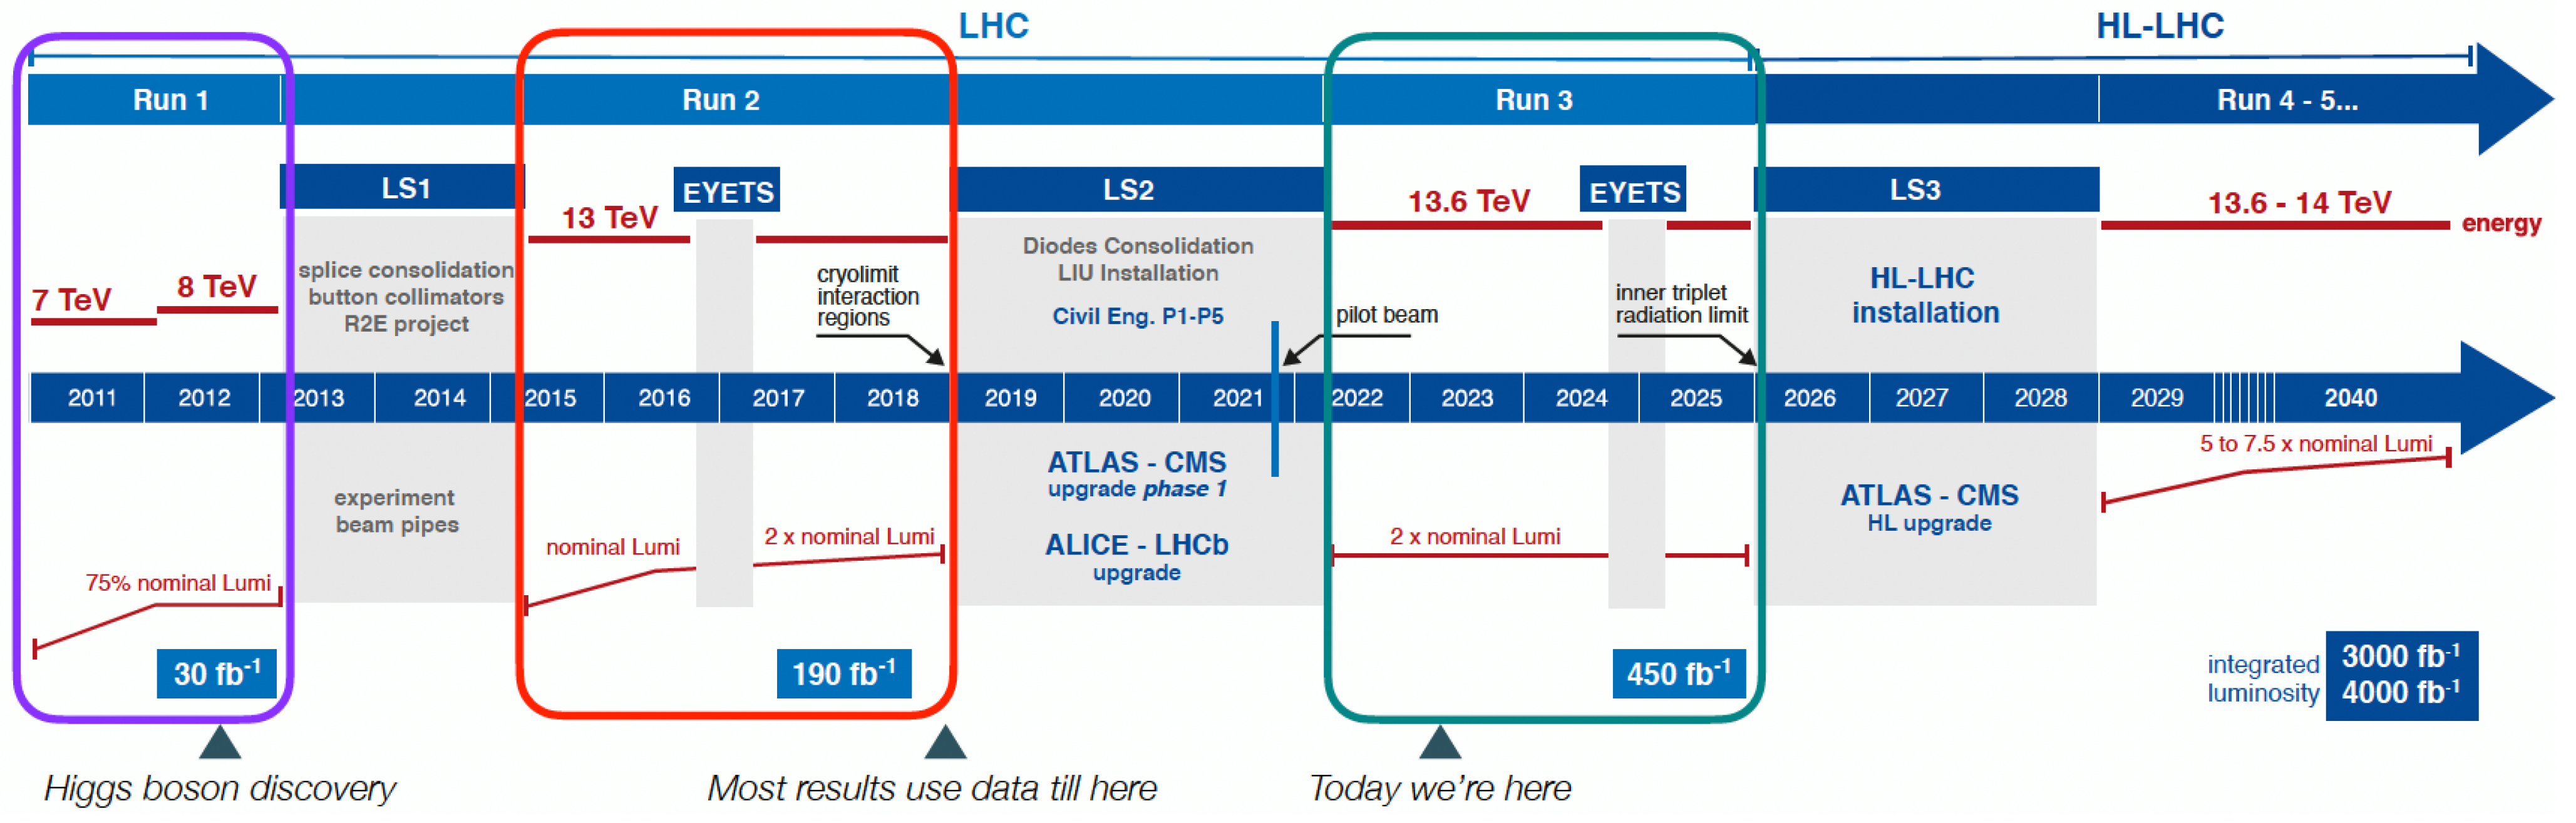
1.1. LHC, Experiments, and Data Taking
- LHC Run-2: 2015–2018, results presented here;
- LHC Run-3: 2022–2025, ongoing data taking.
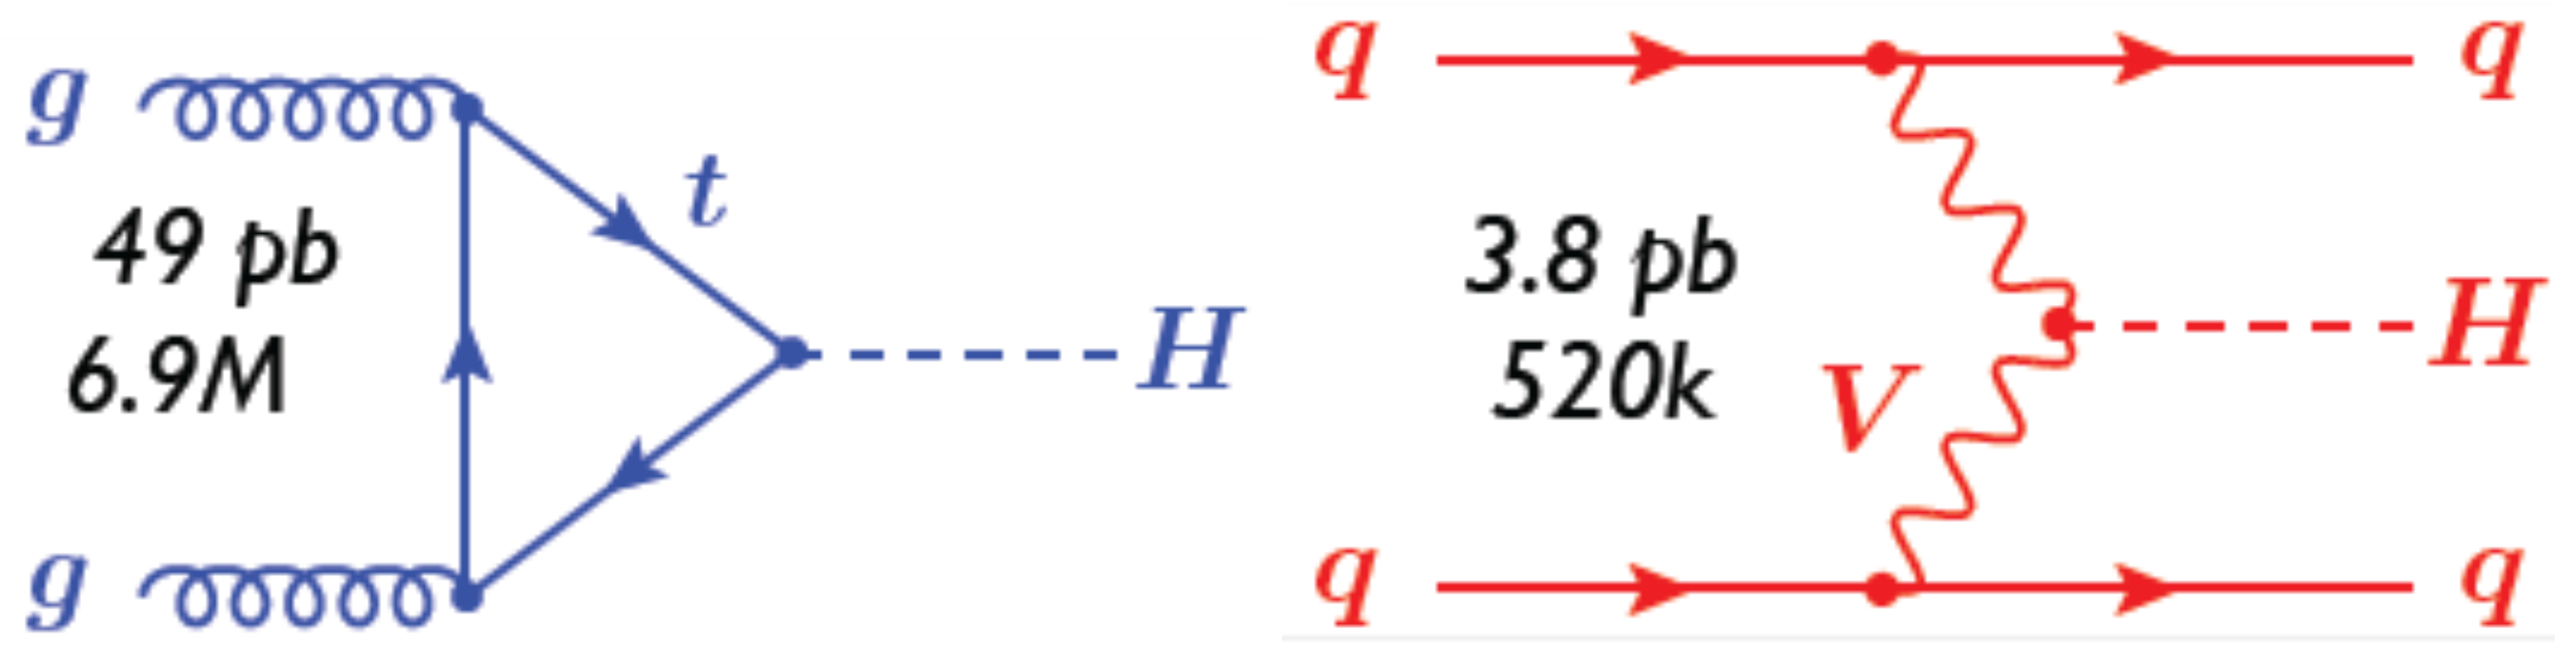
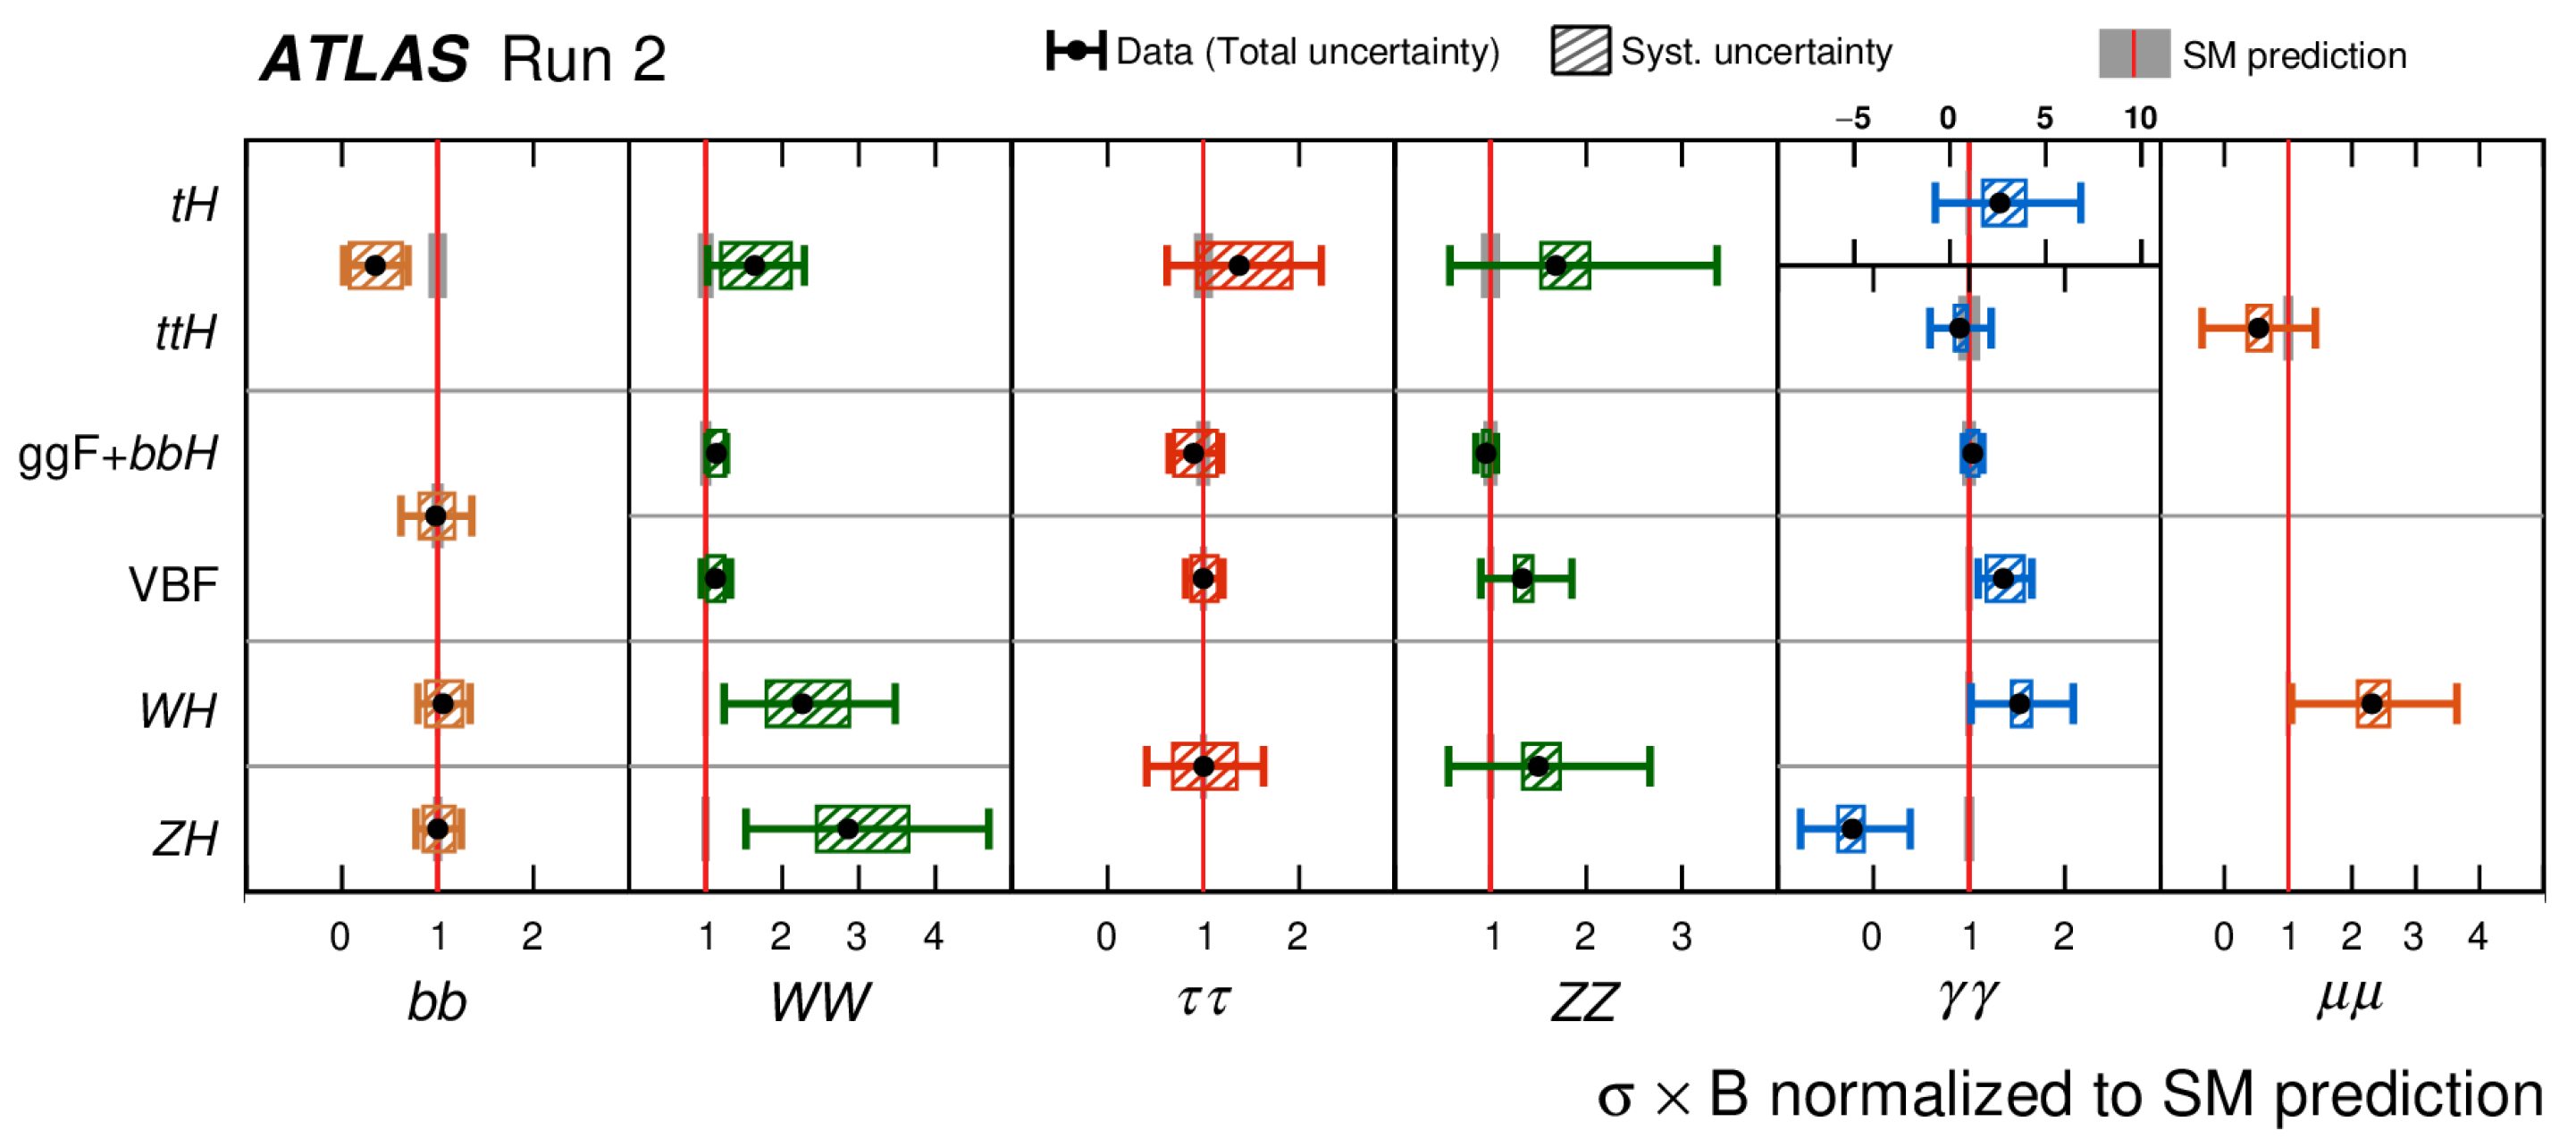
1.2. Production Modes
1.3. Decay Branching Ratios
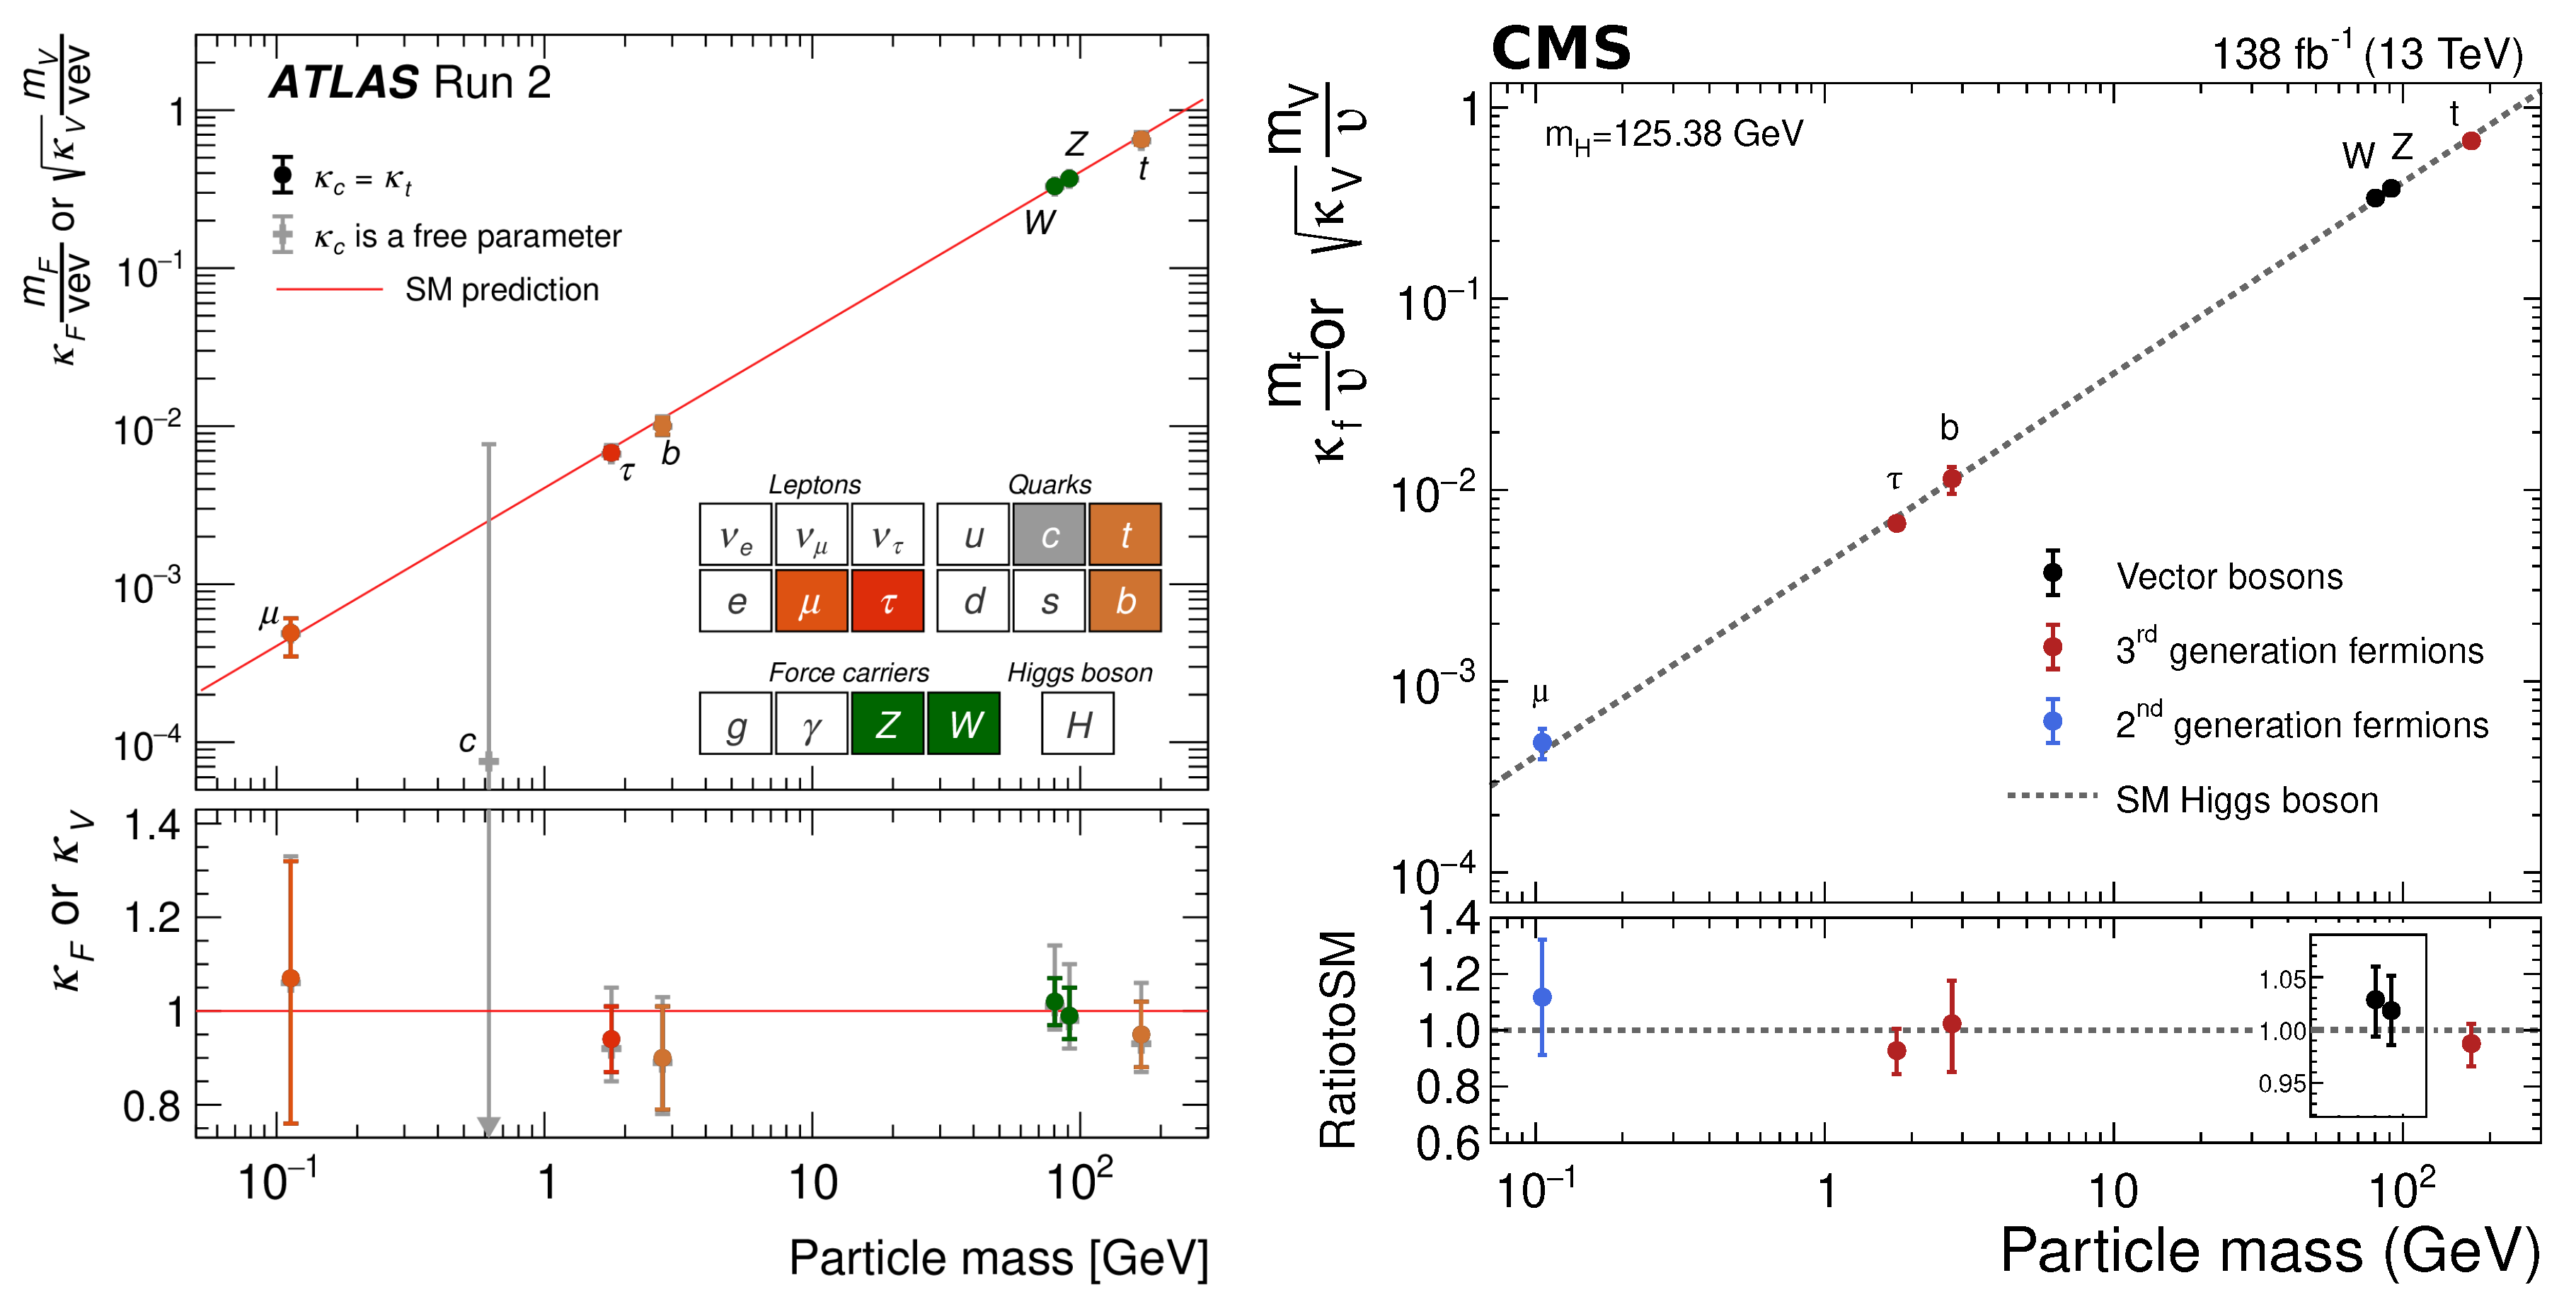
1.4. Relation of Coupling to Fermion/Vector Boson Mass
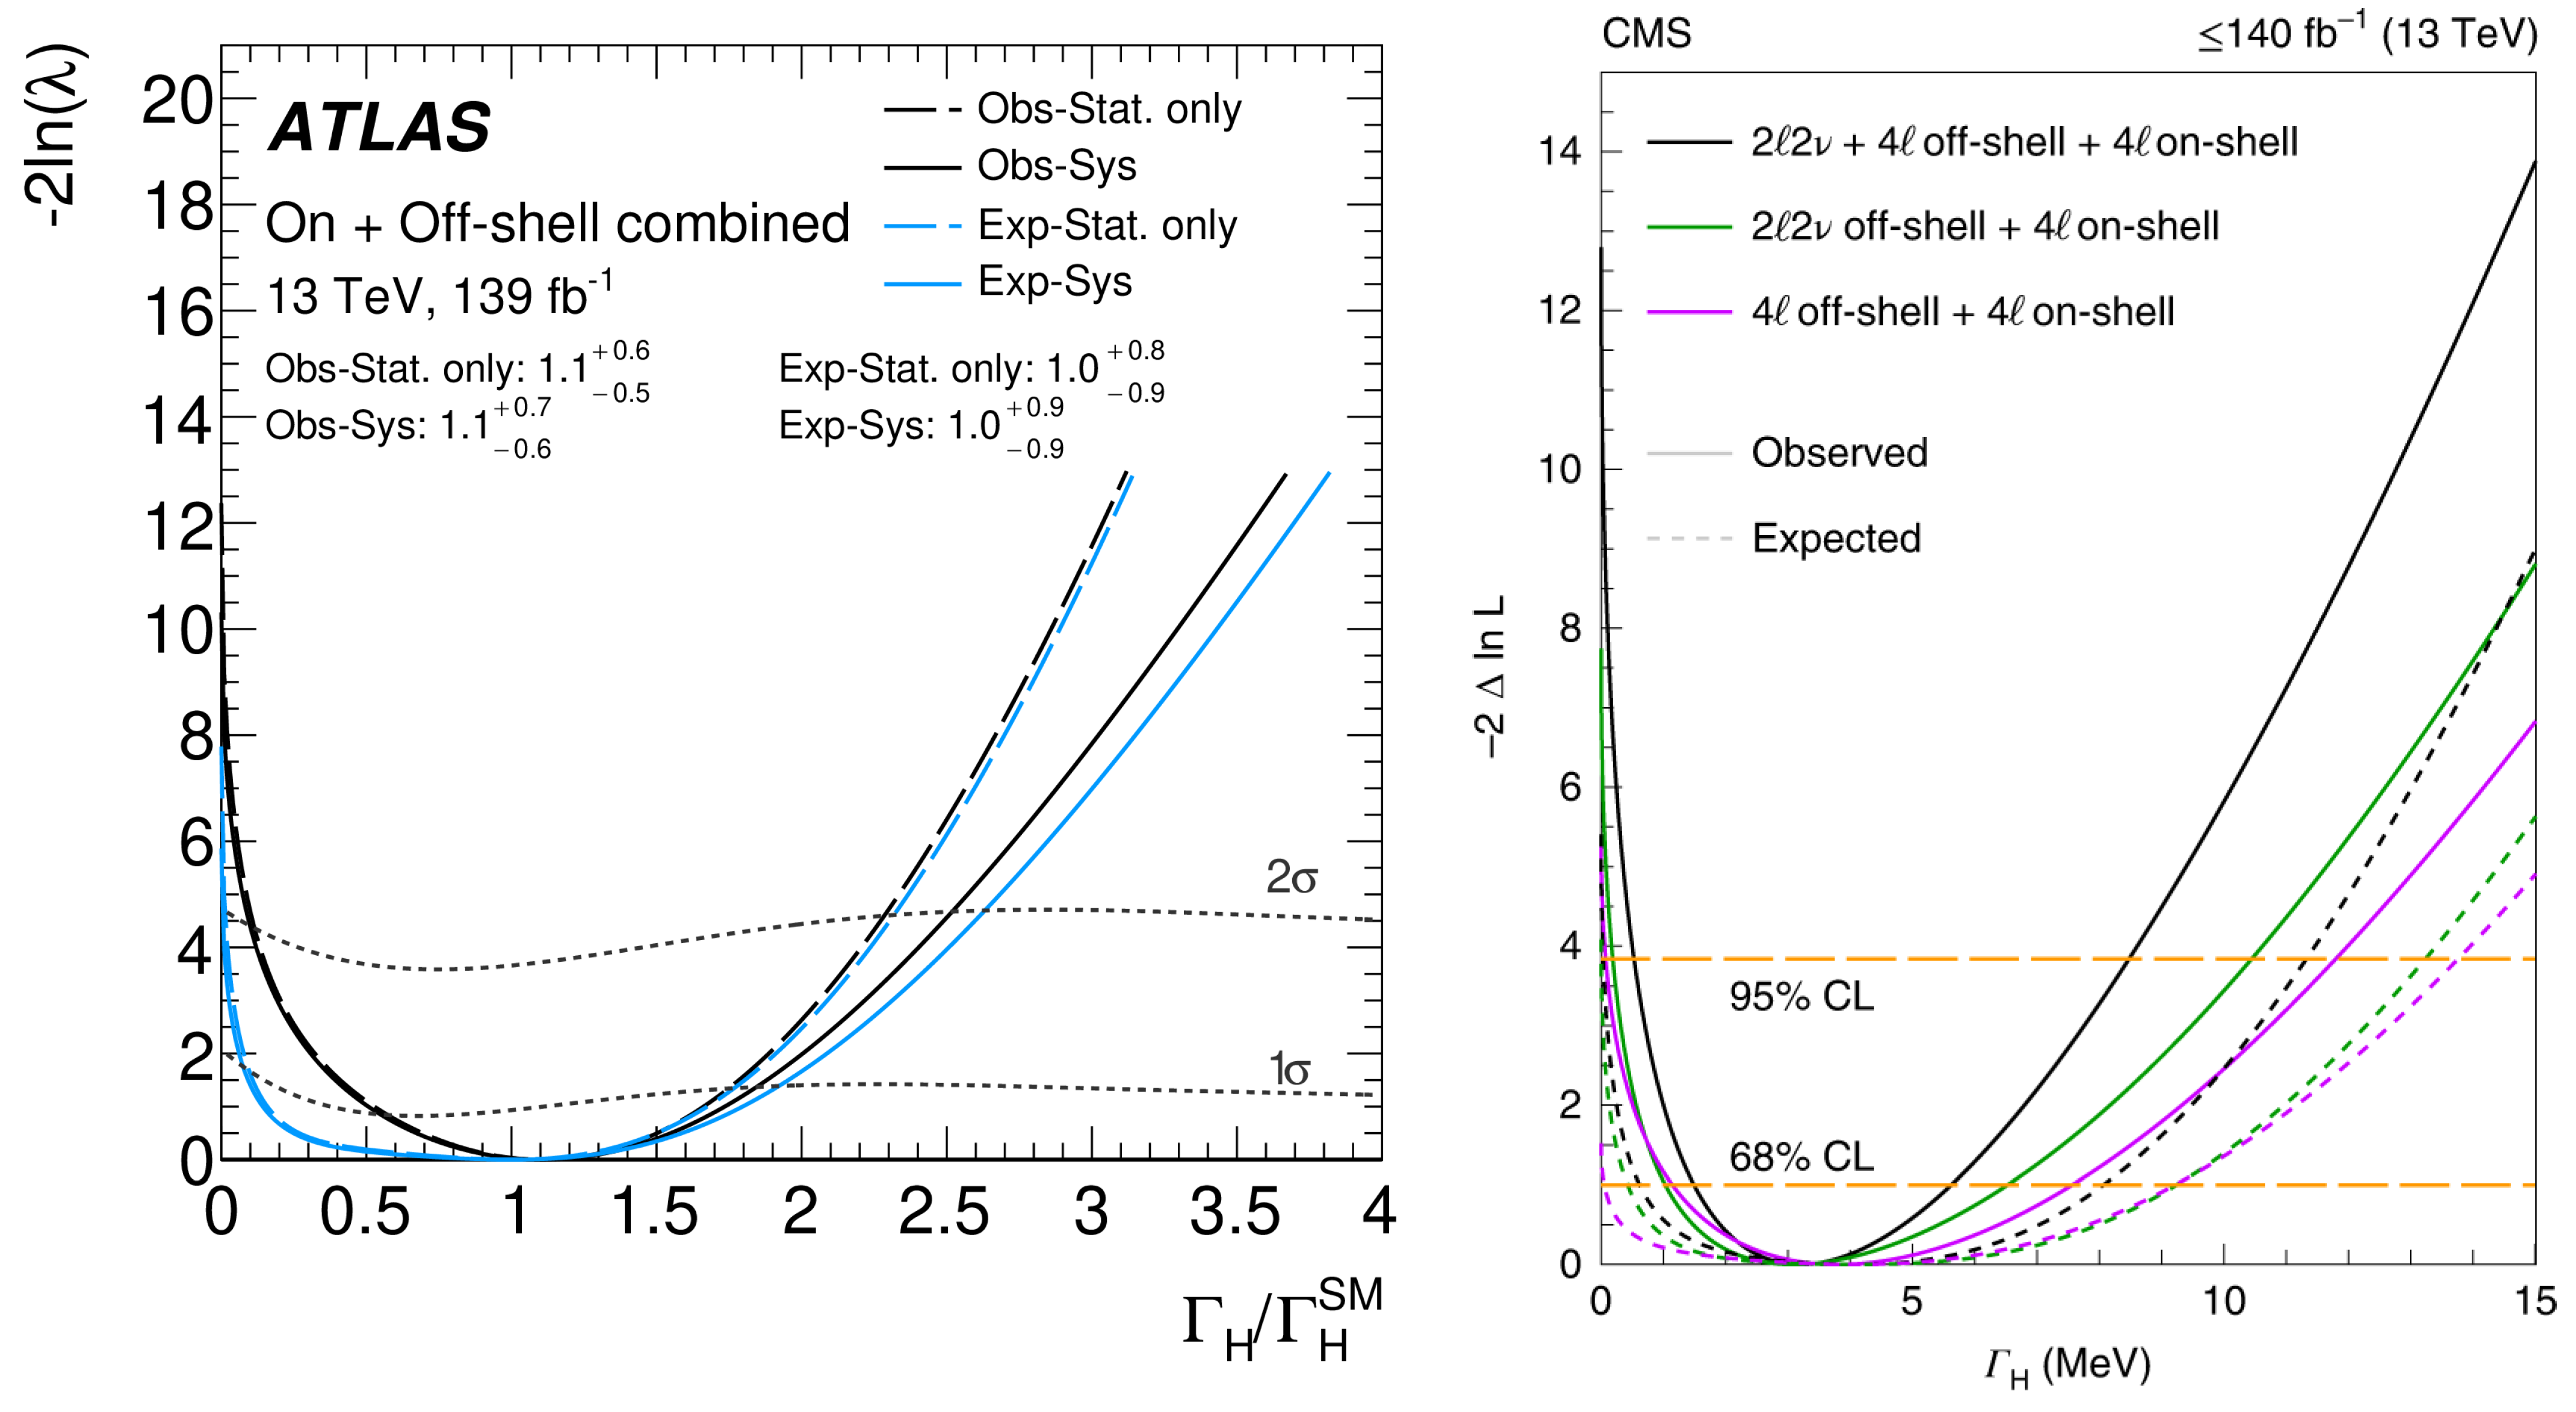
1.5. Higgs Boson Width
1.6. Higgs Boson Properties
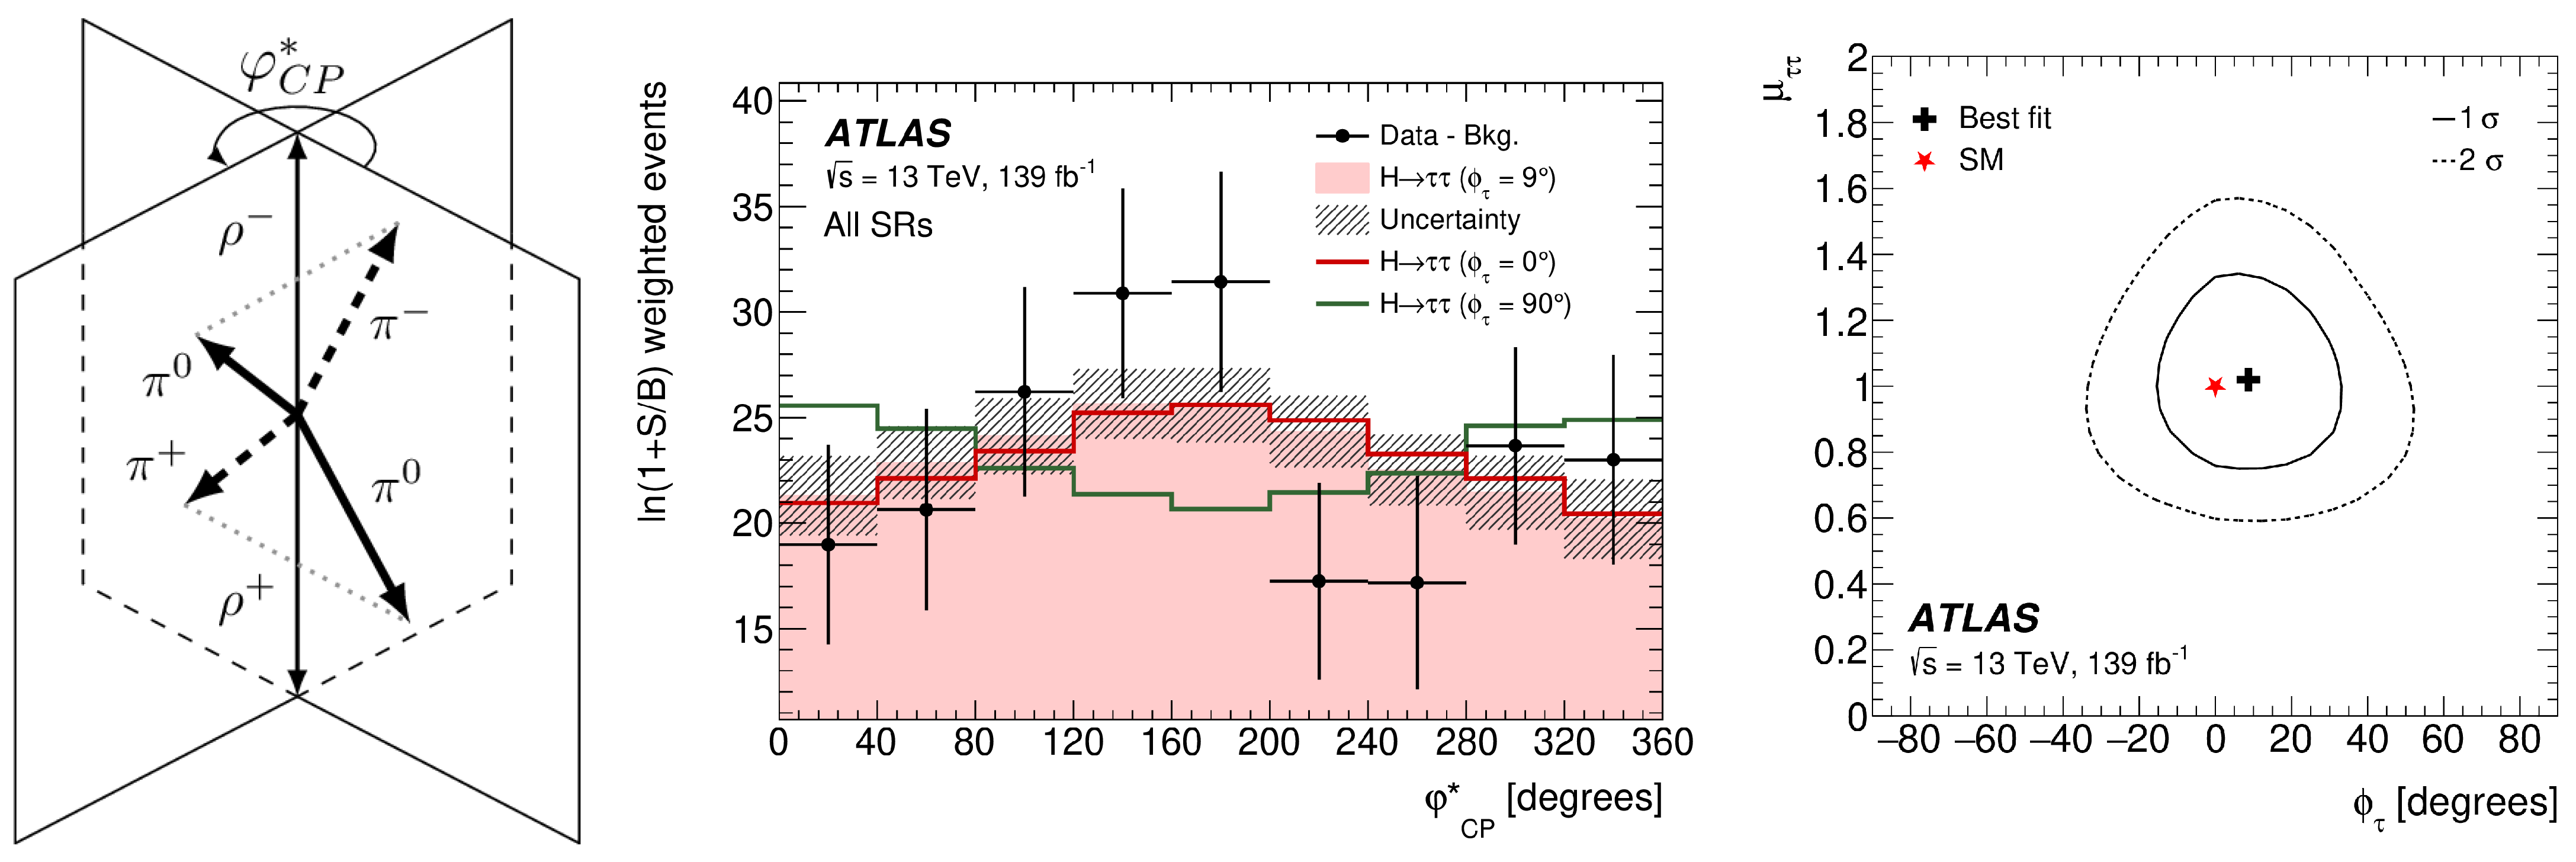
2. Higgs Boson Decay
2.1.
2.2.
2.3.
2.4.
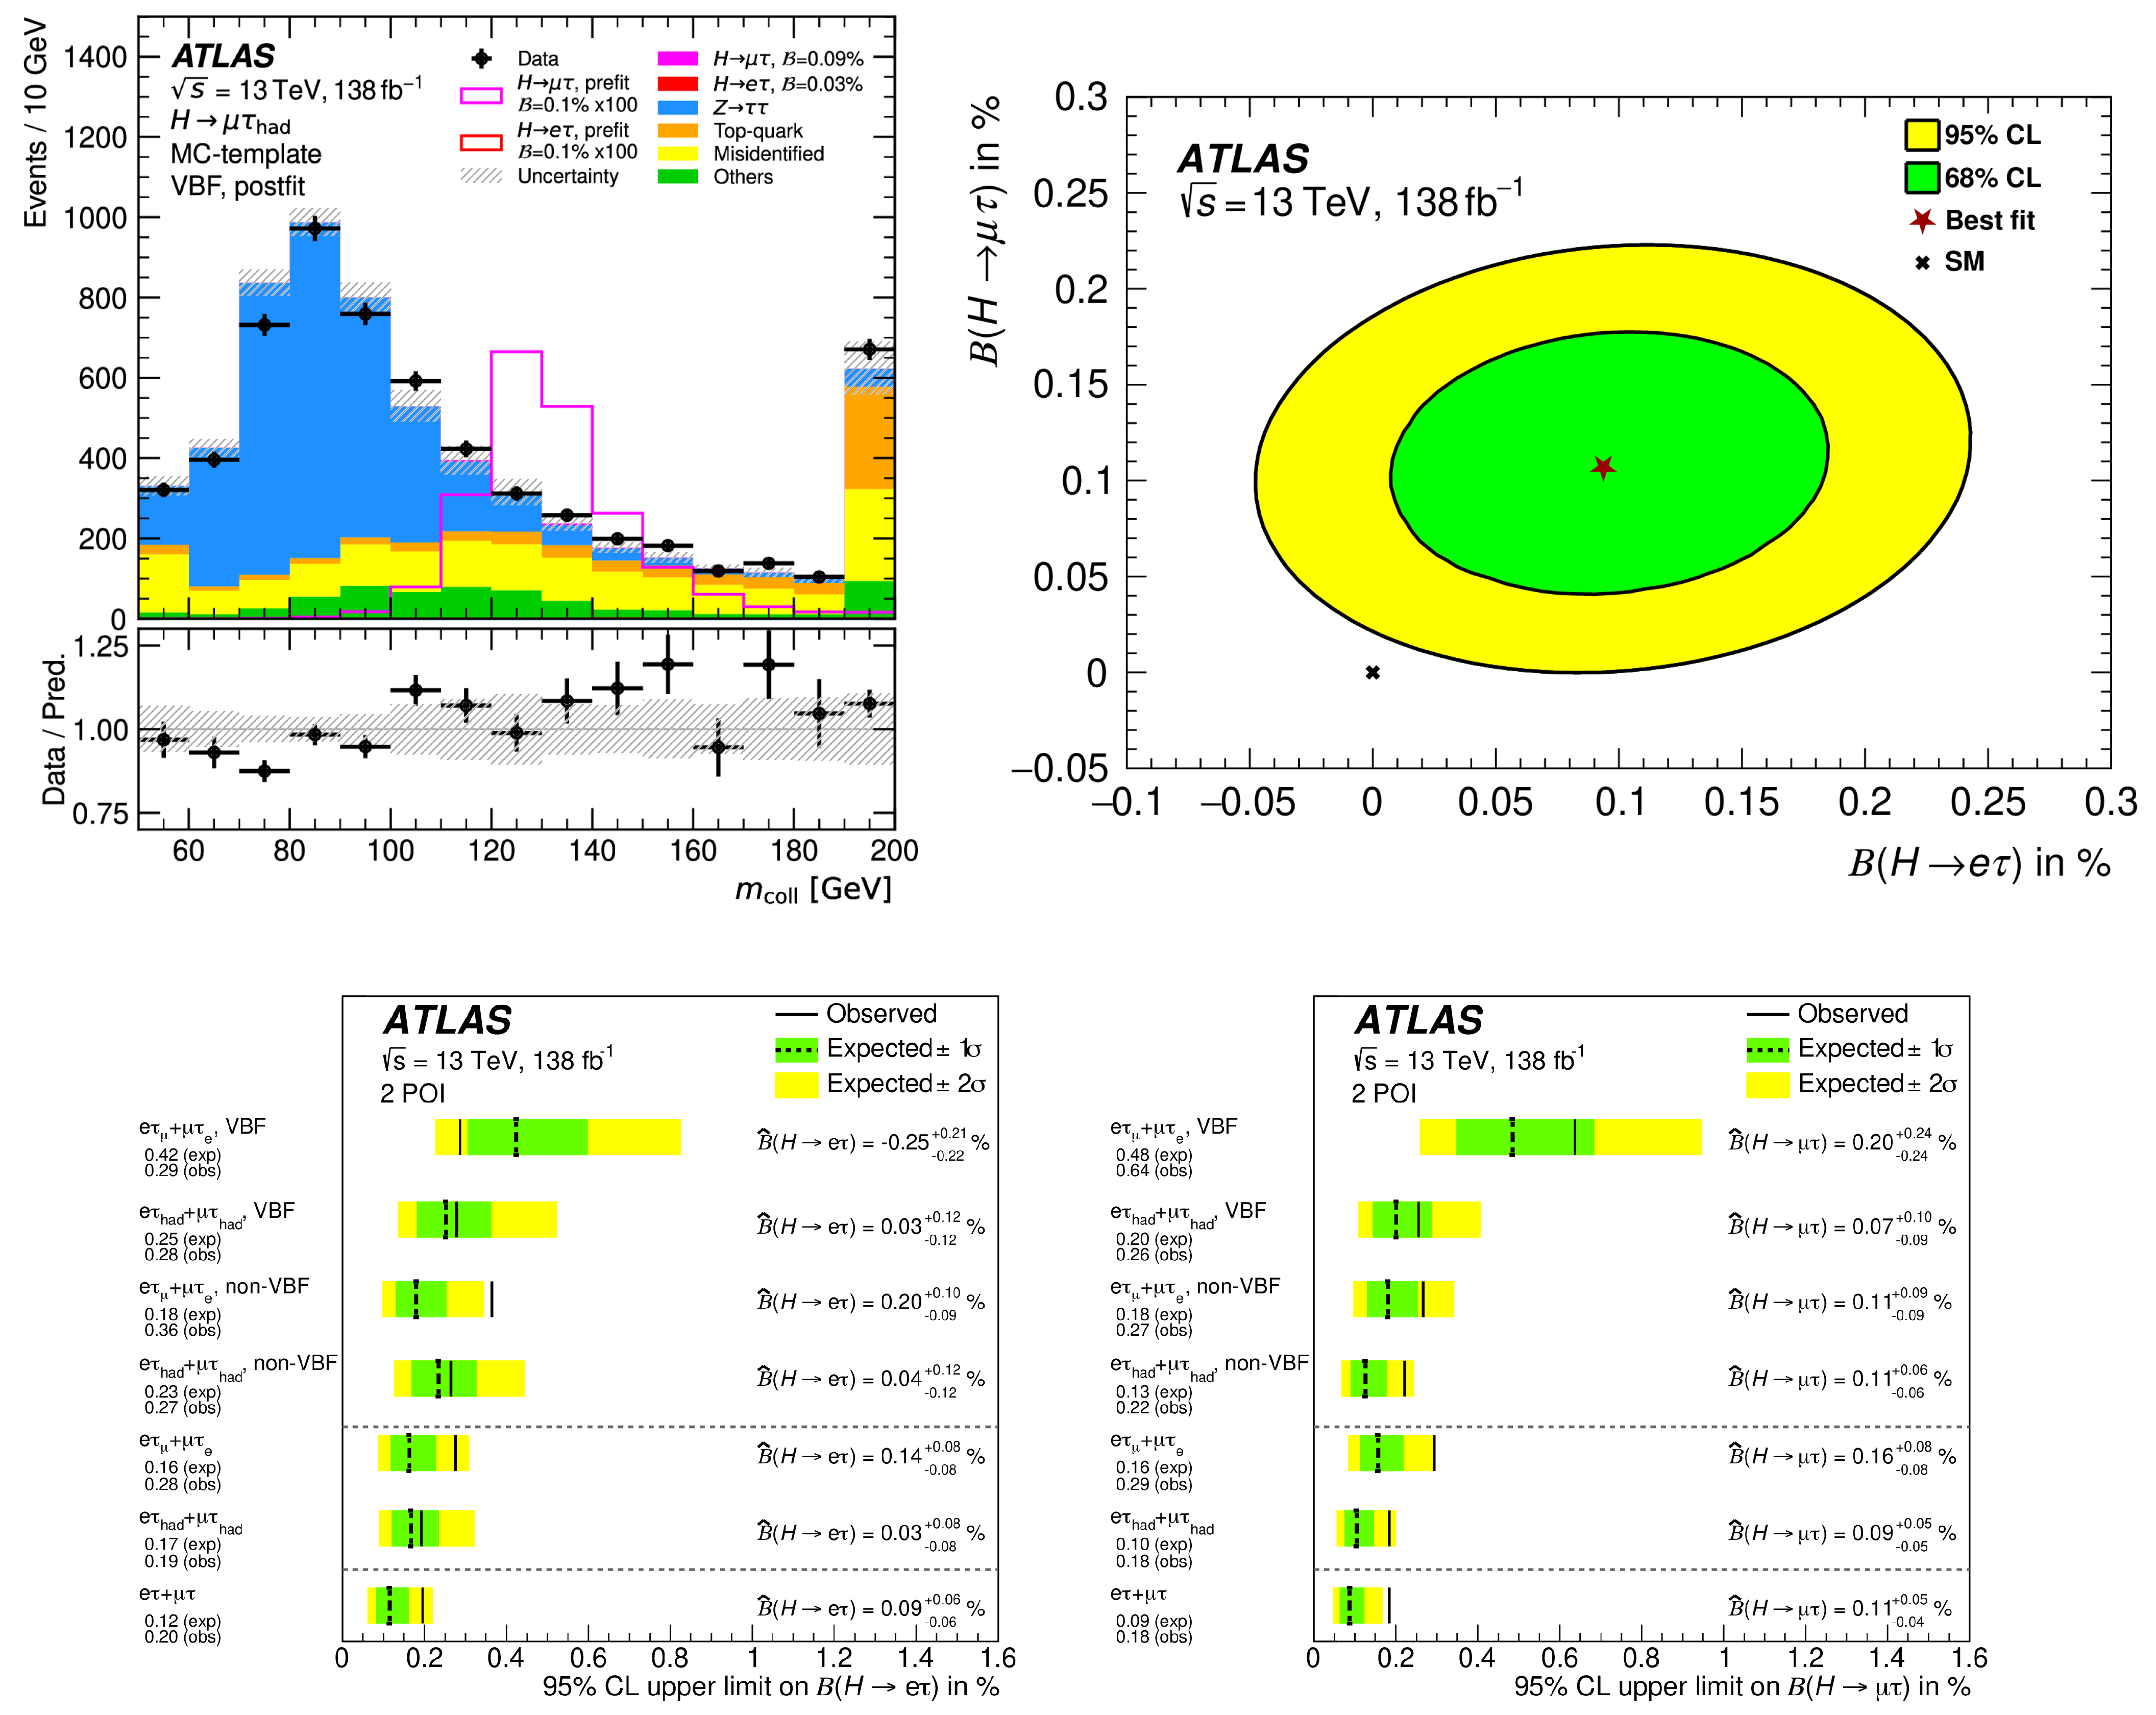
2.5. Lepton Flavor Violation (LFV)
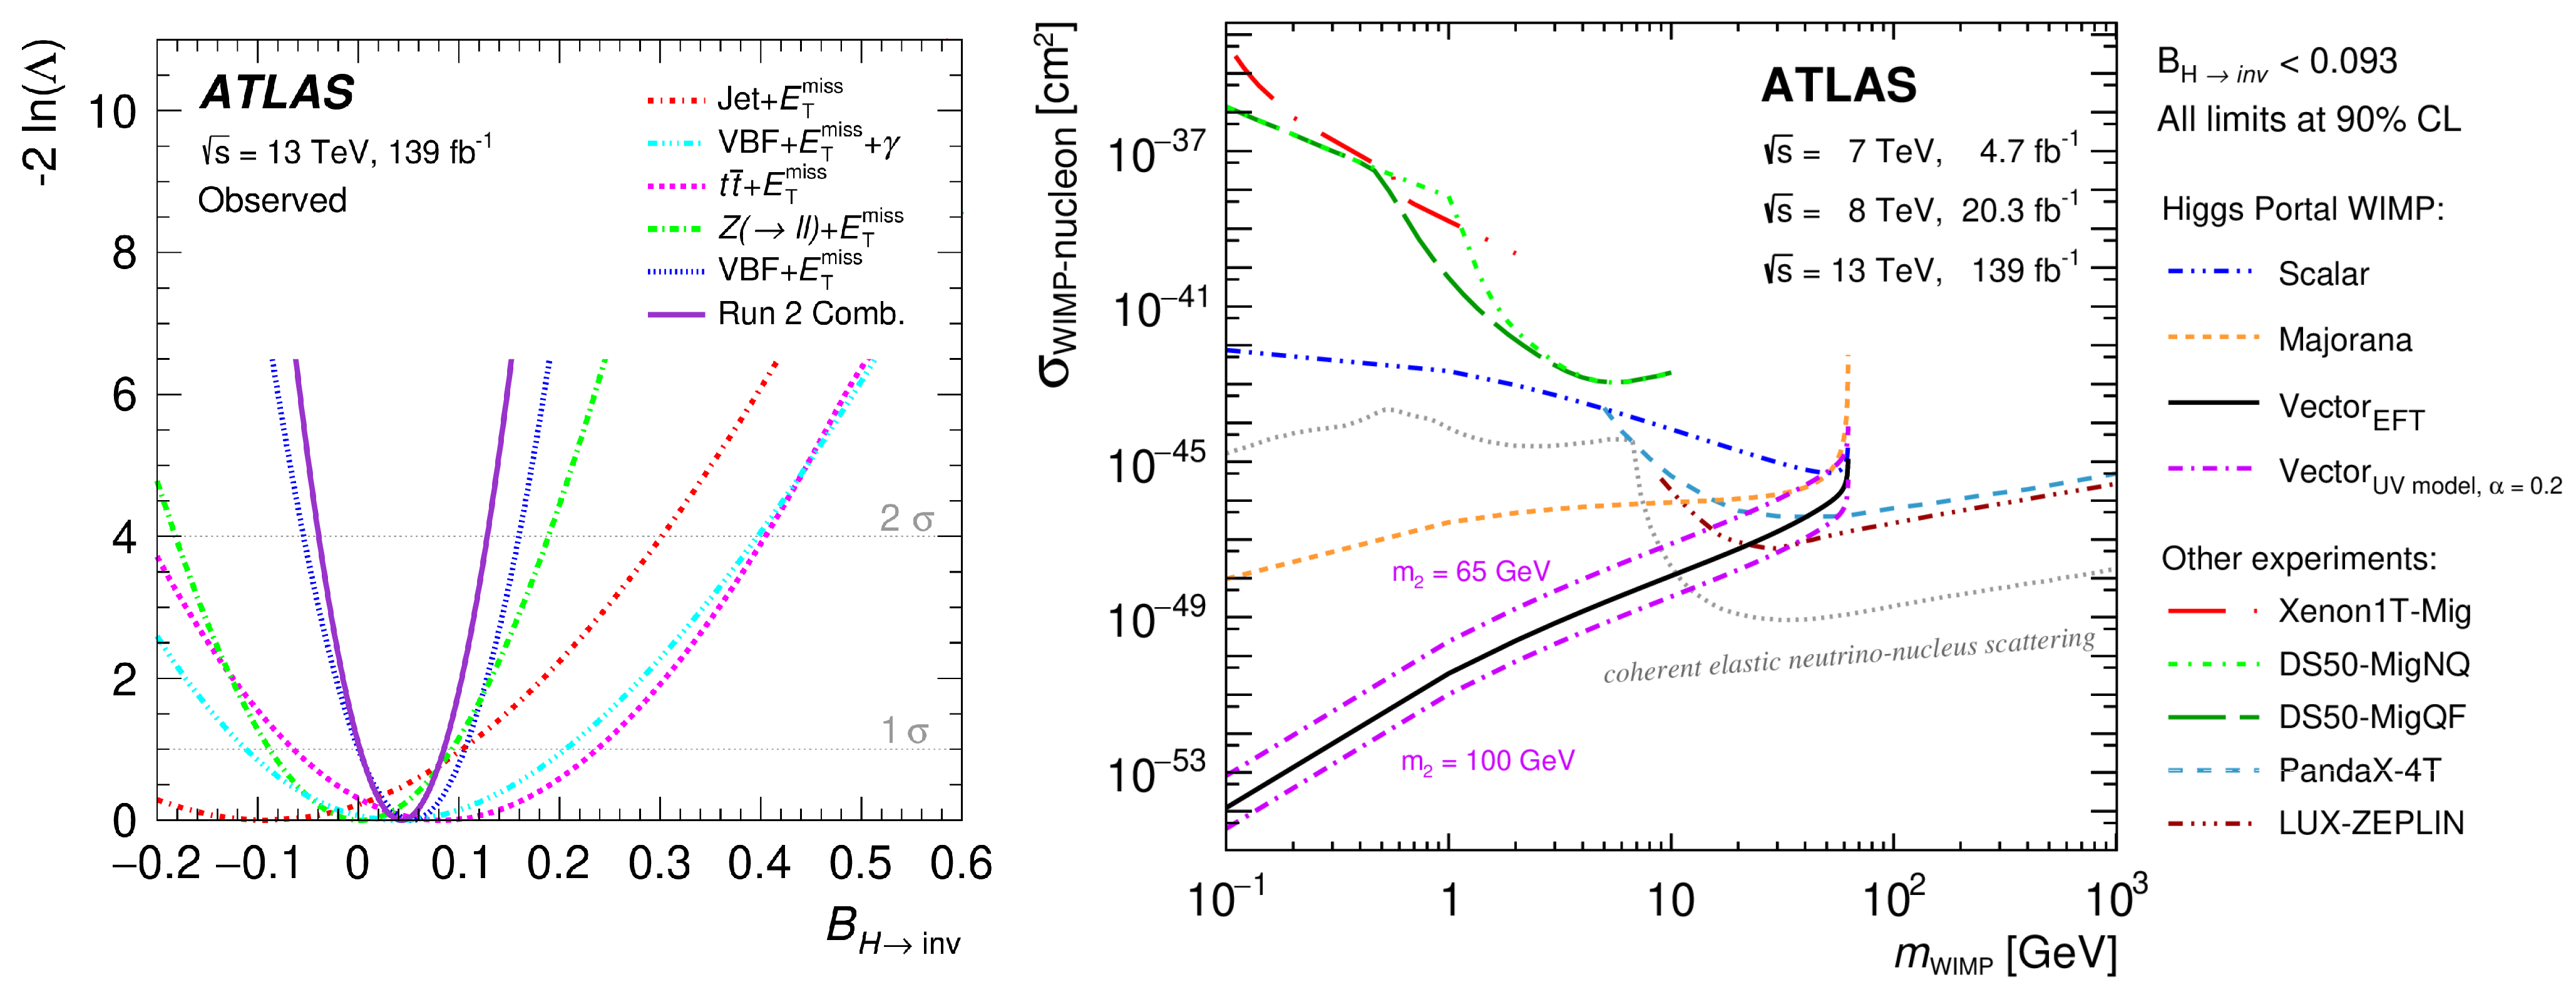
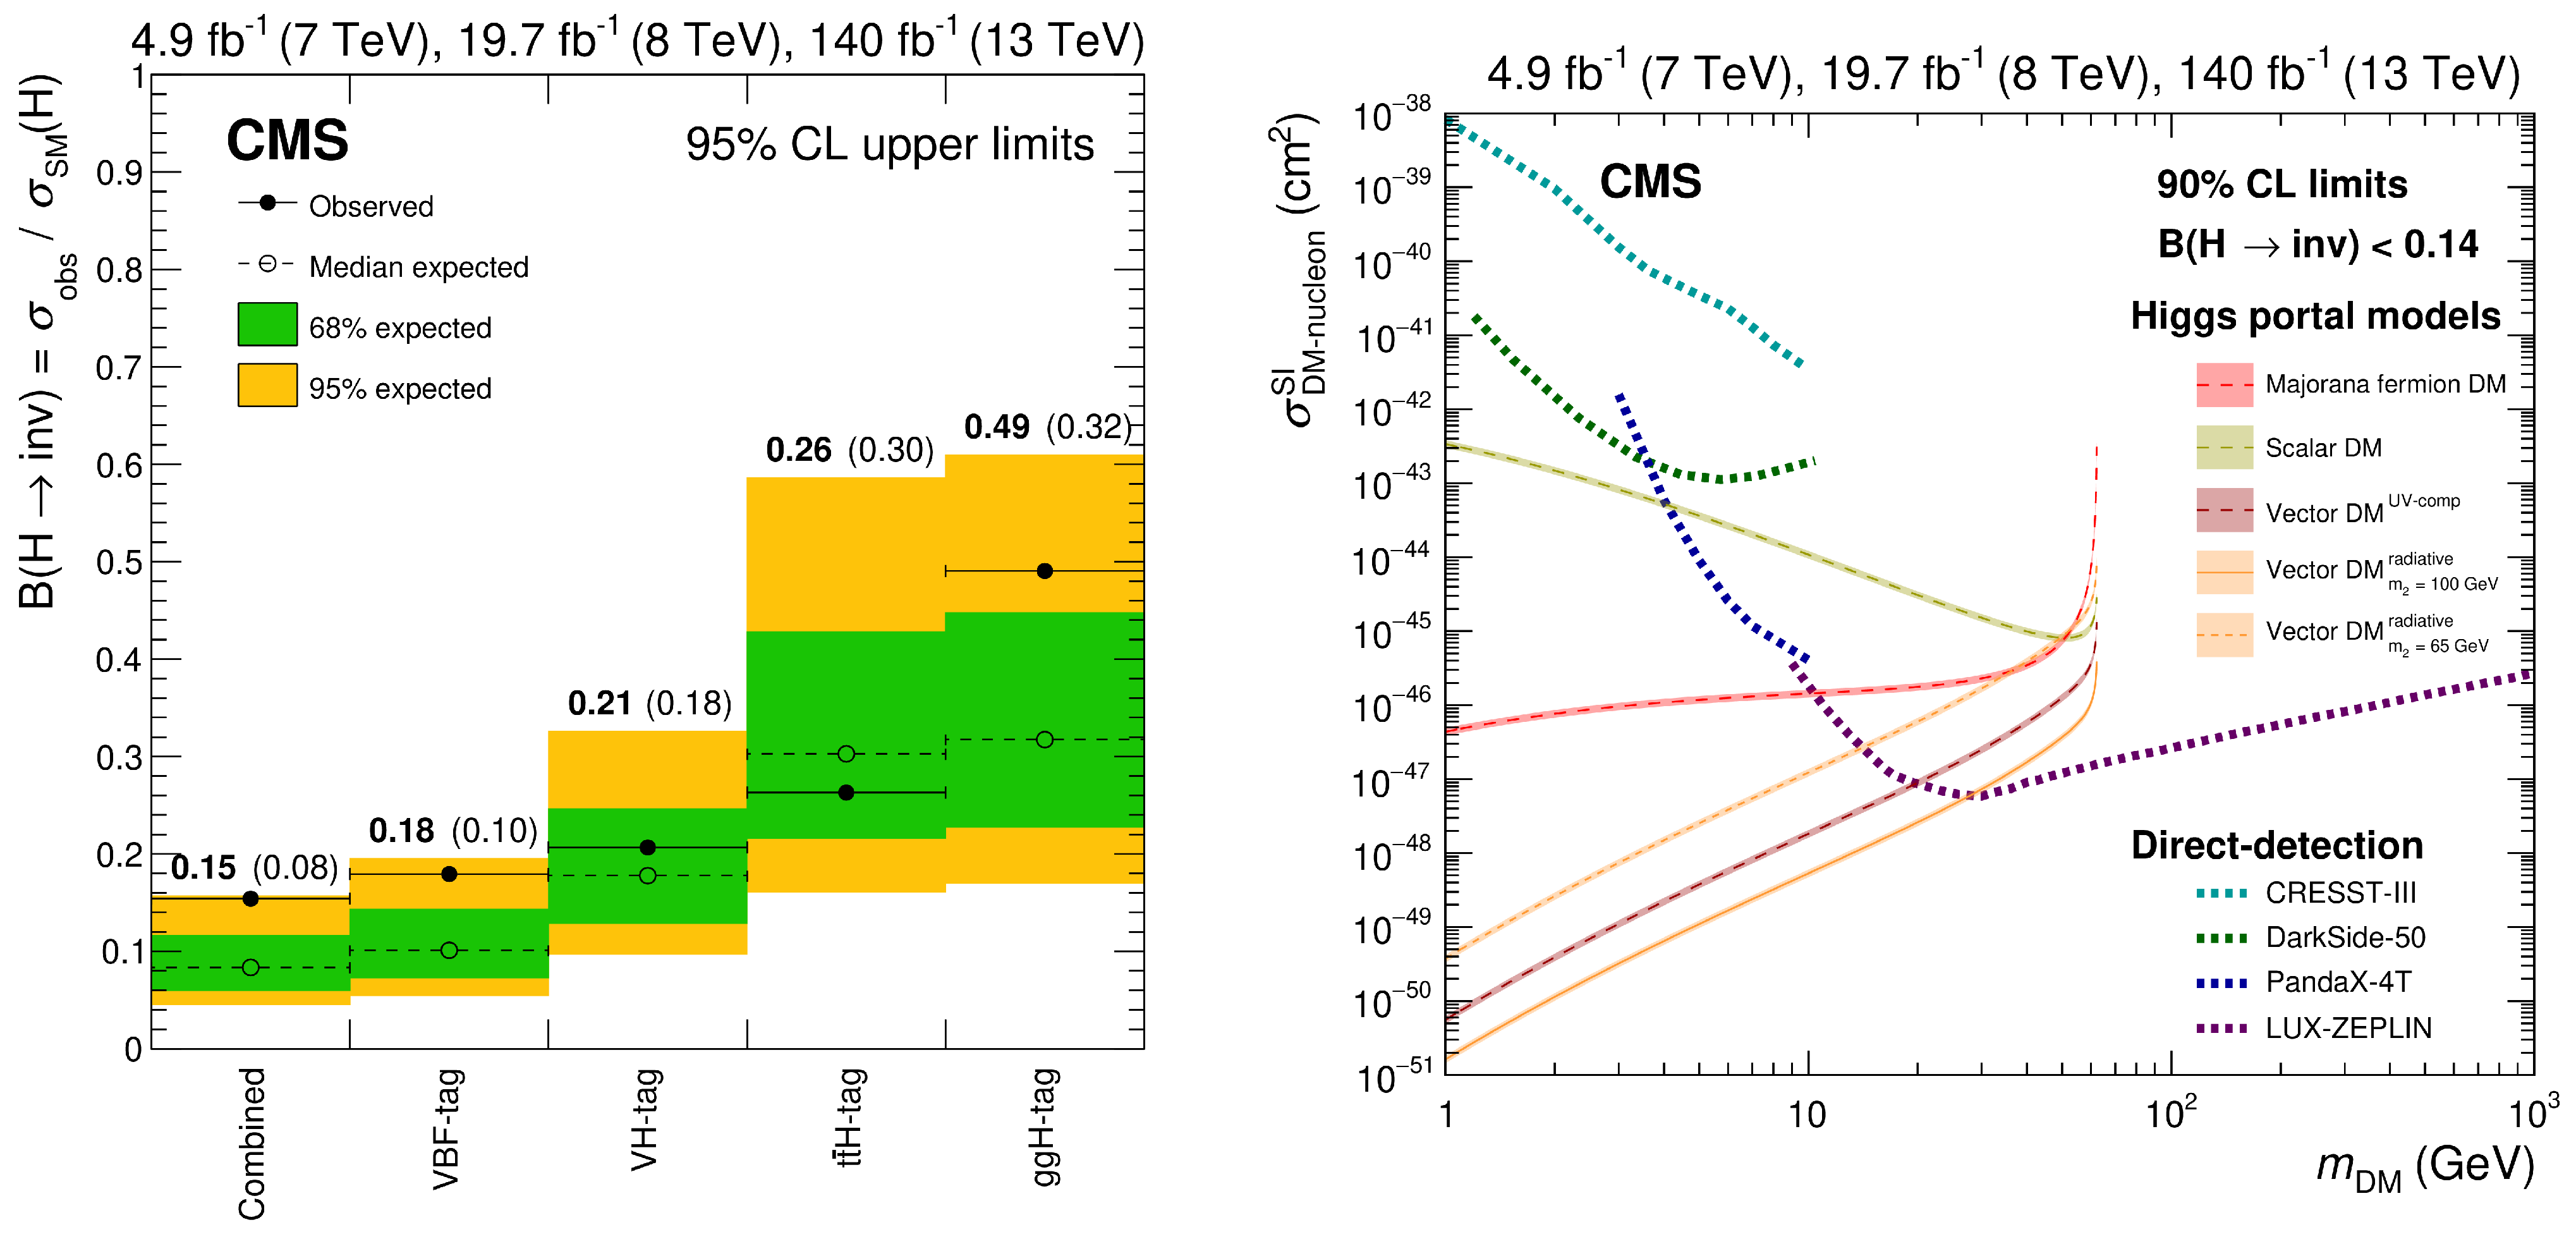
2.6. Invisible Decays
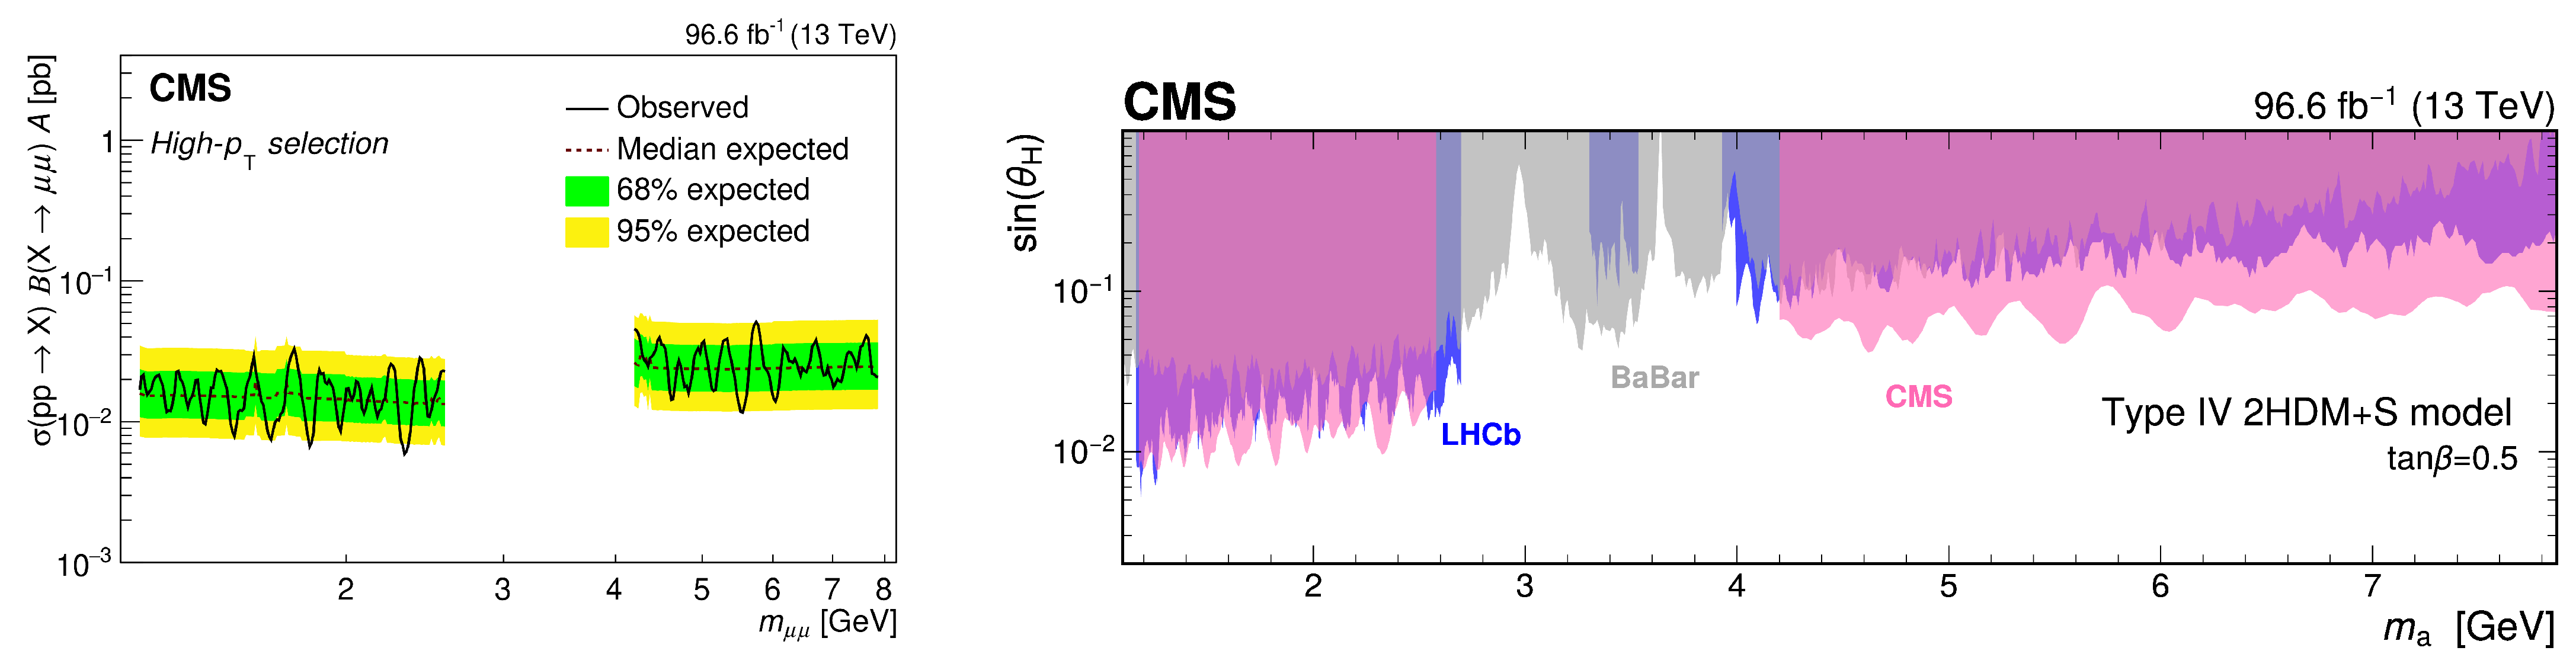
2.7. Dark Photons
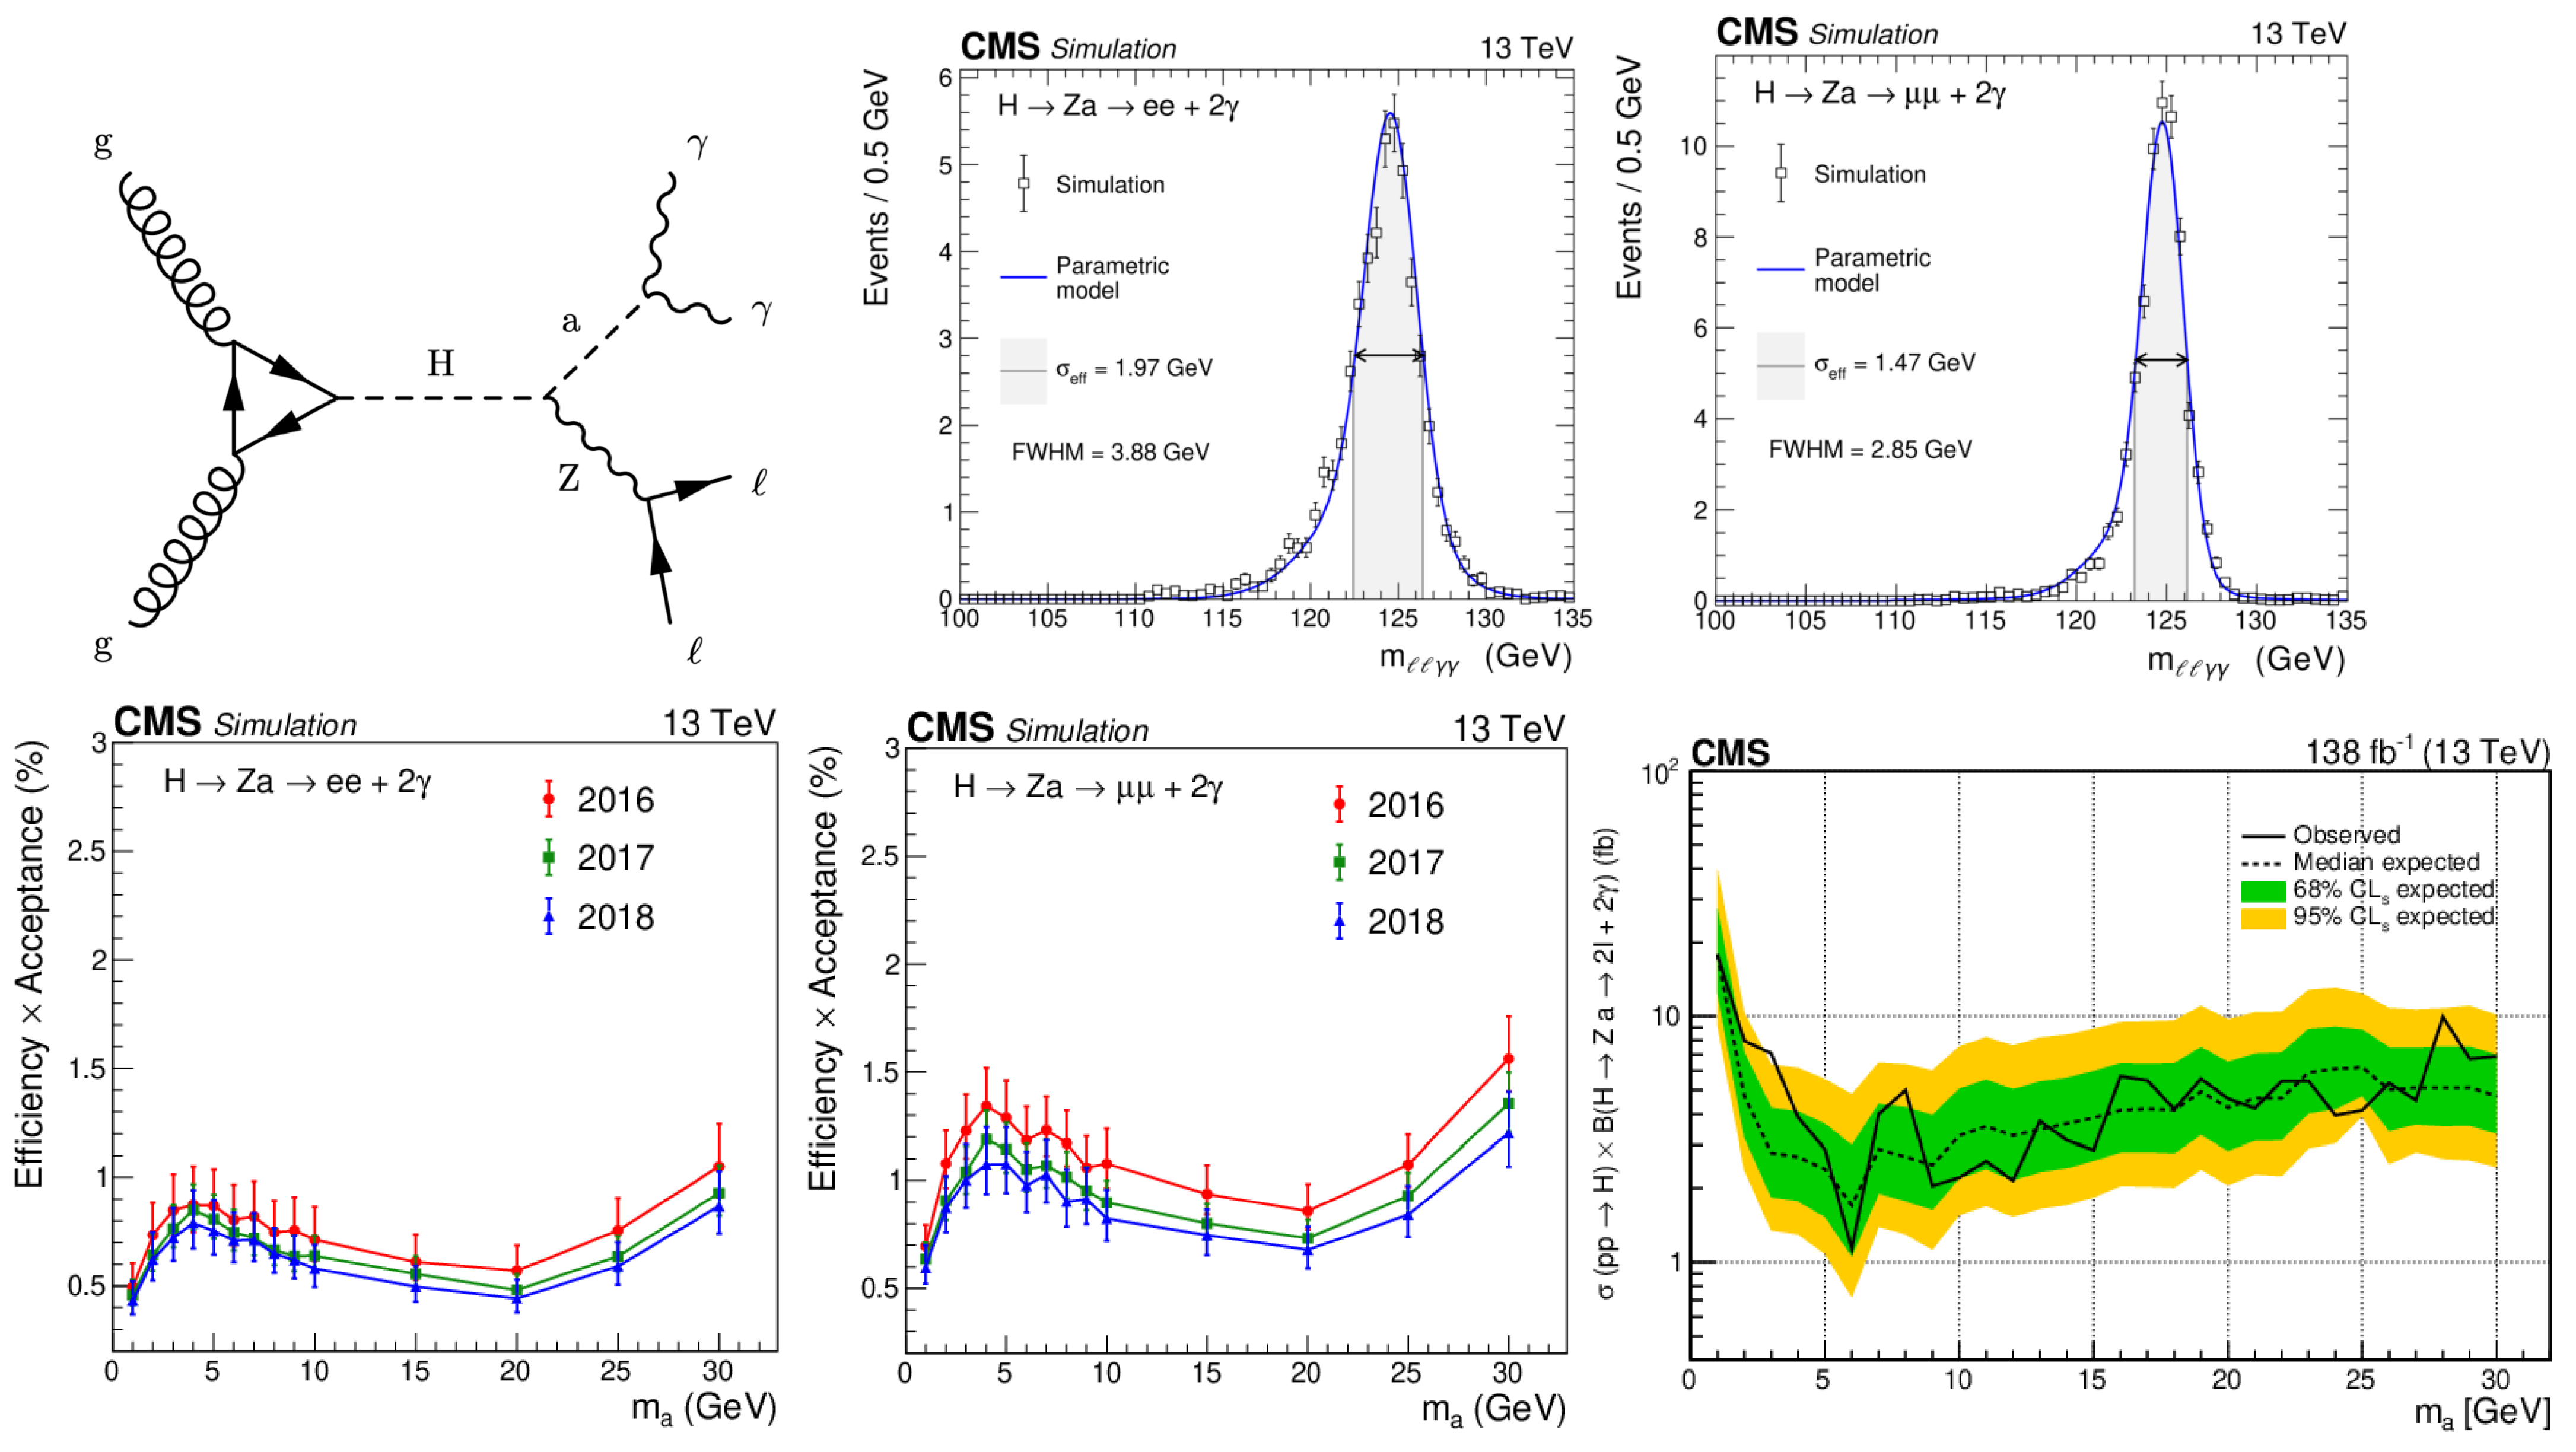
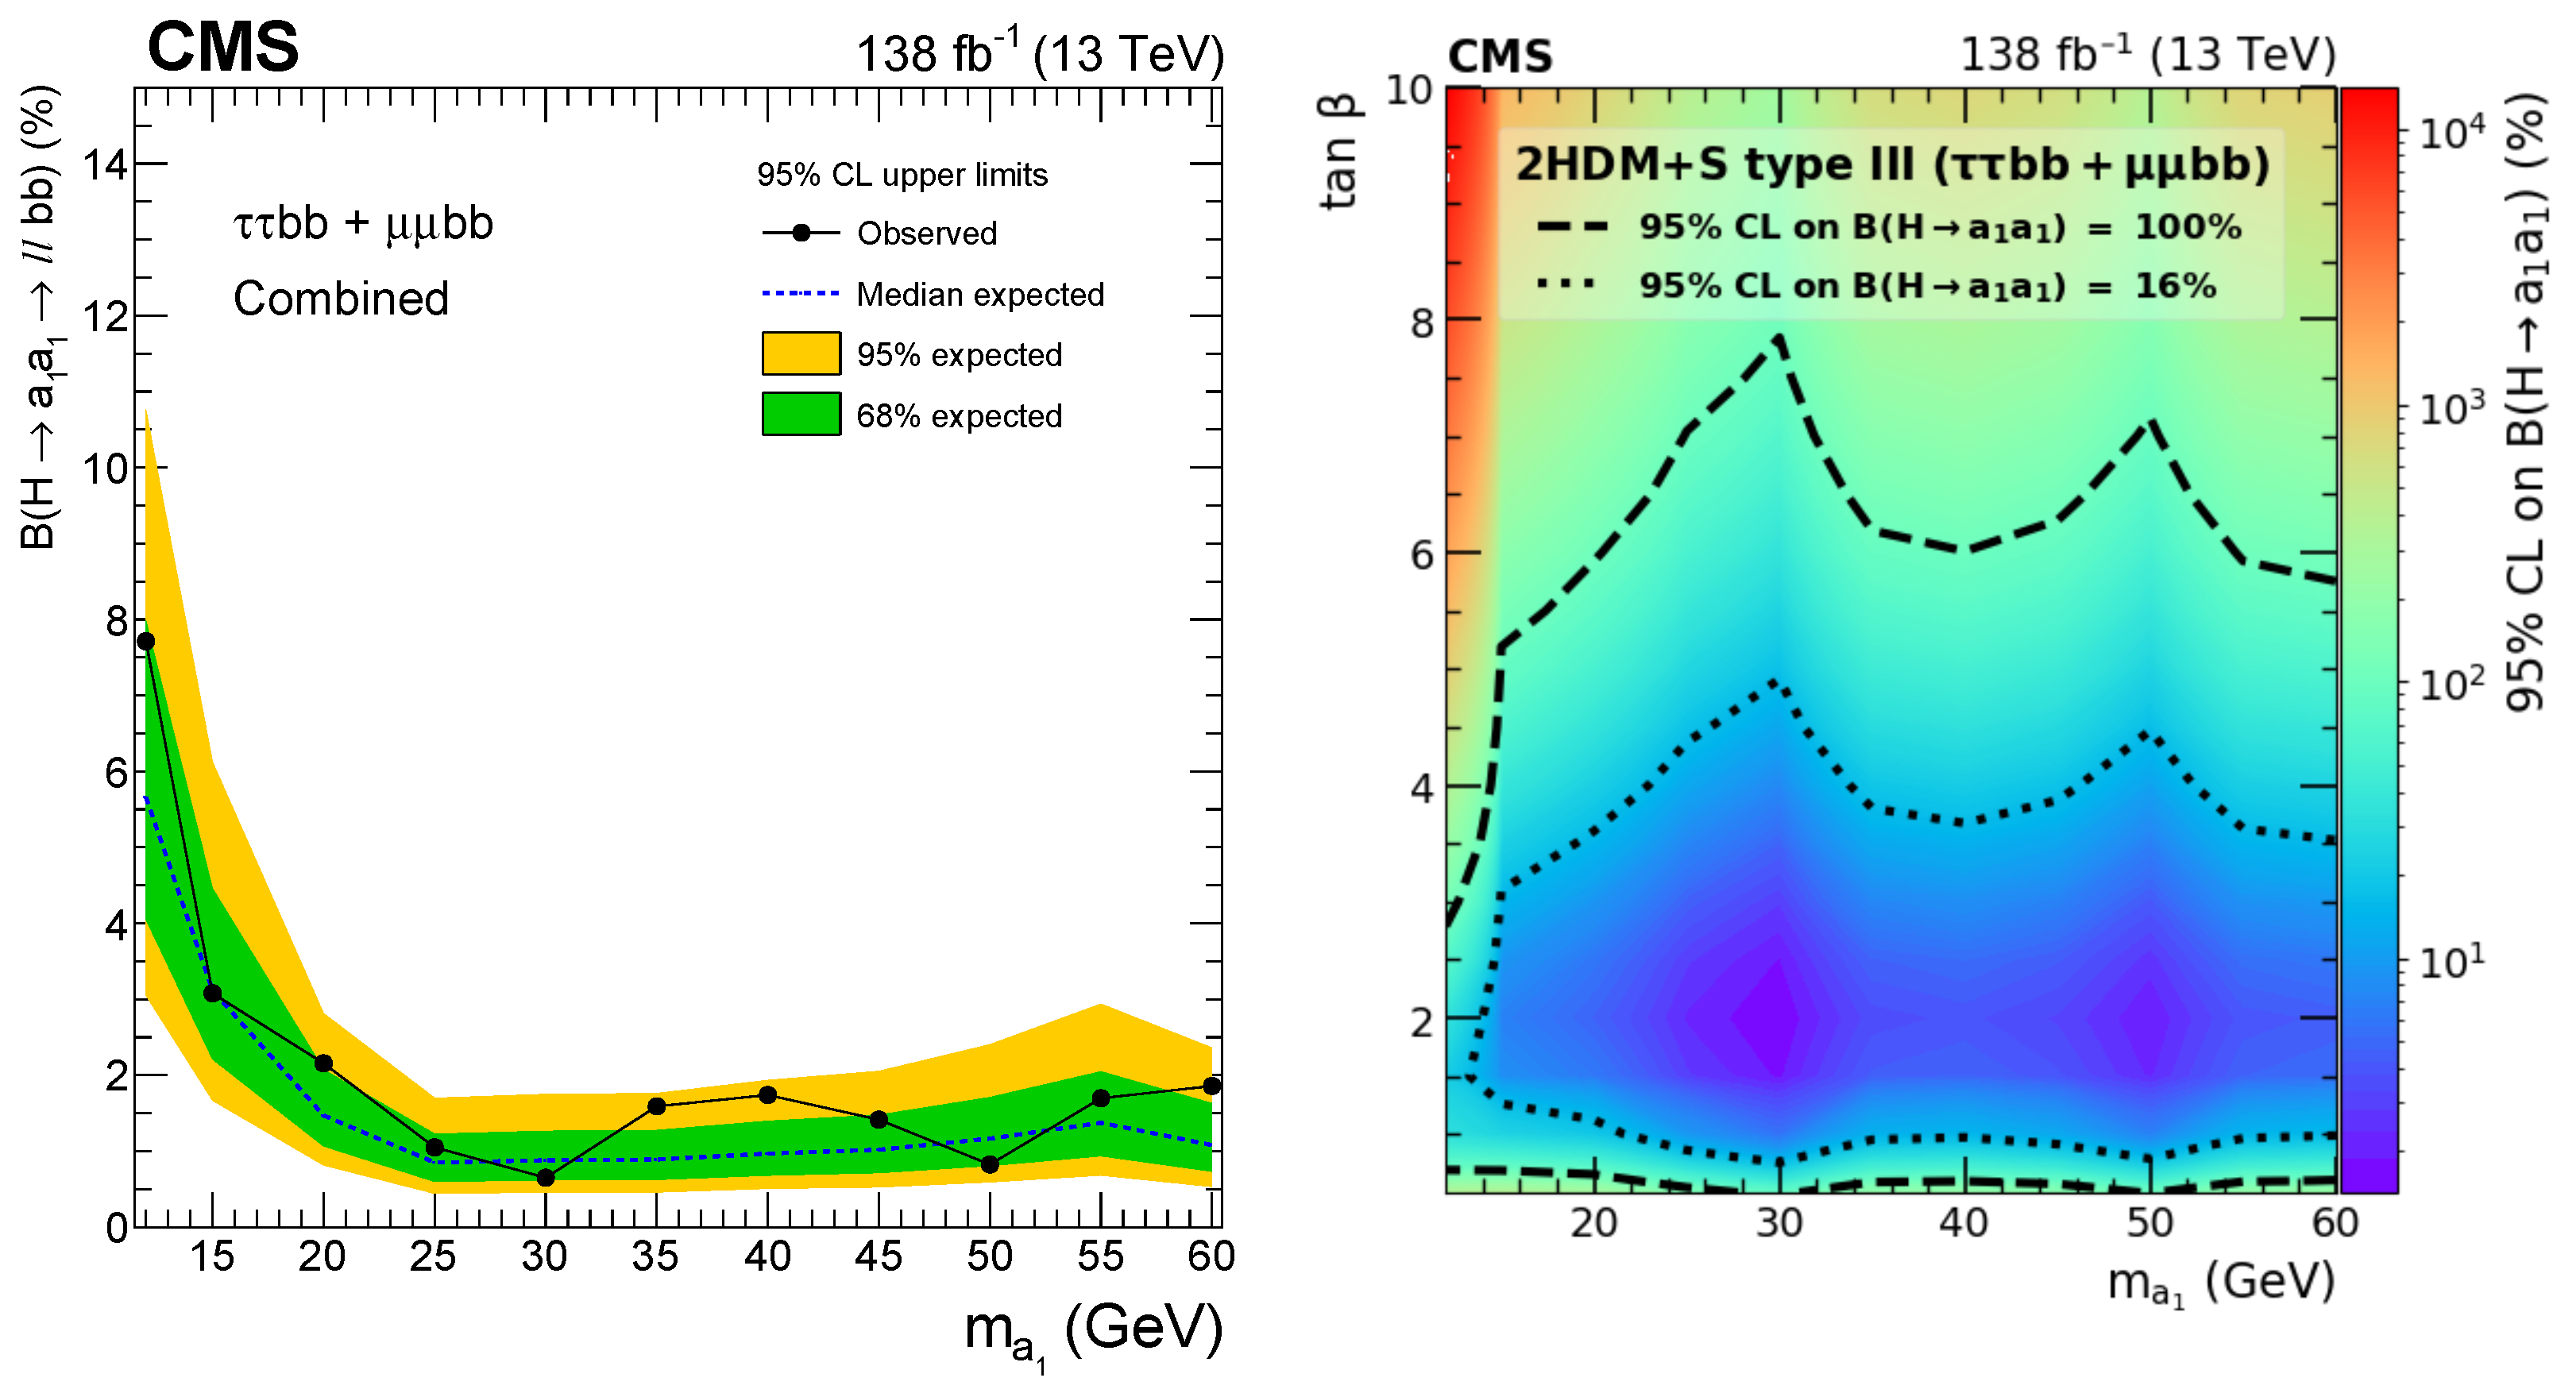
2.8. Exotic Scalar Particles
3. Enhanced Production Modes
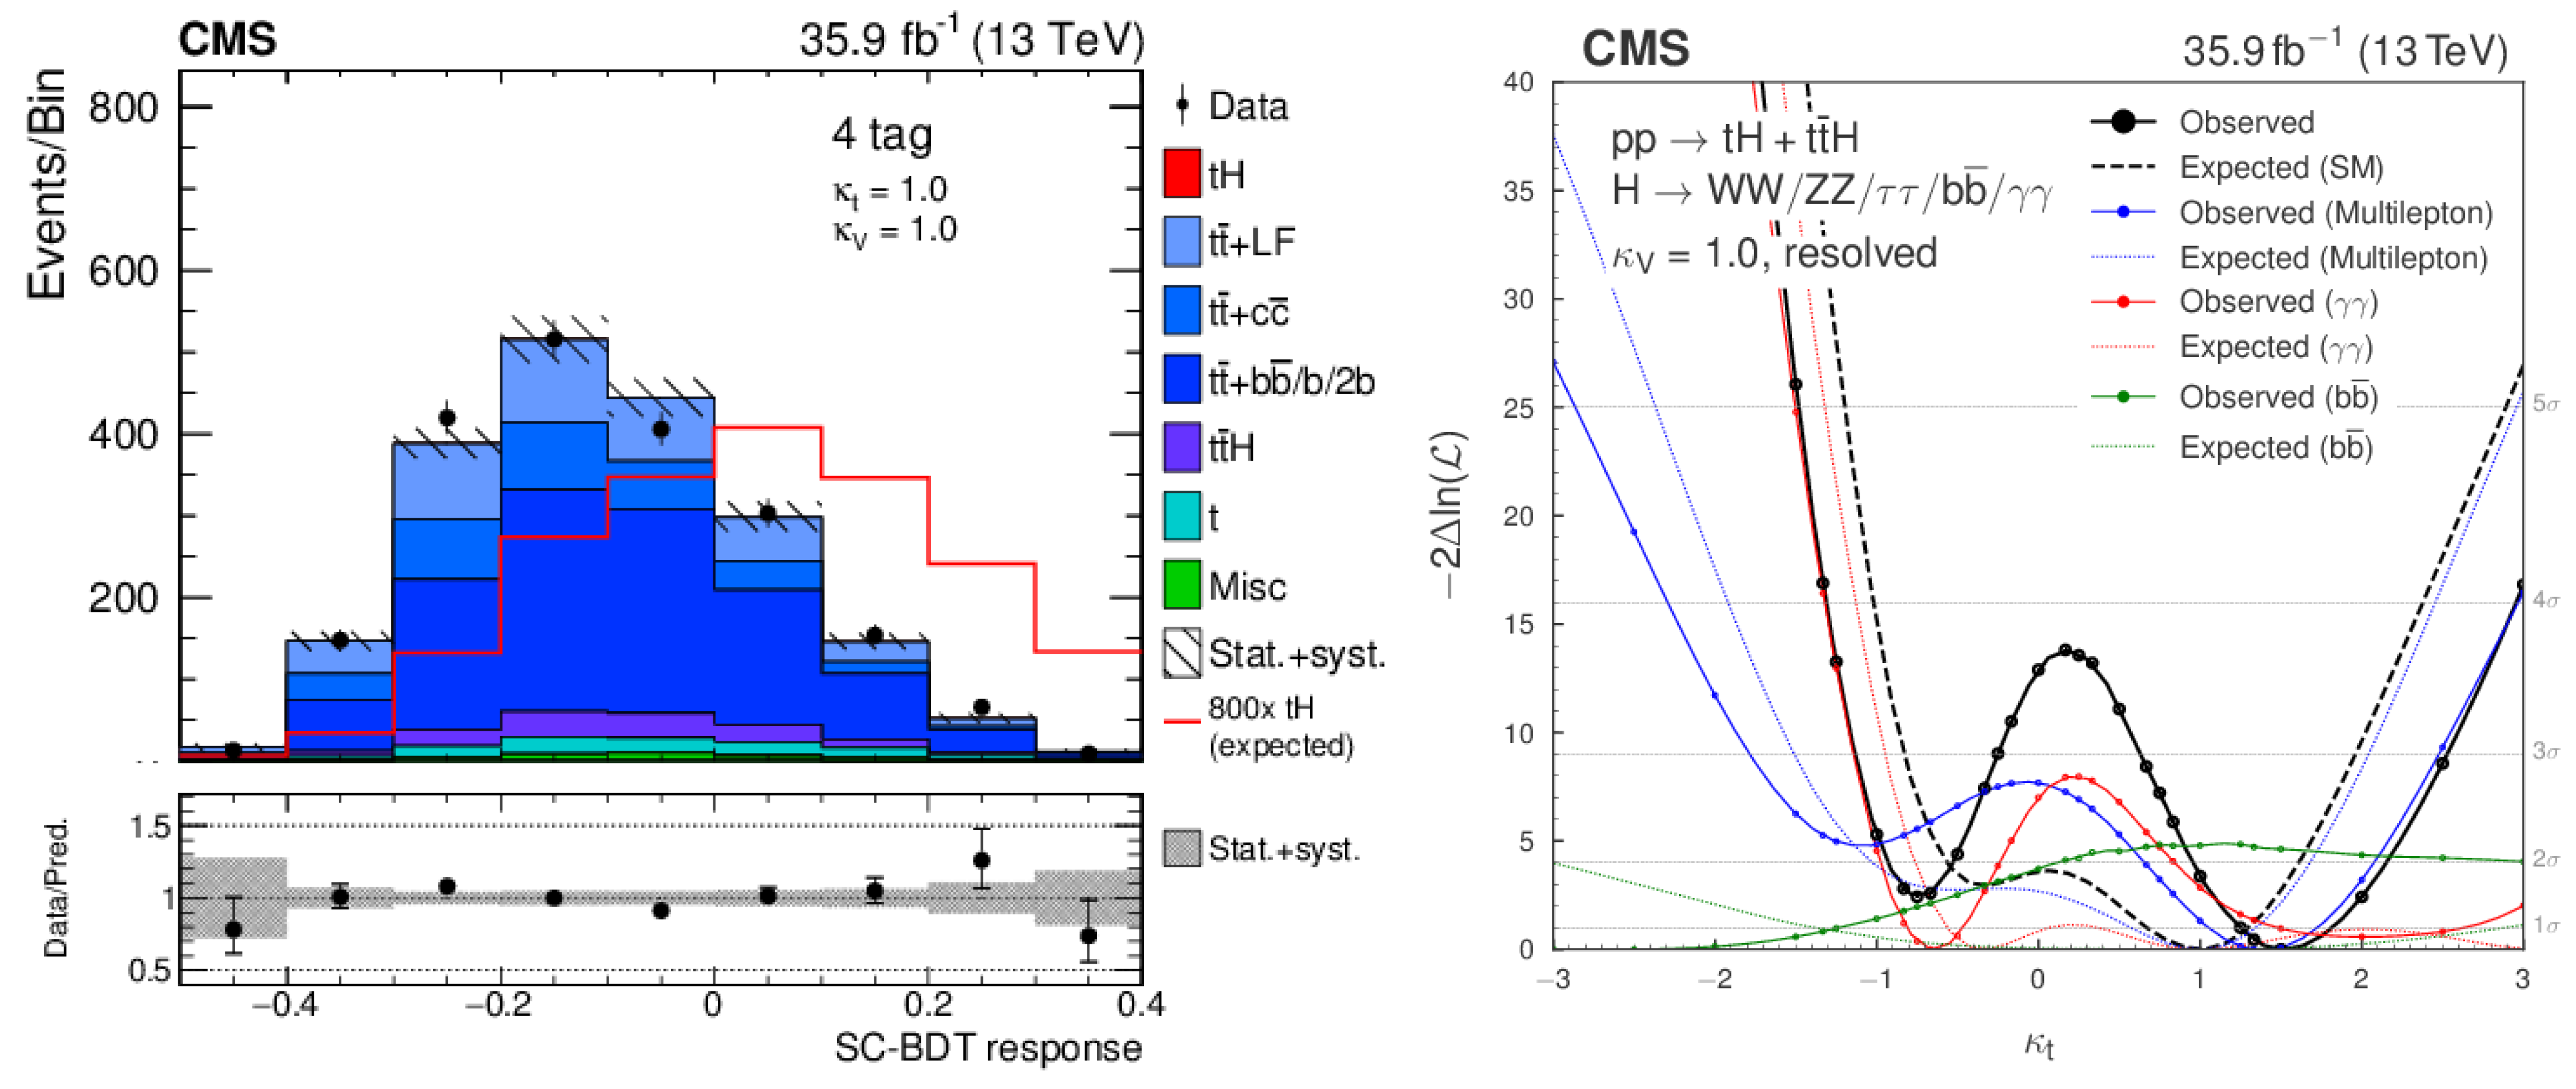
3.1. Single Top Higgs
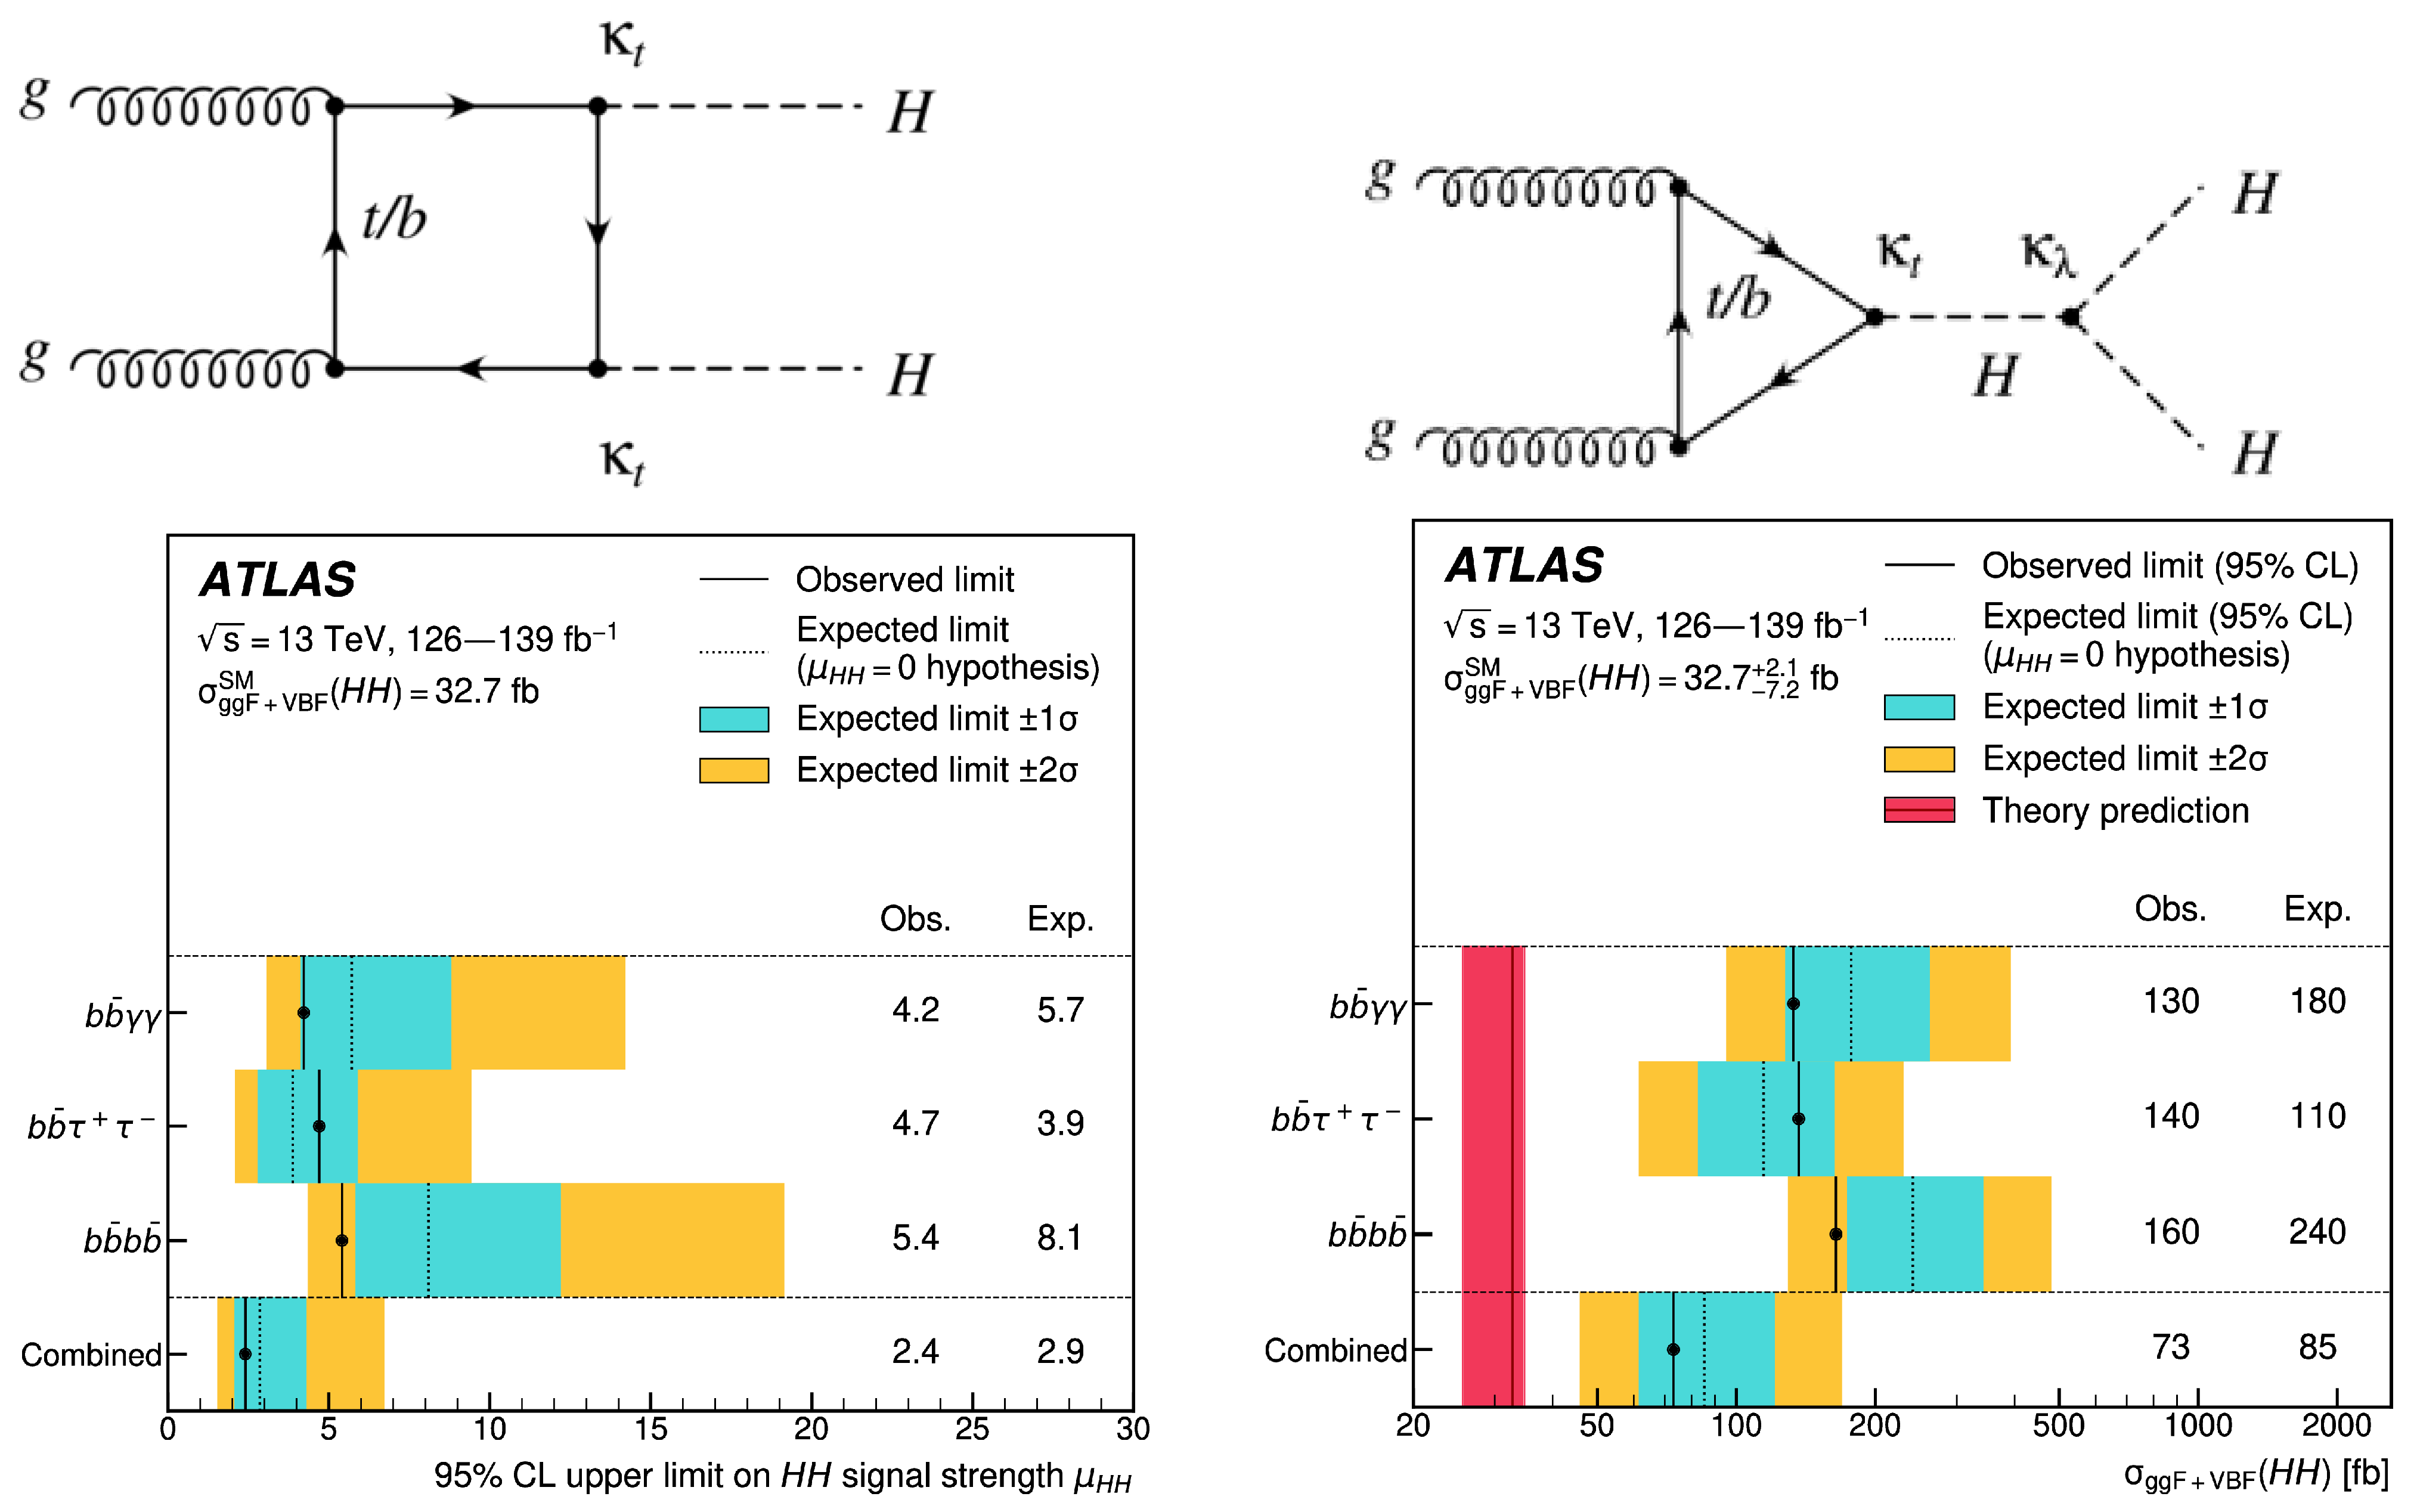
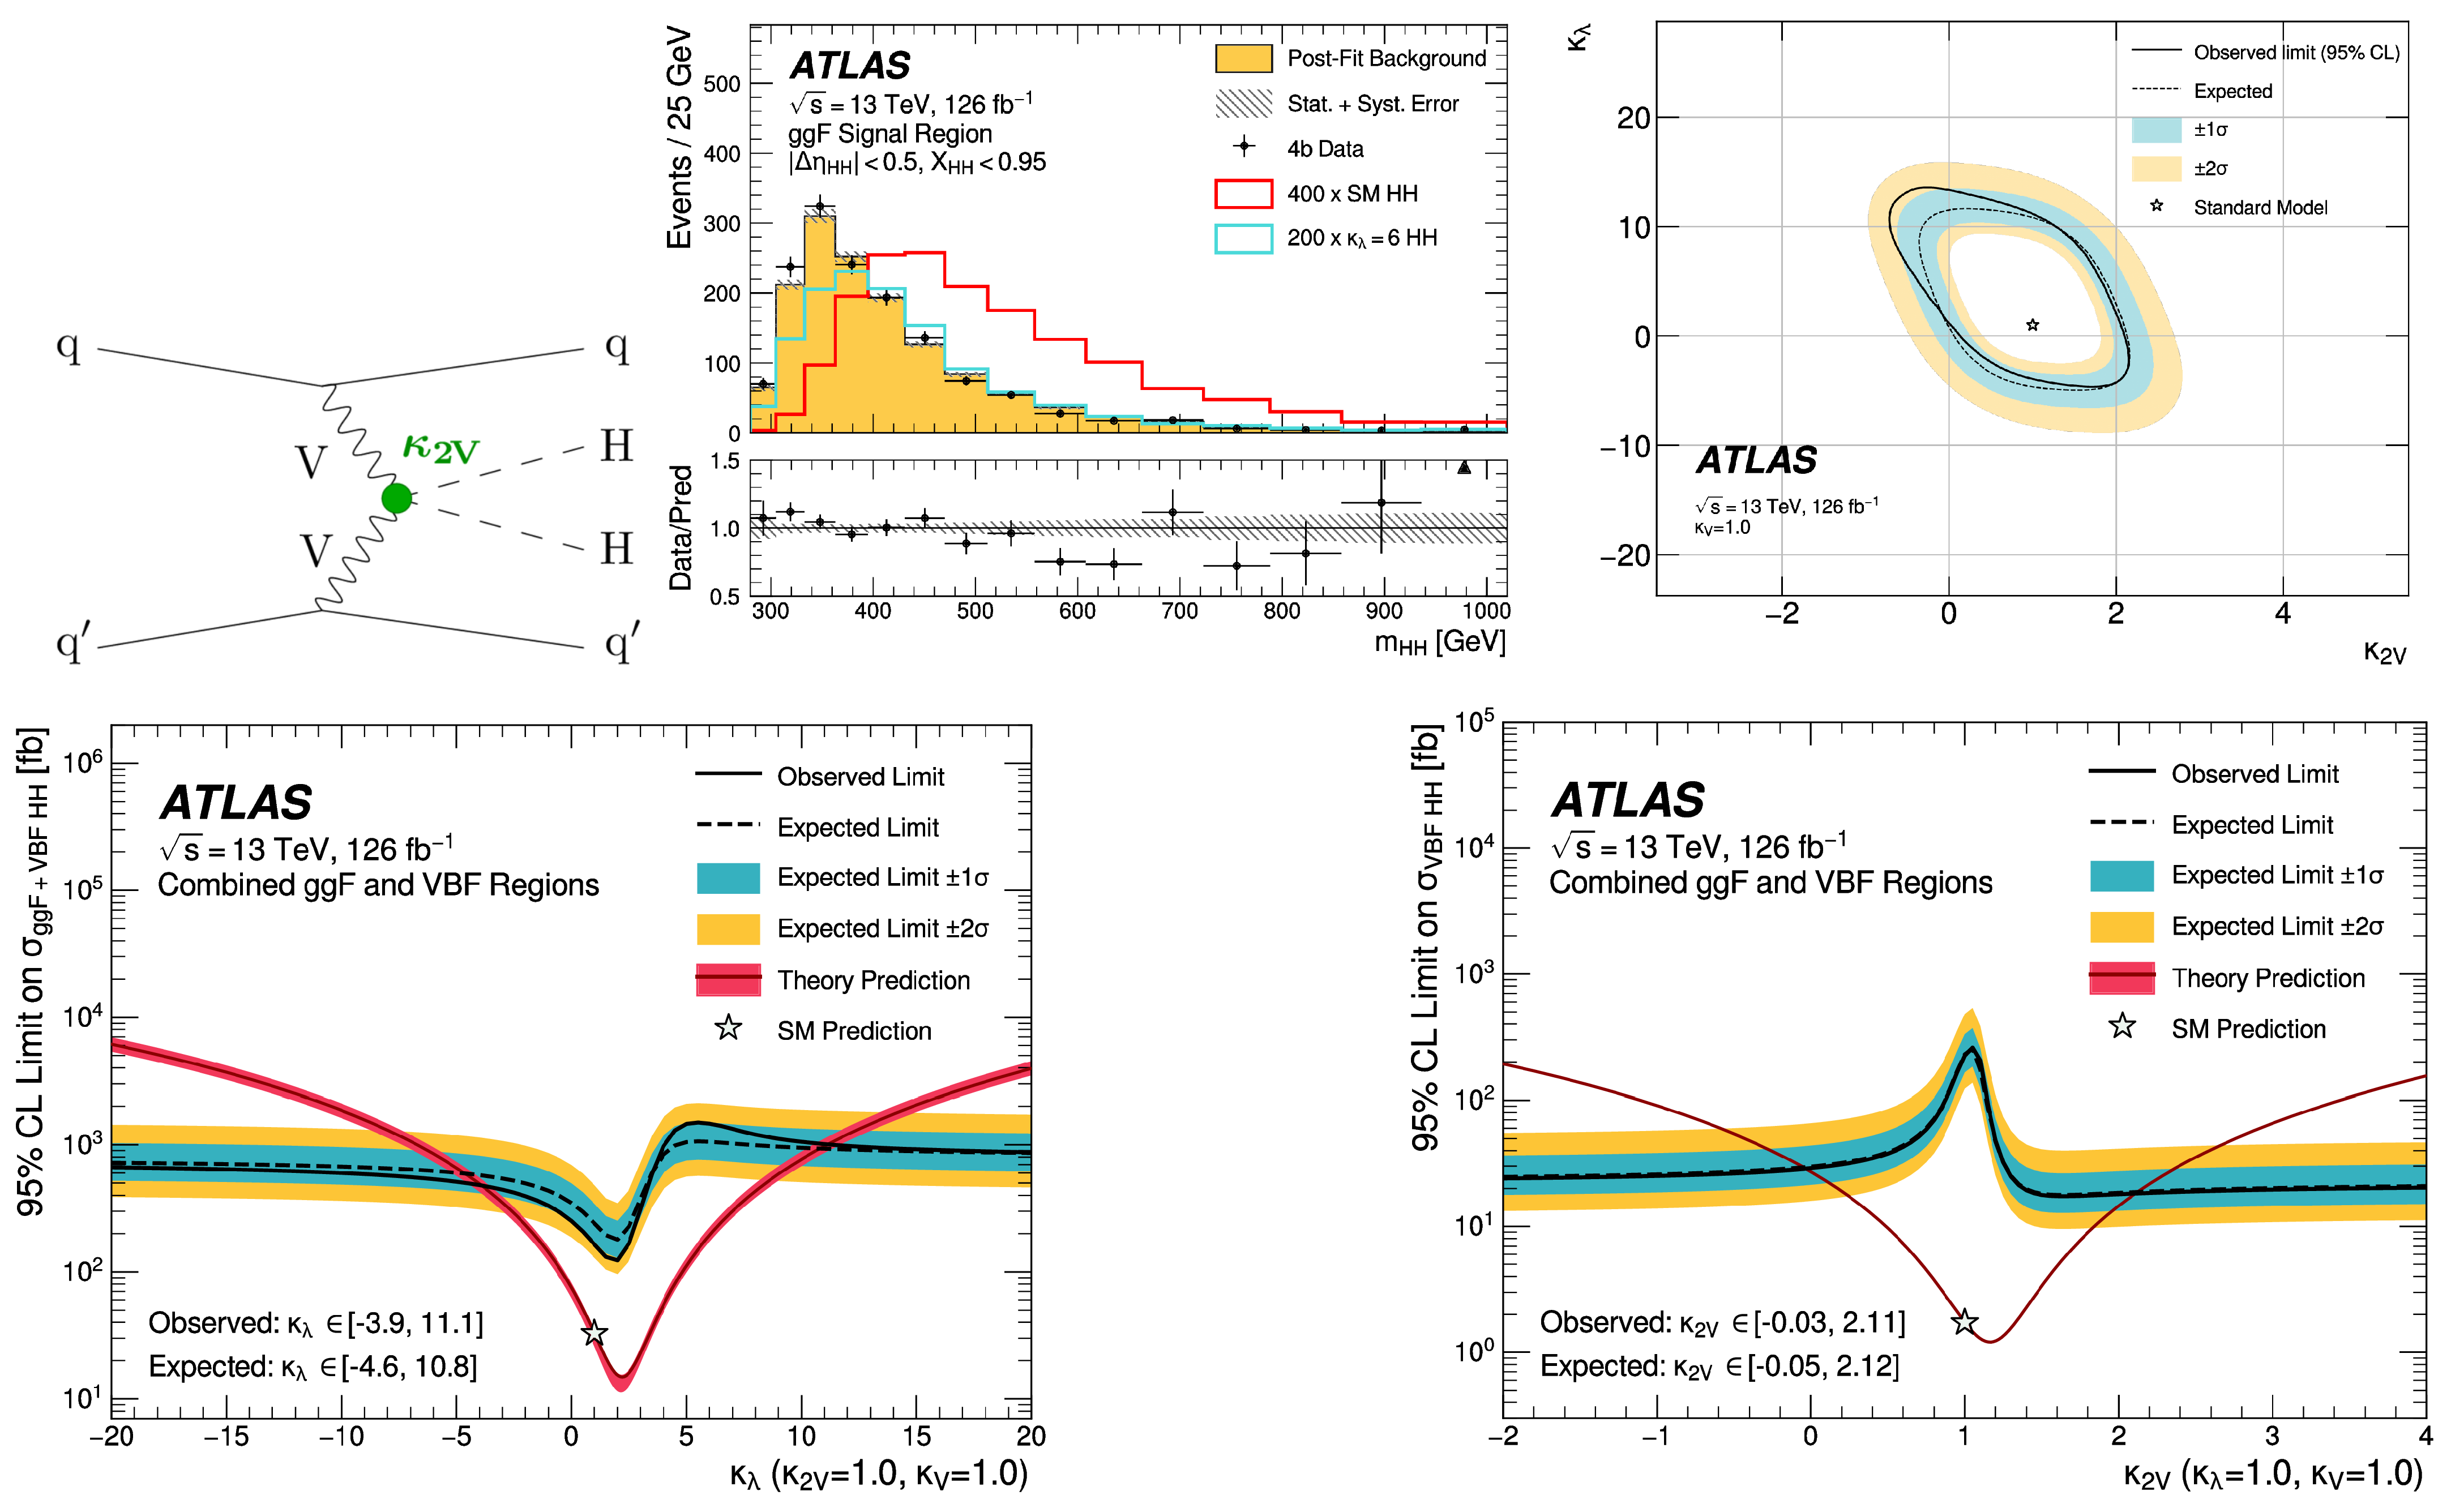
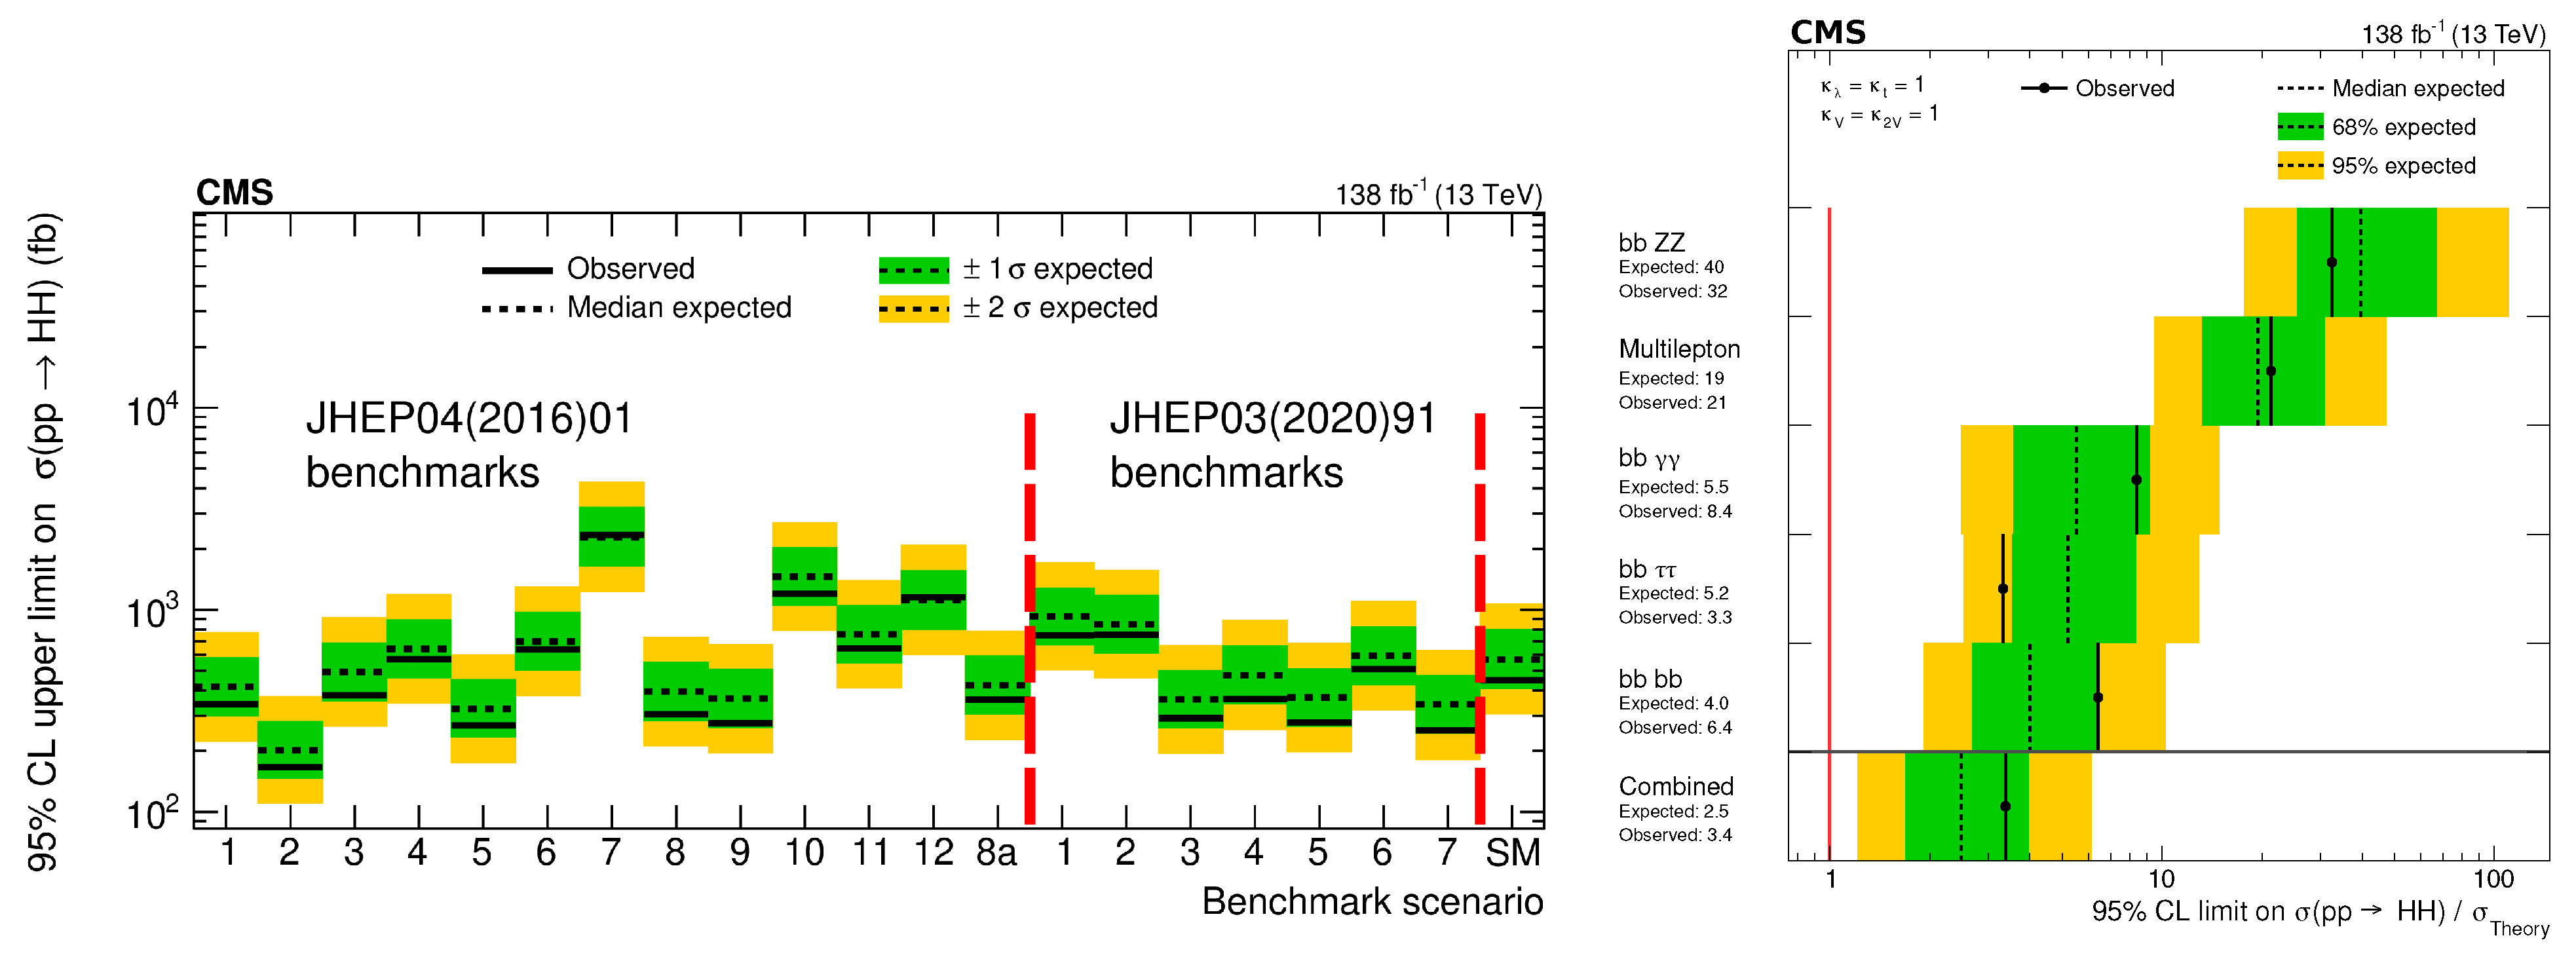
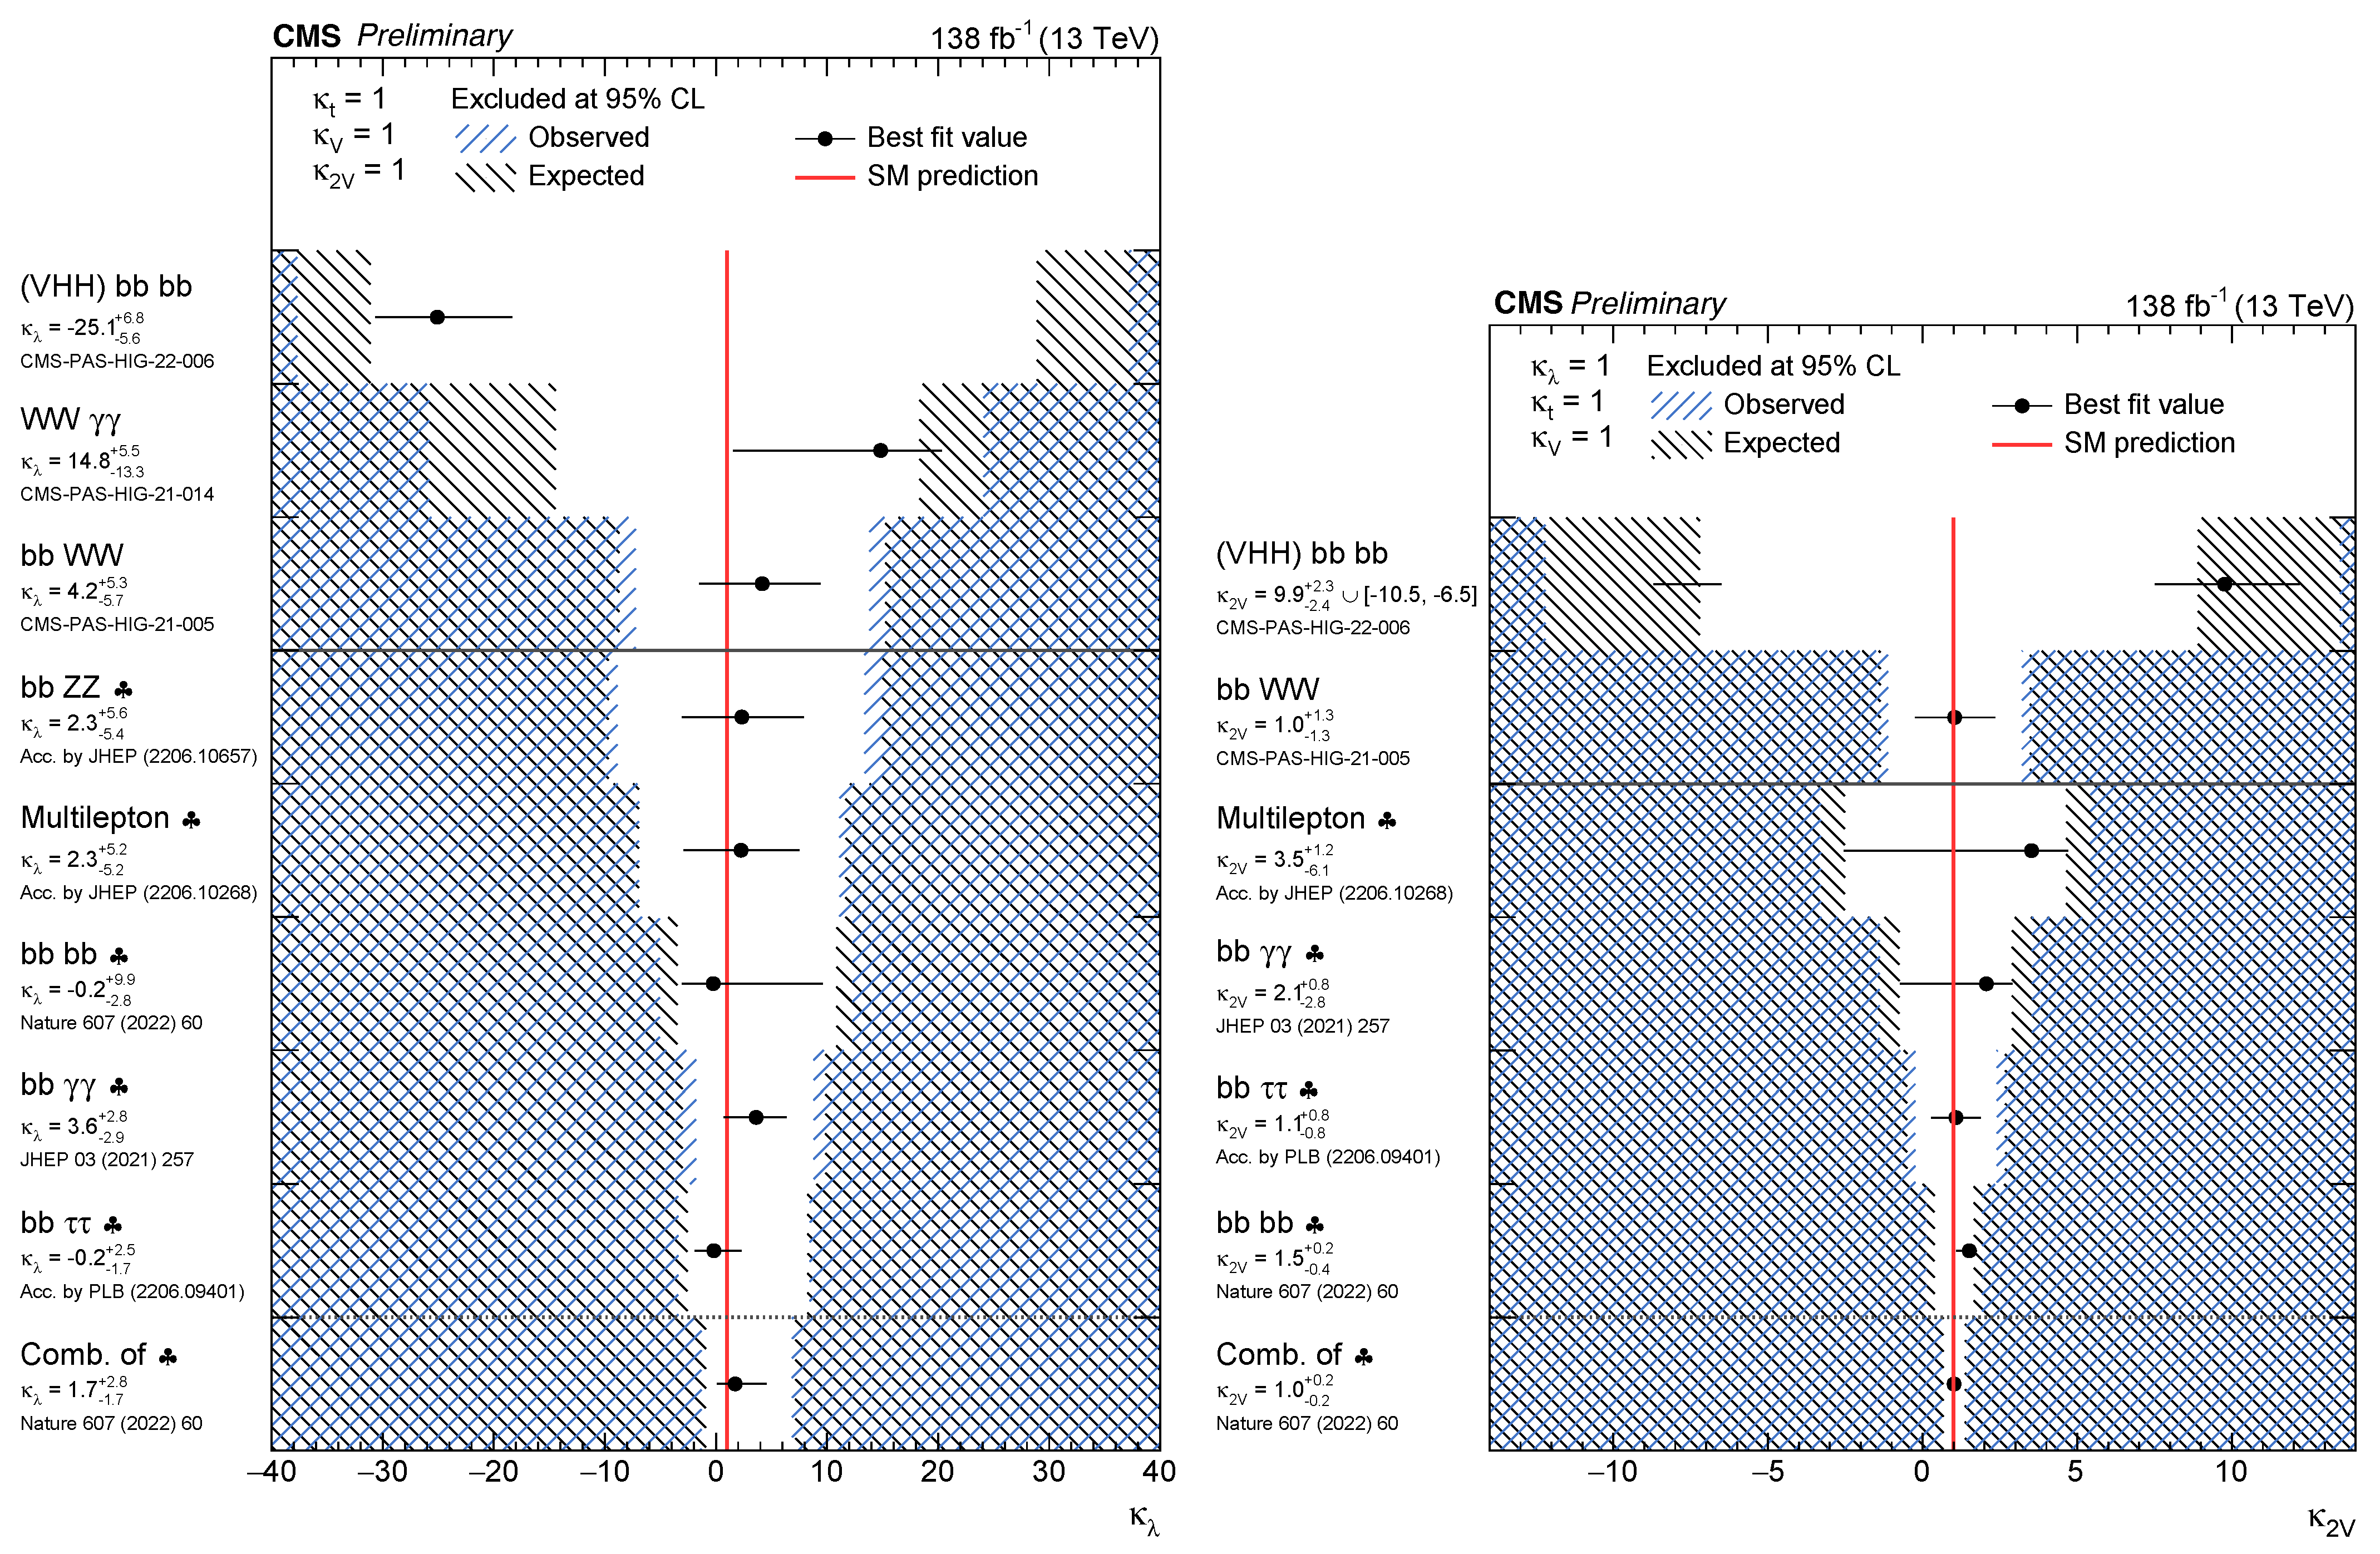
3.2. Di-Higgs, ,
4. Higgs Boson Resonances
4.1.
4.2.
4.3.
5. Additional Neutral Higgs Bosons
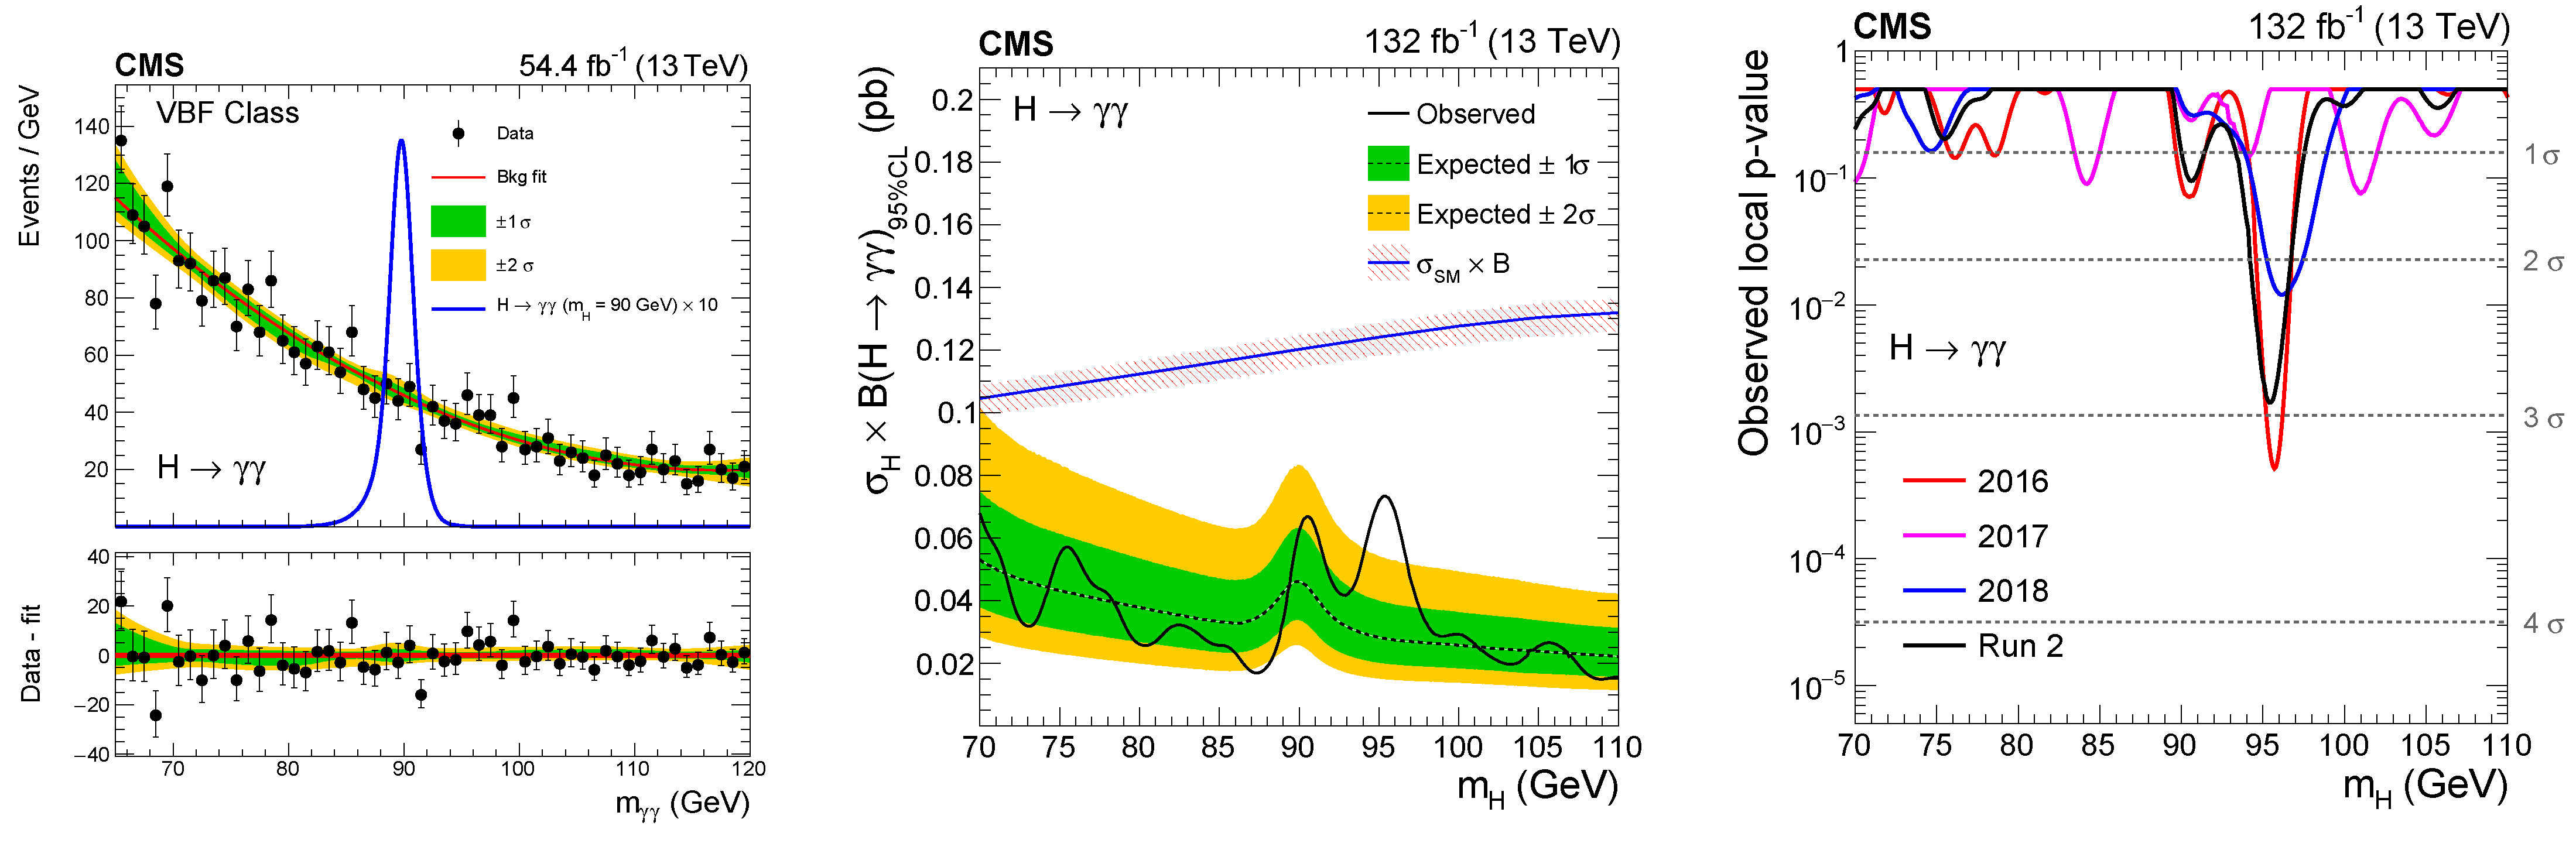
5.1. SM-like Higgs Boson in the 70 GeV to 110 GeV Mass Range Decay
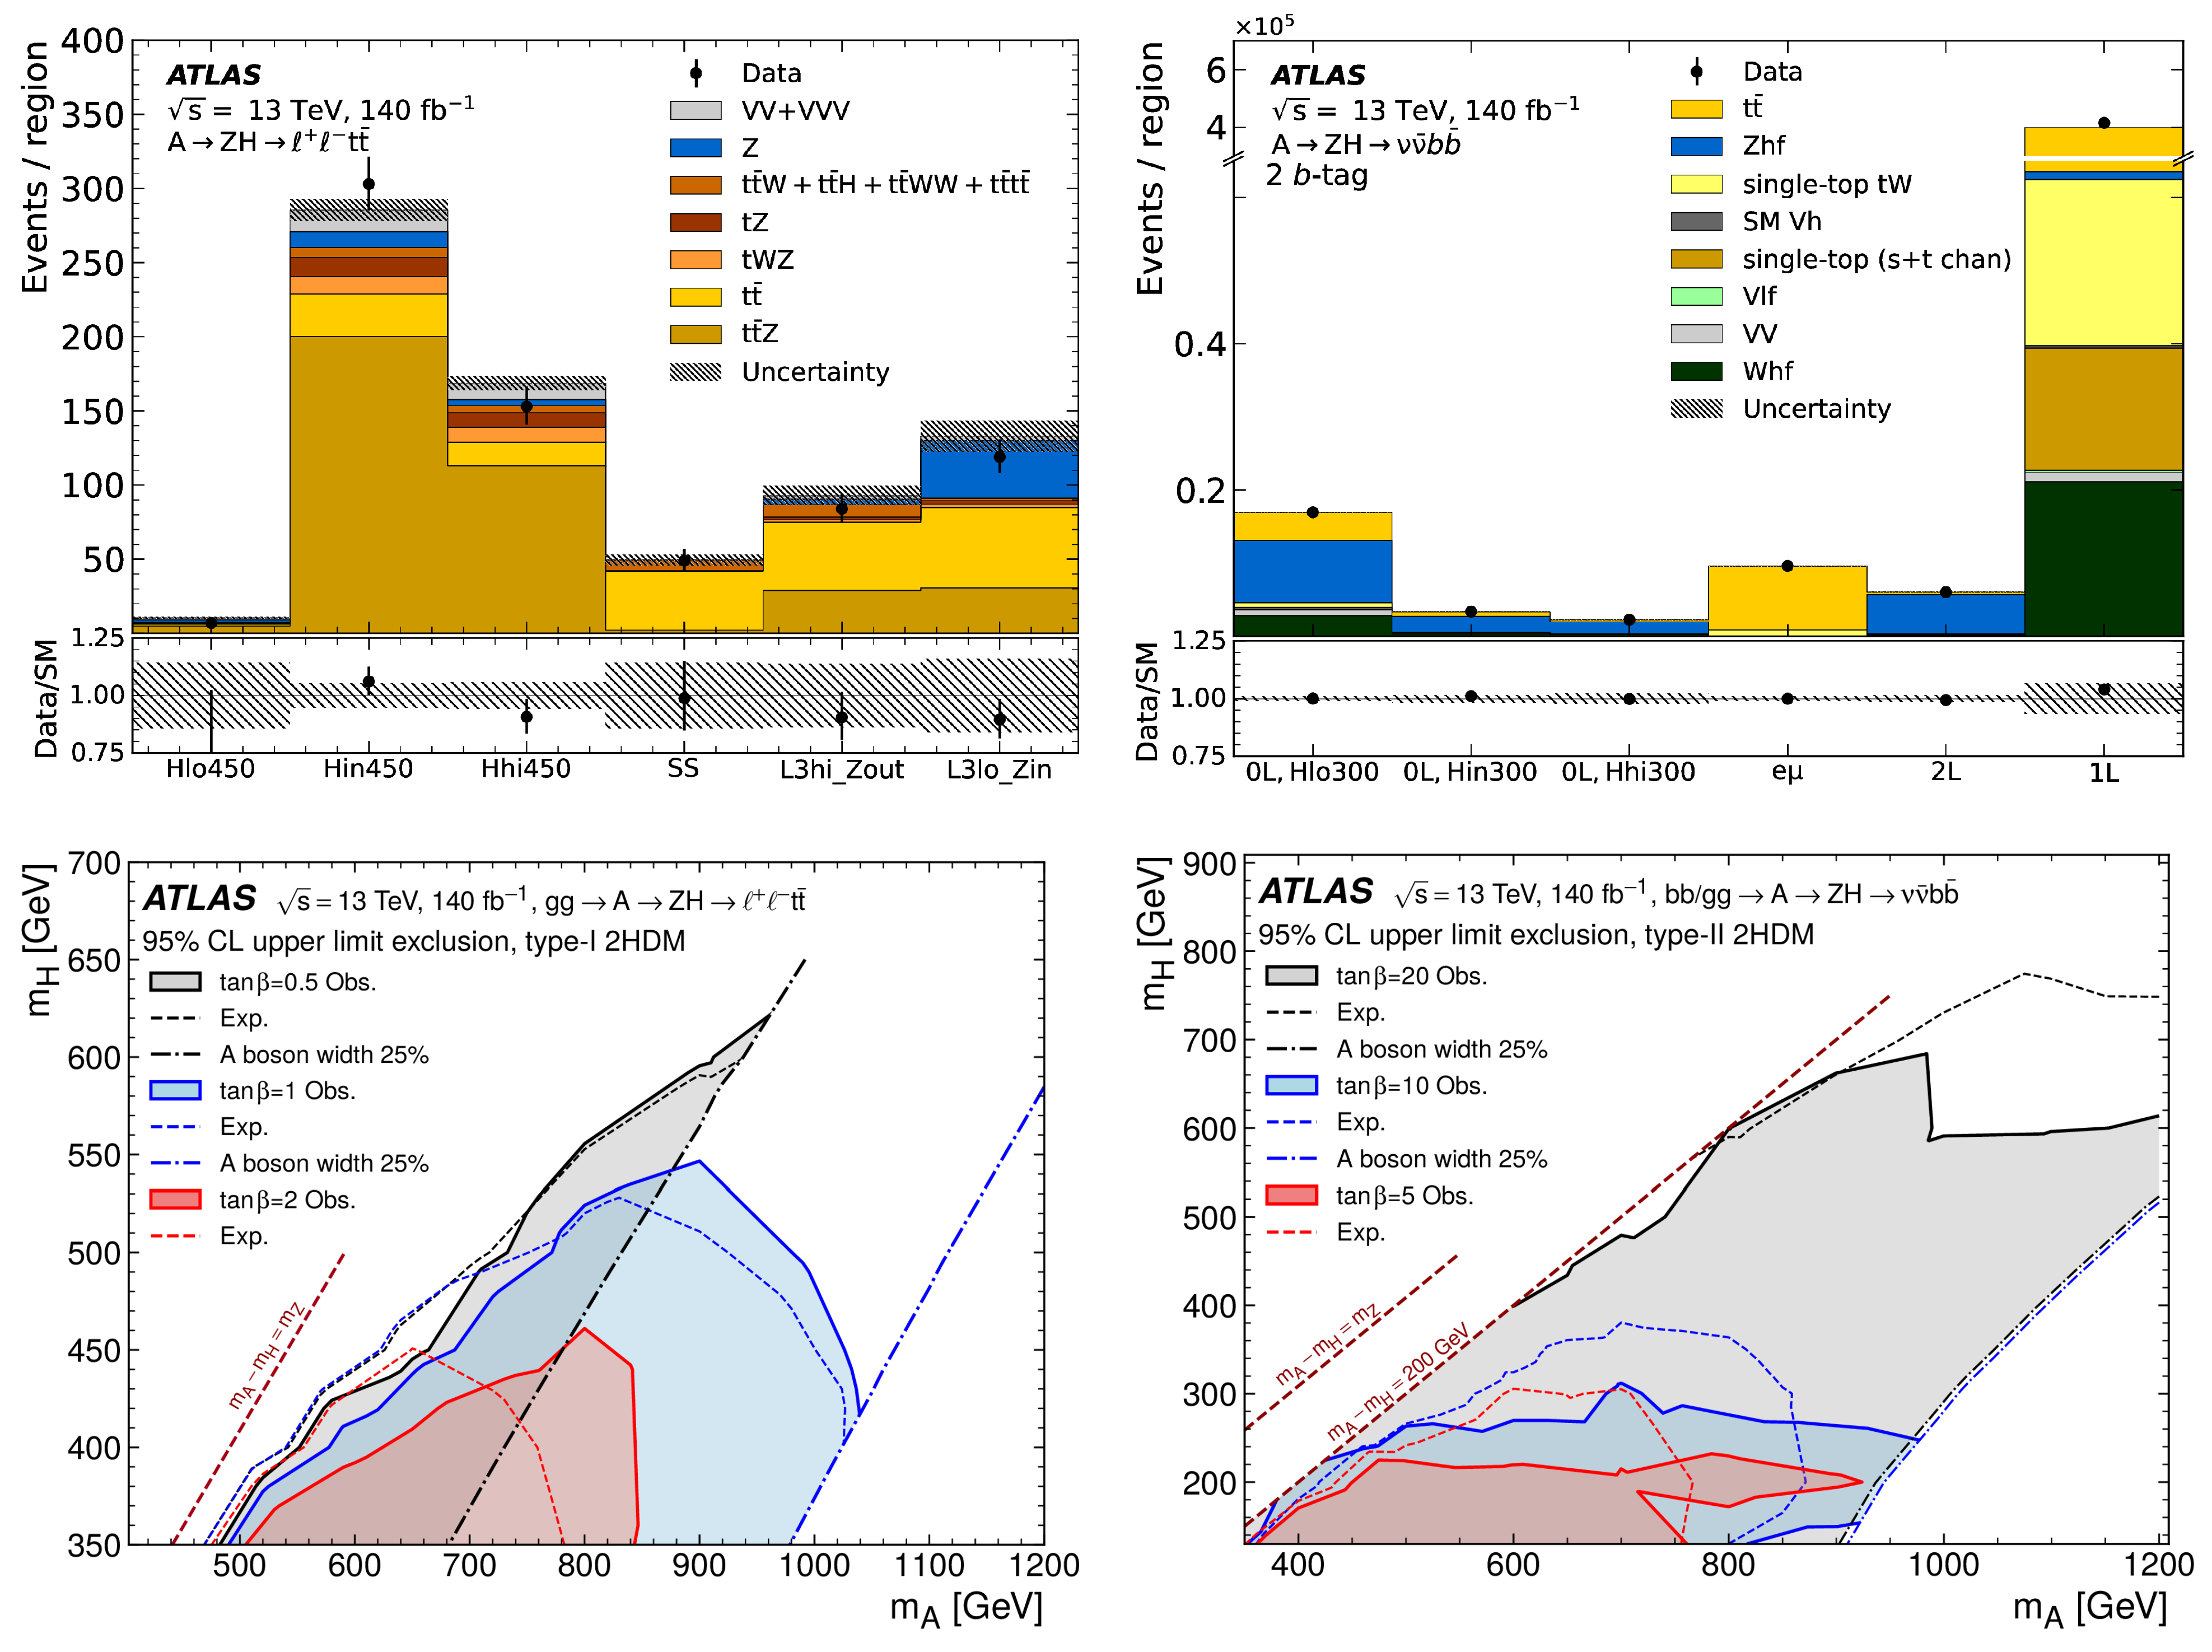
5.2. Heavy Higgs Bosons in
5.3. Heavy Higgs Bosons in
5.4. Heavy Higgs Bosons in
5.5. Heavy Higgs Bosons in
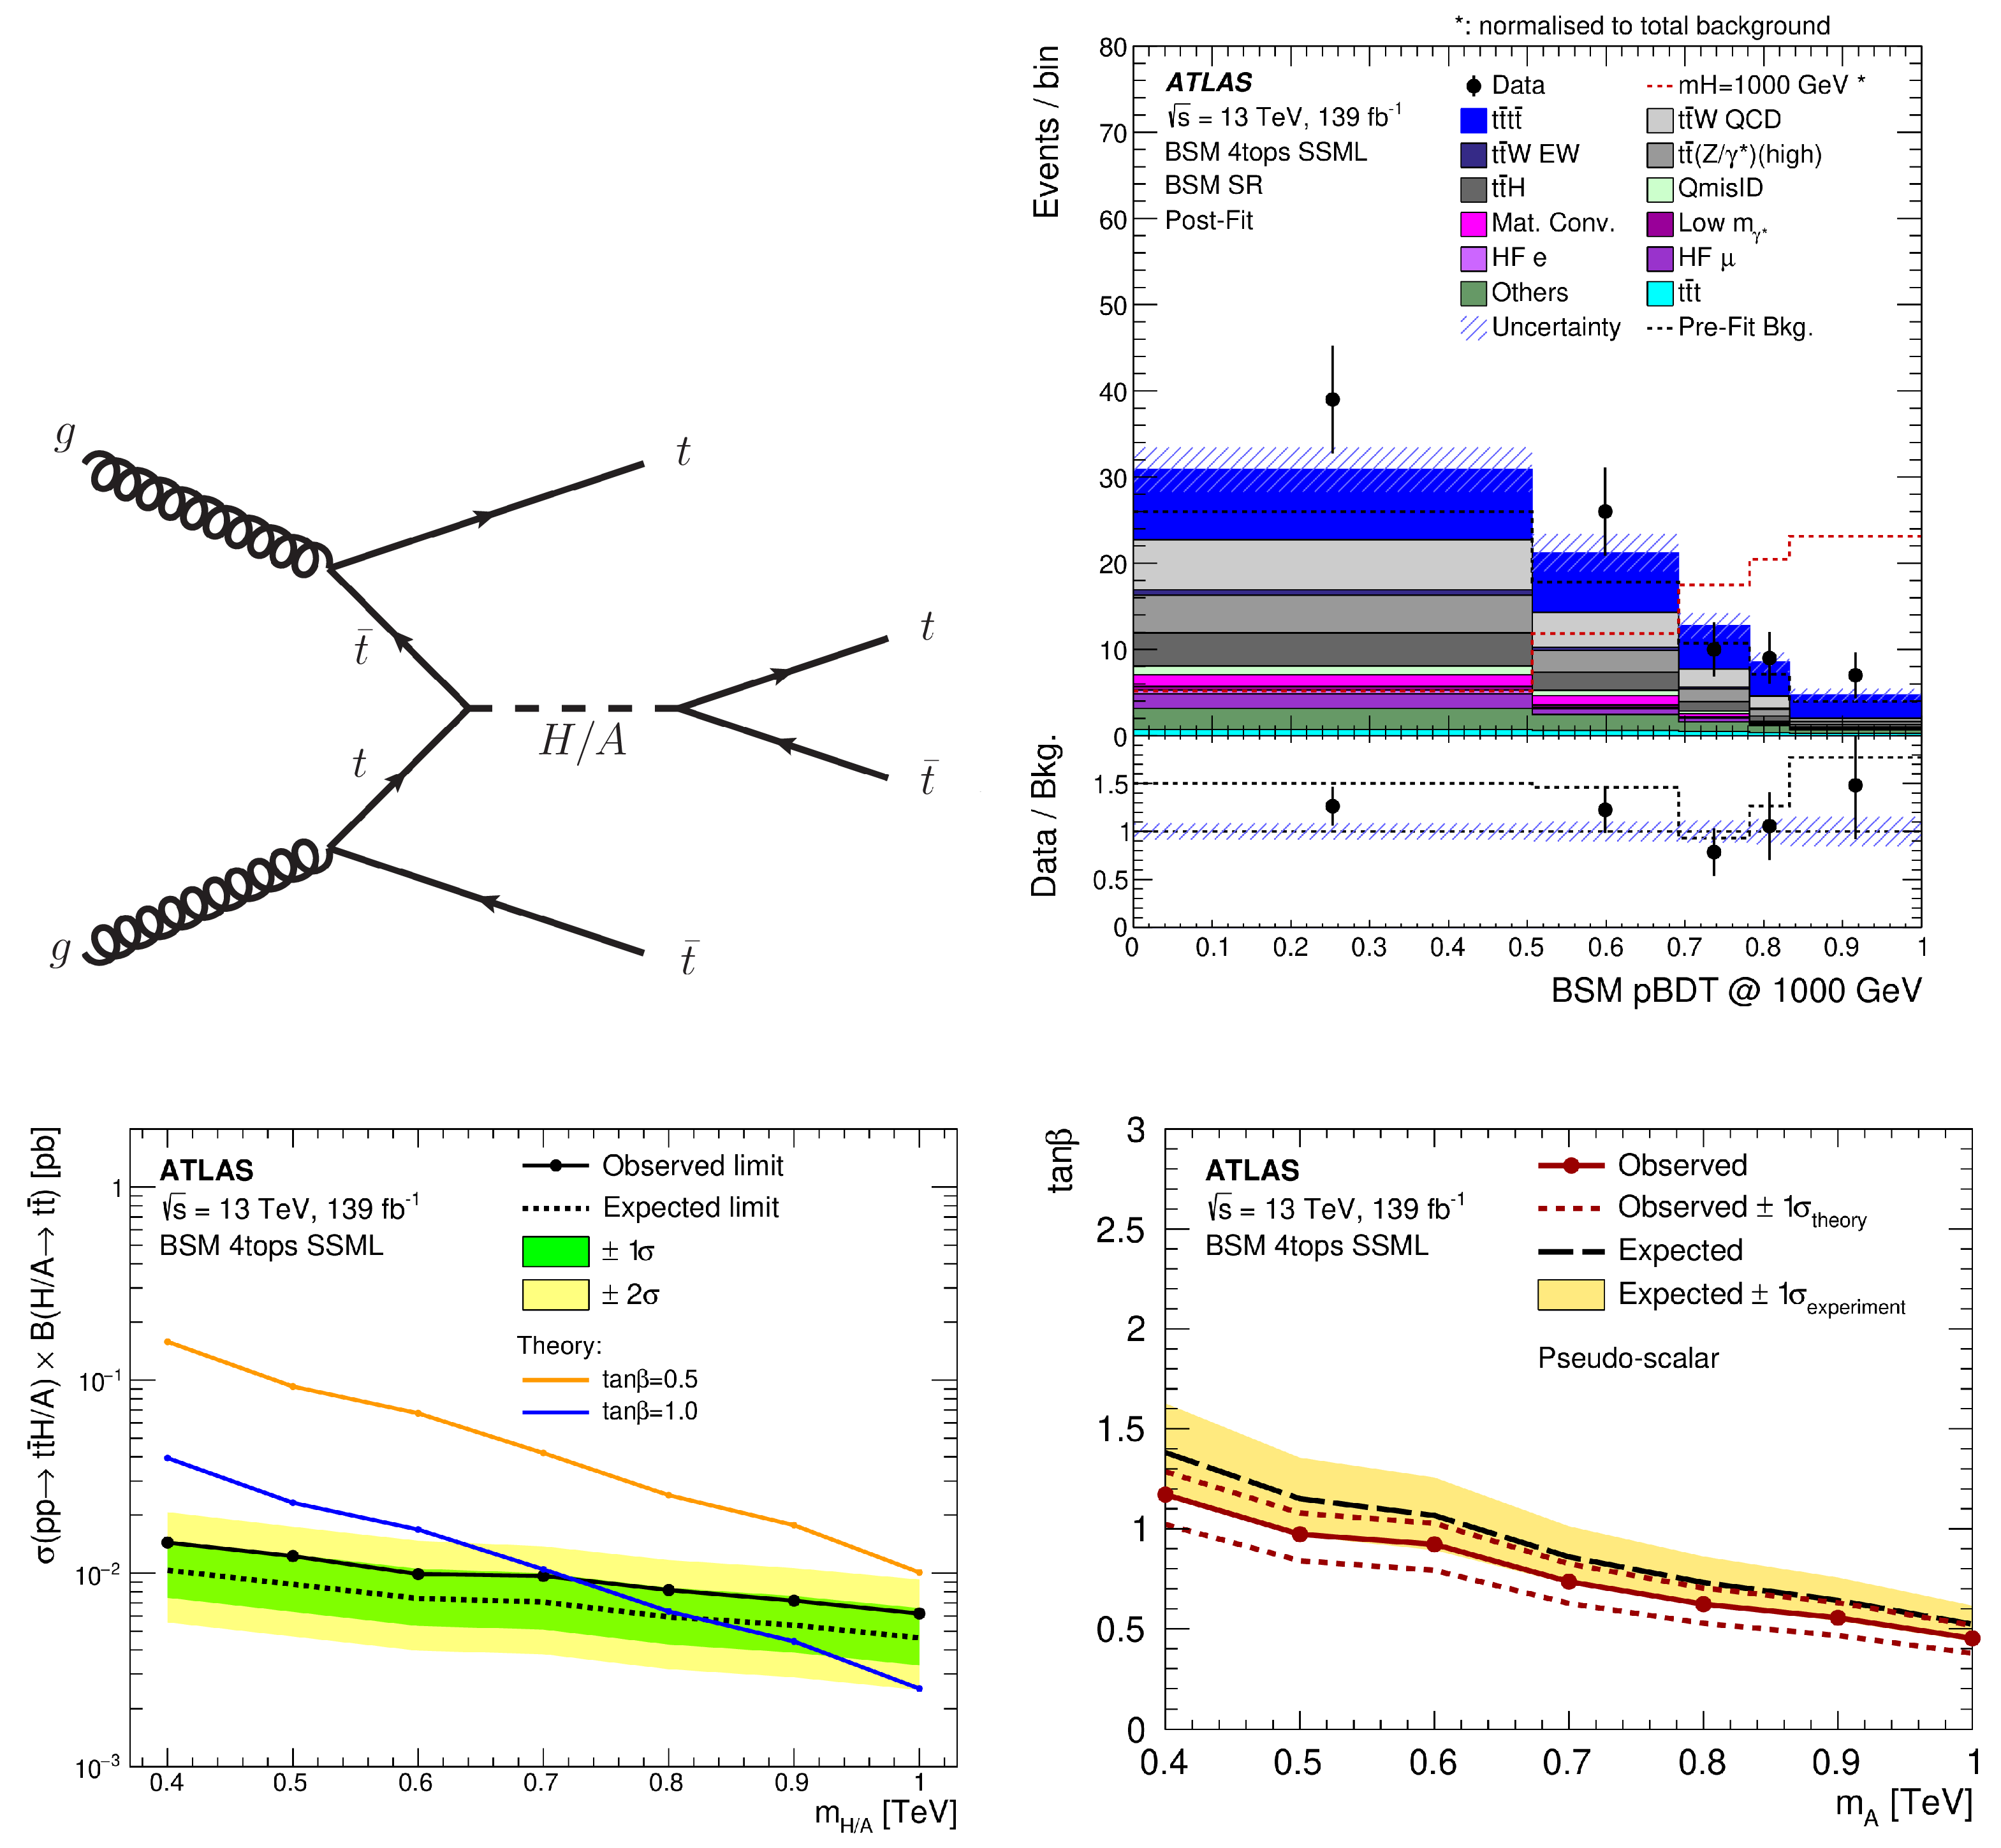
5.6. Heavy Higgs Bosons in : Multi-Lepton Final States
5.7. Heavy Higgs Bosons in
6. Higgs Bosons and Dark Matter
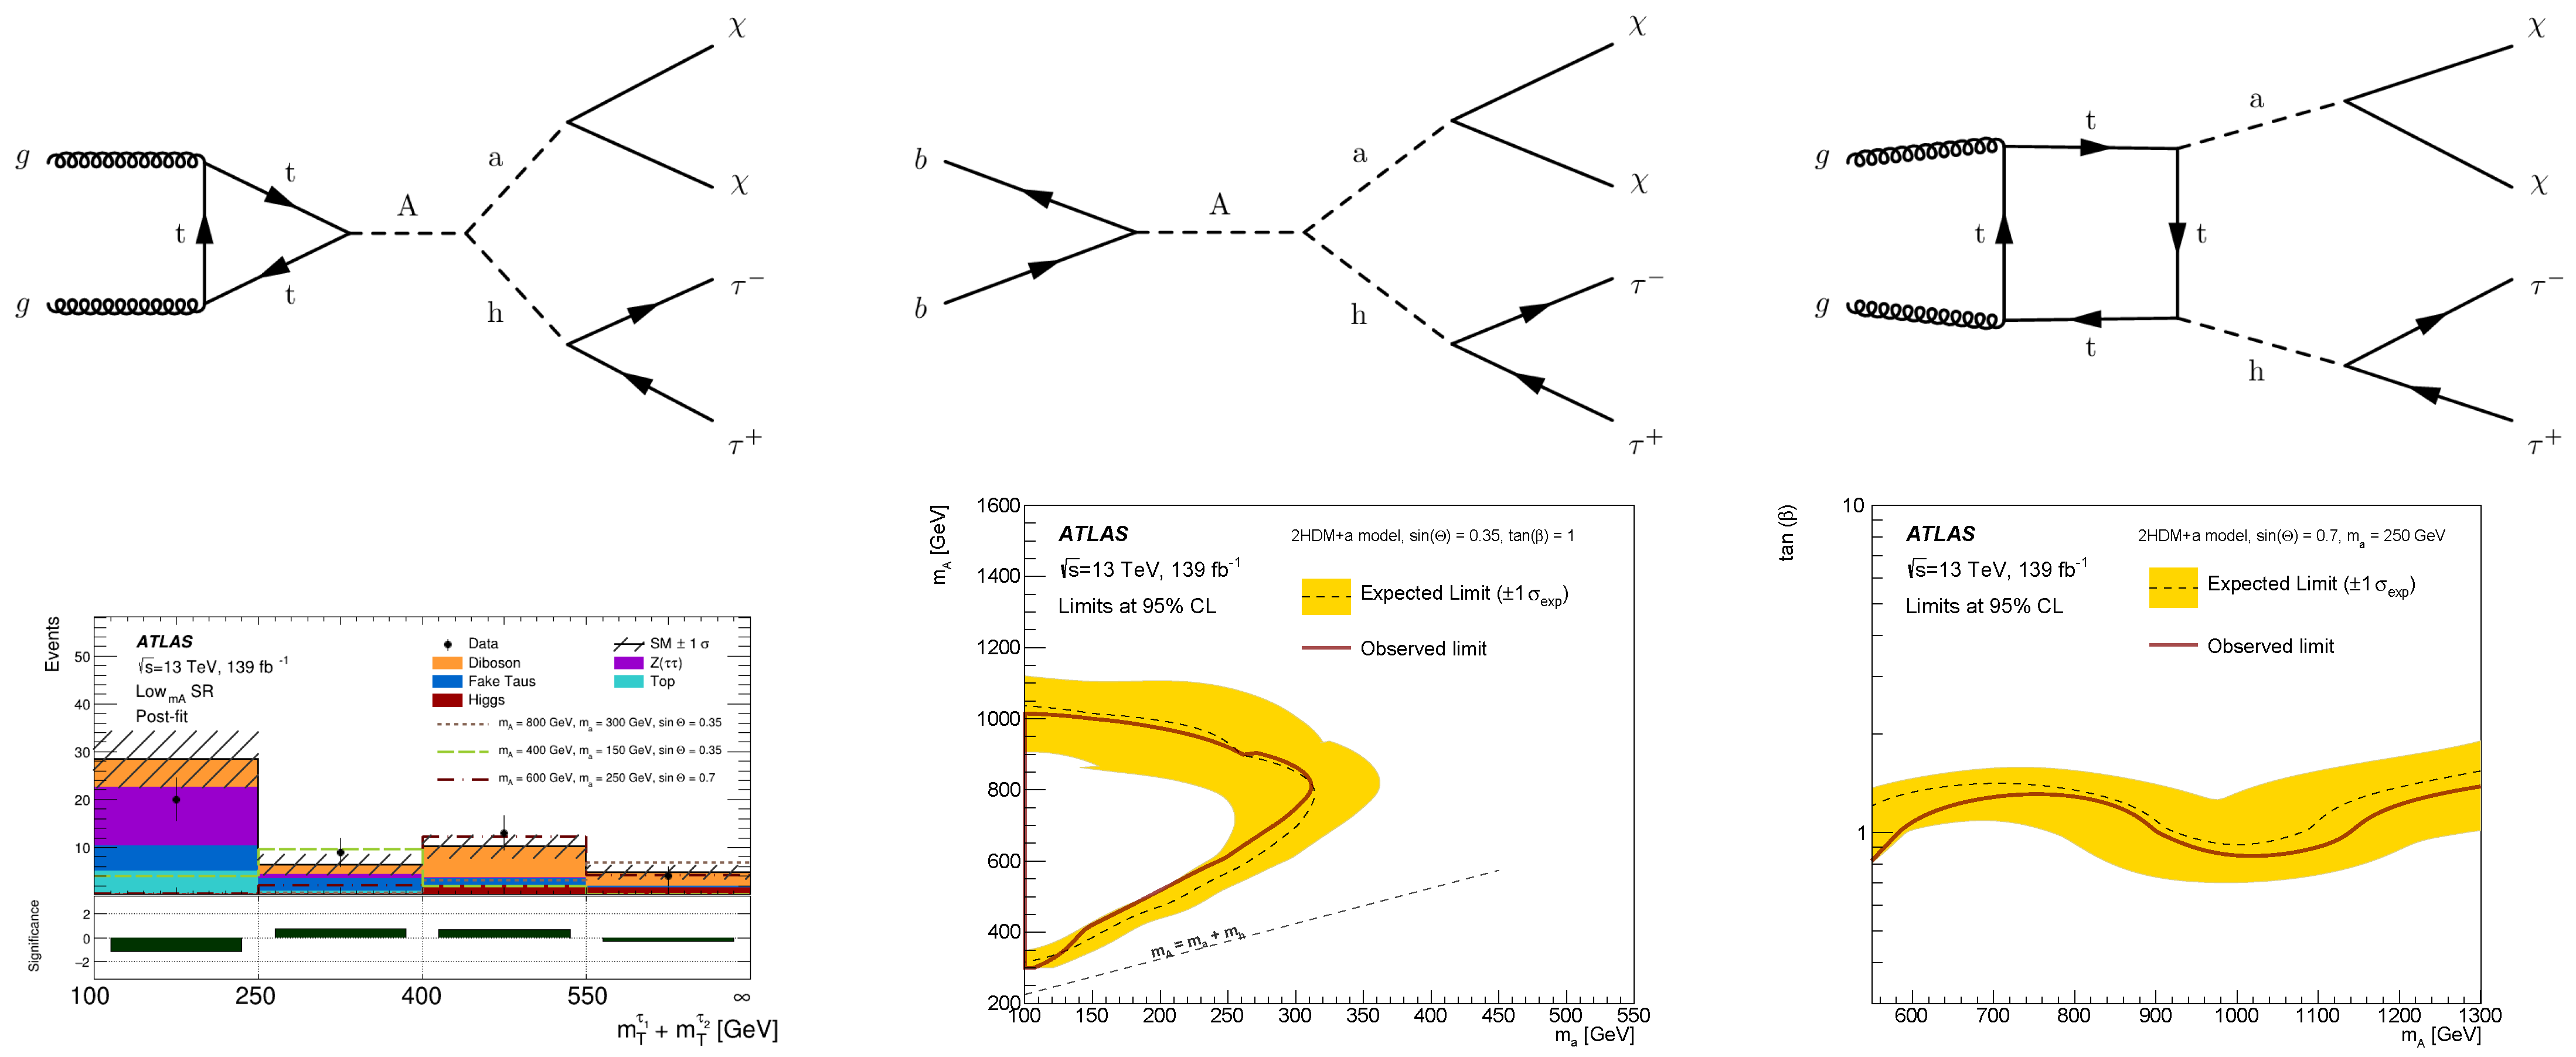
6.1. Dark Matter Produced in Association with a Higgs Boson Decaying into Taus
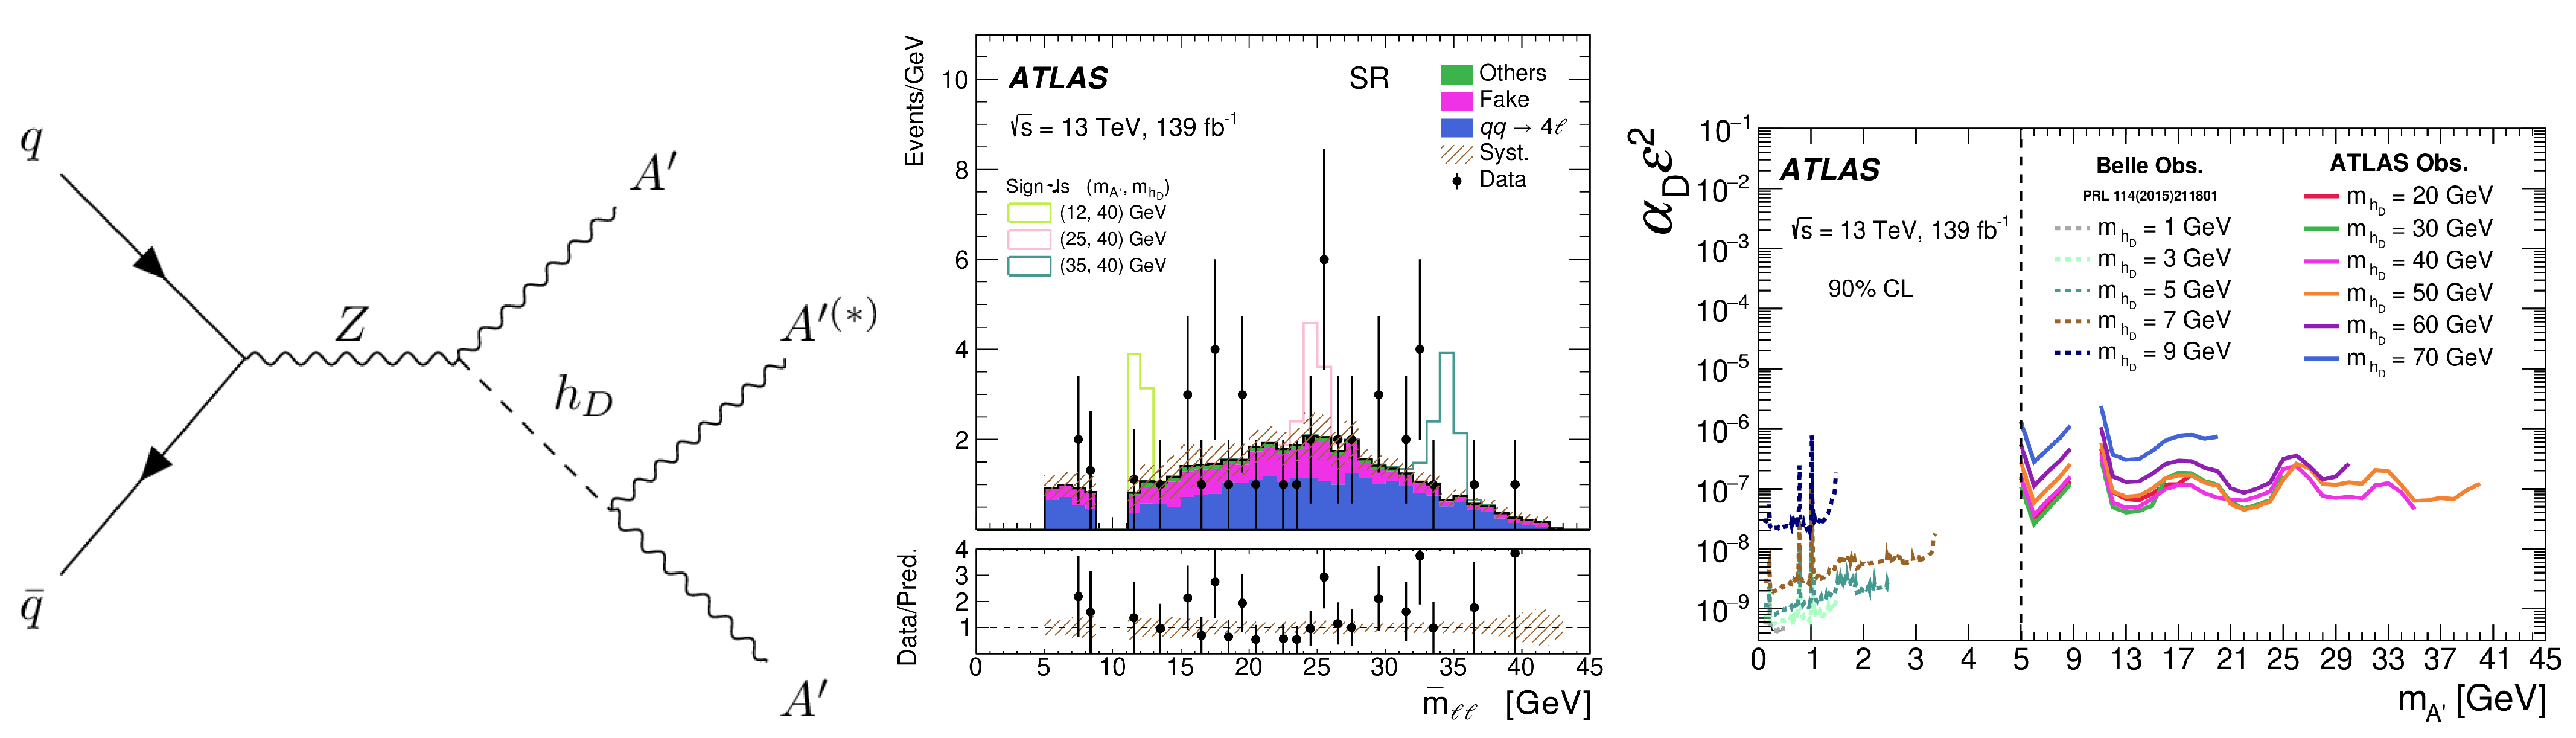
6.2. Dark Higgs Boson
6.3. Combination of Searches in the 2HDM and Dark Matter Searches
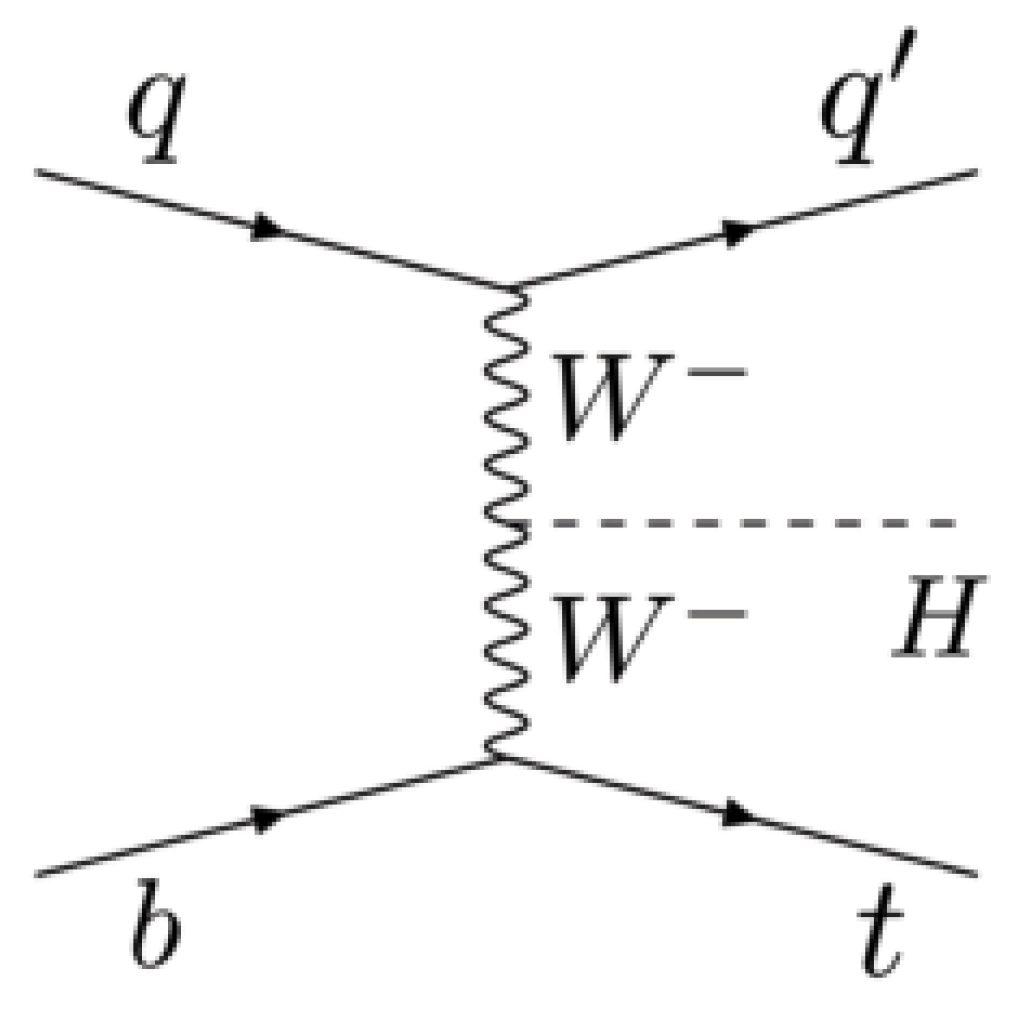
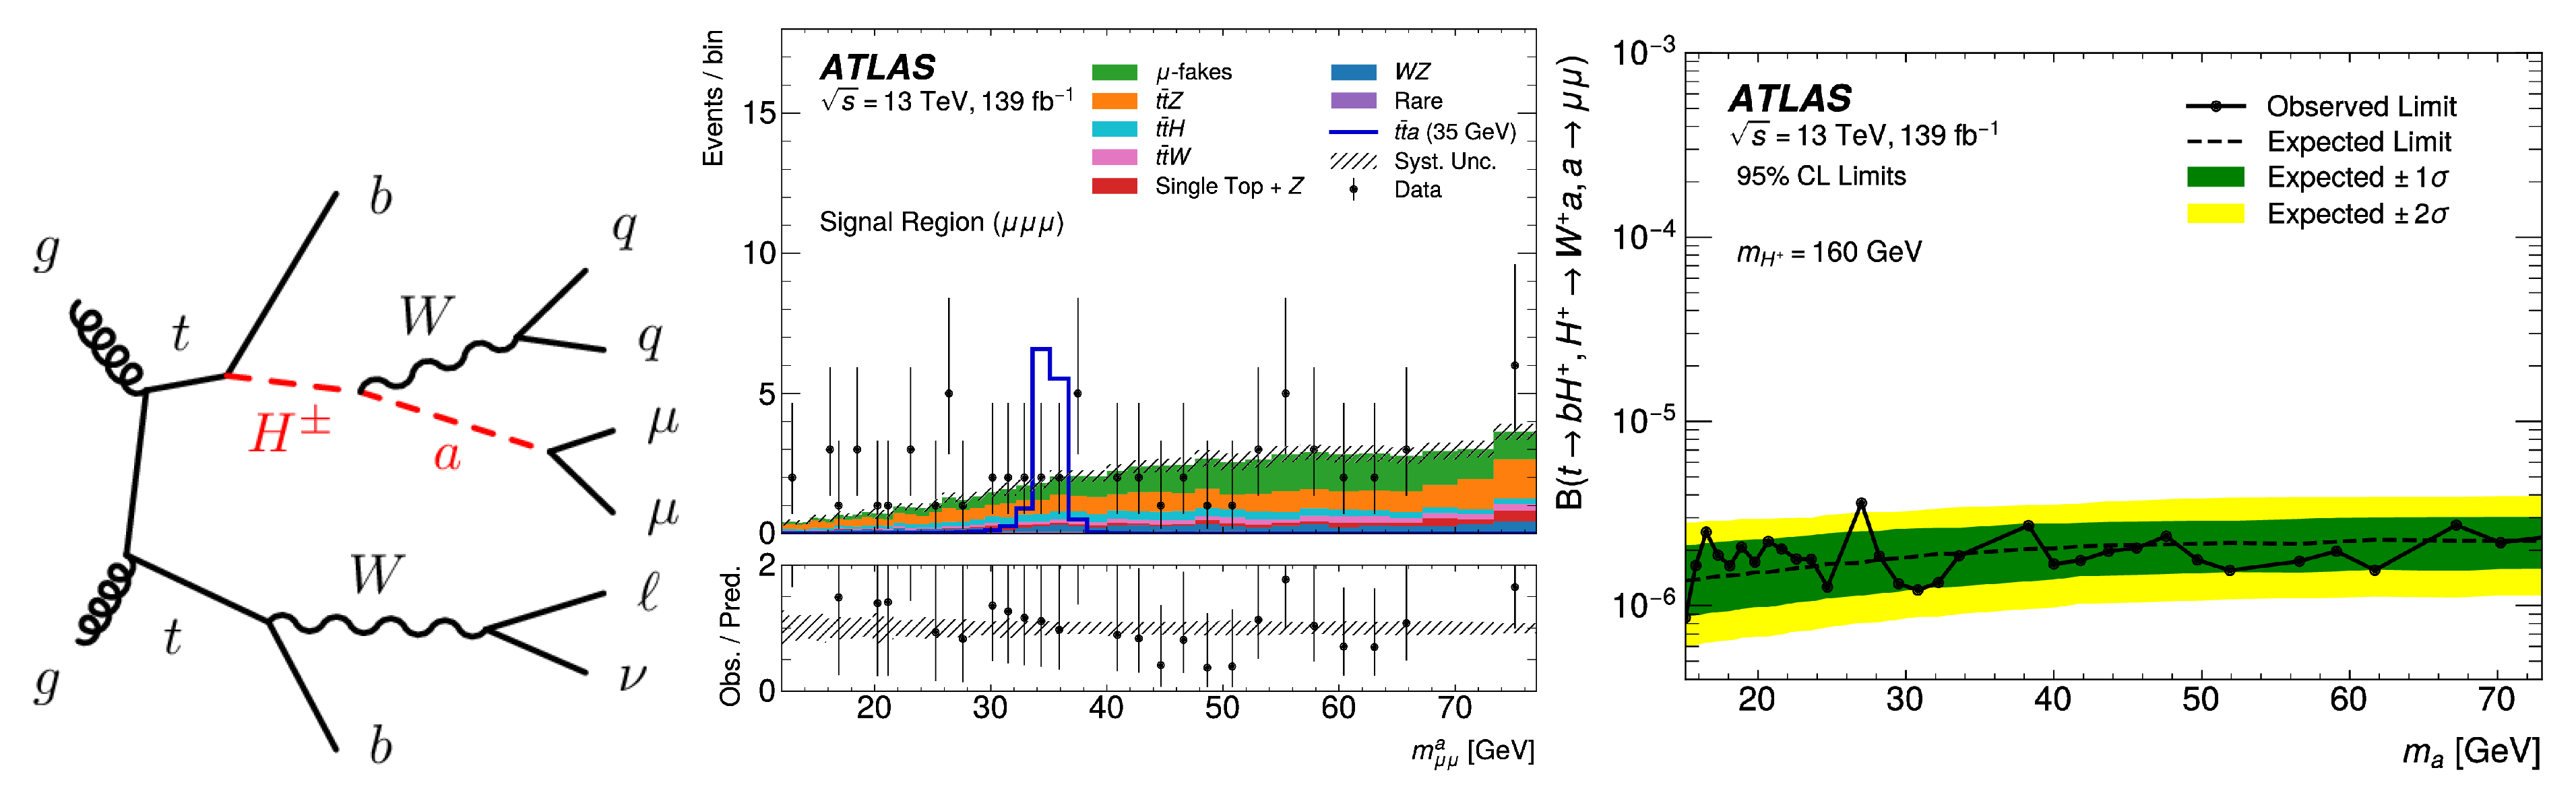
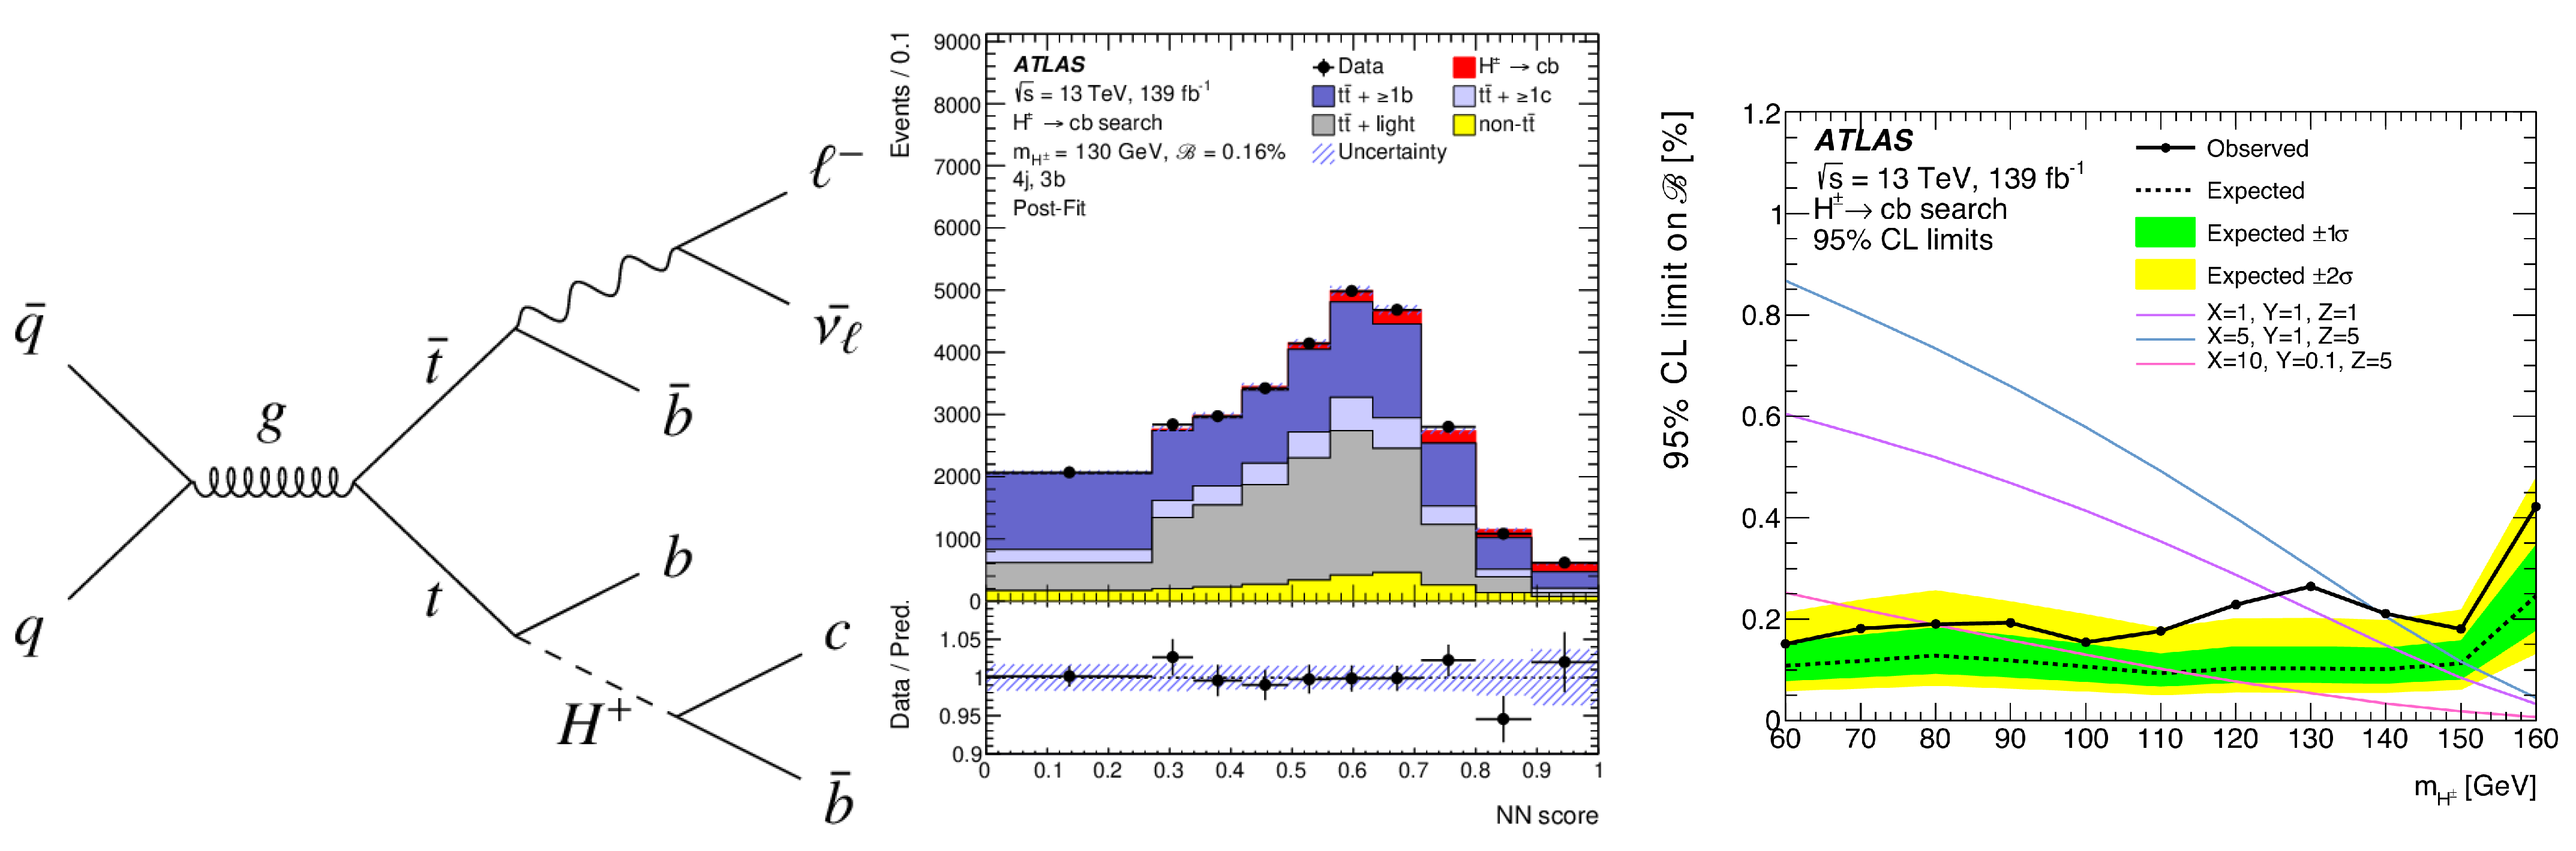
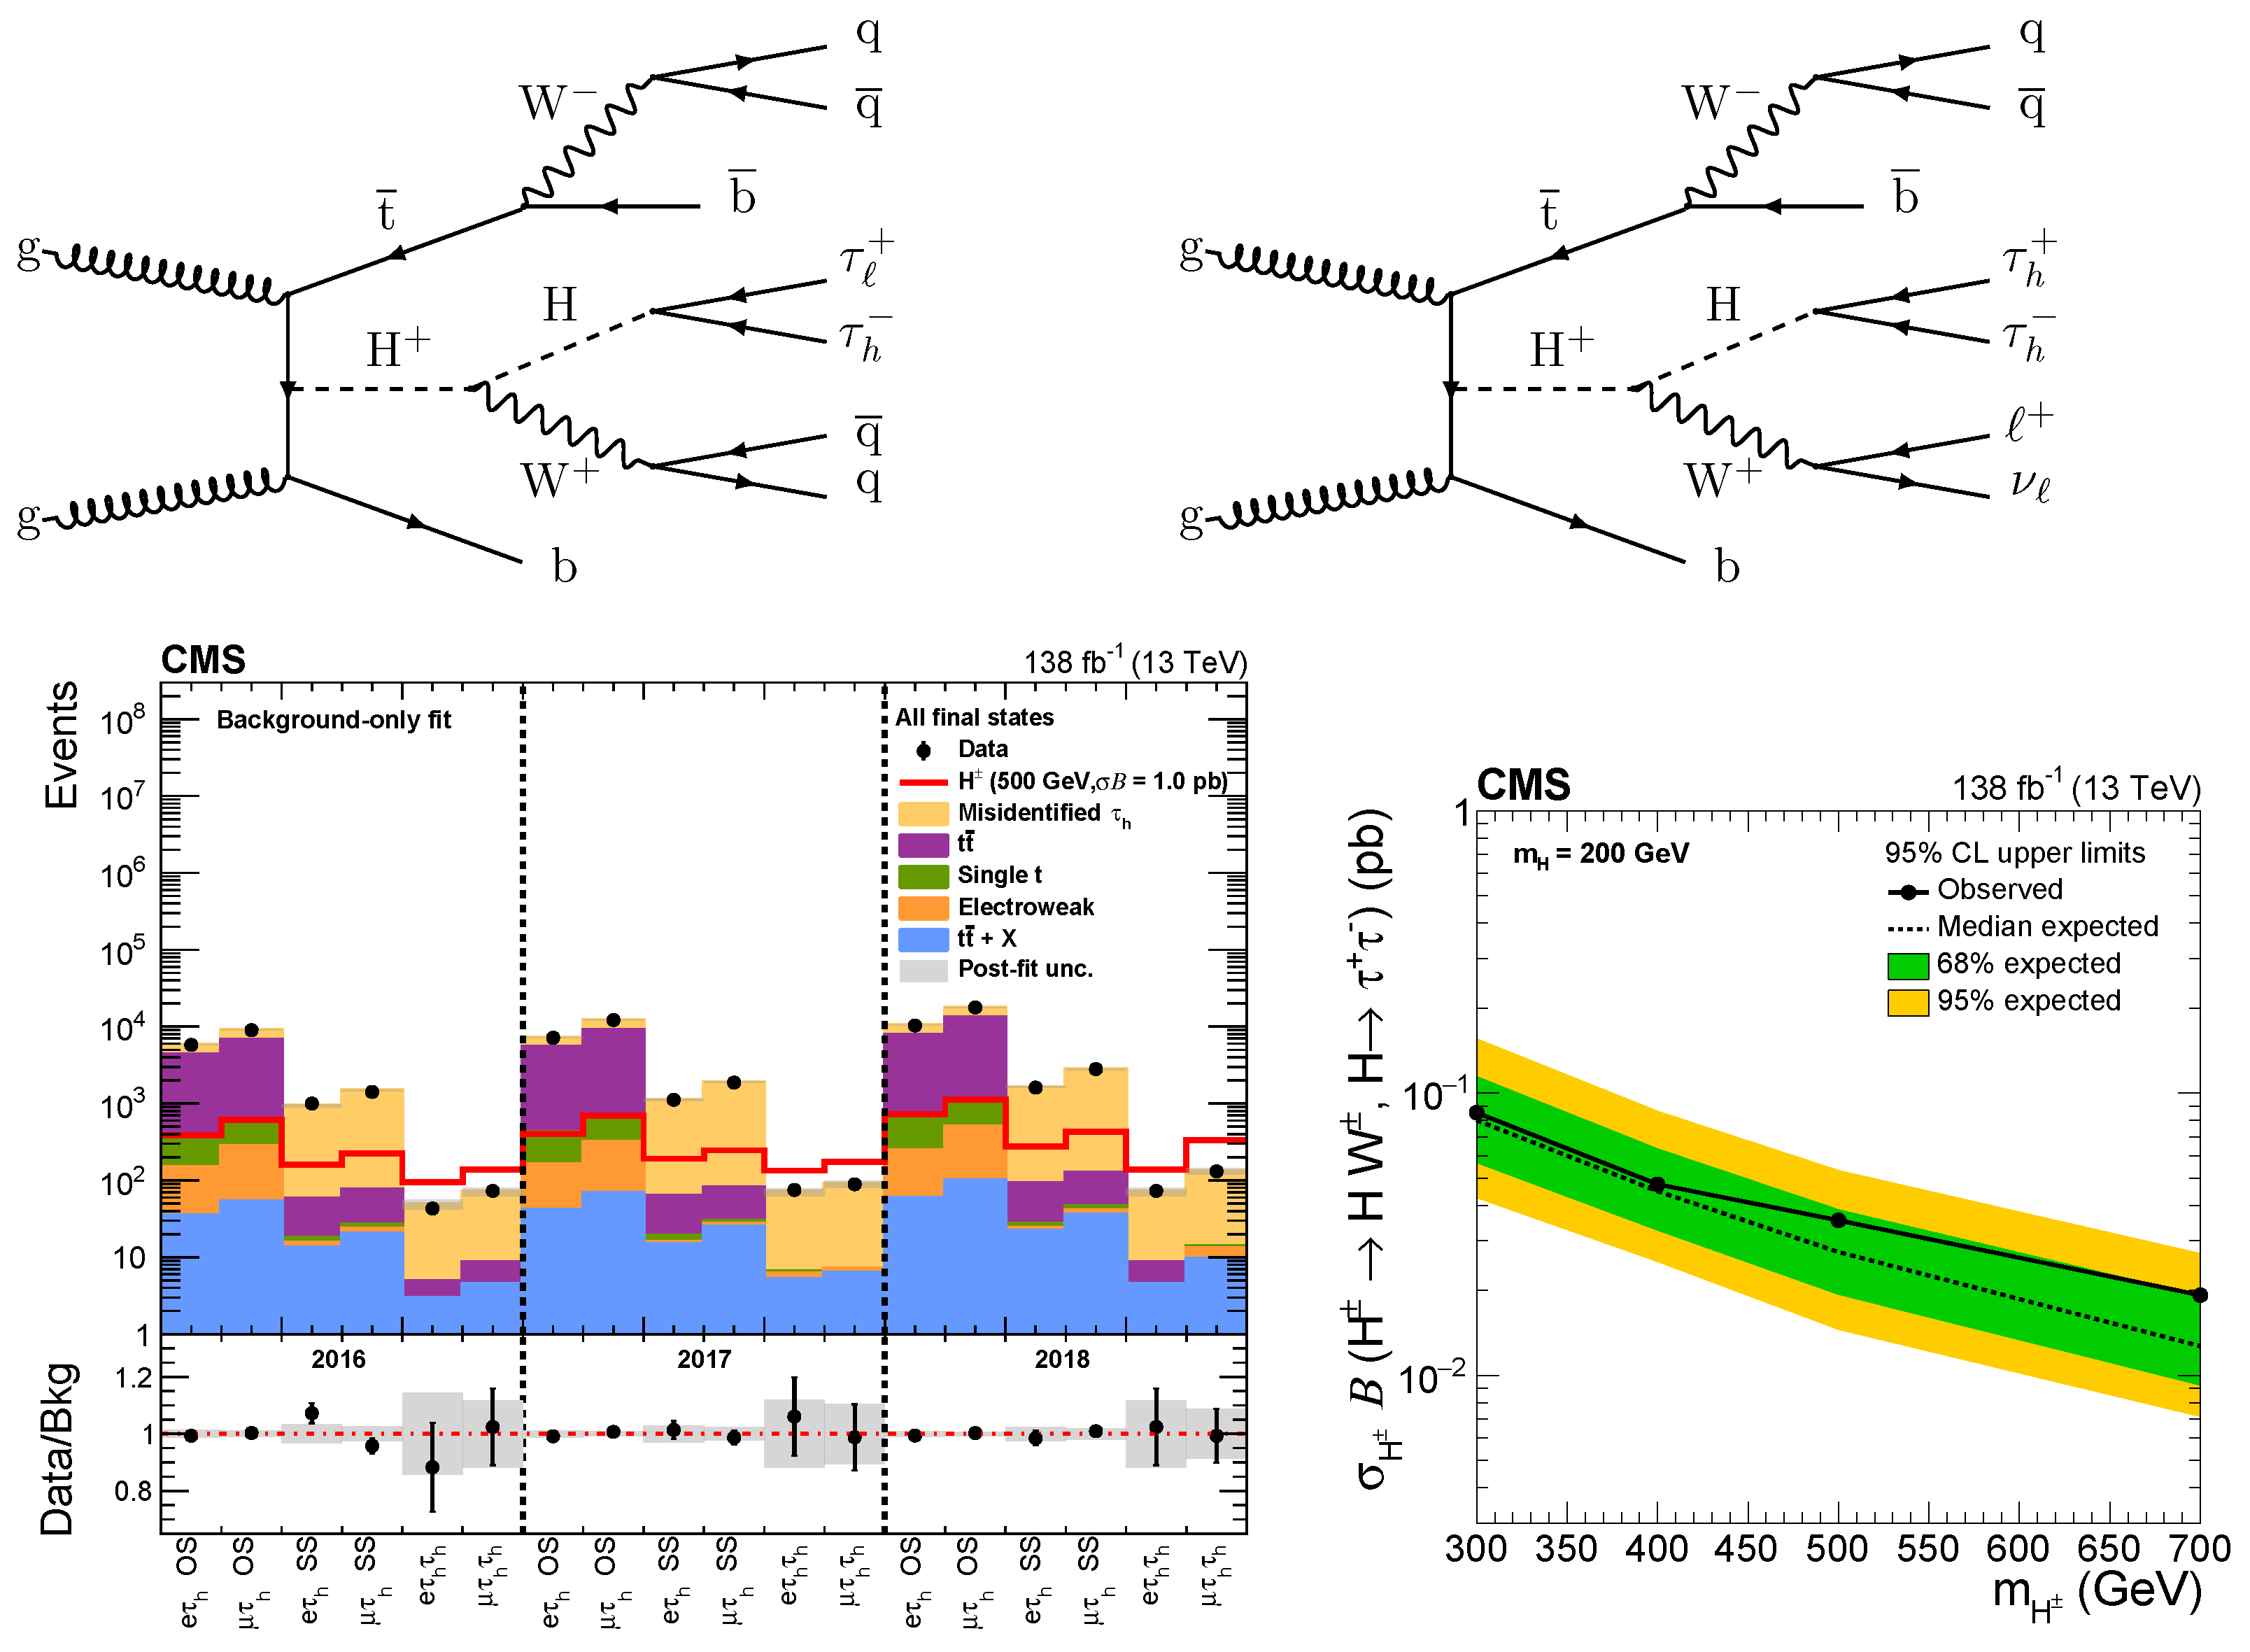
7. Additional Charged Higgs Bosons
7.1. with , Where
7.2.
7.3.
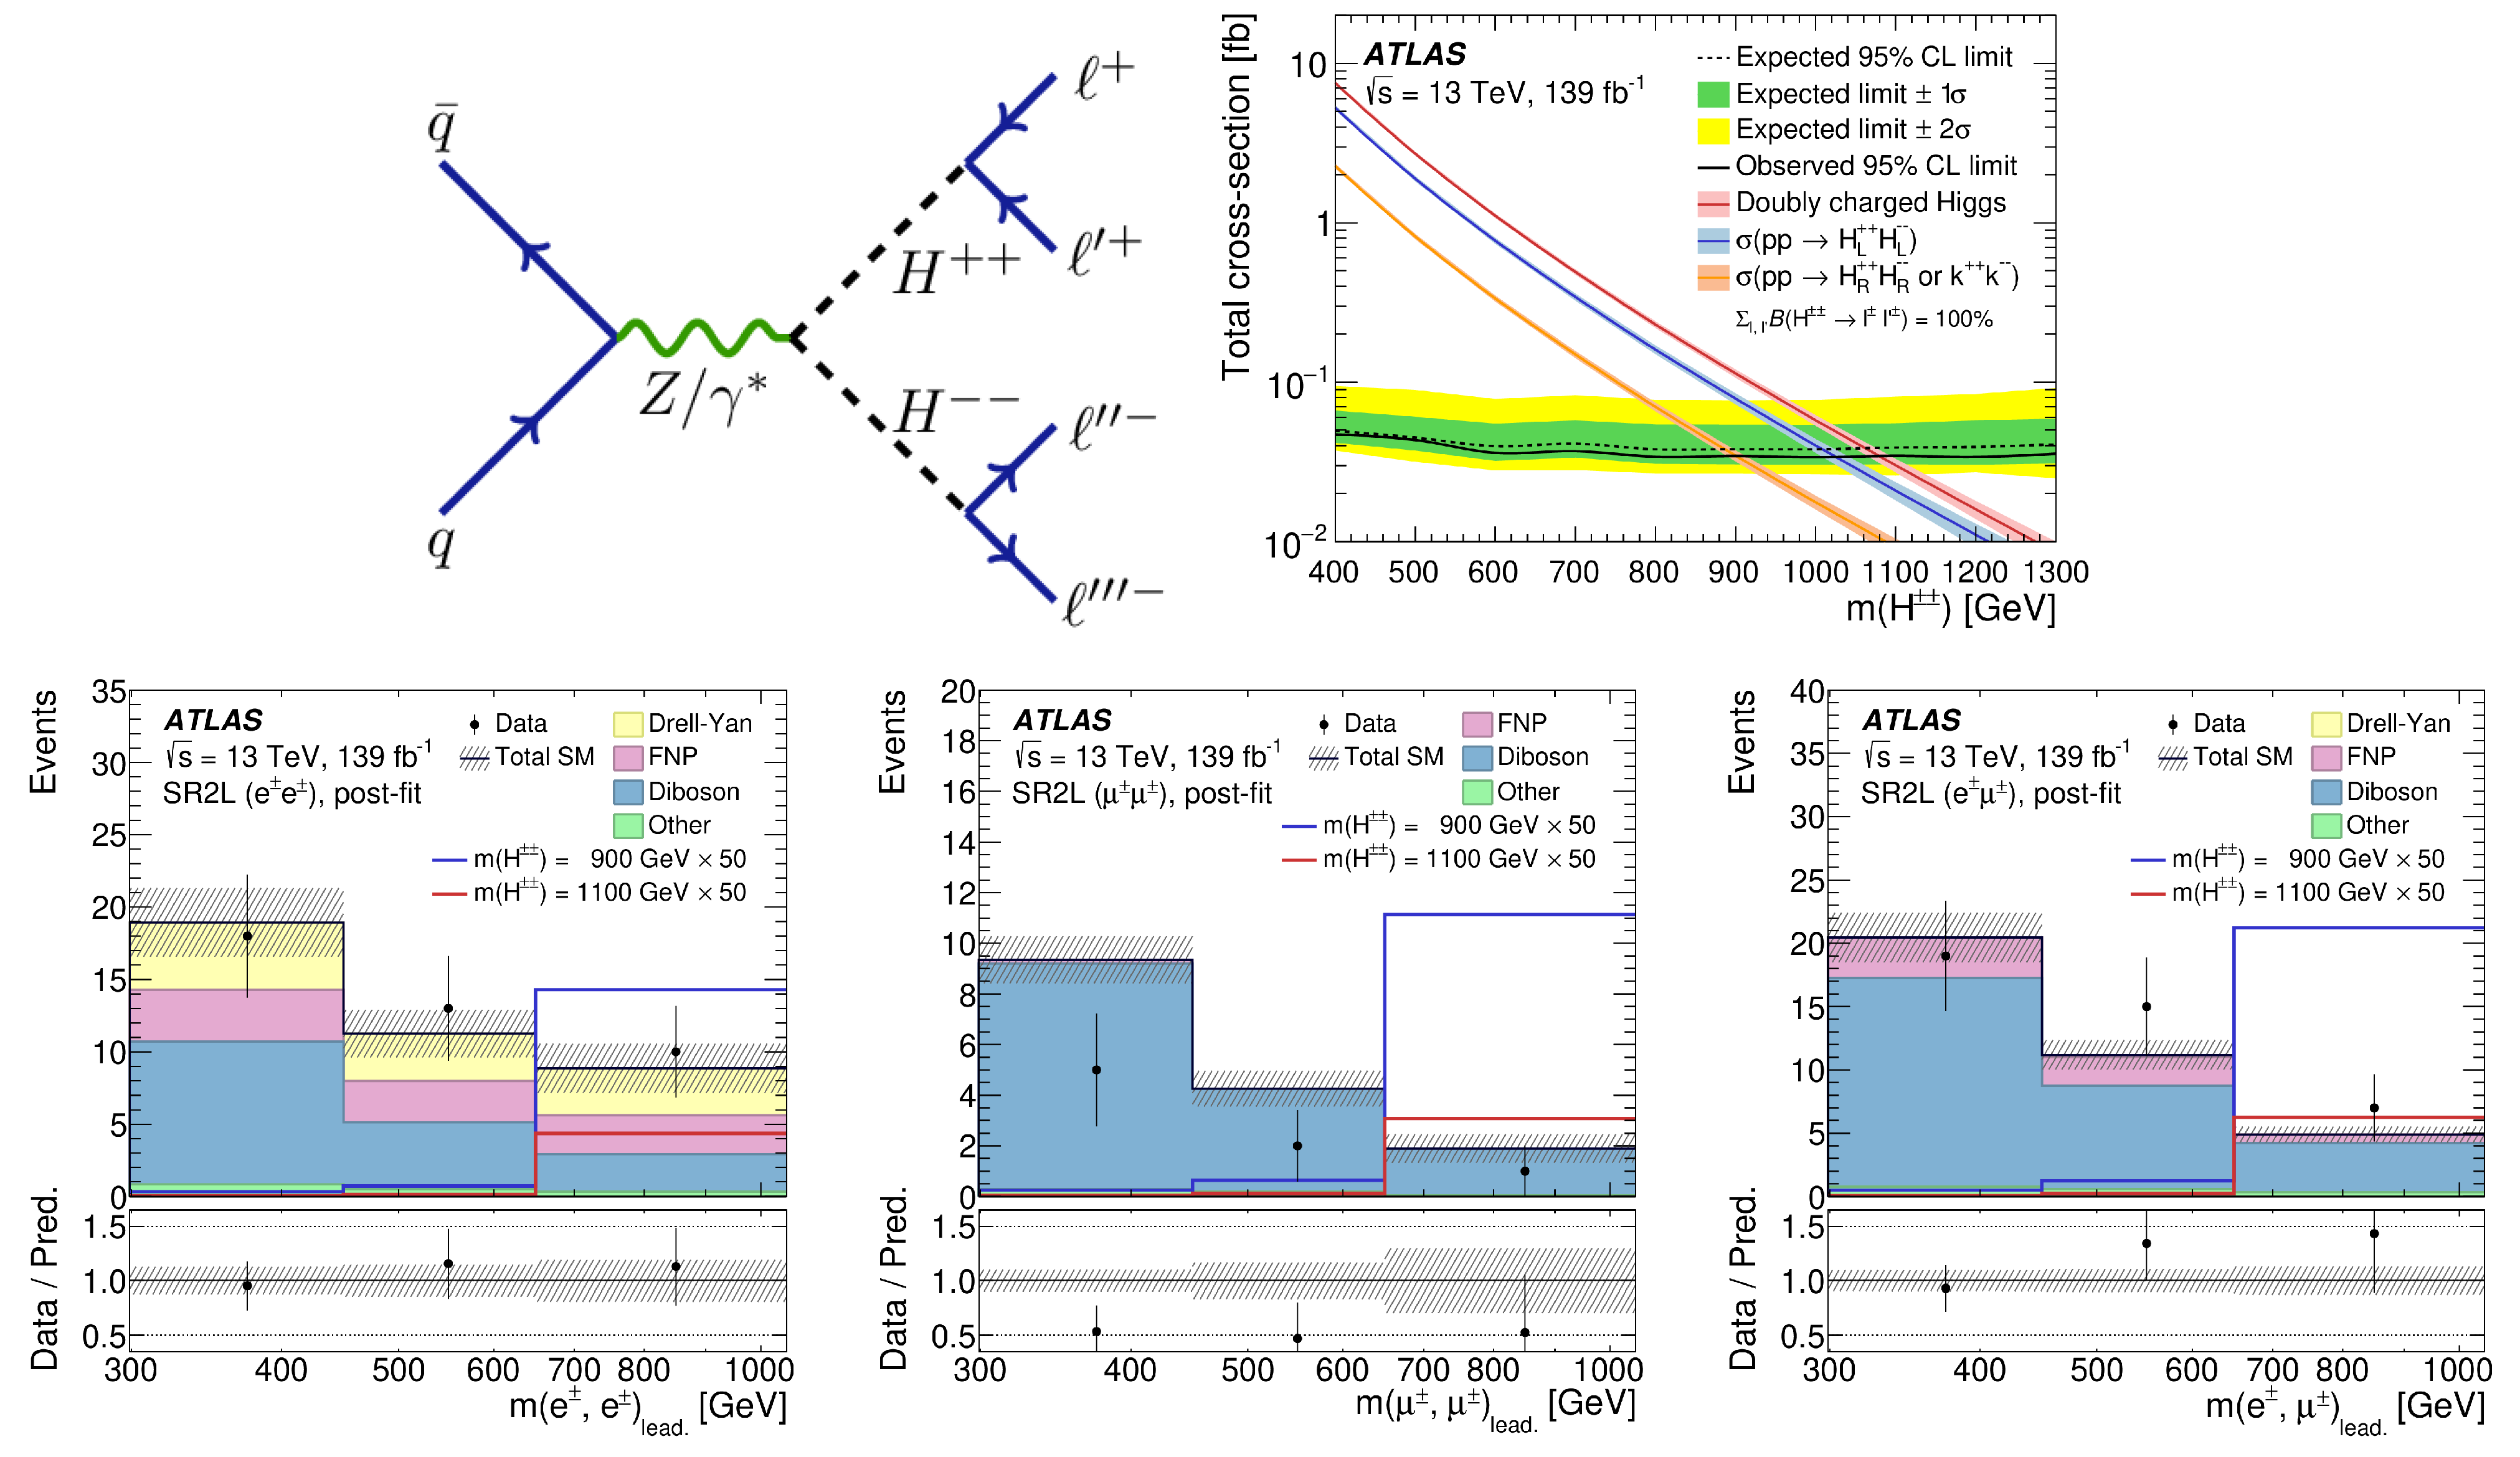
7.4. Double-Charged Higgs Bosons
8. Interpretations and Outlook
8.1. Interpretations of Searches in 2HDM+S
8.2. Interpretations of Heavy Higgs Boson Searches in the Georgi–Machacek Model
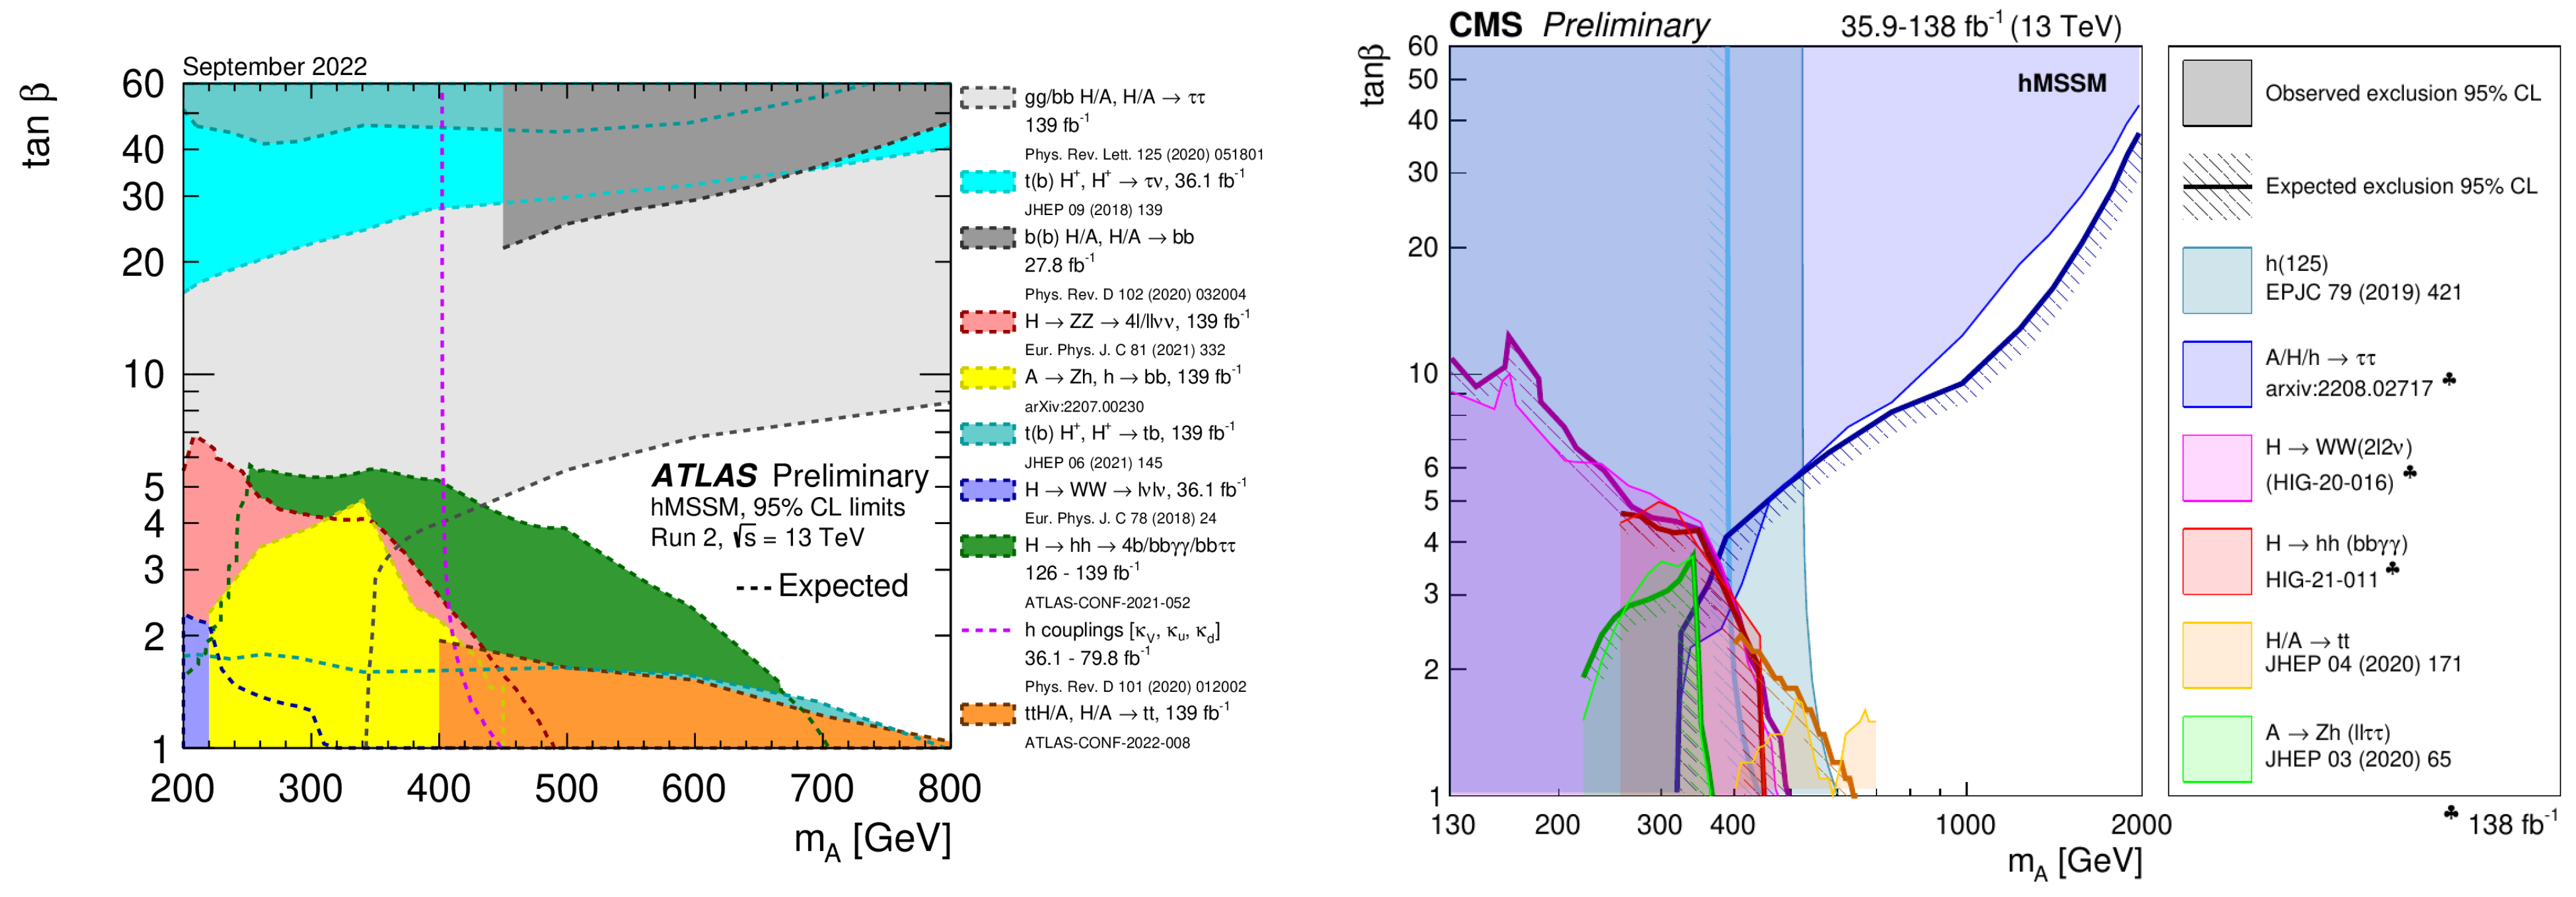
8.3. hMSSM Overview
8.4. LHC Operation, Past, Present and Future
9. Conclusions
Funding
Data Availability Statement
Acknowledgments
Conflicts of Interest
Abbreviations
| ATLAS | A Toroidal LHC ApparatuS |
| BaBar | B meson and B meson antiresonance experiment |
| BDT | Boosted Decision Tree |
| BR | Branching Ratio |
| BSM | Beyond SM |
| CC-BY-4.0 | Creative Commons Attribution 4.0 International |
| CERN | Conseil Européen pour la Recherche Nucléaire (European Organization for Nuclear Research) |
| CMS | Compact Muon Solenoid |
| CL | Confidence Level |
| Charge-Parity | |
| DM | Dark Matter |
| EFT | Effective Field Theory |
| exp. | expectation(s) |
| FFK | Conference on Precision Physics and Fundamental Physical Constants |
| H | Higgs boson |
| HDM | Higgs-Doublet Model |
| HEFT | Higgs EFT |
| HL | High-Luminosity |
| H5 | |
| hMSSM | (LHC measured Higgs mass) MSSM |
| ISR | Initial State Radiation |
| LEP | Large Electron–Positron (collider) |
| LHC | Large Hadron Collider |
| LHCb | LHC beauty |
| LRSM | Left–Righ Symmetric Model |
| LFV | Lepton Flavor Violation |
| MET | Missing Energy Transverse |
| MSSM | Minimal Supersymmetry extension of the Standard Model |
| M125 | mass of SM Higgs boson 125 GeV |
| NMSSM | Next-to-MSSM |
| pp | proton–proton |
| QCD | Quantum Chromodynamics |
| QED | Quantum Electrodynamics |
| S | Singlet |
| SC | Signal Classification |
| SM | Standard Model |
| SS2l | Same-Sign two-lepton |
| s.d. | standard deviation(s) |
| TRSM | Two-Real-scalar-singlet extension of the SM |
| Vector Boson Fusion | |
| WIMP | Weakly Interacting Massive Particle |
| V | Vector boson |
| 2/3HDM | Two/Three-HDM |
References
- ATLAS Collaboration. Observation of a new particle in the search for the Standard Model Higgs boson with the ATLAS detector at the LHC. Phys. Lett. B 2012, 716, 1–29. [Google Scholar] [CrossRef]
- CMS Collaboration. Observation of a new boson at a mass of 125 GeV with the CMS experiment at the LHC. Phys. Lett. B 2012, 716, 30–61. [Google Scholar] [CrossRef]
- Gunion, J.; Haber, H.; Kane, G.; Dawson, S. The Higgs Hunter’s Guide; CRC Press/Taylor & Francis Group: Boca Raton, FL, USA, 1990. [Google Scholar] [CrossRef]
- Sopczak, A. Precision measurements in the Higgs sector at ATLAS and CMS. PoS 2020, 353, 006. [Google Scholar] [CrossRef]
- ATLAS Experiment. Public ATLAS Luminosity Results for Run-3 of the LHC.Online Luminosity Summary Plots for Run-3. Multi-Year Summary Plots. Available online: https://twiki.cern.ch/twiki/bin/view/AtlasPublic/LuminosityPublicResultsRun3 (accessed on 30 May 2024).
- ATLAS Experiment. Event Displays from Collision Data. 900 GeV Collisions. Available online: https://twiki.cern.ch/twiki/bin/view/AtlasPublic/EventDisplayRun2Collisions#900_GeV_Collisions (accessed on 30 May 2024).
- CMS Collaboration. Events Recorded by the CMS Detector During the Proton-Lead Collision Run of 2016; Report CMS-PHO-EVENTS-2016-009; CERN: Geneva, Switzerland, 2016; Available online: https://cds.cern.ch/record/2235235 (accessed on 30 May 2023).
- de Florian, D. et al. [LHC HiggsWorking Group] Handbook of LHC Higgs Cross Sections: 4. Deciphering the Nature of the Higgs Sector; CERN Yellow Report CERN-2017-002-M; CERN: Geneva, Switzerland, 2017. [Google Scholar] [CrossRef]
- ATLAS Collaboration. Luminosity determination in pp collisions at = 13 TeV using the ATLAS detector at the LHC. Eur. Phys. J. C 2023, 83, 982. [Google Scholar] [CrossRef]
- CMS Collaboration. Public CMS Luminosity Information. Full Summary: Proton–Proton Collisions Since 2010 (Run 1 + Run 2 + Run 3). Available online: https://twiki.cern.ch/twiki/bin/view/CMSPublic/LumiPublicResults (accessed on 30 May 2024).
- The ATLAS Collaboration. A detailed map of Higgs boson interactions by the ATLAS experiment ten years after the discovery. Nature 2022, 607, 52–59. [Google Scholar] [CrossRef]
- The CMS Collaboration. A portrait of the Higgs boson by the CMS experiment ten years after the discovery. Nature 2022, 607, 60–68. [Google Scholar] [CrossRef] [PubMed]
- The CMS Collaboration. Measurement of the Higgs boson width and evidence of its off-shell contributions to ZZ production. First evidence for off-shell production of the Higgs boson and measurement of its width. Nat. Phys. 2022, 18, 1329–1334. [Google Scholar] [CrossRef]
- The ATLAS Collaboration. Evidence of off-shell Higgs boson production from ZZ leptonic decay channels and constraints on its total width with the ATLAS detector. Phys. Lett. B 2023, 846, 138223. [Google Scholar] [CrossRef]
- ATLAS Collaboration. Measurement of the CP properties of Higgs boson interactions with τ-leptons with the ATLAS detector. Eur. Phys. J. C 2023, 83, 563. [Google Scholar] [CrossRef]
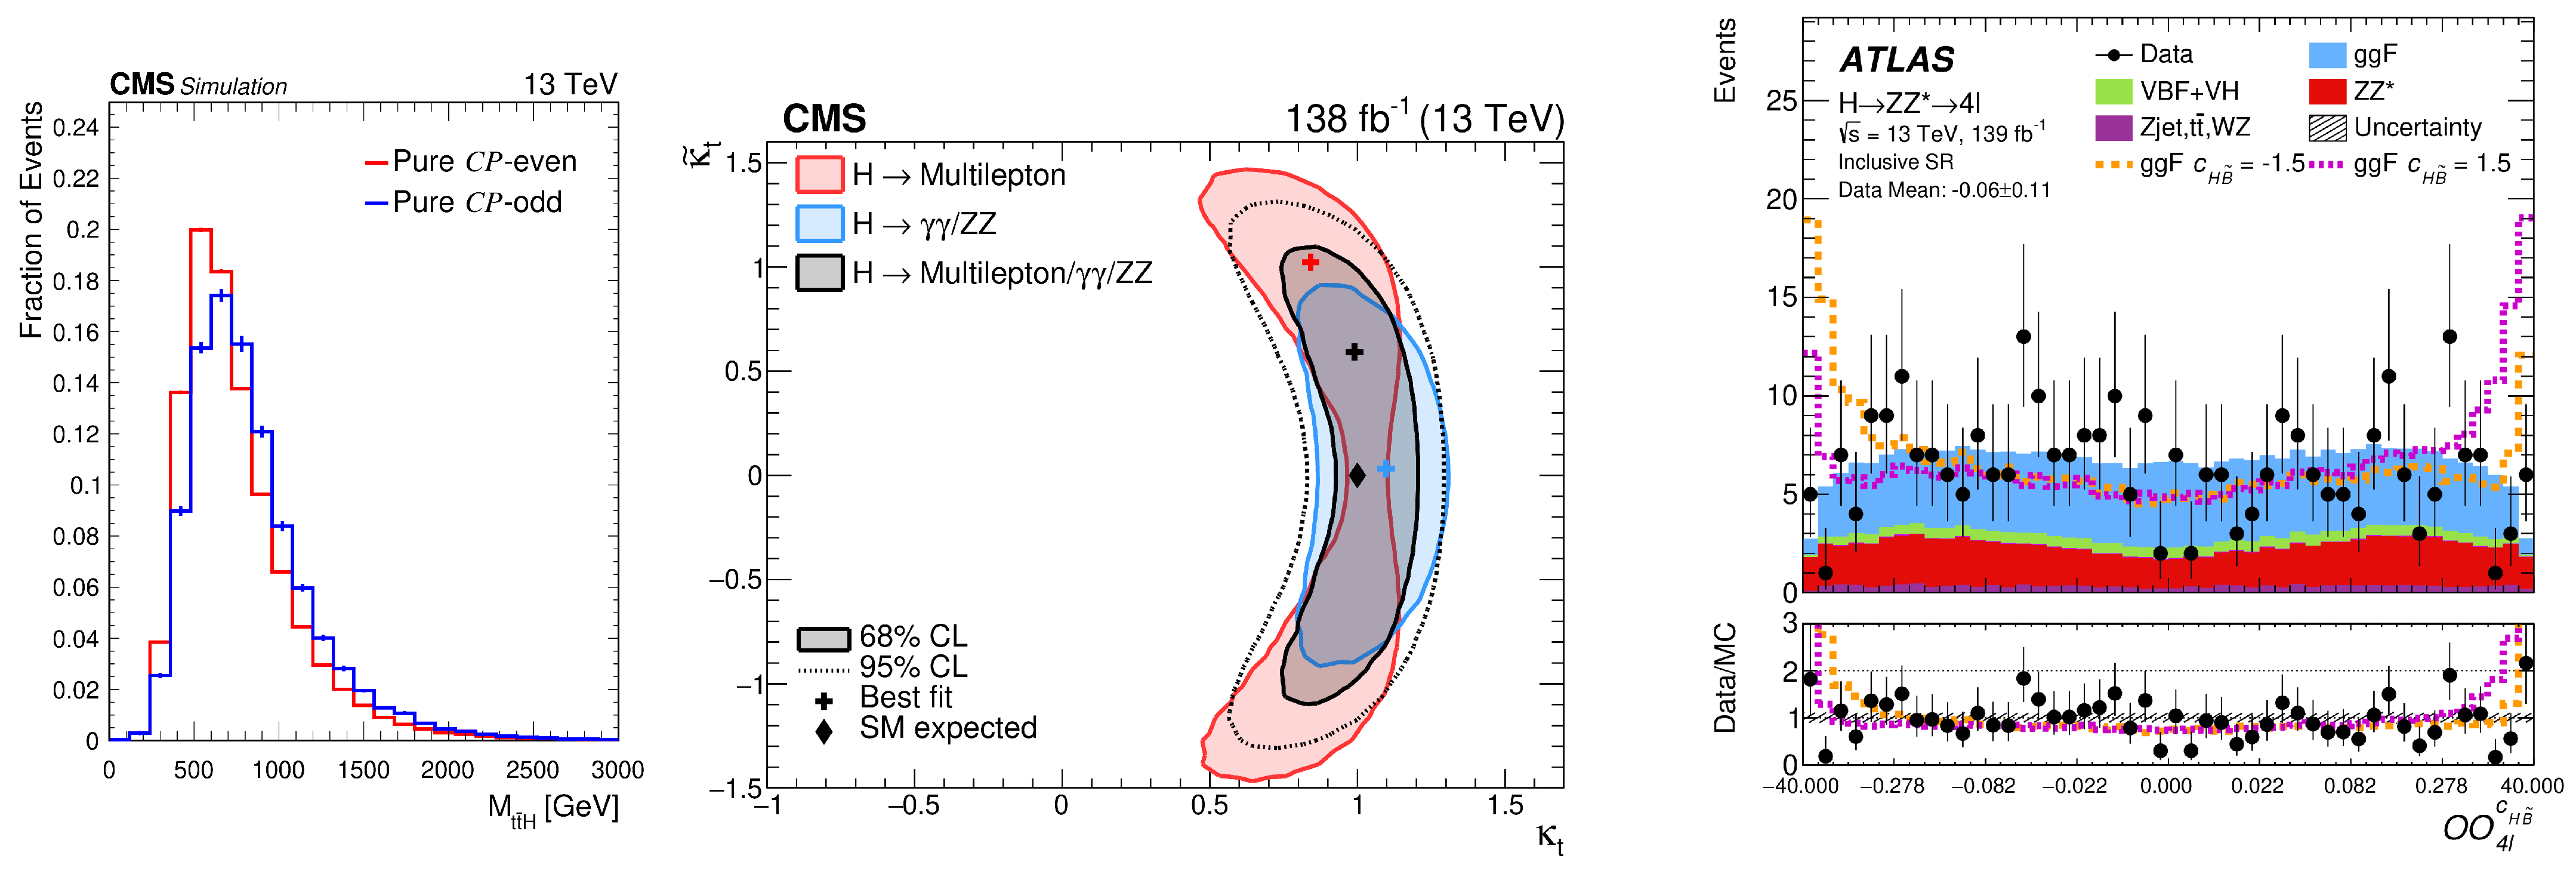
- The CMS Collaboration. Search for CP violation in ttH and tH production in multilepton channels in proton–proton collisions at = 13 TeV. J. High Energy Phys. 2023, 2023, 92. [Google Scholar] [CrossRef]
- The ATLAS Collaboration. Test of CP-invariance of the Higgs boson in vector-boson fusion production and its decay into four leptons J. High Energy Phys. 2024, 2024, 105. [CrossRef]
- Brivio, I.; Trott, M. The Standard Model as an effective field theory. Phys. Rep. 2019, 793, 1–98. [Google Scholar] [CrossRef]
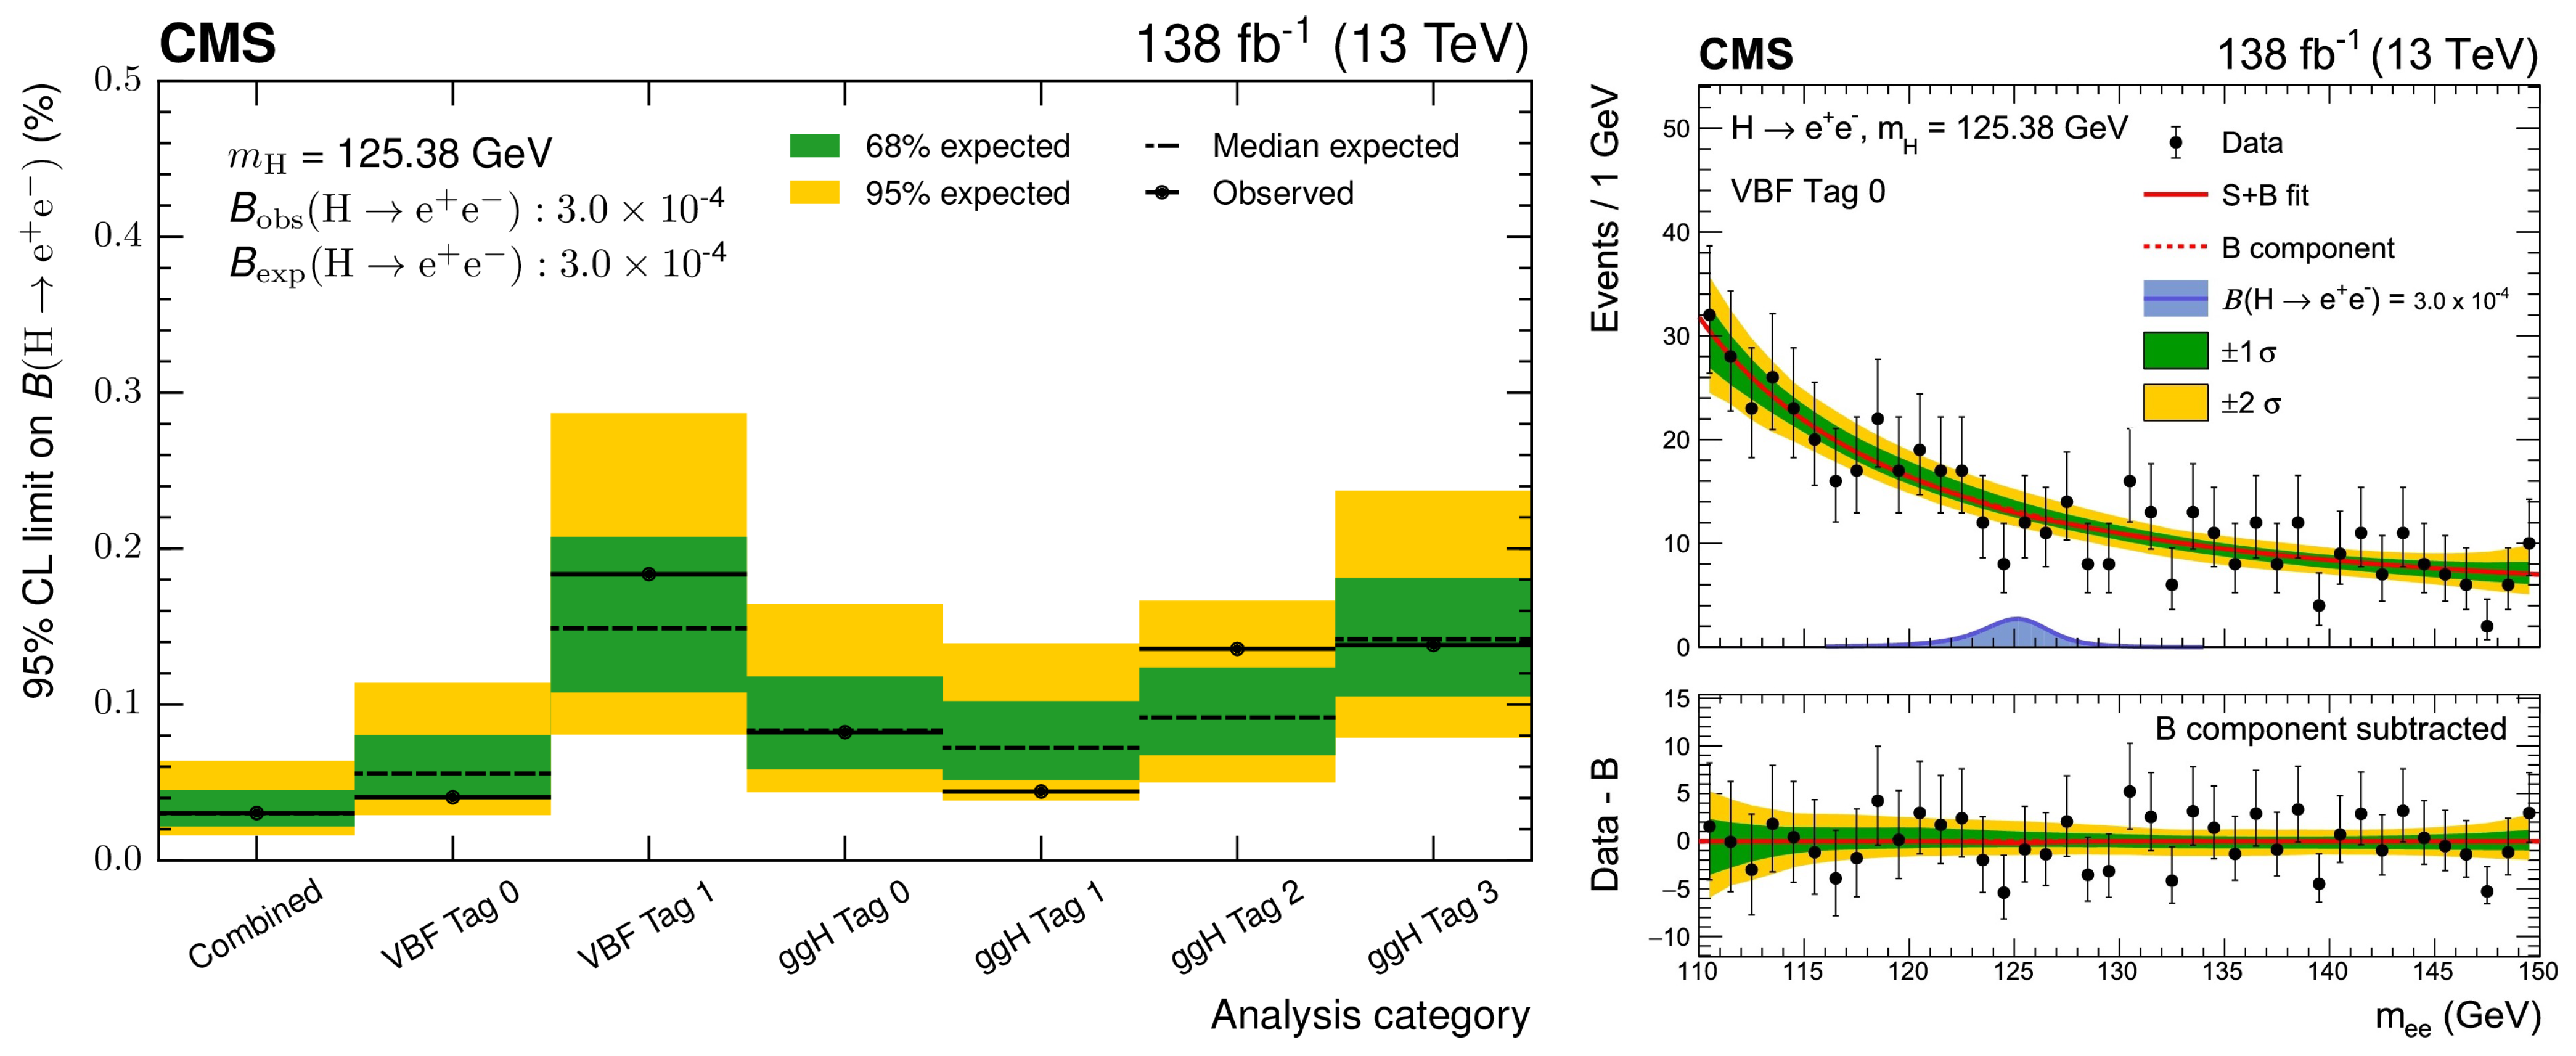
- The CMS Collaboration. Search for the Higgs boson decay to a pair of electrons in proton–proton collisions at = 13 TeV. Phys. Lett. B 2023, 846, 137783. [Google Scholar] [CrossRef]
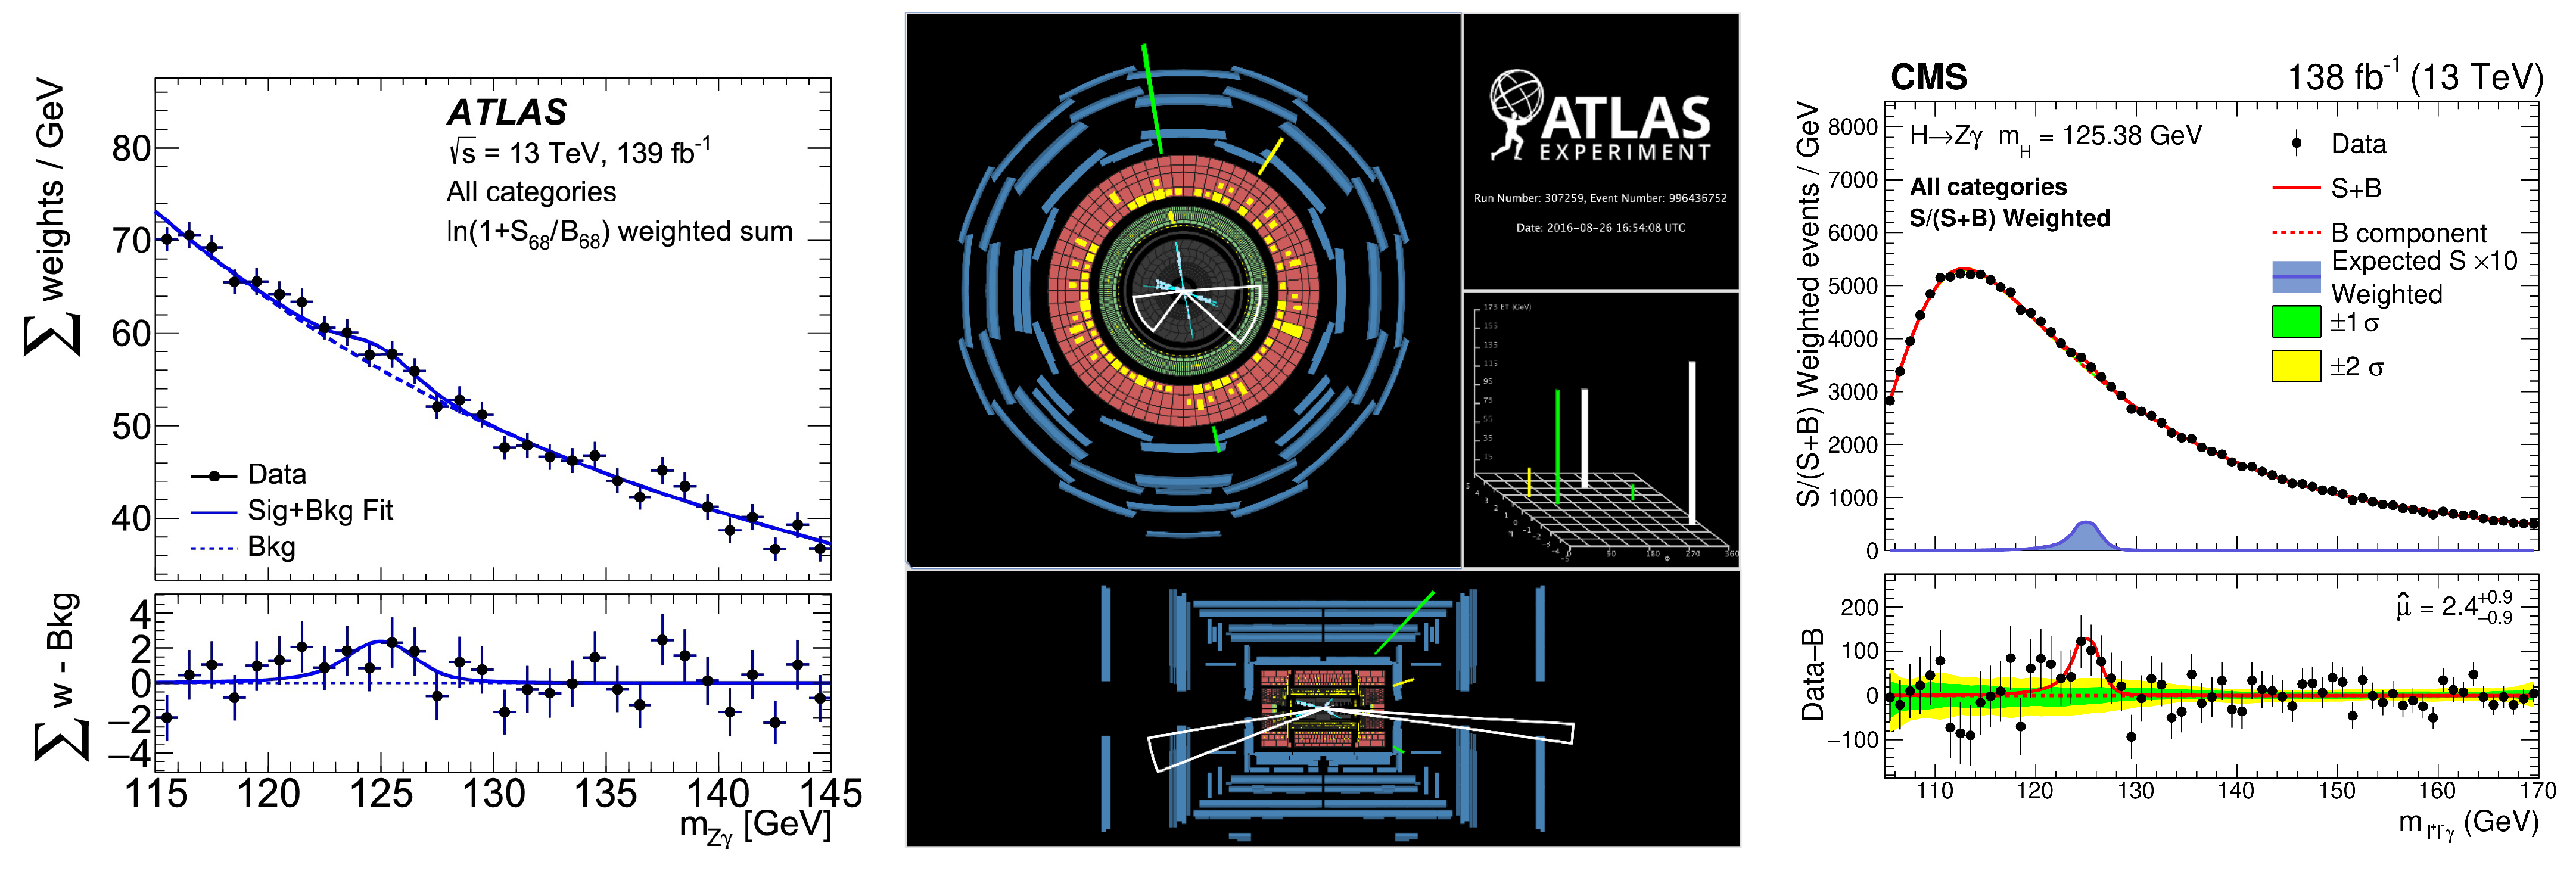
- The ATLAS Collaboration. A search for the Zγ decay mode of the Higgs boson in pp collisions at = 13 TeV with the ATLAS detector. Phys. Lett. B 2020, 809, 135754. [Google Scholar] [CrossRef]
- The CMS Collaboration. Search for Higgs boson decays to a Z boson and a photon in proton–proton collisions at = 13 TeV. J. High Energy Phys. 2023, 2023, 233. [Google Scholar] [CrossRef]
- Aad, G. et al. [ATLAS and CMS Collaborations] Evidence for the Higgs boson decay to a Z boson and a photon at the LHC. Phys. Rev. Lett. 2024, 132, 0211803. [Google Scholar] [CrossRef]
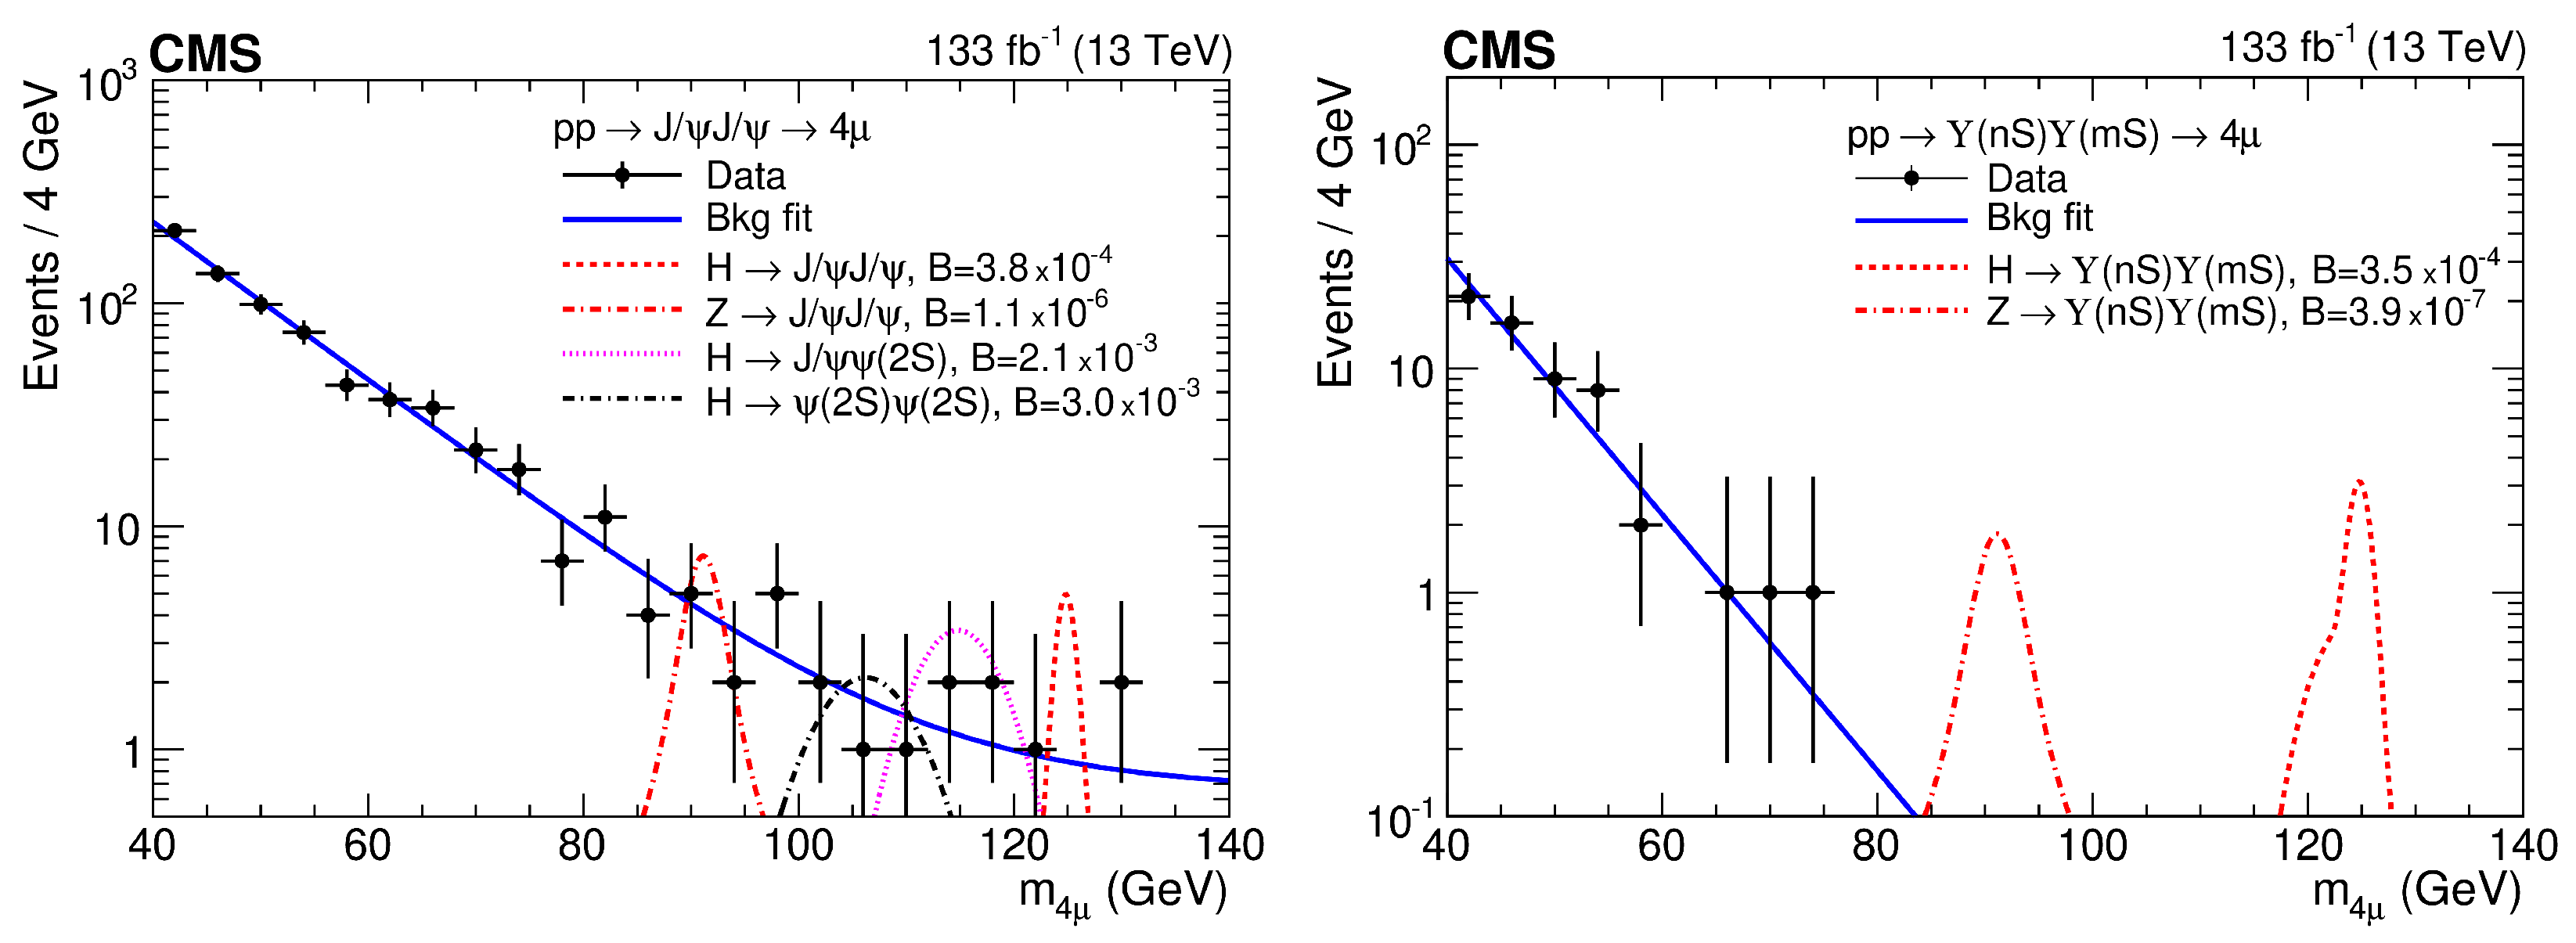
- The CMS Collaboration. Search for Higgs boson decays into Z and J/ψ and for Higgs and Z boson decays into J/ψ or Y pairs in pp collisions at = 13 TeV. Phys. Lett. B 2023, 842, 137534. [Google Scholar] [CrossRef]
- The ATLAS Collaboration. Search for exclusive Higgs and Z boson decays to ωγ and Higgs boson decays to K*γ with the ATLAS detector. Phys. Lett. B 2023, 847, 138292. [Google Scholar] [CrossRef]
- The ATLAS Collaboration. Summary of ATLAS Searches for Higgs and Z Boson Decays to a Meson and a Photon; Report ATL-PHYS-PUB-2023-004; CERN: Geneva, Switzerland, 2023; Available online: https://cds.cern.ch/record/2851888 (accessed on 30 May 2024).
- The ATLAS Collaboration. Searches for lepton-flavour-violating decays of the Higgs boson into eτ and μτ in = 13 TeV pp collisions with the ATLAS detector. J. High Energy Phys. 2023, 2023, 166. [Google Scholar] [CrossRef]
- Hayrapetyan, A. et al. [CMS Collaboration] Search for the lepton-flavor violating decay of the Higgs boson and additional Higgs bosons in the eμ final state in proton–proton collisions at = 13 TeV. Phys. Rev. D 2023, 108, 072004. [Google Scholar] [CrossRef]
- The ATLAS Collaboration. Search for the Higgs boson decays H→ee and H→eμ in pp collisions at = 13 TeV with the ATLAS detector. Phys. Lett. B 2020, 801, 135148. [Google Scholar] [CrossRef]
- Patt, B.; Wilczek, F. Higgs-field portal into hidden sectors. arXiv 2006, arXiv:hep-ph/0605188. [Google Scholar] [CrossRef]
- The ATLAS Collaboration. Combination of searches for invisible decays of the Higgs boson using 139 fb−1 of proton–proton collision data at = 13 TeV collected with the ATLAS experiment. Phys. Lett. B 2023, 842, 137963. [Google Scholar] [CrossRef]
- CMS Collaboration. A search for decays of the Higgs boson to invisible particles in events with a top-antitop quark pair or a vector boson in proton–proton collisions at = 13 TeV. Eur. Phys. J. C 2023, 83, 933. [Google Scholar] [CrossRef] [PubMed]
- Clowe, D.; Bradac, M.; Gonzalez, A.H.; Markevitch, M.; Randall, S.W.; Jones, C.; Zaritsky, D. A direct empirical proof of the existence of dark matter. Astrophys. J. Lett. 2006, 648, L109–L113. [Google Scholar] [CrossRef]
- Fabbrichesi, M.; Gabrielli, E.; Lanfranchi, G. The Dark Photon. A Primer; Springer Nature Switzerland AG: Cham, Switzerland, 2021. [Google Scholar] [CrossRef]
- The ATLAS Collaboration. Search for dark photons from Higgs boson decays via ZH production with a photon plus missing transverse momentum signature from pp collisions at = 13 TeV with the ATLAS detector. J. High Energy Phys. 2023, 2023, 133. [Google Scholar] [CrossRef]
- Peccei, R.D.; Quinn, H.R. Constraints imposed by CP conservation in the presence of pseudoparticles. Phys. Rev. D 1977, 16, 1791–1797. [Google Scholar] [CrossRef]
- The CMS Collaboration. Search for an exotic decay of the Higgs boson into a Z boson and a pseudoscalar particle in proton–proton collisions at = 13 TeV. Phys. Lett. B 2023, 852, 138582. [Google Scholar] [CrossRef]
- CMS Collaboration. Search for exotic decays of the Higgs boson to a pair of pseudoscalars in the μμbb and ττbb final states. Eur. Phys. J. C 2024, 84, 493. [Google Scholar] [CrossRef]
- The CMS Collaboration. Search for direct production of GeV-scale resonances decaying to a pair of muons in proton–proton collisions at = 13 TeV. J. High Energy Phys. 2023, 2023, 70. [Google Scholar] [CrossRef]
- The LHCb Collaboration. Searches for low-mass dimuon resonances. J. High Energy Phys. 2020, 2020, 156. [Google Scholar] [CrossRef]
- Lees, J.P. et al. [BaBar Collaboration] Search for a dark photon in e+e− collisions at BaBar. Phys. Rev. Lett. 2014, 113, 201801. [Google Scholar] [CrossRef] [PubMed]
- Tumasyan, A. et al. [CMS Collaboration] Search for exotic Higgs boson decays H→AA→4γ with events containing two merged diphotons in proton–proton collisions at = 13 TeV. Phys. Rev. Lett. 2023, 131, 101801. [Google Scholar] [CrossRef] [PubMed]
- The ATLAS Collaboration. Probing the CP nature of the top–Higgs Yukawa coupling in tH and tH events with H→b decays using the ATLAS detector at the LHC. Phys. Lett. B 2023, 849, 138469. [Google Scholar] [CrossRef]
- Sirunyan, A.M. et al. [CMS Collaboration] Search for associated production of a Higgs boson and a single top quark in proton–proton collisions at = 13 TeV. Phys. Rev. D 2019, 99, 092005. [Google Scholar] [CrossRef]
- The CMS Collaboration. Measurement of the tH and tH production rates in the H→b decay channel using proton–proton collision data at = 13 TeV. arXiv 2024, arXiv:2407.10896. [CrossRef]
- The ATLAS Collaboration. Constraints on the Higgs boson self-coupling from single- and double-Higgs production with the ATLAS detector using pp collisions at = 13 TeV. Phys. Lett. B 2023, 843, 137745. [Google Scholar] [CrossRef]
- The ATLAS Collaboration. Search for resonant and non-resonant Higgs boson pair production in the bτ+τ− decay channel using 13 TeV pp collision data from the ATLAS detector. J. High Energy Phys. 2023, 2023, 40. [Google Scholar] [CrossRef]
- Aad, G. et al. [ATLAS Collaboration] Search for nonresonant pair production of Higgs bosons in the bb final state in pp collisions at = 13 TeV with the ATLAS detector. Phys. Rev. D 2023, 108, 052003. [Google Scholar] [CrossRef]
- The CMS Collaboration. Search for Higgs production in the b W+W− decay mode in proton-proton collisions at = 13 TeV. J. High Energy Phys. 2024, 2024, 293. [Google Scholar] [CrossRef]
- CMS Collaboration. Higgs PAG Summary Plots. Summary of Run-2 κλ and κ2V measurements from HH production. Available online: https://twiki.cern.ch/twiki/bin/view/CMSPublic/SummaryResultsHIG (accessed on 30 May 2024).
- The CMS Collaboration. Constraints on the Higgs boson self-coupling from the combination of single and double Higgs boson production in proton–proton collisions at = 13 TeV. arXiv 2024, arXiv:2407.13554. [CrossRef]
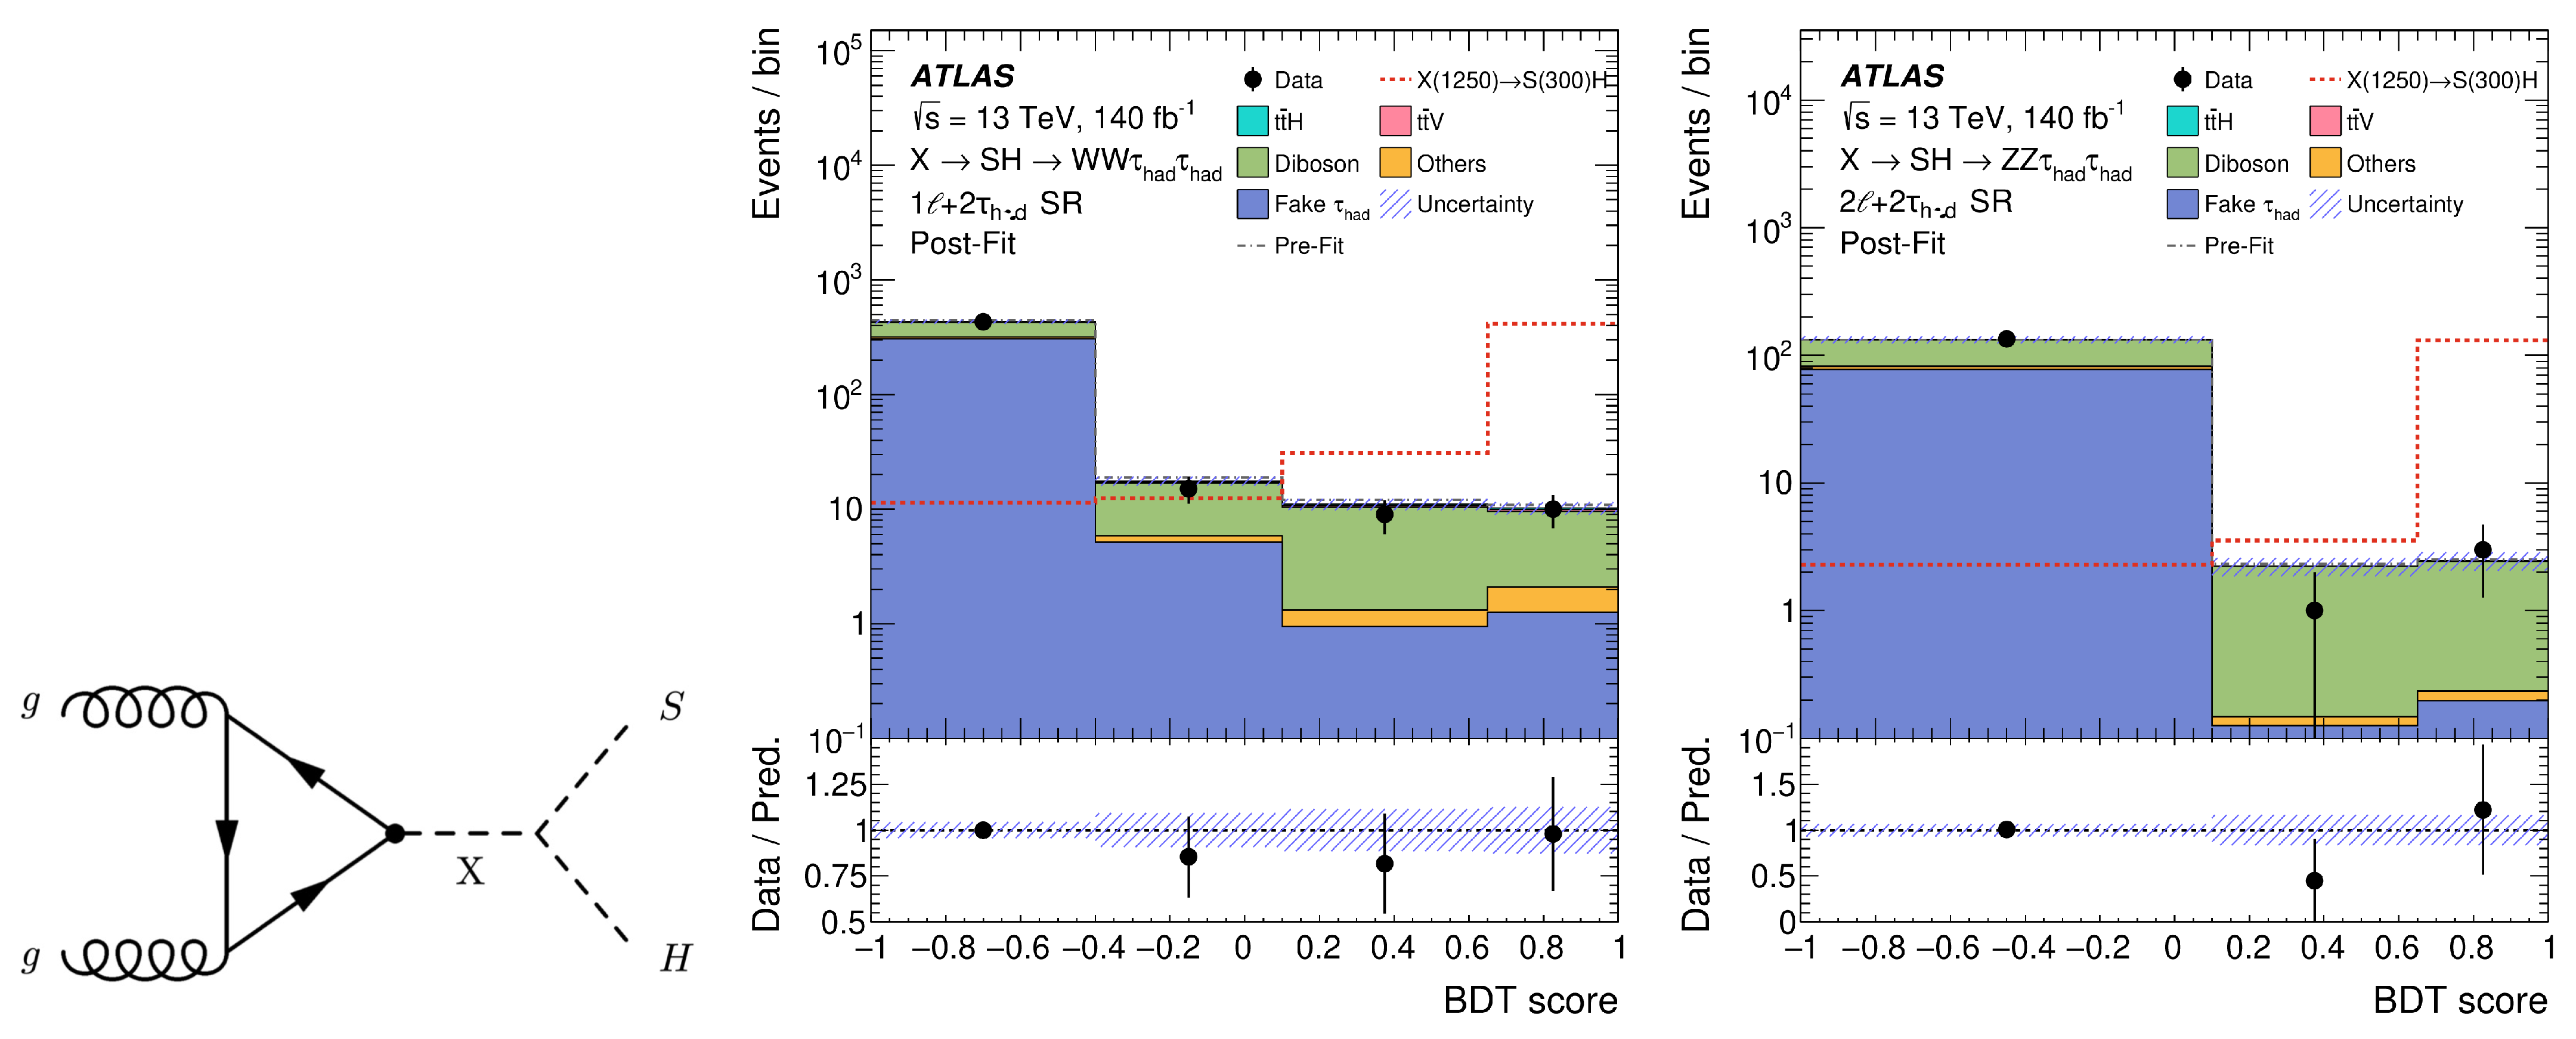
- The ATLAS Collaboration. Search for a new heavy scalar particle decaying into a Higgs boson and a new scalar singlet in final states with one or two light leptons and a pair of τ-leptons with the ATLAS detector. J. High Energy Phys. 2023, 2023, 9. [Google Scholar] [CrossRef]
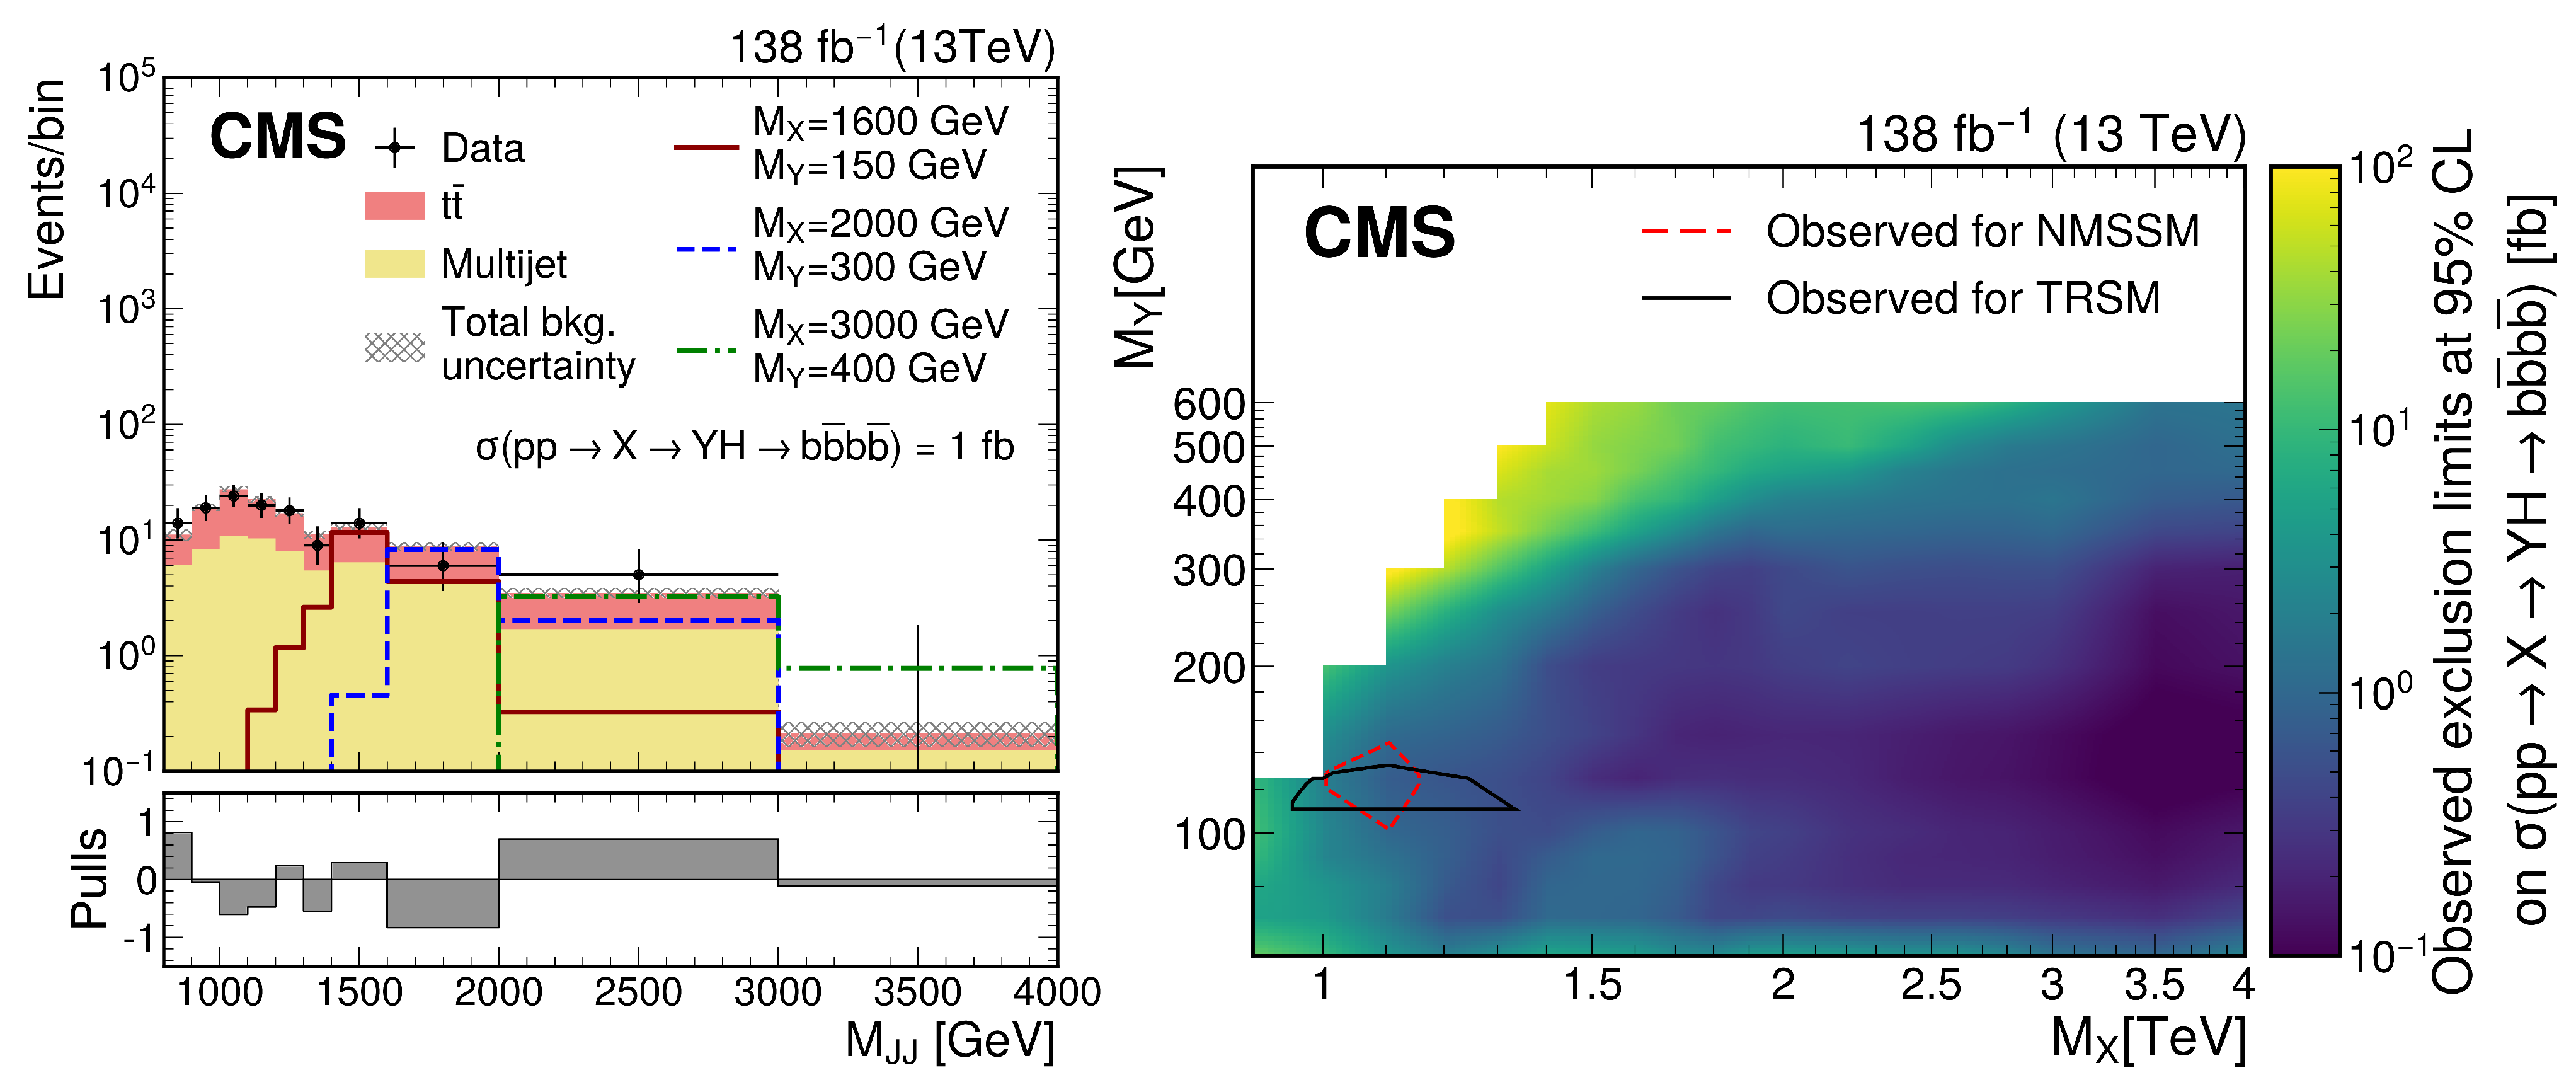
- The CMS Collaboration. Search for a massive scalar resonance decaying to a light scalar and a Higgs boson in the four b quarks final state with boosted topology. Phys. Lett. B 2023, 842, 137392. [Google Scholar] [CrossRef]
- Aad, G. et al. [ATLAS Collaboration] Combination of searches for resonant Higgs boson pair production using pp collisions at = 13 TeV with the ATLAS detector. Phys. Rev. Lett. 2024, 132, 231801. [Google Scholar] [CrossRef] [PubMed]
- CMS Collaboration. CMS Beyond SM Particles Decaying 2(to) Higgs, top and Gauge Bosons (B2G) Public Physics Results. Summary of Public Di-Boson Results (August 2023 and March 2024). Available online: https://twiki.cern.ch/twiki/bin/view/CMSPublic/PhysicsResultsB2G (accessed on 30 May 2024).
- The CMS Collaboration. Search for a standard model-like Higgs boson in the mass range between 70 and 110 GeV in the diphoton final state in proton–proton collisions at = 13 TeV. arXiv 2024, arXiv:2405.18149. [CrossRef]
- The ATLAS Collaboration. Search for diphoton resonances in the 66 to 110 GeV mass range using 140 fb−1 of 13 TeV pp collisions collected with the ATLAS detector. arXiv 2024, arXiv:2407.07546. [CrossRef]
- Sopczak, A. Searches for Higgs bosons beyond the Standard Model. In Proceedings of the XII International Workshop on Deep Inelastic Scattering (DIS 2004), Štrbské Pleso, Slovakia, 14–18 April 2004; Bruncko, D., Ferencei, J., Strízenec, P., Eds.; Institute of Experimental Physics SAS: Košice, Slovak Republic, 2004; pp. 1017–1022. [Google Scholar] [CrossRef]
- Sopczak, A. A general MSSM parameter scan. Int. J. Mod. Phys. A 2001, 816–818. [Google Scholar] [CrossRef]
- The ATLAS Collaboration. Search for a CP-odd Higgs Boson decaying into a heavy CP-even Higgs boson and a Z boson in the ℓ+ℓ−t and νb final states using 140 fb−1 of data collected with the ATLAS detector. J. High Energy Phys. 2024, 2024, 197. [Google Scholar] [CrossRef]
- The CMS Collaboration. Search for Higgs boson pair production with one associated vector boson in proton–proton collisions at = 13 TeV. arXiv 2024, arXiv:2404.08462. [Google Scholar] [CrossRef]
- ATLAS Collaboration. Search for Higgs boson pair production in association with a vector boson in pp collisions at = 13 TeV with the ATLAS detector. Eur. Phys. J. C 2023, 83, 519. [Google Scholar] [CrossRef]
- Kuang, Y.-P.; Ren, H.-Y.; Xia, L.-H. Model-independent probe of anomalous heavy neutral Higgs bosons at the LHC. Phys. Rev. D 2014, 90, 115002. [Google Scholar] [CrossRef]
- The ATLAS Collaboration. A search for heavy Higgs bosons decaying into vector bosons in same-sign two-lepton final states in pp collisions at = 13 TeV with the ATLAS detector. J. High Energy Phys. 2023, 2023, 200. [Google Scholar] [CrossRef]
- The ATLAS Collaboration. Search for tH/A→tt production in the multilepton final state in proton–proton collisions at = 13 TeV with the ATLAS detector. J. High Energy Phys. 2023, 2023, 203. [Google Scholar] [CrossRef]
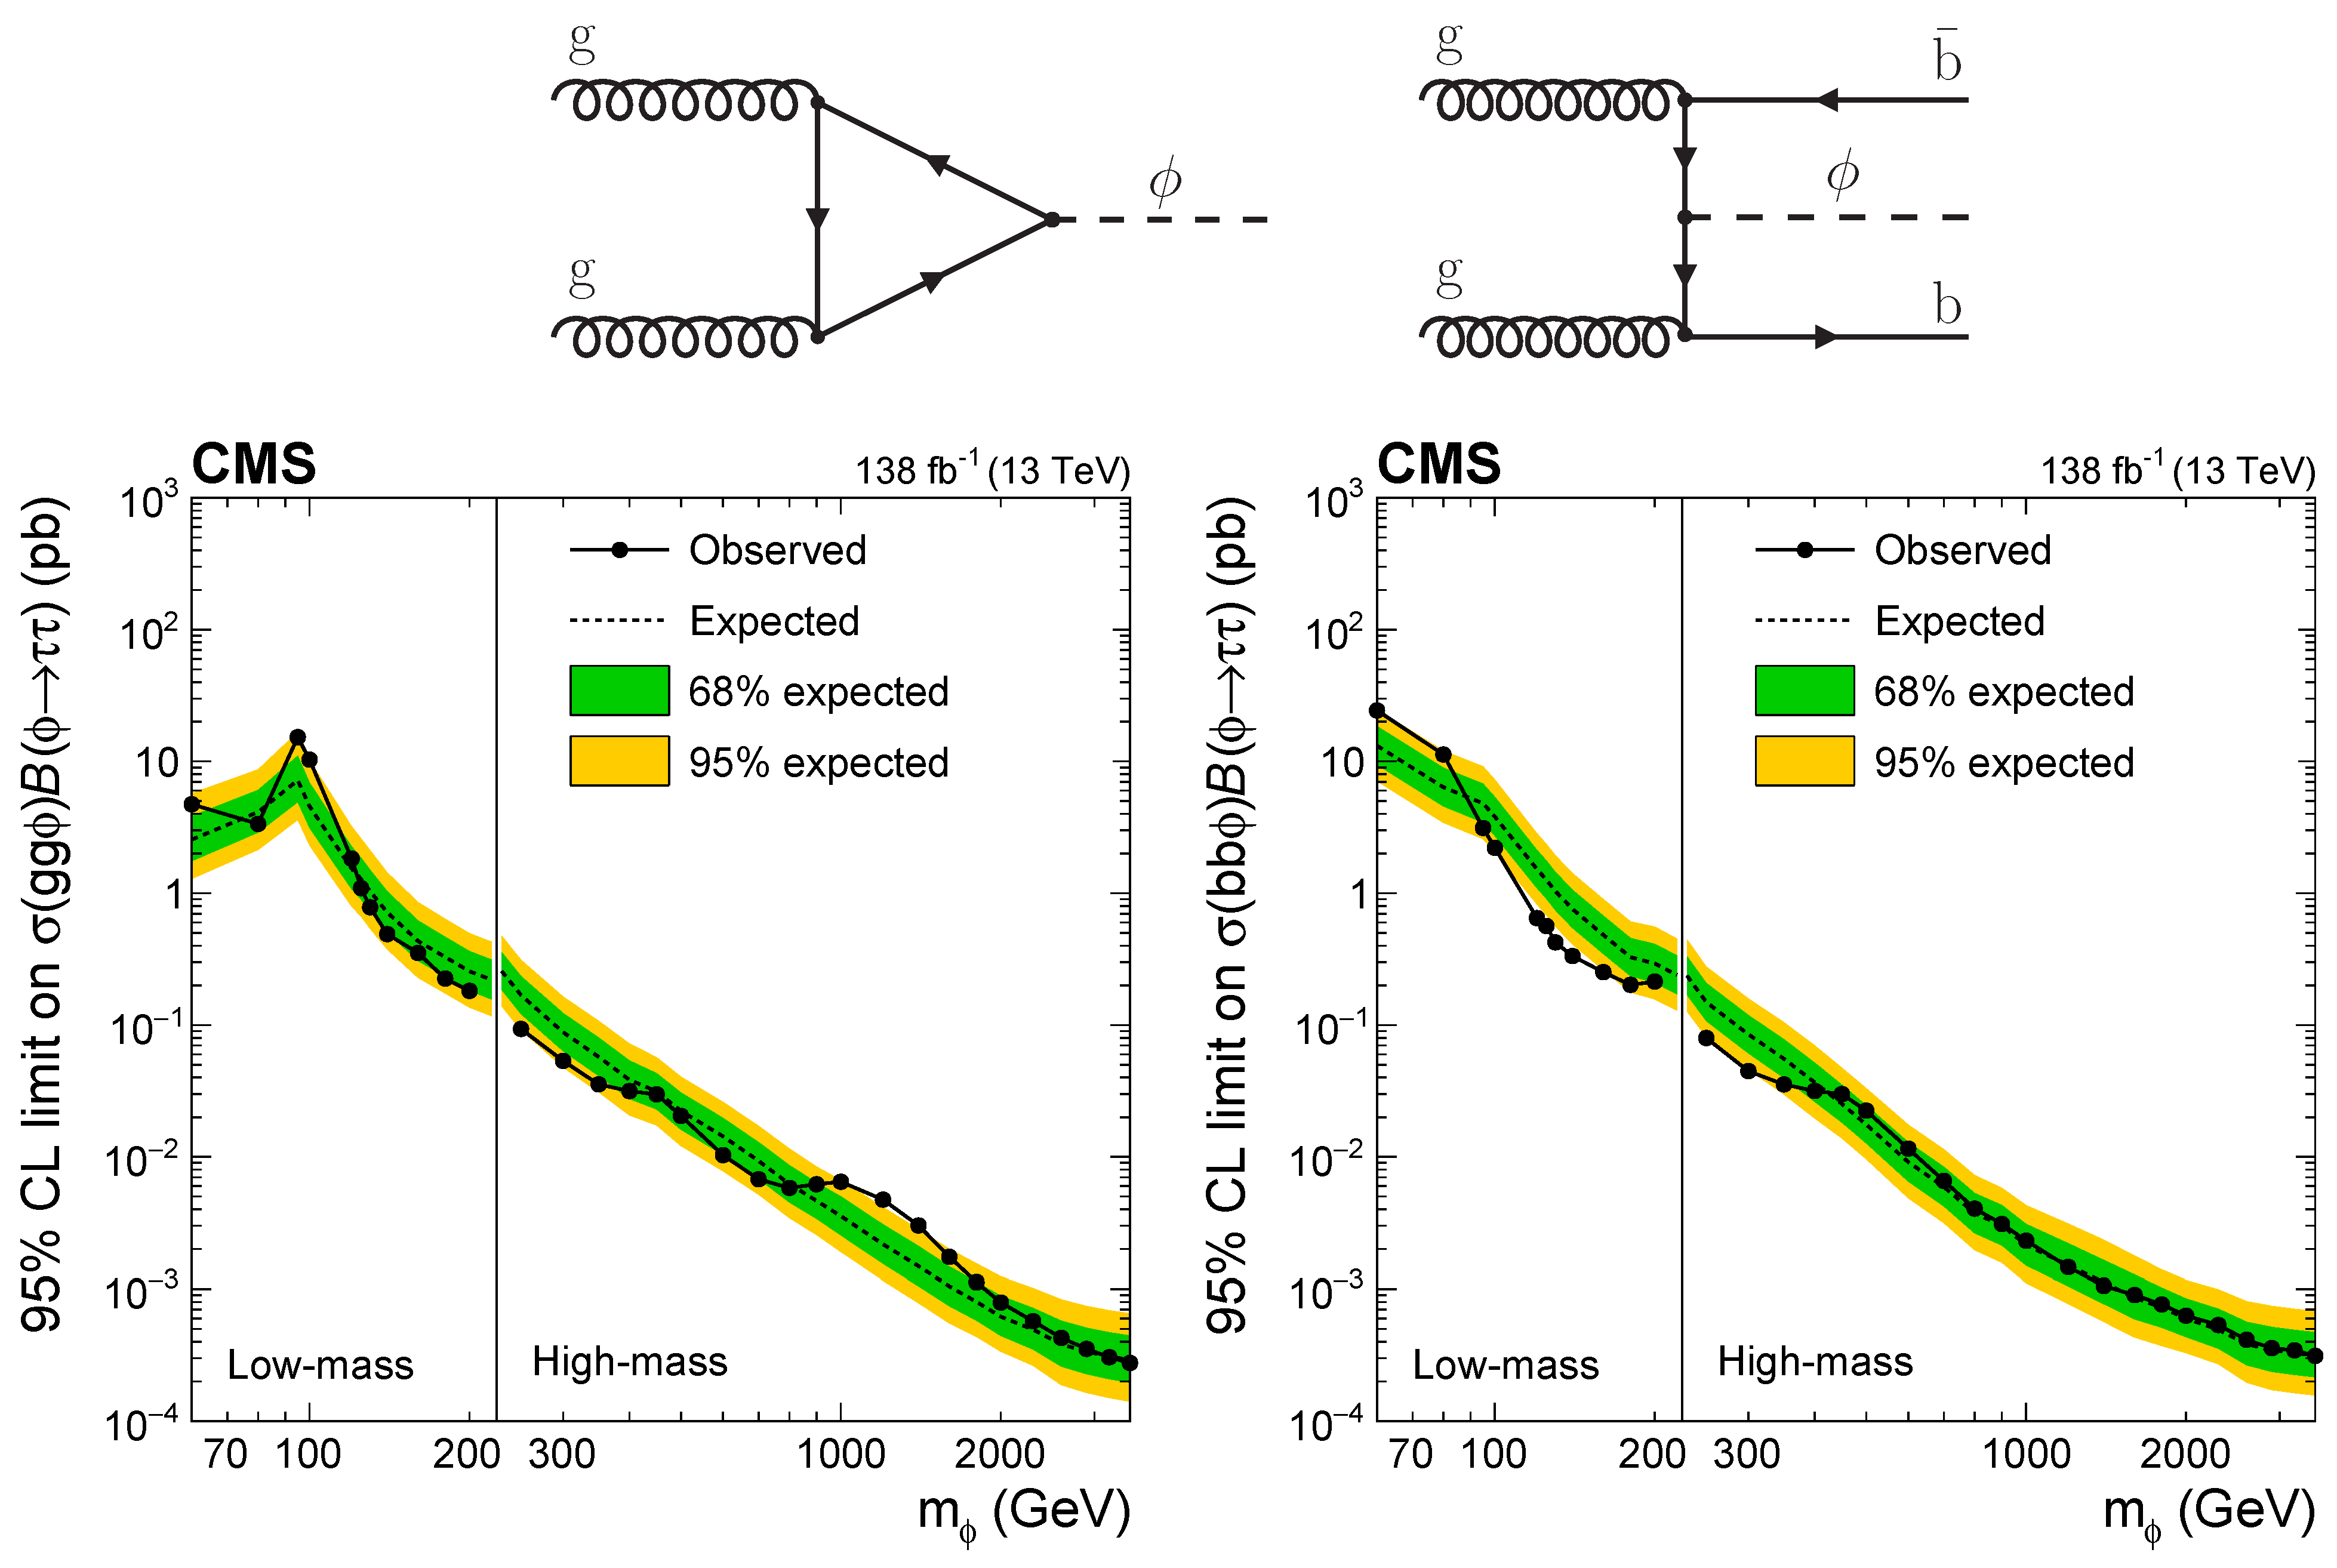
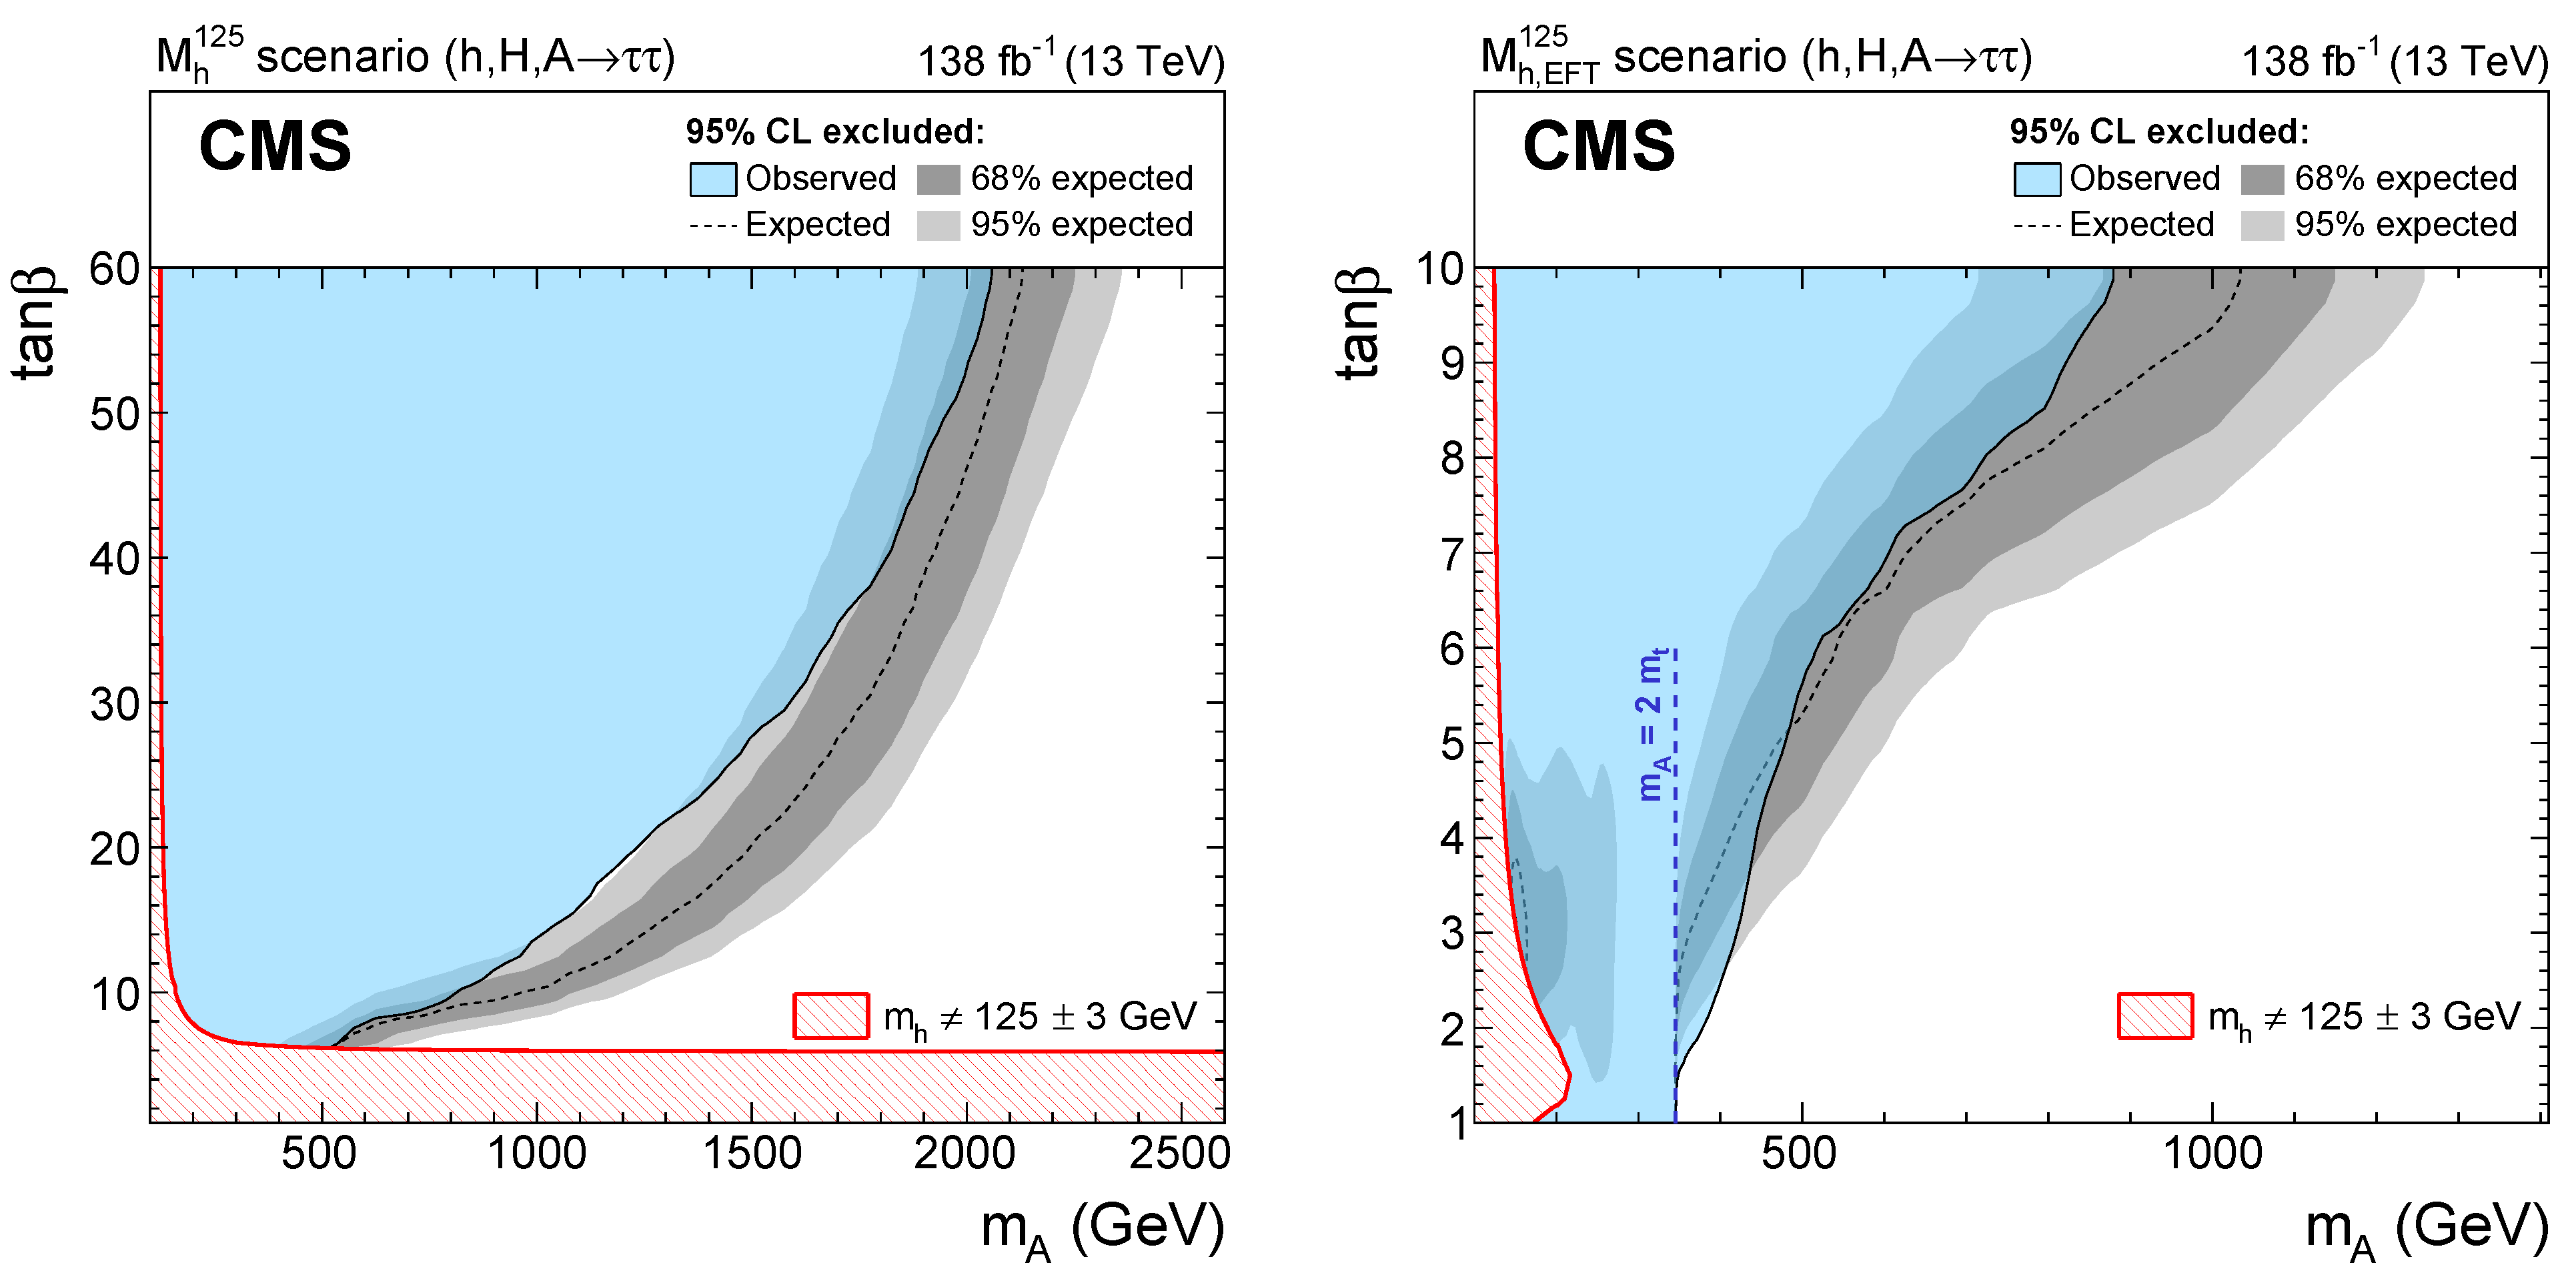
- The CMS Collaboration. Searches for additional Higgs bosons and for vector leptoquarks in ττ final states in proton–proton collisions at = 13 TeV. J. High Energy Phys. 2023, 2023, 73. [Google Scholar] [CrossRef]
- The ATLAS Collaboration. Search for dark matter produced in association with a Higgs boson decaying to tau leptons at = 13 TeV with the ATLAS detector. J. High Energy Phys. 2023, 2023, 189. [Google Scholar] [CrossRef]
- Aad, G. et al. [ATLAS Collaboration] Search for dark photons in rare Z boson decays with the ATLAS detector. Phys. Rev. Lett. 2023, 131, 251801. [Google Scholar] [CrossRef]
- Jaegle, I. et al. [Belle Collboration] Search for the dark photon and the dark Higgs boson at Belle. Phys. Rev. Lett. 2015, 114, 211801. [Google Scholar] [CrossRef]
- The ATLAS Collaboration. Combination and summary of ATLAS dark matter searches interpreted in a 2HDM with a pseudo-scalar mediator using 139 fb−1 of = 13 TeV pp collision data. Sci. Bull. 2024; in press. [Google Scholar] [CrossRef]
- Aad, G. et al. [ATLAS Collaboration] Search for a new pseudoscalar decaying into a pair of muons in events with a top-quark pair at = 13 TeV with the ATLAS detector. Phys. Rev. D 2023, 108, 092007. [Google Scholar] [CrossRef]
- Akeroyd, A.G.; Moretti, S.; Yagyu, K.; Yildirim, E. Light charged Higgs boson scenario in 3-Higgs doublet models. Int. J. Mod. Phys. A 2017, 32, 1750145. [Google Scholar] [CrossRef]
- Akeroyd, A.G.; Moretti, S.; Song, M. Light charged Higgs boson with dominant decay to quarks and its search at the LHC and future colliders. Phys. Rev. D 2018, 98, 115024. [Google Scholar] [CrossRef]
- The ATLAS Collaboration. Search for a light charged Higgs boson in t→H±b decays, with H±→cb, in the lepton+jets final state in proton–proton collisions at = 13 TeV with the ATLAS detector. J. High Energy Phys. 2023, 2023, 4. [Google Scholar] [CrossRef]
- The CMS Collaboration. Search for a charged Higgs boson decaying into a heavy neutral Higgs boson and a W boson in proton–proton collisions at = 13 TeV. J. High Energy Phys. 2023, 2023, 32. [Google Scholar] [CrossRef]
- ATLAS Collaboration. Search for doubly charged Higgs boson production in multi-lepton final states using 139 fb−1 of proton–proton collisions at = 13 TeV with the ATLAS detector. Eur. Phys. J. C 2023, 83, 605. [Google Scholar] [CrossRef]
- CMS Collaboration. Summary of 2HDM+S searches at 13 TeV (Run 2). Available online: https://twiki.cern.ch/twiki/bin/view/CMSPublic/Summary2HDMSRun2 (accessed on 30 May 2024).
- The ATLAS Collaboration. Interpretation of Heavy Higgs Boson Searches in the ATLAS Experiment in the Georgi–Machacek model. Report ATL-PHYS-PUB-2022-008; CERN: Geneva, Switzerland, 2022; Available online: https://cds.cern.ch/record/2803996 (accessed on 30 May 2024).
- Georgi, H.; Machacek, M. Doubly charged Higgs bosons. Nucl. Phys. B 1985, 262, 463–477. [Google Scholar] [CrossRef]
- Chanowitz, M.S.; Golden, M. Higgs boson triplets with MW=MZcosθW. Phys. Lett. B 1985, 165, 105–108. [Google Scholar] [CrossRef]
- The ATLAS Collaboration. Summary Plots for Beyond Standard Model Higgs Boson Benchmarks for Direct and Indirect Searches. Report ATL-PHYS-PUB-2022-043; CERN: Geneva, Switzerland, 2022; Available online: https://cds.cern.ch/record/2827098 (accessed on 30 May 2024).
- CMS Collaboration. Higgs PAG Summary Plots. Summary of MSSM Higgs Boson Searches at 13 TeV (Run 2). Available online: https://twiki.cern.ch/twiki/bin/view/CMSPublic/SummaryResultsHIG (accessed on 30 May 2024).
- Longer Term LHC Schedule. Available online: https://lhc-commissioning.web.cern.ch/schedule/LHC-long-term.htm (accessed on 30 May 2024).
- Zerlauth, M.; Brüning, O. Status and prospects of the HL-LHC project. PoS 2024, 449, 615. [Google Scholar] [CrossRef]


| Mode | Events | Fraction |
|---|---|---|
| ×1000 | (%) | |
| ggH | 6900 | 88.19 |
| VBF | 520 | 6.65 |
| VH | 320 | 4.09 |
| ttH | 70 | 0.89 |
| tH | 10 | 0.13 |
| HH | 4 | 0.05 |
| sum | 7824 |
| Decay Channel | BR (%) |
|---|---|
| bb | |
| WW | |
| gg | |
| cc | |
| ZZ | |
| Z | |
| ss | |
| Parameter | 68% CL | 95% CL |
|---|---|---|
| (0.96, 1.16) | (0.86, 1.26) | |
| (−0.86, 0.85) | (−1.07, 1.07) |
| Process | Observed | Expected | Observed | |
|---|---|---|---|---|
| Higgs boson channel | Longitudinal | Longitudinal | Unpolarized | Transverse |
| Z boson channel | ||||
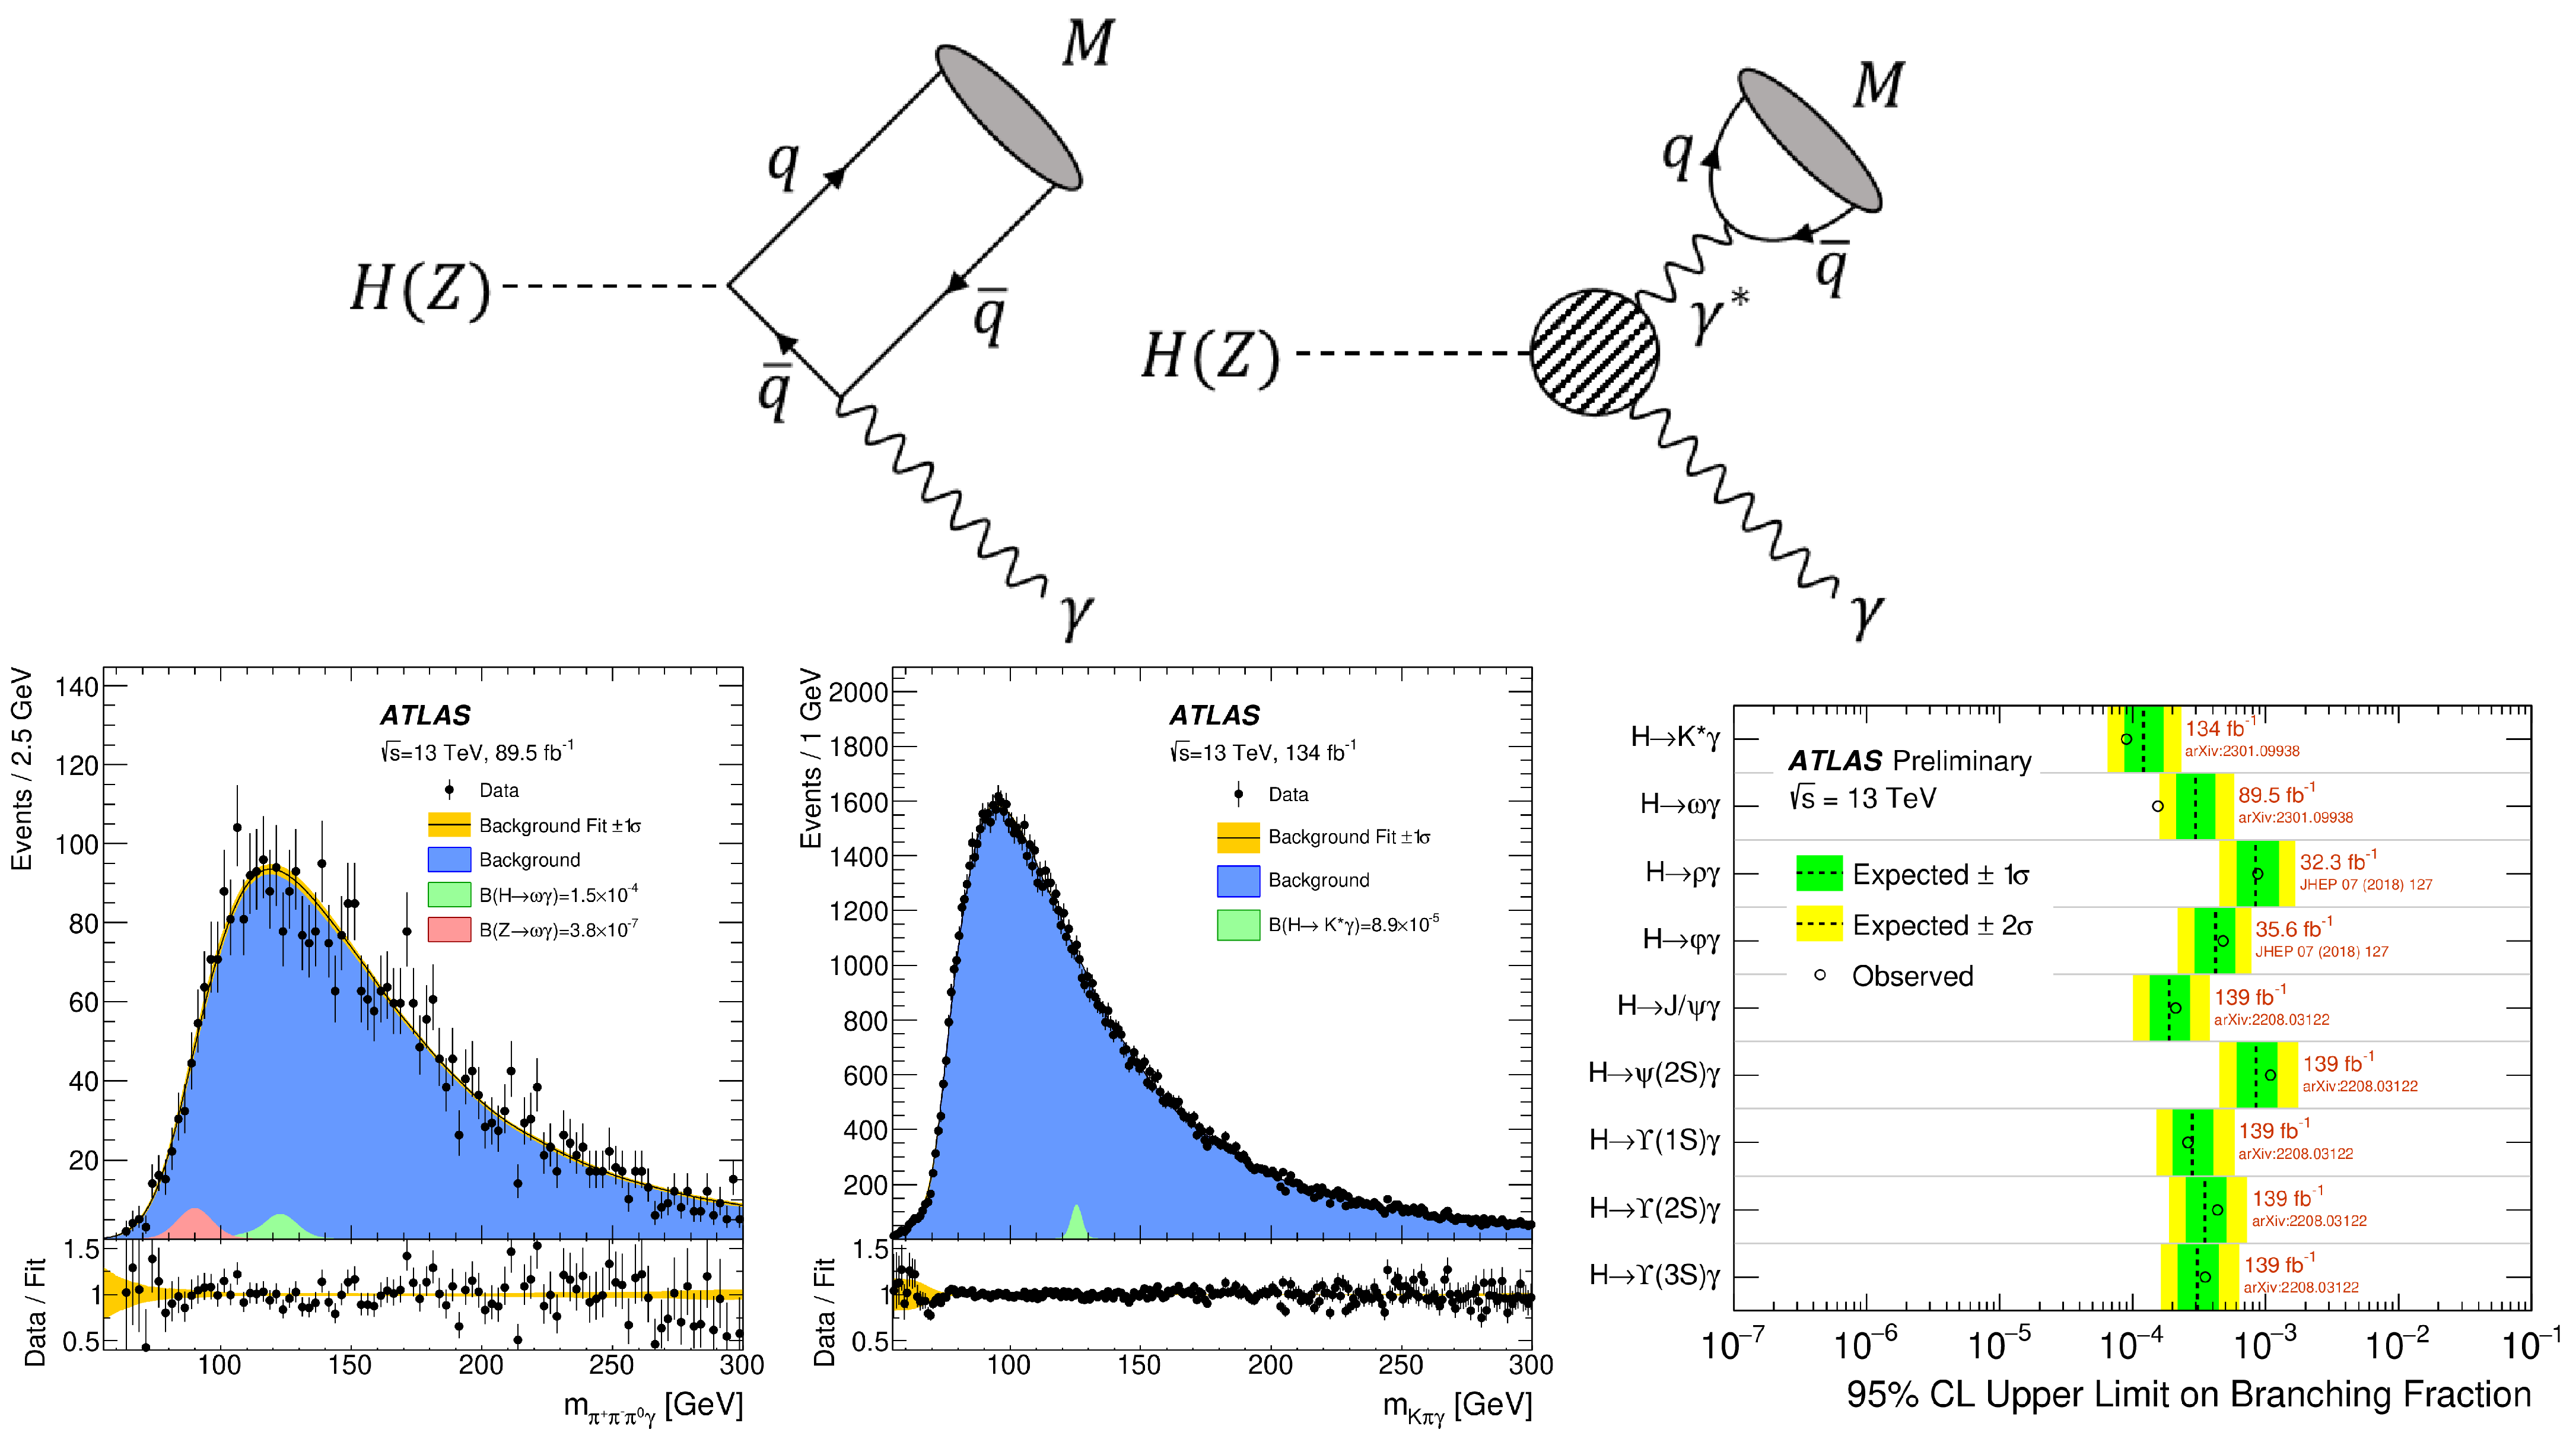
| Channel | 95% CL Upper Limit | |
|---|---|---|
| Expected | Observed | |
| 1.5 | ||
| 3.8 | ||
| 8.9 | ||
| + ≥ | ||||||
| + ≥ | ||||||
| + light | ||||||
| Other | ||||||
| Total | ||||||
| Data | 2696 | 1363 | 5837 | 3090 | 1470 | 699 |
Disclaimer/Publisher’s Note: The statements, opinions and data contained in all publications are solely those of the individual author(s) and contributor(s) and not of MDPI and/or the editor(s). MDPI and/or the editor(s) disclaim responsibility for any injury to people or property resulting from any ideas, methods, instructions or products referred to in the content. |
© 2024 by the author. Licensee MDPI, Basel, Switzerland. This article is an open access article distributed under the terms and conditions of the Creative Commons Attribution (CC BY) license (https://creativecommons.org/licenses/by/4.0/).
Share and Cite
Sopczak, A. Higgs Boson Searches at the LHC Beyond the Standard Model. Physics 2024, 6, 1132-1170. https://doi.org/10.3390/physics6030071
Sopczak A. Higgs Boson Searches at the LHC Beyond the Standard Model. Physics. 2024; 6(3):1132-1170. https://doi.org/10.3390/physics6030071
Chicago/Turabian StyleSopczak, André. 2024. "Higgs Boson Searches at the LHC Beyond the Standard Model" Physics 6, no. 3: 1132-1170. https://doi.org/10.3390/physics6030071
APA StyleSopczak, A. (2024). Higgs Boson Searches at the LHC Beyond the Standard Model. Physics, 6(3), 1132-1170. https://doi.org/10.3390/physics6030071