Abstract
This article shows the possibilities of using passive air conditioning methods in real conditions during the fattening of chickens in the summer with high outdoor temperatures. On a farm in three halls with the same interior equipment, the effect of different constructions of walls and roofs of buildings on the internal thermal and humidity microclimate was investigated. Microclimatic conditions and chickens’ performance were compared in two identical lightweight panel halls (49,000 chickens each) with light aluminum roof sheets (L* = 81.4 ± 0.4), and against conditions and results in a massive brick house (31,200 chickens) with a dark eternit roof (L* = 35.7 ± 3.5). The dark color of the roof surfaces and parts of the walls of the brick house accelerated the increase in air temperature in the house. The air temperature was 0.7 to 2 K higher in the house with darker surfaces, which was also reflected in a higher THI. The duration of chickens’ stay in conditions of higher heat stress (THI above 28.3) was 1.84 times longer in this house than in houses with light surfaces, which had the effect of increasing water consumption by 30%. The effect of heat accumulation of the brick structure on the attenuation of high temperature was not significant.
1. Introduction
Poultry fattening is an important part of agriculture and a supplier to the food industry [1,2,3]. The current and expected development of demand for poultry meat shows an increasing trend [4,5]. Along with this, monitoring the state of the microclimate and understanding its influence on poultry is becoming more important [1,3,6,7,8,9,10,11,12,13,14,15]. In particular, the thermal comfort of poultry and its influence on performance is at the forefront of interest [1,9,13,14,16,17,18,19,20,21,22,23,24,25]. Due to climate change, heat stress can be more common due to increasing air temperatures even outside warm regions [26]. The performance of chickens is most influenced by air temperature, ventilation and genetic predispositions [13]. Summary indicators such as the temperature humidity index (THI) or the temperature humidity velocity index (THVI) are often used to evaluate it [7,14,20,27,28,29,30,31,32]. Stress can be caused in chickens under certain conditions, in addition to microclimates, by stocking density, lighting, nutrition, health status, handling and transport of fattened birds to slaughter. Relevant to the topic is the “Better Chicken Commitment” to adhere to defined standards in the field of animal welfare, sustainability and food quality from 2026, to which leading food companies from across Europe have signed up [33].
Fattening is carried out mainly in halls with a controlled environment [7,8,13,15,27,34,35]. In the Czech Republic, the standard maximum biological load on the floor area of chickens is 33 kg∙m−2. Under above-standard breeding conditions, the stocking density can be increased to 39 to 42 kg∙m−2. However, animal rights activists are calling for a reduction in stocking density to 30 kg∙m−2 due to the risk of heat stress, and stricter welfare requirements are also being demanded by the European Food Safety Authority (EFSA) [33]. The design of buildings, including the spatial, structural and material properties of the halls, directly affects the indoor environment of the halls. Its quality is ensured by the cooperation of heating, ventilation and cooling systems [8,13,36,37,38]. The performance of these systems changes during fattening. The formation of the indoor environment and activity is influenced by the outdoor environment (season and weather). The indoor environment is also influenced by the effects of gaseous pollutants such as CO2, NH3, CH4 and dust particles contained in the air or the influence of heat gains and losses [24,39,40,41].
High air temperatures can contribute to respiratory tract damage, making chickens more susceptible to respiratory diseases [42]. High air temperatures also affect the quality of poultry meat, which is also influenced by genotype and housing system [43,44]. In order to avoid heat stress, it is appropriate to maintain air temperatures in the range of 22–30 °C [44]. Wet litter causes footpad dermatitis and systemic infections like coccidiosis [42]. The quality of litter has a direct impact on dustiness, humidity and ammonia concentration and is related to the condition of the skin and respiratory system of chickens [33]. For the above reasons, it is important to ensure suitable microclimate conditions for the health and prosperity of poultry [42]. Relative humidity in the range of 50–70% contributes to increasing well-being and reducing the risk of respiratory diseases [44].
Chickens cool themselves primarily by breathing, as they do not have sweat glands, and temperature and relative humidity have a significant influence on this ability. In hot conditions, panting occurs associated with heat-calls. Vocal panting brings a thermoregulatory benefit to the emitter [45,46].
The most critical times for each fattening cycle are the beginning and the end of fattening. The beginning is critical for the chickens to adapt to the new environment and the end is critical for the air temperature due to the increasing heat production together with the live weight of the chickens [2]. The beginning and end of fattening are usually also critical in terms of mortality [47]. As the body temperature of the chickens increases, the risk of heat stress increases. The normal body temperature of the chickens is around 41 °C and the respiratory rate is 60–70 breaths per minute. Significant signs of heat stress are when the body temperature of the chickens increases by 1 K [48]. This is accompanied by an increase in the respiratory rate (over 150 breaths per minute), changes in feed and water consumption, reduced growth, increased mortality and reduced physical activity [12,20,23,24,48,49]. Immunohomeostasis, hormonal equilibrium, and inflammatory and oxidative status are also negatively affected by heat stress [26]. In poultry, heat stress is associated with increased cholesterol and gamma-glutamyltransferase levels and decreased globulins, glucose, and protein levels [50]. Feed conversion ratio and growth rates are directly affected by daily temperature stratification [44].
Some negative effects can be mitigated by suitable hall surroundings, which may include passive cooling elements [36,38,51,52]. It is particularly recommended to use thick walls, insulation, paint and suitably selected external surfaces of the building [52]. Materials with high albedo and emissivity reduce the heat gain of the objects on which they are used [53]. The brightness or reflectivity of the surface (parameter Y), directly linked to the L* value, is strongly correlated with the SRI (solar reflectance index), which expresses the ability of the surface to reflect solar radiation depending on the relationship of its surface temperature to the reference surface temperature of a black and white surface [54]. The L* value also strongly correlates with albedo values [55]. Gloss has a negative correlation in relation to the specular roughness of surfaces [56].
The preferred ventilation system is forced negative pressure ventilation, which allows better control of the most commonly used cooling systems (evaporative cooling with nozzles or mats). Individual systems differ in the achieved air flow speed and its distribution [11,13,16,27,57,58]. Longitudinal air flow in the house allows for an increase in air flow speed and ventilation intensity in the summer [57]. This can ensure a more uniform air temperature, CO2 concentration and more effective cooling of poultry by convection in the summer [59]. Air flow speed affects the removal of sensible heat by convection, reduces heat stress, and affects the behavior and performance of chickens [60,61,62,63,64].
According to [65], ventilation during the summer period should allow an air exchange of 5.3 m3∙h−1∙kg−1 for medium-heavy masonry buildings and 5.9 m3∙h−1∙kg−1 for light buildings. Reference [66] recommends an air exchange of up to 7.5 m3∙h−1∙kg−1 at the end of the fattening period. Insufficient ventilation and low air flow rates can result in a deterioration of the litter and higher NH3 production [60,61,62,67]. The CO2 concentration should not exceed 2500 ppm [65]. In the Czech Republic, the limit is set by decree at 3000 ppm [68].
The article aims to determine the influence of various technical solutions of fattening houses on the quality of the indoor environment and the performance of fattening poultry in the summer period, when chickens are at risk of heat stress. In the search for possibilities of using passive air conditioning methods to protect animals in buildings from heat stress, we wanted to verify the possibilities of reducing the internal temperature in the halls by accumulating heat in the walls and reducing the heat load with suitable reflective paints on the wall and roof surfaces. In the article, we tried to show the real situation on a large-scale farm with three chicken fattening houses on one farm in the summer.
In summary, the aim of this study was to evaluate how the technical design of broiler fattening halls influences indoor microclimate and productive performance and to discuss the implications for thermal comfort and welfare of broilers.
2. Materials and Methods
2.1. Description of the Halls
The research was carried out on a farm in the southern part of the Czech Republic at an altitude of 520 m above sea level. The area is located in a Central European climate with a characteristic alternation of four seasons. Three fattening halls (H1, H2 and H3) were selected for this research. A total of 129,200 Ross 308 hybrid broilers were monitored. The measurement was carried out during a common commercial production with chickens of the same age in all houses in the same period for 5 weeks. The basic characteristics of the buildings are given in Table 1. External and internal views of the investigated halls, together with an indication of the direction of air supply and exhaust and cardinal points, are shown in Figure 1 and Figure 2.

Table 1.
Main characteristics of the investigated halls.
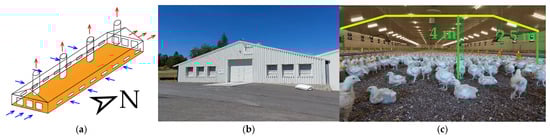
Figure 1.
Halls H1 and H2: (a) air supply and exhaust; (b) external view; (c) internal view.
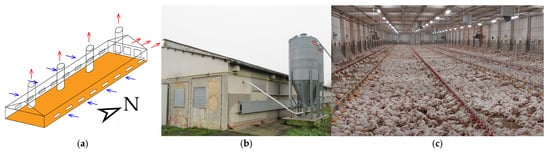
Figure 2.
Hall H3: (a) air supply and exhaust; (b) external view; (c) internal view.
Ventilation in the halls is regulated to the optimal microclimate values corresponding to the fattening day. A special SKOV DOL 539 computer (dol-sensors A/S, Aarhus, Denmark) for ventilation control automatically adjusts the performance of ventilation airflow rate based on temperature, relative humidity and CO2 concentration measurements.
2.2. Data Acquisition and Processing
The research was carried out in the summer. During the entire fattening period (5 weeks), long-term measurements were carried out with a recording interval of 15 min. Air temperature, relative humidity and CO2 concentration in the air were monitored. Measurements in the halls were 0.35 m above the litter in a representative location in the middle of the halls. The outdoor sensor (DOL 114–dol-sensors A/S, Aarhus, Denmark) was placed in an outdoor meteorological station near the farm halls. The article presents results only from weeks 3 to 5. Selection of data was made, because in the first 2 weeks of fattening, chickens require a higher ambient temperature and usually the temperature is increased by heating. The biological heat production of chickens increases relatively quickly with the increasing weight of the chickens, but the optimal temperature for chickens is gradually lower, which is why heat stress can occur. Another reason for not including the first 2 weeks of fattening in the article is the scope of the article.
Data about chickens’ performance were collected according to standard farm methodology. Daily mortality and water consumption were recorded every day at 7 am. The live weight was the performance data, which were measured weekly by weighing small groups of chickens placed into measuring boxes using a hand digital scale in each hall. The measured number of chickens was 50 pcs in total in each week and hall. Water consumption was measured by a standard farm water meter in each hall, placed on water supply lines. Feed conversion ratio was achieved after the fattening period. Other more detailed behavioral or physiological indicators were not recorded due to the overall focus of this research.
The color of the wall and roof surfaces was measured using a Konica Minolta Spectrophotometer CM-600d (Konica Minolta Inc., Tokyo, Japan). The color was evaluated according to the CIELAB system, where the color properties lightness (L*), redness (a*), yellowness (b*) and gloss (8° Gloss) were measured five times on each surface. The instrument was calibrated before the measurement to a black (L* = 0) and white (L* = 100) standard. A summary of the measuring devices and sensors used in this research is in Table 2.
Table 2.
Summary of the measuring devices and sensors used in this research.
For the temperature humidity index (THI), Equation (1) was used to evaluate the thermal comfort and condition of the chickens. Equation (1) was selected from many other THI calculation methodologies because it was developed according to [31], on Ross x Ross breed chickens:
where THI—temperature humidity index; tdb—dry bulb temperature, °C; and twb—wet bulb temperature [69], °C.
THI = 0.85tdb + 0.15twb
Wet bulb temperature was calculated according to Equation (2) [69]:
where twb—wet bulb temperature, °C; t—air temperature, °C; and RH—air relative humidity, %.
twb = t atan [0.151977 (RH + 8.313659)0.5] + atan (t + RH) – atan (RH − 1.676331) + 0.00391838 (RH)1.5 atan (0.023 101 RH) − 4.686035
The calculation of the required air flow rates according to [65] was according to Equation (3):
where Mvmax—total fresh air flow rate for heat removal in summer, kg∙s−1; y—factor dependent on the weight of the structure; Z—average number of animals, pcs; and mvmax—recommended air flow rate per animal, kg·s−1·pcs−1.
Production efficiency factor (PEF) [70] was calculated according to Equation (4):
where PEF—production efficiency factor; RM—relative mortality, %; mb—average live weight, kg; d—age, day; and FCR—feed conversion ratio, kg∙kg−1.
The calculation of relative (RM) was according to Equation (5):
where RM—relative mortality, %; M—mortality, pcs; and NoCH—number of chickens, pcs.
The acquired datasets were processed using MS Excel, and some of the results (assessing whether differences between evaluated datasets are significant or not) were verified by statistical software TIBCO SW Data Science Workbench Statistica Version 6 (ANOVA and Tukey’s HSD (Honestly Significant Difference) test; p ≤ 0.05). The results presented in the form of charts and graphs were processed in MS Excel.
2.3. Criteria for Assessing the Thermal State of the Environment
The optimal values for the thermal state of the internal environment are given in Table 3. The values are based on the technological requirements of the Ross 308 broiler producer [70]. Thermal status assessed by body temperature rise (∆tb) and the corresponding THI values according to [31] are given in Table 4.
Table 3.
Optimal thermal state inside halls [70].
Table 4.
Evaluation of broiler’s thermal state via body temperature rise ∆tb and THI values [31].
3. Results
3.1. Long-Term Registration Measurement of the Indoor Environment
The average values of air temperatures, relative air humidity and CO2 concentrations from the third week of fattening are shown in Table 5. There is a significant difference between the outdoor and indoor air temperatures and THI. The highest air temperatures and THI were in hall H3. Hall H3 had the significantly lowest relative air humidity. Hall H2 had a lower CO2 concentration compared to halls H1 and H3.
Table 5.
Average values of indoor and outdoor environment parameters in the 3rd week. t—air temperature; RH—air relative humidity; THI—temperature humidity index.
The average values of the environmental state from the fourth week are shown in Table 6. Outdoor air temperatures and THI were significantly lower than inside the halls. In the halls, the values of temperatures and THI were without a significant difference. Relative air humidity was significantly lower in hall H3 compared to other measurement locations, where the values were without a significant difference. Significantly higher CO2 concentrations were measured in hall H1.
Table 6.
Average values of indoor and outdoor environment parameters in the 4th week. t—air temperature; RH—air relative humidity; THI—temperature humidity index.
In the fifth week of measuring the outdoor and indoor environmental conditions (Table 7), the outdoor air temperature and THI values were significantly lower than in the halls. In comparison, hall H1 had significantly lower air temperature and THI values than the rest of the halls. The relative humidity differed significantly from the outdoor air only in hall H2. The lowest CO2 concentration was measured in hall H2.
Table 7.
Average values of indoor and outdoor environment parameters in the 5th week. t—air temperature; RH—air relative humidity; THI—temperature humidity index.
Table 8 shows the minimum and maximum values of the indoor and outdoor environments in weeks 3 to 5. The highest air temperatures and THI were reached in hall H3. Air temperatures in weeks 3 and 5 exceeded 30 °C. THI values in all halls exceeded the optimal values shown in Table 3. The chickens in the houses were exposed to a thermal state above THI = 28.3 in H1 = 25 h, in H2 = 39.75 h and in H3 = 73.5 h (1.84 times longer than in houses H1 and H2). In none of the houses was the limit of 33.14 exceeded according to Table 4 [31]. The RH was in hall H2 and then H3. Minimum RH values were lower than 50% and in week 3 they dropped to 30%. RH exceeded the 70% limit in the halls in week 5. The highest CO2 value was measured in hall H1 (2818 ppm).
Table 8.
Minimum and maximum values of the indoor and outdoor environments in weeks 3 to 5. t—air temperature; RH—air relative humidity; THI—temperature humidity index.
3.2. Air Temperatures During Hot Summer Days
Table 9 and Table 10 show the values of the average maximum and average daily temperatures of warm days in the third week and fifth week, together with the average daily times of their achievement. Only the average daily air temperatures were different between the more massive brick hall H3 (30.5 ± 0.1 °C) and the halls with sandwich panels H1 and H2 (28.7–29.1 °C) (third week). The latest maximum and average daily air temperature values were achieved in hall H3, but the difference with halls H1 and H2 was not significant. The exception was the faster achievement of average daily air temperatures in the fifth week, when H3 was statistically similar to the outdoor environment.
Table 9.
Average selected statistical air temperature values and their daytime in week 3. tmax—maximum daily air temperature; τtmax—time of reaching tmax; tavg—average daily air temperature; mτavg—time of reaching tavg during morning; eτavg—time of reaching tavg during evening.
Table 10.
Average chosen air temperature values and their daytime in week 5. tmax—maximum daily air temperature; τtmax—time of reaching tmax; tavg—average daily air temperature; mτavg—time of reaching tavg during morning; eτavg—time of reaching tavg during evening.
On a selected hot day (29th day of fattening), a strong exponential dependence of the increase in internal air temperatures on the increase in external air temperature was found (Figure 3). The highest increase in values was observed in hall H3.
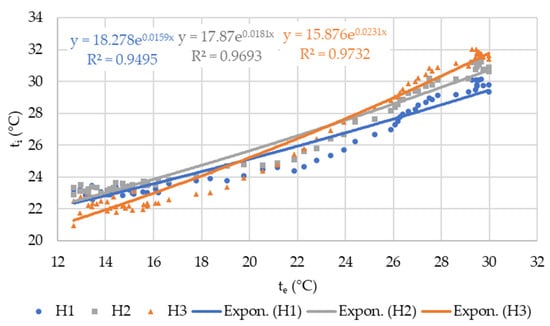
Figure 3.
Relationship between indoor and outdoor air temperature on 29th day (from 0 a.m. to 5. p.m.).
During the morning hours of the 29th day, the increase in indoor air temperatures followed an exponential curve. Outdoor temperatures increased in a linear trend. Trend lines are descriptive only. A more intense increase in temperatures was observed in hall H3 (Figure 4).
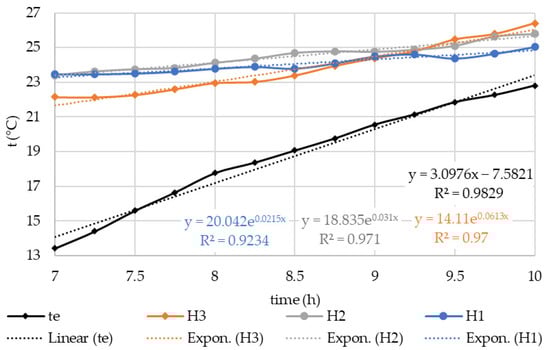
Figure 4.
Air temperature rise during the 29th day (from 7 a.m. to 10 a.m.).
A strong logarithmic dependence with R2 > 0.96 was found for the decrease in the intensity of growth of indoor temperatures on outdoor temperatures (Figure 5).
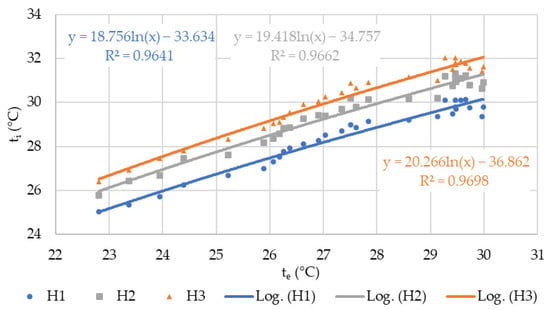
Figure 5.
Relationship between indoor and outdoor air temperature on the 29th day (from 10 a.m. to 5. p.m.).
As air temperatures decreased, the values in the halls followed a negative exponential trend (trend lines are descriptive only). The air temperatures in hall H3 decreased with the least intensity (Figure 6).
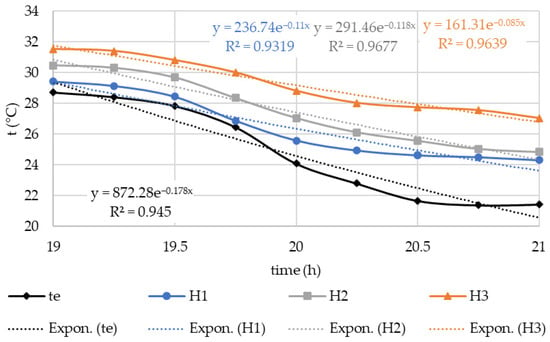
Figure 6.
Air temperature decline during 29th day (from 7 p.m. to 9 p.m.).
3.3. Results of Measuring the Color of the Roofs and Walls of the Investigated Halls
The significantly darkest roof surface was measured in hall H3 with a gray eternit roof covering from the 1980s (L* = 35.7 ± 3.5). On the other hand, halls H1 and H2 have significantly lighter surfaces and also show significantly higher 8° gloss values (Table 11).
Table 11.
Evaluation of roof color by the system CIELAB. L*—lightness; a*—redness; b*—yellowness.
Halls H1 and H2 have similar very light surfaces around the entire perimeter with 8° gloss from 14.1 to 54.5 in a slightly green and blue color combination. The highest gloss is provided by the sheet metal cover for the air inlets H3. Hall H3 has the darkest wall surface (Table 12). The difference in the lightness and gloss of the house surfaces with was on average L* = 36.8 and 8° gloss = 17.15 between the surfaces of H3 and similar halls H1 and H2.
Table 12.
Evaluation of wall color by system CIELAB. L*—lightness; a*—redness; b*—yellowness.
In Table 11 and Table 12, the values (a*) and (b*) indicate the saturation of the color hue. Positive values (a*) indicate the redness of the measured color, while negative values (−a*) indicate the greenness of the surface. Positive values (b*) indicate the yellowness and negative values (−b*) indicate the blueness of the surface color.
3.4. Ventilation Capacities
The ventilation air flow of the installed fans in the halls meets the requirements for the summer period according to the ČSN 73 0543-2 standard [65], but they do not reach the recommended capacity according to [66] (Figure 7).
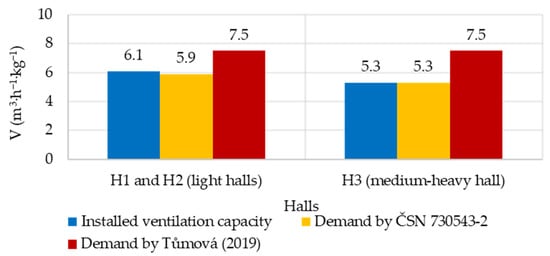
Figure 7.
Required and installed ventilation capacities [65,66].
3.5. Productivity of Ross 308 Broilers
Relative mortality and water consumption in selected periods of 3–5 weeks are shown in Figure 8 and Figure 9 and in Table 13 and Table 14. In the third week of fattening, the relative mortality was the same in all houses. In the fourth week of fattening, a significantly lower relative mortality was recorded in house H3 and, conversely, a significantly higher water consumption compared to houses H1 and H2. In the fifth week of fattening, the same relative mortality was found in all houses. Water consumption was significantly different between houses H2 (the lowest consumption) and H3 (the highest consumption).
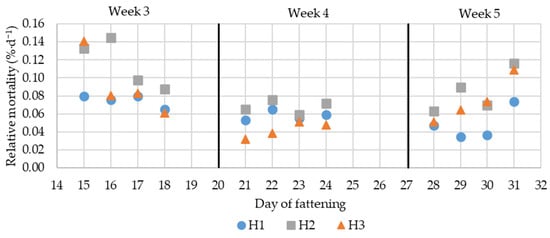
Figure 8.
Daily values of chicken’s relative mortality.
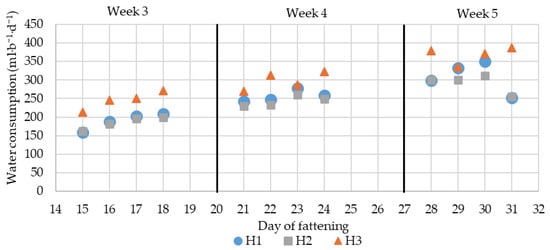
Figure 9.
Daily values of chicken’s water consumption.
Table 13.
Average daily values of chicken’s relative mortality in the 3rd, 4th and 5th week. RM—relative mortality.
Table 14.
Average daily values of chicken’s water consumption in 3rd, 4th and 5th week. W—water consumption.
Average live weight gains of chickens are shown in Figure 10. The live weight of chickens was measured in small groups of chickens (50 chickens in total in each hall); therefore, the results are mainly illustrative, with imprecise determination of data variability. In the warm summer weeks, chickens in house H3 had the lowest weight gains compared to the other houses. Conversely, in the 4th, colder week, chickens had the highest gains. The opposite trend was observed in house H1 compared to the other houses.
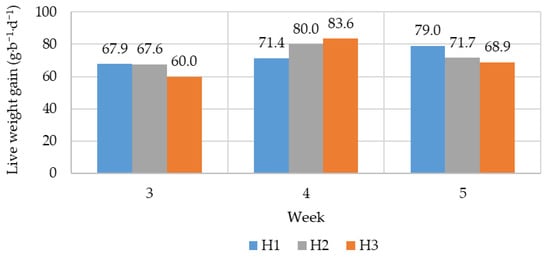
Figure 10.
Average values of chicken’s live weight gain.
Table 15 shows the final performance values of the investigated fattening. Hall H3 had worse results compared to halls H1 and H2 only in water consumption and production efficiency factor (PEF).
Table 15.
Summary of final production performance parameters of the fattening period.
4. Discussion
The aim of the research was to evaluate how the technical design of broiler fattening halls and possibilities of using passive air conditioning methods influence indoor microclimate and productive performance, and to discuss the implications for thermal comfort and welfare of broilers during real operation conditions in the summer period. Ensuring animal welfare is important in terms of the requirements for compliance with prescribed animal welfare parameters and is also important for effective fattening results. Modern measurement and evaluation technology allows for a detailed analysis of microclimatic conditions and provides prerequisites for finding options for improving the current situation.
The main subject of this article is a comparison of microclimatic conditions and performance results in three houses with the same interior equipment but different building construction on one farm during the same period in summer. The conditions and performance in two identical lightweight panel houses with light aluminum roof sheets were compared with the conditions and results in a massive brick house with a dark eternit roof.
The average and minimum air temperatures and heat index (THI) (Table 5, Table 6, Table 7 and Table 8) in the houses in weeks 3 to 5 exceeded the optimal values according to [70] (Table 3). In the warm weeks 3 and 5, the temperature in all houses exceeded 30 °C.
Signs of heat stress (increased body temperature, increased respiratory rate and reduced performance) were observed in a study [48] in 17–31 day old Ross 308 chickens already in environmental conditions of t = 29 °C and RH = 66% (THI = 28.3). A significant decrease in performance and heat stress was observed in an environment with a temperature of t = 33 °C and relative humidity = 60% (THI = 32.1).
The THI value of 28.3 was exceeded in all houses in weeks 3 and 5, when the maximum outdoor air temperatures reached 32 and 30.1 °C. The maximum THI values in week 3 were THI = 30.6 in house H1, THI = 31.7 in house H2 and THI = 32.4 in house H3. In week 5, the maximum value in house H1 was THI = 28.7 in house H2, THI = 30 in house H3 and THI = 30.8 in house H3. The time when the THI = 28.3 was exceeded in house H1 lasted 25 h, in house H2 39.75 h and in house H3 73.50 h. In addition, in house H3, the chickens were kept for 3.25 h in conditions of THI = 32.1–32.4 (day 17; week 3).
According to [13], heat stress in chickens is monitored on average at an air temperature of 32.5 °C. The air temperature exceeded the stated value on the 17th day of fattening in hall H2 for 4.75 h and in hall H3 for 6.75 h. Hall H3 reached significantly higher temperatures and THI values in week 3, i.e., the warmest week, compared to halls H1 and H2. In week 5, it differed significantly only from hall H1.
The higher temperature and THI values were influenced by the properties of the materials and surfaces of the roofs and external walls. The light panel halls H1 and H2 with light aluminum roof sheets had higher reflectivity (L* = 81.4 ± 0.4) and gloss (8° gloss = 23.4 ± 2.2) compared to the roof of the massive brick hall with a dark eternit roof (L* = 35.7 ± 3.5; 8° gloss = 2.7 ± 4.0). The same trend was observed also for external walls. The dark color of the roof surfaces and parts of the walls of the brick hall accelerated the increase in the air temperature in the hall (Figure 3 and Figure 4). The air temperature was 0.7 to 2 K higher in the hall with darker surfaces, which was also reflected in the higher THI (Table 8).
The color of the roof, or rather its ability to reflect solar energy, can affect the surface temperature of the roof by 8 °C [71]. This can have a significant effect on the increase in air temperature inside. Up to 60% of heat gains pass through the ceiling [49]. A positive effect was observed with appropriate thermal insulation of the roof [49,72]. Houses with good roof insulation achieved higher weight gains, higher feed intake, lower feed conversion and lower mortality compared to houses without thermal insulation [72].
The lowest average RH values of 48.6–55.3% were also observed in hall H3. In weeks 3 and 4, H3 differed significantly from the average values of halls H1 and H2, which did not differ significantly from the outdoor environment. Low values below 50% RH are unfavorable and can cause drying of the litter associated with increased dustiness and related problems [42].
The highest average values of RH were found in hall H2 (53.8–59.2%). A significant difference in the average RH in hall H2 from the outdoor environment was recorded only in week 5.
On the contrary, high RH values above 70% cause wet litter associated with increased NH3 concentration, which can cause respiratory damage to the chickens [42,73]. Poor litter conditions negatively affect the health of chicks’ feet [60]. As RH increases, the cooling capacity of chickens through respiration also decreases [49]. RH higher than 70% was measured in all halls in week 5 and in hall H2 also in week 4. The maximum RH value was in hall H1 = 76.8%, in hall H2 = 79.8% and in hall H3 = 72.5%.
Despite significant differences in average air temperatures in the houses in the warm third and fifth weeks of fattening, a significant difference in relative mortality was observed only in the cold fourth week. House H3 had significantly lower mortality in week 4 than houses H1 and H2. The effect of increasing air temperatures on increased mortality between 20 and 35 °C was not observed in chickens aged 21–49 in a study [74]. There was a significant difference in RH values between house H3 and houses H1 and H2 during the given period and CO2 concentration reached higher levels also in houses H1 and H2 than in house H3. In colder week 4, CO2 concentration exceeded the limit of 2500 ppm set by [65] in house H1 (2818 ppm), but the limit (3000 ppm) set by [68] was not exceeded. In the house H1, CO2 concentration differed significantly from the other houses. With the exception of week 4, house H2 had the lowest average CO2 concentration values in comparison to other halls.
In the H3 house, significantly higher water consumption was observed compared to the H1 and H2 houses. Only in the fifth week was the water consumption in the house H3 comparable to the consumption in house H1. The high air temperatures in the third and fifth weeks also influenced the live weight gain values of the chickens. During this period, the gains in the H3 house were the lowest compared to the H1 and H2 houses. On the contrary, in the colder fourth week, the highest gain was achieved in the H3 house.
When the air temperature increases above 20 °C, by each degree the feed intake decreases by 1.5% while maintaining constant water consumption. Water consumption increases only when the air temperature increases above 30 °C, and together with the reduced feed consumption leads to diarrhea [49]. The decrease in feed consumption and the increase in water consumption associated with the increase in air temperature is confirmed by [74].
The results presented in Table 9 and Table 10 and Figure 3, Figure 4 and Figure 5 show a slight but statistically insignificant effect of a more massive brick structure on the delay of increases and decreases in air temperatures in the house caused by heat accumulation in the structure. There is also a more intense increase in air temperatures due to solar radiation caused by significantly darker and less shiny surfaces of the roof and external structures. Day 29 was chosen as a representative warm day, as one of the warmest days of fattening in the last phase of fattening, which is critical in terms of air temperatures and also due to increased heat production from the chickens [2].
Air exchange in hall H3, thanks to the installed ventilation capacity, is possible up to 58.8 h−1, and in halls H1 and H2 even 64.2 h−1. Such high ventilation intensities cause significant heat gains through ventilation during the summer period. The influence is supported by the strong exponential dependence of internal air temperatures on external air temperatures (Figure 3) and the intensive growth of air temperature values in the morning hours (Figure 4). Ventilation capacities are comparable in both types of halls with respect to the types of buildings and meet the requirements of the ČSN 730543-2 standard [65] (Figure 7). However, in none of the halls is the ventilation capable of achieving the air flow rate of 7.5 m3∙h−1∙kg−1 recommended by reference [66].
The increase in temperature values in the houses was also affected by the orientation of the poultry houses to the cardinal points. The current NW-SE orientation (the same for all houses) is not recommended throughout the literature. The east–west orientation of the house axis parallel to the longer side walls has the lowest solar radiation exposure [49,51]. Furthermore, due to the all-day exposure of the side walls to sunlight, a 30% rotation of the longitudinal axis relative to the north–south orientation of the house (southwest-northeast) is recommended for this variant [51].
The results of the research show that the use of shiny and light materials for the roof and perimeter structures of chicken fattening houses reduces the thermal load of the building in the summer, which is reflected in the reduction in the risk of heat stress. In practical terms, this is reflected in the improvement of production parameters and the reduction in water consumption.
A significant positive effect of the massiveness of the structure has not been confirmed, but in further research, it would be appropriate to verify other variants of the materials used.
Future research should focus on heat accumulation due to the massiveness of the building, given the expected changes in legislative regulations for poultry fattening, when the maximum permitted number of chickens per m2 will be reduced. Reducing the biological load will allow air flow to be reduced, which will make the effect of heat accumulation in massive brick buildings more pronounced.
In addition, we recommend focusing on the effect of RH on litter quality, NH3 production and dustiness in relation to chicken performance. We also recommend verification of the assessment of thermal status using the THI summary indices and determination of a suitable methodology for assessing thermal status in chickens up to 35 days of age. Furthermore, we recommend determining the degree of influence of high air exchange intensity in houses on heat gains and investigating possible methods of reducing the influence of the outdoor environment on the thermal status in houses.
5. Conclusions
This study analyzed the effect of various technical solutions for broiler houses on the quality of the indoor environment and performance of the chickens, with the aim of identifying the possibilities of reducing the heat stress of the chickens by passive air conditioning methods. The effect of the massiveness of the structure on the attenuation of air temperature and the effect of surface materials and their color on the reflectivity of solar radiation in these buildings were verified. During the third to fifth week of broiler fattening period (Ross 308 hybrid broilers), microclimatic conditions and performance results were analyzed in three houses with the same indoor equipment but different building construction on one farm in the same period in summer, when outdoor temperatures reached up to 32 °C.
The results of temperature, relative humidity and CO2 concentration measurements were measured and registered over a long period of time throughout the fattening period at 15 min intervals. This article summarizes the results of datasets from the most demanding period of the last 3 weeks, when there is a risk of heat stress for chickens in the summer. The conditions and performance in two identical light fattening houses (49,000 chickens each) with light aluminum roof sheets (L* = 81.4 ± 0.4) were compared with the conditions and results in a massive brick fattening house (31,200 chickens) with a dark eternit roof (L* = 35.7 ± 3.5). The dark color of the roof surfaces and parts of the walls of the brick house accelerated the increase in air temperature in the house. The air temperature was 0.7 to 2 K higher in the house with darker surfaces, which was also reflected in a higher THI. THI values in all halls exceeded the recommended optimal THI values and the threshold at which heat stress occurs, THI = 28.3.
Chickens were exposed to a thermal state above the value at which heat stress (reduced performance, higher water consumption, malaise) is manifested in panel houses with light roof sheets for 25 and 40 h and in a brick house with a dark roof for 73.5 h, which is 1.84 times longer than in light houses. Higher temperatures and THI values resulted in smaller gains and an increase in water consumption by 30%. The effect of heat accumulation of the brick structure on the attenuation of high temperature was not significant.
Author Contributions
Conceptualization, P.K. and P.S.; methodology, P.K. and P.S.; software, P.K. and P.S.; validation, P.K. and P.S.; formal analysis, P.K. and P.S.; investigation, P.K. and P.S.; resources, P.K. and P.S.; data curation, P.K. and P.S.; writing—original draft preparation, P.K. and P.S.; writing—review and editing, P.K. and P.S.; visualization, P.K. and P.S.; supervision, P.K. and P.S.; project administration, P.K. and P.S.; funding acquisition, P.K. and P.S. All authors have read and agreed to the published version of the manuscript.
Funding
This research was funded by the Internal Grant Agency of the Faculty of Engineering, Czech University of Life Sciences Prague (2024:31170/1312/3106 and 2025:31170/1312/3103).
Institutional Review Board Statement
Not applicable.
Informed Consent Statement
Not applicable.
Data Availability Statement
The company that owns the farm gave consent for the raw data to be used by the researcher only; however, any queries involving the processing of these data can be directed to the corresponding author.
Acknowledgments
The authors would like to thank the farm staff for their helpfulness in taking all the measurements.
Conflicts of Interest
The authors declare no conflicts of interest. The funders had no role in the design of the study; in the collection, analyses, or interpretation of data; in the writing of the manuscript; or in the decision to publish the results.
Abbreviations
The following abbreviations are used in this manuscript:
| ANOVA | Analysis of Variance |
| EFSA | European Food Safety Authority |
| FCR | Feed Conversion Ratio |
| HSD | Honestly Significant Difference |
| LED | Light-Emitting Diode |
| NW | Northwest |
| PEF | Production Efficiency Factor |
| RH | Relative Humidity |
| RM | Relative Mortality |
| SD | Standard Deviation |
| M | Mortality |
| NoCH | Number of Chickens |
| SE | South East |
| SRI | Solar Reflectance Index |
| THI | Temperature Humidity Index |
| THVI | Temperature Humidity Velocity Index |
| W | Water Consumption |
References
- Vieira, F.M.C.; Portugal, M.A.G.; de Borba, L.P.; Angrecka, S.; Herbut, P.; Jongbo, A.O.; De-Sousa, K.T.; Deniz, M. Poultry preslaughter operations in hot environments: The present knowledge and the next steps forward. Animals 2024, 14, 2865. [Google Scholar] [CrossRef]
- Franco, E.; de Alencar Nääs, I. Development of a performance model for classifying broiler farms. J. Indones. Trop. Anim. Agric. 2022, 47, 65–75. [Google Scholar] [CrossRef]
- Martinez, A.A.G.; de Alencar Nääs, I.; Abe, J.M.; Pereira, D.F. A mobile application to follow up the management of broiler flocks. AgriEngineering 2021, 3, 990–1000. [Google Scholar] [CrossRef]
- Moon, J.; DuBien, J.; Ramachandran, R.; Liang, Y.; Dridi, S.; Tabler, T. Effects of a sprinkler and cool cell combined system on cooling water usage, litter moisture, and indoor environment of broiler houses. Animals 2023, 13, 2939. [Google Scholar] [CrossRef] [PubMed]
- Naseem, S.; King, A.J. Ammonia production in poultry houses can affect health of humans, birds, and the environment—Techniques for its reduction during poultry production. Environ. Sci. Pollut. Res. 2018, 25, 15269–15293. [Google Scholar] [CrossRef]
- Balthazar, G.d.R.; Silveira, R.M.F.; Silva, I.J.O. Use of multi-agent systems and the Internet of Things to monitor the environment of commercial broiler poultry houses through specific air enthalpy. J. Anim. Behav. Biometeorol. 2024, 12, e2024012. [Google Scholar] [CrossRef]
- Ferreira, J.C.; Campos, A.T.; Ferraz, P.F.P.; Bahuti, M.; Junior, T.Y.; da Silva, J.P.; Ferreira, S.C. Dynamics of the thermal environment in climate-controlled poultry houses for broiler chickens. AgriEngineering 2024, 6, 3891–3911. [Google Scholar] [CrossRef]
- Küçüktopcu, E.; Cemek, B.; Simsek, H.; Ni, J.-Q. Computational fluid dynamics modeling of a broiler house microclimate in summer and winter. Animals 2022, 12, 867. [Google Scholar] [CrossRef]
- Lara, J.L.; Rostagno, M.H. Impact of heat stress on poultry production. Animals 2013, 3, 356–369. [Google Scholar] [CrossRef]
- Massari, J.M.; de Moura, D.J.; de Alencar Nääs, I.; Branco, T.; Pereira, D.F. Computer-vision-based indexes for analyzing broiler response to rearing environment: A proof of concept. Animals 2022, 12, 846. [Google Scholar] [CrossRef]
- Martinez, A.A.G.; de Alencar Nääs, I.; de Carvalho-Curi, T.M.R.; Abe, J.M.; da Silva Lima, N.D. A heuristic and data mining model for predicting broiler house environment suitability. Animals 2021, 11, 2780. [Google Scholar] [CrossRef]
- Branco, T.; de Moura, D.J.; de Alencar Nääs, I.; da Silva Lima, N.D.; Klein, D.R.; de Medeiros Oliveira, S.R. The sequential behavior pattern analysis of broiler chickens exposed to heat stress. AgriEngineering 2021, 3, 447–457. [Google Scholar] [CrossRef]
- Baracho, M.S.; Nääs, I.A.; Lima, N.D.S.; Cordeiro, A.F.S.; Moura, D.J. Factors affecting broiler production: A meta-analysis. Braz. J. Poult. Sci. 2019, 21, eRBCA-2019. [Google Scholar] [CrossRef]
- Kwon, B.Y.; Lee, H.G.; Jeon, Y.S.; Song, J.Y.; Kim, S.H.; Kim, D.W.; Kim, C.H.; Lee, K.W. Research note: Welfare and stress responses of broiler chickens raised in conventional and animal welfare-certified broiler farms. Poult. Sci. 2024, 103, 103402. [Google Scholar] [CrossRef] [PubMed]
- Kwon, B.Y.; Kim, S.T.; Kim, D.H.; Park, J.; Lee, H.G.; Jeon, Y.S.; Song, J.Y.; Kim, S.H.; Kim, D.W.; Kim, C.H.; et al. Effects of perch on productivity, welfare, and physiological indicators of broiler chickens reared in animal welfare-certificated farms. Vet. Sci. 2024, 11, 614. [Google Scholar] [CrossRef]
- Sakamoto, K.S.; Silveira, R.M.F.; Benincasa, N.C.; Contreras Castillo, C.J.; Villegas Lobos, C.M.V.; da Silva, I.J.O. Tunnel-ventilated sheds with negative pressure reduce thermal stress and improve the meat quality of broilers. Animals 2024, 14, 2017. [Google Scholar] [CrossRef]
- Liu, L.; Ren, M.; Ren, K.; Jin, Y.; Yan, M. Heat stress impacts on broiler performance. Poult. Sci. 2020, 99, 6205–6211. [Google Scholar] [CrossRef]
- Eltahan, H.M.; Kang, C.W.; Chowdhury, V.S.; Eltahan, H.M.; Abdel-Maksoud, M.A.; Mubarak, A.; Lim, C.I. Cold drinking water boosts the cellular and humoral immunity in heat-exposed laying hens. Animals 2023, 13, 580. [Google Scholar] [CrossRef]
- Perini, F.; Cendron, F.; Rovelli, G.; Castellini, C.; Cassandro, M.; Lasagna, E. Emerging genetic tools to investigate molecular pathways related to heat stress in chickens. Animals 2021, 11, 46. [Google Scholar] [CrossRef] [PubMed]
- Kim, C.H.; Lee, W.D.; Lim, S.J.; Yang, K.Y.; Jeon, J.H. Effects of cool water supply on laying performance, egg quality, rectal temperature and stress hormones in heat-stressed laying hens in open-type laying houses. Animals 2025, 15, 1635. [Google Scholar] [CrossRef]
- Kim, C.H.; Lee, W.D.; Son, J.S.; Jeon, J.H.; Lim, S.J.; Kim, S.M. Effects of providing enrichment to broilers in an animal welfare environment on productivity, litter moisture, gas concentration (CO2 and NH3), animal welfare indicators, and stress level concentration. Agriculture 2025, 15, 182. [Google Scholar] [CrossRef]
- He, S.; Lin, J.; Jin, Q.; Ma, X.; Liu, Z.; Chen, H.; Ma, J.; Zhang, H.; Descovich, K.; Phillips, C.J.C.; et al. The relationship between animal welfare and farm profitability in cage and free-range housing systems for laying hens in China. Animals 2022, 12, 2090. [Google Scholar] [CrossRef]
- Massari, J.M.; de Moura, D.J.; de Alencar Nääs, I.; Pereira, D.F.; Oliveira, S.R.d.M.; Branco, T.; Barros, J.d.S.G. Sequential behavior of broiler chickens in enriched environments under varying thermal conditions using the generalized sequential pattern algorithm: A proof of concept. Animals 2024, 14, 2010. [Google Scholar] [CrossRef] [PubMed]
- Martinez, A.A.G.; de Alencar Nääs, I.; de Carvalho-Curi, T.M.R.; Abe, J.M. Applying paraconsistent annotated logic Eτ for optimizing broiler housing conditions. AgriEngineering 2024, 6, 1252–1265. [Google Scholar] [CrossRef]
- Coelho, D.J.d.R.; Tinôco, I.F.F.; Souza, C.F.; Baptista, F.J.F.; Barbari, M.; Kelle, P.O. Thermal environment of masonry-walled poultry house in the initial life stage of broilers. Rev. Bras. Eng. Agríc. E Ambient. 2019, 23, 203–208. [Google Scholar] [CrossRef]
- Brugaletta, G.; Teyssier, J.-R.; Rochell, S.J.; Dridi, S.; Sirri, F. A review of heat stress in chickens. part I: Insights into physiology and gut health. Front. Physiol. 2022, 13, 934381. [Google Scholar] [CrossRef]
- Ma, H.; Tu, Y.; Yang, X.; Yang, Z.; Liang, C. Influence of tunnel ventilation on the indoor thermal environment of a poultry building in winter. Build. Environ. 2022, 223, 109448. [Google Scholar] [CrossRef]
- Kim, H.R.; Ryu, C.; Lee, S.D.; Cho, J.H.; Kang, H. Effects of heat stress on the laying performance, egg quality, and physiological response of laying hens. Animals 2024, 14, 1076. [Google Scholar] [CrossRef]
- Lallo, C.H.O.; Cohen, J.; Rankine, D.; Taylor, M.; Cambell, J.; Stephenson, T. Characterizing heat stress on livestock using the temperature humidity index (THI)—Prospects for a warmer Caribbean. Reg. Environ. Change 2018, 18, 2329–2340. [Google Scholar] [CrossRef]
- Habeeb, A.A.; Gad, A.E.; Atta, M.A. Temperature-Humidity Indices as indicators to heat stress of climatic conditions with relation to production and reproduction of farm animals. Int. J. Biotechnol. Recent Adv. 2018, 1, 35–50. [Google Scholar] [CrossRef]
- Tao, X.; Xin, H. Acute synergistic effects of air temperature, humidity, and velocity on homeostasis of market-size broilers. Trans. ASAE 2003, 46, 491–497. [Google Scholar]
- Özbek, M.; Petek, M.; Ardıçlı, S. Physical quality characteristics of breast and leg meat of slow- and fast-growing broilers raised in different housing systems. Arch. Anim. Breed. 2020, 63, 337–344. [Google Scholar] [CrossRef]
- Jedlicka, M. Faktory Ovlivňující Welfare Brojlerů. (Factors Influencing the Welfare of Broilers). Available online: https://naschov.cz/faktory-ovlivnujici-welfare-brojleru/ (accessed on 22 November 2025). (In Czech)
- Chen, L.; Fabian-Wheeler, E.E.; Cimbala, J.M.; Hofstetter, D.; Patterson, P. Computational fluid dynamics analysis of alternative ventilation schemes in cage-free poultry housing. Animals 2021, 11, 2352. [Google Scholar] [CrossRef]
- De Carvalho Curi, T.M.R.; de Alencar Nääs, I.; da Silva Lima, N.D.; Martinez, A.A.G. Climate change impact on Brazilian broiler production cost: A simulation study. Int. J. Environ. Sci. Technol. 2022, 19, 10589–10598. [Google Scholar] [CrossRef]
- Harrouz, J.P.; Al Assaad, D.; Orabi, M.; Ghali, K.; Ouahrani, D.; Ghaddar, N. Modeling and optimization of poultry house passive cooling strategies in semiarid climates. Int. J. Energy Res. 2021, 45, 20795–20811. [Google Scholar] [CrossRef]
- Wu, S.; Zhang, L.; Han, Z.; Hu, C.; An, D. Research on microclimate optimization of traditional residential buildings in central Anhui based on humid and hot climate characteristics and regional architectural features. Buildings 2024, 14, 2323. [Google Scholar] [CrossRef]
- Firfiris, V.K.; Martzopoulou, A.G.; Kotsopoulos, T.A. Passive cooling systems in livestock buildings towards energy saving. Energy Build. 2019, 202, 109368. [Google Scholar] [CrossRef]
- Wang, Y.; Li, B.; Liang, C.; Zheng, W. Dynamic simulation of thermal load and energy efficiency in poultry buildings in the cold zone of China. Comput. Electron. Agric. 2020, 168, 105127. [Google Scholar] [CrossRef]
- Derakhshani, S.M.; Ogink, N.W.M.; Bos, B.A.P.; Groot Koerkamp, P.W.G. Sensitivity analysis of fine dust spreading from litter in poultry houses. Biosyst. Eng. 2021, 208, 272–286. [Google Scholar] [CrossRef]
- Polat, H.E. Effects of poultry building design on indoor air quality in humid climates. J. Anim. Plant Sci. 2015, 25, 1264–1272. [Google Scholar]
- Cui, Y.; Theo, E.; Gurler, T.; Su, Y.; Saffa, R. A comprehensive review on renewable and sustainable heating systems for poultry farming. Int. J. Low-Carbon Technol. 2020, 15, 121–142. [Google Scholar] [CrossRef]
- Leishman, E.M.; Ellis, J.; van Staaveren, N.; Barbut, S.; Vanderhout, R.J.; Osborne, V.R.; Wood, B.J.; Harlander-Matauschek, A.; Baes, C.F. Meta-analysis to predict the effects of temperature stress on meat quality of poultry. Poult. Sci. 2021, 100, 101471. [Google Scholar] [CrossRef] [PubMed]
- Jebari, H.; Rekiek, S.; Reklaoui, K. Advancing precision livestock farming: Integrating hybrid AI, IoT, cloud and edge computing for enhanced welfare and efficiency. Int. J. Adv. Comput. Sci. Appl. 2025, 16, 302–311. [Google Scholar] [CrossRef]
- Kang, S.; Kim, D.-H.; Lee, S.; Lee, T.; Lee, K.-W.; Chang, H.-H.; Moon, B.; Ayasan, T.; Choi, Y.-H. An Acute, Rather than progressive, increase in temperature-humidity index has severe effects on mortality in laying hens. Front. Vet. Sci. 2020, 7, 568093. [Google Scholar] [CrossRef]
- Pessato, A.; McKechnie, A.E.; Buchanan, K.L.; Mariette, M.M. Vocal panting: A novel thermoregulatory mechanism for enhancing heat tolerance in a desert-adapted bird. Sci. Rep. 2020, 10, 18914. [Google Scholar] [CrossRef] [PubMed]
- Šranková, V.; Lendelová, J.; Mihina, Š.; Žitňák, M.; Nawalany, G. Mortality of broiler chickens during summer fattening periods affected by microclimatic conditions. Acta Technol. Agric. 2019, 22, 22–30. [Google Scholar] [CrossRef]
- Kim, H.R.; Seong, P.; Seol, K.H.; Park, J.E.; Kim, H.; Park, W.; Cho, J.H.; Lee, S.D. Effects of heat stress on growth performance, physiological responses, and carcass traits in broilers. J. Therm. Biol. 2025, 127, 103994. [Google Scholar] [CrossRef]
- Saeed, M.; Abbas, G.; Alagawany, M.; Kamboh, A.A.; Abd El-Hack, M.E.; Khafaga, A.F.; Chao, S. Heat stress management in poultry farms: A comprehensive overview. J. Therm. Biol. 2019, 84, 414–425. [Google Scholar] [CrossRef]
- Borzouie, S.; Rathgeber, B.M.; Stupart, C.M.; MacIsaac, J.; MacLaren, L.A. Effects of dietary inclusion of seaweed, heat stress and genetic strain on performance, plasma biochemical and hematological parameters in laying hens. Animals 2020, 10, 1570. [Google Scholar] [CrossRef]
- Angrecka, S.; Herbut, P.; Nawalany, G.; Sokołowski, P. The impact of localization and barn type on insolation of sidewall stalls during summer. J. Ecol. Eng. 2017, 18, 60–66. [Google Scholar] [CrossRef]
- Kic, P. Microclimatic conditions in the poultry houses. Agron. Res. 2016, 14, 82–92. [Google Scholar]
- Prado, R.T.A.; Ferreira, F.L. Measurement of albedo and analysis of its influence the surface temperature of building roof materials. Energy Build. 2005, 37, 295–300. [Google Scholar] [CrossRef]
- Schabbach, L.M.; Marinoski, D.L.; Güths, S.; Bernardin, A.M.; Fredel, M.C. Pigmented glazed ceramic roof tiles in Brazil: Thermal and optical properties related to solar reflectance index. Sol. Energy 2018, 159, 113–124. [Google Scholar] [CrossRef]
- Liu, T.; Xu, P.; Zhang, T.; Shen, Y.; Tao, Y.; Qi, F.; Yan, S. Effects of cloud and tree shading on surface temperature of different pavement materials for urban sidewalks. Int. J. Biometeorol. 2025, 69, 605–619. [Google Scholar] [CrossRef] [PubMed]
- Honson, V.; Huynh-Thu, Q.; Arnison, M.; Monaghan, D.; Isherwood, Z.J.; Kim, J. Effects of shape, roughness and gloss on the perceived reflectance of colored surfaces. Front. Psychol. 2020, 11, 485. [Google Scholar] [CrossRef]
- Liang, Y.; Tabler, G.T.; Dridi, S. Sprinkler technology improves broiler production sustainability: From stress alleviation to water usage conservation: A mini review. Front. Vet. Sci. 2020, 7, 544814. [Google Scholar] [CrossRef] [PubMed]
- Bustamante, E.; García-Diego, F.-J.; Calvet, S.; Estellés, F.; Beltrán, P.; Hospitaler, A.; Torres, A.G. Exploring ventilation efficiency in poultry buildings. Energies 2013, 6, 2605–2623. [Google Scholar] [CrossRef]
- Cao, V.D.; Zajicek, M.; Kic, P. Summer ventilation of poultry house for chicken fattening in CFD modelling. In Proceedings of the 16th International Scientific Conference Engineering for Rural Development, Jelgava, Latvia, 26 May 2017; pp. 461–466. [Google Scholar]
- West, D.; Akter, S.; Cheng, B.; Oviedo, E.; Classen, J.; Wang-Li, L. Impacts of air velocity treatments under summer conditions: Part III—Litter characteristics, ammonia emissions, and leg health of heavy broilers. Animals 2024, 14, 3525. [Google Scholar] [CrossRef]
- Akter, S.; Cheng, B.; West, D.; Liu, Y.; Qian, Y.; Zou, X.; Classen, J.; Cordova, H.; Oviedo, E.; Wang-Li, L. Impacts of air velocity treatments under summer condition: Part I—Heavy broiler’s surface temperature response. Animals 2022, 12, 328. [Google Scholar] [CrossRef]
- Akter, S.; Liu, Y.; Cheng, B.; Classen, J.; Oviedo, E.; Harris, D.; Wang-Li, L. Impacts of air velocity treatments under summer conditions: Part II—Heavy broiler’s behavioral response. Animals 2022, 12, 1050. [Google Scholar] [CrossRef]
- Yahav, S.; Shinder, D.; Tanny, J.; Cohen, S. Sensible heat loss: The broiler’s paradox. Worlds Poult. Sci. J. 2005, 61, 419–434. [Google Scholar] [CrossRef]
- Liang, Y.; Tabler, G.T.; Costello, T.A.; Berry, I.L.; Watkins, S.E.; Thaxton, Y. Cooling broiler chickens by surface wetting: Indoor thermal environment, water usage, and bird performance. Appl. Eng. Agric. 2014, 30, 249–258. [Google Scholar] [CrossRef]
- ČSN 73 0543-2; Vnitřní Prostředí Stájových Objektů: Část 2: Větrání a Vytápění (Internal Environment in Buildings for Animals. Part 2: Ventilation and Heating). Czech Office for Standards, Metrology and Testing: Praha, Czech Republic, 1998. (In Czech)
- Tůmová, E.; Englmaierová, M.; Chodová, D.; Lichovníková, M. Chov Drůbeže II. (Poultry Breeding II.), 1st ed.; Czech University of Life Sciences Prague: Prague, Czech Republic, 2019. (In Czech) [Google Scholar]
- Mesa, D.; Muniz, E.; Souza, A.; Geffroy, B. Broiler-housing conditions affect the performance. Rev. Bras. Ciênc. Avícola 2017, 19, 263–272. [Google Scholar] [CrossRef]
- Ministry of Agriculture of the Czech Republic. Vyhláška č. 464/2009 Sb. Vyhláška, Kterou se Mění Vyhláška č. 208/2004 Sb., o Minimálních Standardech Pro Ochranu Hospodářských Zvířat, ve Znění Vyhlášky č. 425/2005 Sb. (Decree No. 208/2004 Coll., on Minimum Standards for the Protection of Farm Animals, as Amended by Decree No. 425/2005 Coll.); Ministry of Agriculture of the Czech Republic: Prague, Czech Republic, 2009. (In Czech) [Google Scholar]
- Stull, R. Wet-Bulb temperature from relative humidity and air temperature. J. Appl. Meteorol. Climatol. 2011, 50, 2267–2269. [Google Scholar] [CrossRef]
- Aviagen Group. Broiler Management Handbook 2018; Aviagen: Huntsville, AL, USA, 2019; 187p, Available online: https://staging.aviagen.com/assets/Tech_Center/Ross_PS/RossPSHandBook2018.pdf (accessed on 17 October 2025).
- Vox, G.; Maneta, A.; Schettini, E. Evaluation of the radiometric properties of roofing materials for livestock buildings and their effect on the surface temperature. Biosyst. Eng. 2016, 144, 26–37. [Google Scholar] [CrossRef]
- Baracho, M.S.; Nääs, I.A.; Betin, P.S.; Moura, D.J. Factors that influence the production, environment, and welfare of broiler chicken: A systematic review. Braz. J. Poult. Sci. 2018, 20, 617–624. [Google Scholar] [CrossRef]
- Reichstädterová, T.; Lendelová, J.; Miniha, S.; Pogran, Š.; Bošanský, M.; Žitňák, M. Assessment of hygienic criteria of a building envelope in poultry housing. Trends Agric. Eng. 2013, 2013, 542–546. [Google Scholar]
- Donkoh, A. Ambient temperature: A factor affecting performance and physiological response of broiler chickens. Int. J. BiometeoroIogy 1989, 33, 259–265. [Google Scholar] [CrossRef]


Disclaimer/Publisher’s Note: The statements, opinions and data contained in all publications are solely those of the individual author(s) and contributor(s) and not of MDPI and/or the editor(s). MDPI and/or the editor(s) disclaim responsibility for any injury to people or property resulting from any ideas, methods, instructions or products referred to in the content. |
© 2026 by the authors. Licensee MDPI, Basel, Switzerland. This article is an open access article distributed under the terms and conditions of the Creative Commons Attribution (CC BY) license.