Abstract
Accurate and timely crop yield estimation remains a major challenge in agriculture due to the limitations of traditional field-based methods, which are labor-intensive, destructive, and unsuitable for large-scale applications. While recent advances in Unmanned Aerial Vehicles (UAVs) and Deep Learning (DL) have enabled non-destructive and scalable alternatives, melons (Cucumis melo L.) remain relatively understudied, and datasets for yield estimation are scarce. This study presents a computer vision pipeline for UAV-based fruit detection and yield estimation in melon crops. High-resolution UAV RGB imagery was processed using YOLOv12 (You Only Look Once, version 12) for fruit detection, followed by a volume-based regression model for weight estimation. The experiment was conducted during the May–August 2025 growing season in Apulia, southern Italy. The detection model achieved high accuracy, with strong agreement between estimated and actual fruit counts (R2 = 0.99, MAPE = 5%). The regression model achieved an R2 of 0.79 for individual weight estimation and a total yield error of 2.9%. By addressing the scarcity of melon-specific data, this work demonstrates that integrating UAV imagery with deep learning provides an effective and scalable approach for accurate yield estimation in melons.
1. Introduction
At the global scale, the agriculture sector faces unprecedented challenges, including rapid population growth, climate change, and the degradation of natural resources. These factors have exerted considerable pressure on existing agricultural practices, necessitating the development of innovative solutions to ensure food security and environmental sustainability [1]. Within this framework, precision agriculture (PA) has emerged as transformative approach that provides a data-driven foundation for optimizing resource utilization and improving crop management. This system encompasses the integration of remote sensing techniques and the application of artificial intelligence, thereby facilitating informed decision-making processes.
Among high-value crops, Melon (Cucumis melo L.), represents an agricultural commodity of considerable economic significance worldwide, yet it poses a particular challenge in yield estimation [2]. Yield estimation is of paramount importance, as it provides indispensable insights into the input–output relationships.
Conventionally, yield estimation has relied on farmers’ experiential knowledge and a destructive sampling procedure. These approaches are labor-intensive, time-consuming, and economically inefficient [3]. Moreover, alternative empirical methods often depend on extrapolations from historical data, which may not accurately reflect spatial and temporal variability [4].
The development of advanced yield monitoring systems would enable farmers to more effectively monitor crop quality, optimize practices, and estimate the labor force, which would consequently lead to a reduction in operating costs and enhancing decision-making efficiency [5]. This availability of accurate yield data is equally valuable for post-harvest management, influencing logistics, storage optimization, and marketing strategies [6].
The deployment of UAVs in precision agriculture has revolutionized crop monitoring. UAVs equipped with Red–Green–Blue (RGB), multispectral, hyperspectral, or thermal sensors, provide high-resolution spatial data essential for the assessment of water stress, plant health, and potential yield. Compared to satellite or manned aerial systems, UAVs offer lower operational costs, greater flexibility, and high temporal resolution, thereby enabling regular and targeted surveys. Nevertheless, constraints in payload, flight duration, and sensor performance continue to constrain their utility [7].
In the field of agricultural applications, object detection methods are of increasing importance. These methods find applications in various fields, including but not limited to fruit maturity classification, crop monitoring, and automated harvesting. The utilization of these methodologies is primarily concerned with two overarching functions: the identification and categorization of objects within a given image. The recognition of images in the agricultural field is considered a highly challenging endeavor. This phenomenon is primarily attributable to the unstructured nature of the environment and its objects [8,9]. The interpretation of a digital color image of fruit captured in a natural field environment is complicated by a number of factors. These factors include adverse weather conditions, luminance variability, the presence of dust, insects, and obstructions such as branches and leaves. Furthermore, other unavoidable image noise must be considered [10,11]. The high variability of the objects, which differ in shape, color, size, and texture, further complicates this task [12].
Computer vision (CV) techniques have exhibited considerable potential for fruit counting and yield estimation, providing an accurate and cost-effective alternative to manual counting methods. The process of object detection involves the application of models to discern the nature and position of objects within digital images. Conventional approaches, including top-hat filtering [13] and watershed segmentation [14], have been investigated for the purpose of fruit detection and enumeration. However, the advent of deep learning, particularly convolutional neural networks (CNNs), has led to a significant proliferation of object detection.
CNN-based object detection algorithms are generally divided into two categories: one-stage and two-stage detectors. The advent of one-stage detectors, exemplified by the YOLO algorithm, has signified a substantial advancement in this domain [15]. These detectors process the image in its entirety during a solitary forward pass, ensuring expeditiousness and efficiency. In contrast, two-stage detectors, such as the Faster Regional Convolutional Network (Faster R-CNN) [16], initially generate candidate object regions before refining the detection in a subsequent stage. Given the pervasive utilization of the YOLO model for fruit detection, researchers have proposed modifications to specific crops such as mango [17], oranges [18], tomatoes [19], and strawberries [20]. The purpose of these adaptations is to address the specific challenges posed by different crops. The focus is on improving detection accuracy, particularly for small objects. A comparison of CV deep learning-based methods with conventional techniques and experimental analyses for determining fruit reveals higher detection efficiency without the necessity of costly and labor-intensive experimental processes. However, as far as we are aware, most existing methods, while capable of accurately detecting melons, rely on experimental techniques that measure specific attributes of the fruit’s shape and color.
A major challenge in research endeavors targeting melon detection in expansive field settings pertains to the scarcity of high-quality, large-scale datasets. Existing melon datasets are marred by various issues, including but not limited to low image resolution, insufficient volume of data, and the absence of systematic ripeness classification in image annotations [21]. Furthermore, the detection of melons in field environments imposes stricter demands on methodologies. These requirements extend beyond the mere achievement of high detection accuracy to include considerations of computational efficiency.
The precise estimation of total yield in terms of weight is a complex task that requires the accurate identification of the fruit in the field and the estimation of individual fruit size. A close relationship exists between fruit weight and volume. In previous studies, scholars have proposed the use of multiple images [22,23,24]. However, as indicated by [6], single-image approaches have been used to estimate fruit volume and weight from images. The assessment of fruit volume from a single image is accomplished through the implementation of algorithms that utilize supportive reference objects [25].
A significant positive linear correlation between fruit weight and fruit dimensions has been demonstrated in [26]. As indicated in the research by [27], this relationship facilitates the estimation of fruit weight through the utilization of data collected via machine vision techniques. As delineated in another work [28], the weight of yellow melons was estimated through contour detection, which relied on Otsu’s segmentation [29]. In another investigation, an artificial neural network (ANN) was employed to ascertain the correlation between fruit segmentation and fruit mass [4].
The integration of CV methodologies, such as image recognition, with images captured from UAVs, has been demonstrated to facilitate the acquisition of pertinent information regarding the geographical location of fruit within a field, in addition to its dimensions and morphology [8]. As demonstrated in the works of [30,31], the acquisition of images was facilitated by means of an Unmanned Aerial Vehicle (UAV). In the study by [32], image resolution was 5472 × 3648 pixels, with a ground sampling distance (GSD) of 0.4 cm width rectangular. This resulted in the presence of numerous diminutive targets within each image, with a limited spatial distribution across the field of view. As demonstrated by [32,33], the prevailing end-to-end solution for determining the weight of individual melons manifested inaccuracies arising from the false-positive detection of melon regions.
To address these challenges, this study presents a vision-based framework for melon yield estimation utilizing high-resolution UAV imagery. The methodology incorporates the YOLOv12 deep learning architecture to enable precise detection of individual melons under real field conditions. Following detection, each fruit is quantitatively characterized through geometric descriptors including shape metrics, projected surface area, and volumetric proxies, which serve as inputs to predictive models for estimating total yield by weight. The proposed framework provides a non-destructive, scalable, and operational tool for advancing precision agriculture in specialty crop systems, while additionally contributing to alleviating the current scarcity of robust, high-quality melon datasets.
The major contributions of this work can be summarized as follows: (1) a high-resolution UAV RGB dataset for melon (Cucumis melo L.) fruit detection and yield estimation was developed from acquisitions performed during the May–August 2025 growing season in Apulia (southern Italy), addressing the scarcity of melon-specific datasets; (2) an end-to-end, non-destructive, and scalable UAV-based computer vision framework was proposed by integrating YOLOv12-based fruit detection and counting with geometric feature extraction and a volume-based regression model for fruit weight and total yield estimation; and (3) the proposed pipeline was validated against field measurements, demonstrating strong agreement for fruit counting (R2 = 0.99, MAPE = 5%) and competitive yield estimation performance (individual weight estimation R2 = 0.79; total yield error = 2.9%).
2. Materials and Methods
2.1. Study Area
The experiment was conducted during the May–August 2025 growing season in an open field in the experimental field of the Mediterranean Agronomic Institute of Bari, located in the Apulia region of southern Italy (Figure 1). The study area is located at 41°03′16″ N and 16°52′32″ E, at an elevation of 77 m above sea level. The field covers a total surface area of 1408 m2 (0.14 ha).
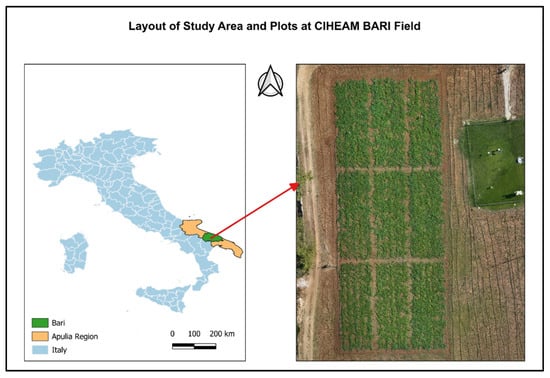
Figure 1.
Experimental field at CIHEAM Bari, showing the field layout, individual plots, and the location of the weather station.
Meteorological data were obtained from the weather station located at the CIHEAM Bari experimental field (as illustrated in Figure 1, right panel). The local climate is classified as Mediterranean, characterized by hot, dry summers and mild winters. The mean annual precipitation is 487.1 mm, with the majority of rainfall occurring during the winter and autumn seasons. The mean monthly air temperatures range from 8.5 °C in January to 26.6 °C in July.
2.2. Dataset Acquisition
As demonstrated in (Figure 2), the DJI Mavic 3M drone was utilized to obtain imagery data. The UAV is equipped with a 20-megapixel RGB visible wavelength camera that utilizes a 4/3-inch CMOS sensor. The device is also equipped with a 5-megapixel multispectral camera, featuring a 1/2.8-inch CMOS sensor that operates across the wavelengths of green (560 ± 16 nm), red (650 ± 16 nm), red edge (730 ± 16 nm), and near-infrared (860 ± 26 nm). The drone is equipped with an onboard global navigation satellite system (GNSS), in addition to an RTK module. The drone is equipped with a sunlight sensor, an integrated component that captures solar irradiance and records it in an image file that is essential for the radiometric calibration.
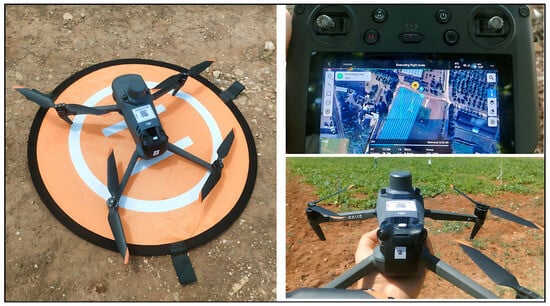
Figure 2.
DJI Mavic 3M UAV equipped with RGB and multispectral cameras used for data collection.
Flights were conducted close to solar noon, a strategy that was implemented to minimize shadow effects while ensuring stable illumination and enhanced radiometric consistency for sensor calibration. As demonstrated by [34], midday flights have been shown to reduce sun angle-related reflectance variability and increase the reliability of multispectral measurements. Flight campaigns were conducted on a biweekly schedule throughout the entire growing season. For the purposes of this study, particular emphasis was placed on six flights carried out during the final pre-harvest period. The parameters established for the flight plan were set to incorporate 80% lateral and 80% frontal overlap, thereby ensuring sufficient coverage to match features across the different images and create more accurate maps. The flights at an altitude of 65 and 21 m enabled the obtention of GSD of 3 and 1 cm respectively. Furthermore, the velocity of the UAV was set at 0.9 m per second to minimize motion blur. The duration of the flights was approximately 4 and 13 min for each flight (with a GSD of 3 and 1 cm, respectively). According to [35], higher speeds can lead to a reduction in image sharpness and radiometric consistency, particularly for multispectral sensors. Accordingly, relatively low speeds are recommended when acquiring data that necessitates high spatial resolution. While higher velocities could potentially reduce total mapping time, such an approach may compromise image quality. In the present study, optimization of acquisition speed was not a primary objective.
2.3. Data Processing
Image processing was performed using Pix4D software, version 4.5.6 (Pix4D SA, Lausanne, Switzerland), resulting in the generation of a georeferenced orthomosaic with high georeferencing accuracy. Each image contained a multitude of yellow and green melons of varying sizes and shapes. Prior to image acquisition, 79 melons were randomly selected and marked in the field with adjacent signs. The signs were oriented upright to ensure clear visibility within the captured images (Figure 3). The size and mass of each marked melon were recorded and employed as ground-truth data for subsequent analysis during the image processing stage.
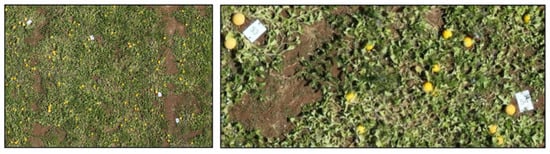
Figure 3.
Sample of UAV-derived orthomosaic showing field-marked melons with reference signs.
The flights conducted in the final pre-harvest period are used to generate the dataset, which totals six flights. The melon plots were segmented into 95 sub-images from the orthomosaic derived from the aforementioned flights. Each sub-image corresponds to a specific plot section, facilitating object detection. The GSD of the imagery on which the labeling process was executed was 1 cm, which was sufficiently detailed to reliably identify individual melons. At coarser resolutions 3 cm GSD, distinguishing fruits by manual labeling was considerably more difficult due to reduced spatial clarity. Consequently, data on this resolution were excluded from further analyses. The dataset was labeled as a single fruit class without explicit differentiation between maturity stages using of online platform Roboflow (https://roboflow.com/) and was exported in the YOLOv12 format. Each labeling file contains a single row for each bounding box, with the object class and bounding box coordinates specified. The coordinates are then subjected to a process of normalization, encompassing the x and y positions of the centroid of the bounding box, in addition to their width and height.
A total of 95 sub-images extracted from the orthomosaics were used in this study. These sub-images originated from different portions of the experimental field and therefore captured variability in vegetation density, fruit distribution, background soil exposure, and illumination conditions. The annotated dataset was randomly divided into training (67 images, 70%), validation (19 images, 20%), and testing (9 images, 10%) subsets.
2.4. Object Detection
As mentioned earlier, the model used in this study was YOLO which is a series of object detection models developed following the introduction of its architecture by [15]. The YOLO algorithm functions by dividing the image into grid cells, predicting objects at each cell, and selecting the most suitable candidate based on Intersection over Union (IoU) and confidence score. The IoU is a metric that calculates the overlap between the predicted and ground truth bounding boxes relative to their total area. The confidence score represents the probability that an object is present within a bounding box. The implementation of bounding boxes involves the utilization of the IoU metric for filtering, followed by the application of Non-Maximum Suppression (NMS) as a post-processing step. This procedure is employed to eliminate redundancy and overlap among boxes, thereby ensuring the efficiency and precision of the system. Early versions of the YOLO model employed predefined boxes with constant dimensions, designated as anchor boxes, to enhance detection accuracy. These anchor boxes provided an initial estimate of object dimensions in each grid cell, contributing to the improvement in detection performance.
YOLOv12 represents the latest version of the object detection algorithm, which was released in February 2025 by Ultralytics. YOLOv12 is a pioneering advancement in the field of real-time object detection, characterized by its innovative attention-centric approach. This approach serves to address the performance disparity that has been observed between conventional CNNs and attention-based architecture. Contrary to the prior iterations of YOLO that predominantly employed CNNs to optimize efficiency, YOLOv12 incorporates attention mechanisms without compromising speed.
A computer vision pipeline comprising two steps was developed for the purpose of detecting melon fruits in images obtained from UAVs. The first component of the system is object detection using a trained YOLOv12 model. The second component is post-processing of detected bounding boxes through segmentation and ellipse fitting to derive per-fruit metrics (Figure 4).
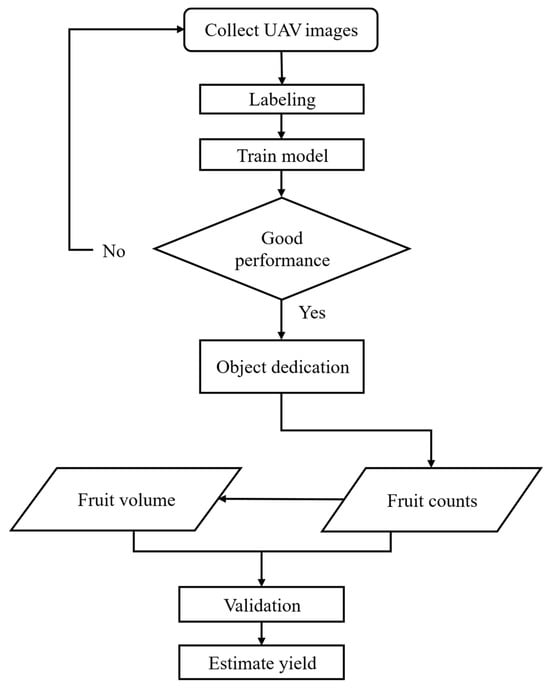
Figure 4.
Workflow of the UAV image-based melon fruit detection and yield estimation.
2.4.1. Fruit Counting
The fruit detection process was executed through the utilization of the YOLOv12 architecture, which was trained on a curated set of melon images.
The YOLOv12 model introduces an attention-centric architecture that diverges from the conventional CNN-based approaches utilized in earlier YOLO models. Notwithstanding, it maintains the critical real-time inference speed that is indispensable for numerous applications. The development of this model was driven by the objective of attaining state-of-the-art object detection accuracy. This endeavor entailed the implementation of innovative methodologies, particularly in the domain of attention mechanisms and the overall network architecture. A key priority in the development process was the maintenance of real-time performance, ensuring that the model could operate efficiently in real-time scenarios.
The inference process was implemented in Python 3.12 within a Google Colab environment, leveraging the NVIDIA T4 GPU with 16 GB of GPU RAM. The following parameters were utilized: a confidence threshold of 0.25, a non-maximum suppression with an IoU threshold of 0.50, image resizing to 1280 pixels, and training over 100 epochs. The confidence threshold delineates the minimum probability requisite for the model to retain a predicted bounding box; predictions below 0.25 are designated as low-certainty detections. Prior to training, all images were resized to 1280 pixels on the longest edge to ensure a consistent input size across the dataset. This approach has been shown to improve training stability and computational efficiency while preserving sufficient spatial detail for fruit detection.
2.4.2. Geometrical Feature Extraction
For each YOLOv12 detection axis-aligned bounding box, a numbered region of interest (ROI) is extracted and processed to estimate fruit geometry including the steps below.
- Segmentation
The ROI is converted to grayscale, normalized to [0, 1], and segmented using the Chan–Vese active contour model with an interior circular initialization. This step yields a binary mask of the putative fruit region (parameters: µ = 0.25, λ1 = 1, λ2 = 1, tolerance = 10−3, maximum 200 iterations).
- Contour extraction and ellipse fitting
The external contours are computed, and the largest contour is retained. If the contour contains a minimum of five points, a best-fit ellipse is computed. If the contour points are found to be inadequate, the detection is designated as insufficient contour points as shown in (Figure 5). Subsequently, pixel-space ellipse parameters are converted to centimeters, employing a GSD of 1 cm px−1.
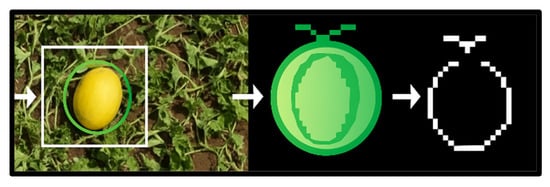
Figure 5.
Contour extraction and ellipse fitting.
- Geometry and volume
In this study, the ellipsoidal volume assumption was adopted to ensure computational efficiency and scalability in UAV-based field applications. The fitted ellipse’s major, minor and diagonal axes for melon shape are denoted by A, B and C, respectively, in centimeters [36]. Ellipse area is as follows.
The volume (V) estimate is as follows:
In addition, bounding-box width/height (px), area (converted to cm2), and fruit center coordinates are recorded both in pixels and centimeters.
- Quality control and fallback
For each image, a cumulative record of unsuccessful fits is maintained, classified as “no contour”, “insufficient points” or “fitEllipse error”. In the event that an image exhibits a minimum of five such failures and at least one ellipse fit successfully, the model utilizes the per-image mean of the successful ellipse axes (Ā, ) to backfill the failed detections, while setting the angle to 0°. Concurrently, all other per-detection metadata is recorded. A global summary report is generated to document the total number of failures across the batch.
2.5. Object Detection Model Evaluation Metrics
Precision (P) is measured by the ratio of true positives to all positive predictions. The evaluation metrics encompass the frequency with which the model accurately predicted an object, in relation to the total number of predictions made. The calculation of precision is as follows:
Conversely, recall (R) calculates the number of actual positive detections made by the model. The calculation of recall is as follows:
The average precision (AP) is defined as the area under the recall-precision curve utilizing a specified interpolation. Typically, the AP is calculated at a set of eleven equally spaced recall values. The mean average precision (mAP) is calculated by taking the mean AP over all classes and is equal to the AP when there is only one class. The mAP is calculated for an IoU threshold of 50%, resulting in the designation of mAP50. The mAP50–95 is calculated at varying IoU thresholds, typically ranging from 50 to 95% to increments of 5%. The calculation of the average precision is performed using the following equation:
In this context, TP (true positive) denotes a true detection, and a fruit detection is considered a true positive if the predicted and ground-truth bounding box has an IoU greater than a fixed threshold. FP (false positive) indicates a false detection, i.e., an algorithm’s misprediction of background as a melon. FN (false negative) refers to a ground-truth melon that was not detected due to an algorithm’s failure to detect a real melon. TN (true negative) is defined as a corrected misdetection. The fourth detection performance measure was average precision (AP), a summary of the precision-recall curve and calculated as a weighted mean of precisions achieved at each threshold, with the increase in recall from the previous threshold used as the weight.
2.6. Validation of the Yield Estimation
Yield data, consisting of harvested fruit weights from 79 melons, were collected to serve as ground truth and assess the performance of the fruit counting algorithm as shown in (Figure 6). The system’s performance in estimating the weight of a single melon was evaluated using the mean absolute percentage error (MAPE) index, which quantifies the discrepancy between the estimated weight derived from image processing and the reference value obtained through direct measurement. The estimation of overall yield was derived by summing the weights of all melons that were marked in the field and then comparing these sums to the melons’ actual weights. An evaluation of the regression quality was conducted using R2 to assess the goodness of fit between fruit counts and yield. The resulting linear model was employed to calculate RMSE, MAE, and the MAPE using the following equations:
where n is the number of point samples, yi is observed values and ŷi is predicted values.
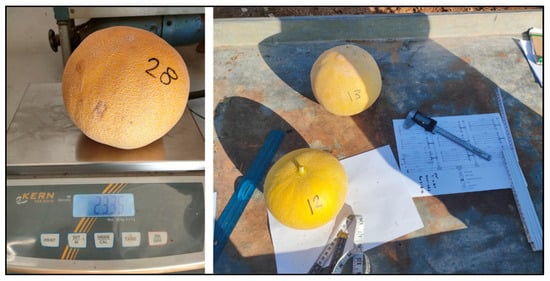
Figure 6.
Yield measurements obtained from direct observation of the field.
3. Results and Discussion
3.1. Model Training Results
The YOLOv12 model demonstrated strong efficacy in detecting melon fruits, as reflected by the evaluation metrics. The training process showed stable and smooth convergence over 100 epochs, characterized by a consistent reduction in loss functions and the subsequent stabilization of performance metrics. Specifically, box loss quantifies the accuracy of the predicted bounding box coordinates relative to the ground truth, while classification loss measures the correctness of the predicted class labels. Distribution focal loss evaluates the quality of the predicted probability distributions, with increased emphasis on harder-to-classify examples. Across both the training and validation sets, all three loss components exhibited a consistent downward trend, ultimately reaching minimal values toward the end of the training process. This pattern indicates a progressive improvement in the model’s ability to localize and classify melon fruits, with minimal evidence of overfitting, as demonstrated by the close correspondence between training and validation loss curves.
Figure 7 presents the evolution of training and validation loss functions alongside performance metrics over 100 epochs. Specifically, train/box_loss and val/box_loss correspond to bounding box regression loss, train/cls_loss and val/cls_loss denote classification loss, and train/dfl_loss and val/dfl_loss represent distribution focal loss. Model performance is further evaluated using metrics/precision(B) and metrics/recall(B), which indicate precision and recall for melon detection (class B). Additionally, metrics/mAP50(B) and metrics/mAP50–95(B) reports the mean Average Precision at an Intersection over Union (IoU) threshold of 0.50 and the averaged mAP across IoU thresholds from 0.50 to 0.95, respectively.
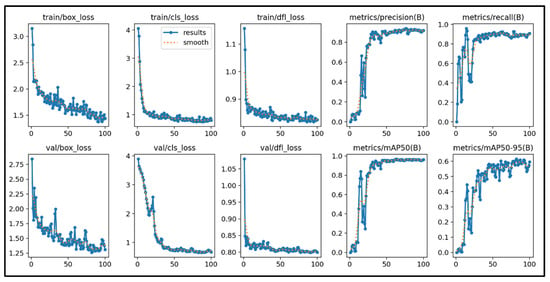
Figure 7.
Detection performance of YOLO12 for melon.
Regarding the performance metrics, both precision and recall demonstrated rapid growth during the initial 20 epochs, subsequently stabilizing at values ≥ 0.85. This indicates that the model consistently identified true positives while minimizing false-positive predictions. Similarly, the mAP50, computed at an IoU threshold of 0.5, quickly reached values exceeding 0.9, further confirming the model’s high detection accuracy. The more stringent mAP50–95 metric also exhibited a steady upward trend, stabilizing around 0.7 after 100 epochs, reflecting robust performance across a range of IoU thresholds. The observed convergence, alongside the stabilization of the loss curves and the aforementioned metrics, suggests that the YOLOv12 model has been effectively trained for melon fruit detection, achieving both high accuracy and strong generalization capabilities.
The accuracy of the detection was verified by comparing the results with field manual counts from the three harvests. As demonstrated in (Table 1), the discrepancies between model estimation and field counts were negligible, ranging from 3% to 7%. The statistical validation of the model demonstrated robust performance, with an R2 of 0.99, RMSE of 5.68, and a mean MAPE of 5%. The margin of error exhibited a decline over time, which can be attributed to the persistent decrease in vegetation cover during the subsequent growth phases of the crop. The model’s streamlined canopy facilitated enhanced fruit detection, thereby reducing the likelihood of detection failure due to occlusion. The findings confirm the YOLOv12 model’s potential and underscore its efficacy in agricultural monitoring within practical real-world applications. The capacity to attain near-equivalence with field counts underscores the significance of computer vision on UAVs in serving as a substitute for labor-intensive manual surveys. Consequently, this facilitates scalable, non-destructive, and timely yield estimation in precision agriculture.

Table 1.
Assessment of YOLOv12 detection vs. field manual counts across multiple harvests.
As demonstrated in (Figure 8), which presents outcomes from two plots of the experiment, a sample of YOLOv12 detection outputs on UAV images is presented, demonstrating the accurate localization and labeling of individual melon fruits with corresponding confidence scores. Specifically, even fruits partially occluded by leaves were consistently detected, though with lower confidence scores. The visual representation depicted herein demonstrates the reliability and resilience of the detection framework under consideration. It is further indicated that this framework has the capacity to translate raw images into quantitative fruit counts, which can subsequently be incorporated into yield models.
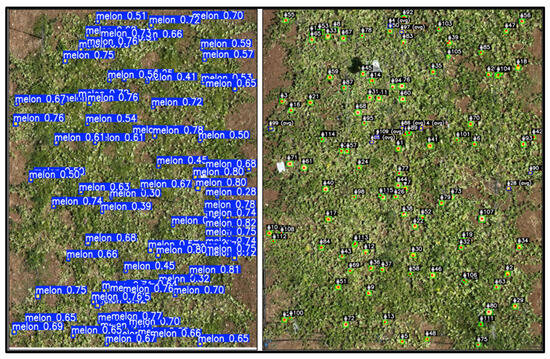
Figure 8.
Example of YOLOv12 output displaying individually labeled melon fruits with corresponding confidence scores.
3.2. Estimated Fruit Weight
Yield estimation is derived from a regression model that links the melon’s geometrical representation to an axis-symmetric, spheroidal model. The regression model was constructed using a sample of 79 randomly selected melons, which were imaged by the UAV and subsequently measured in the laboratory to obtain reference weights and geometric properties. The major, minor, and diagonal axes of the fitted ellipse are denoted by A, B, and C, respectively, recorded in centimeters.
A multi-step regression approach was employed to investigate the relationship between the estimated volume derived from the fruit geometry, and final yield. In the first stage, a regression model was used to correlate the measured fruit weight and volume (Figure 9), achieving an R2 value of 0.89. This strong correlation confirms the biophysical consistency between fruit mass and volume, thereby supporting the hypothesis that fruit volume can serve as a reliable intermediate variable for indirect yield estimation.
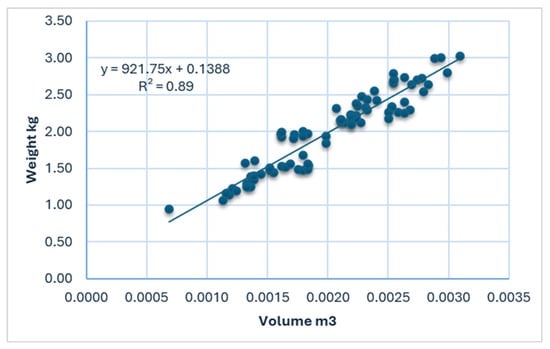
Figure 9.
Regression of fruit weight as a function of measured volume.
In a subsequent step, estimated fruit volumes were compared with field-measured values (Figure 10). The model exhibited a satisfactory fit, with an R2 value of 0.86, indicating the potential of the proposed computer vision pipeline to accurately estimate melon volume.
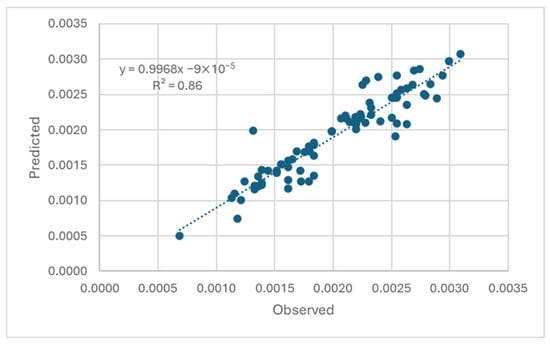
Figure 10.
Correlation between UAV-derived and field-measured fruit volumes.
Consequently, the accuracy of the sequential yield estimation model was further evaluated by assessing the discrepancy between estimated and actual yield weights. Regression analysis produced an R2 value of 0.79, indicating that approximately 80% of the observed variation in yield could be explained by the model, as illustrated in Figure 11.
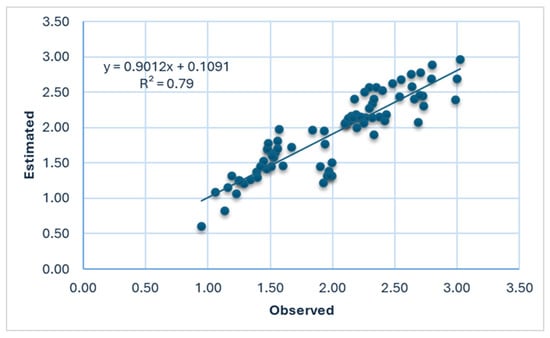
Figure 11.
Regression of estimated versus actual yield weights.
The reliability of the approach was confirmed by error estimates, which yielded RMSE of 0.26 kg, MAE of 0.19 kg, and MAPE of 9.77%. These values ensure that the estimated yield predictions exhibit a variation of less than 10% on average from the respective data. This precision level is considered acceptable for field-scale yield estimation.
It is important to note that real melon fruits frequently deviate from an ideal ellipsoidal geometry due to inherent biological variability, surface irregularities, and deformations caused by soil contact or fruit clustering during growth. These deviations can introduce systematic bias when simplified geometric models are used for volume estimation. Because fruit weight is inferred from the estimated volume, the error in volume estimation directly propagate to the weight estimation.
A comparison of the proposed framework with previous studies on melon estimation yield reveals enhanced performance and increased consistency. Ref. [32] employed a regression-based methodology, leveraging high-resolution UAV images with GSD of 0.4 cm. This approach yielded a MAPE of 9% for individual melon estimation, a total yield error of 2.9%, and an adjusted R2 of 0.87. In the present study, despite employing UAV imagery of coarser resolution 1 cm GSD, the model yielded a comparable degree of accuracy with R2 = 0.79. The implementation of a GSD with a lower resolution has been demonstrated to offer several practical operational advantages. Among these advantages are the capacity for higher-altitude flights, which results in a significant reduction in total flight time, and an increase in the area that can be covered per mission. This efficiency enhancement enables the mapping of larger fields with reduced battery swaps and a concomitant reduction in survey duration, while maintaining sufficient image detail for reliable fruit detection and yield estimation.
The findings indicate that the estimation of melon yield can be reliably conducted using lower-resolution imagery without compromising the efficacy of the prediction process. This approach mitigates constraints related to flight and data processing, thereby enhancing the overall estimation of melon yield. This finding underscores the efficacy of the proposed sequential modeling approach and highlights its potential for large-scale implementation under field operational conditions.
4. Conclusions
The study demonstrated the effectiveness of integrating UAV-based computer vision techniques for accurate and scalable estimation of yellow melon yield. The fruit detection framework developed, based on the YOLOv12 algorithm, proved to be a robust and efficient tool capable of automating fruit detection with good accuracy. Using 1 cm GSD imagery facilitated precise manual annotation, enabling the development of a reliable detection model that exhibited an excellent correspondence between estimated and actual fruit counts (R2 = 0.99, MAPE = 5%). The subsequent volume-based for individual weight estimation approach achieved an R2 of 0.79 with a total yield error of only 2.9%. These findings underscore the potential of UAV imagery combined with deep learning to provide rapid, non-destructive, and highly accurate yield estimations, thereby supporting data-driven decision-making in modern horticultural management systems.
Reduction in the imagery GSD to 3 cm resulted in a substantial drop of the clarity of fruit boundaries, thereby impeding the manual labeling process due to the merging of fruit with vegetation and the associated loss of spatial detail.
Beyond its application in melon production, this research contributes to the broader domain of precision and digital farming by offering a reproducible and transferable approach that integrates UAV sensing, geometric modeling, and artificial intelligence. The integration of these technologies is a critical component in the development of climate-smart and resource-efficient farm systems. In such systems, informed decision-making is facilitated by the availability of timely and objective information, leading to optimized productivity and environmental integrity.
The study recommends that future research focus on expanding the dataset to encompass a wider range of melon varieties and canopy structures to improve the robustness and capacity for generalization of the model. Additionally, employing three-dimensional reconstruction techniques, such as the use of LiDAR, can enhance fruit volume estimation, particularly under overlap or partial occlusion. Integrating RGB-based detection with multispectral or thermal imaging may further provide complementary insights into fruit health, maturity, and quality.
Author Contributions
Conceptualization, B.D.; methodology, H.A., G.D. and B.D.; software, H.A.; validation, H.A., G.D. and B.D.; formal analysis, H.A.; investigation, B.D.; data curation, H.A. and G.D.; writing—original draft preparation, H.A.; writing—review and editing, H.A., R.K., A.A.A.A. and B.D.; visualization, R.K., A.A.A.A. and B.D.; supervision, G.D., R.K., A.A.A.A. and B.D. All authors have read and agreed to the published version of the manuscript.
Funding
This research received no external funding.
Institutional Review Board Statement
Not applicable.
Informed Consent Statement
Not applicable.
Data Availability Statement
The data supporting the findings of this study consist of drone acquired images collected within the premises of the institute’s field. Due to institutional restrictions and privacy considerations, these data are not publicly available. The data may be made available from the authors upon request.
Conflicts of Interest
The authors declare no conflict of interest.
References
- Guebsi, R.; Mami, S.; Chokmani, K. Drones in precision agriculture: A comprehensive review of applications, technologies, and challenges. Drones 2024, 8, 686. [Google Scholar] [CrossRef]
- Liu, Y.; Fan, K.; Meng, L.; Nie, C.; Liu, Y.; Cheng, M.; Song, Y.; Jin, X. Synergistic use of stay-green traits and UAV multispectral information in improving maize yield estimation with the random forest regression algorithm. Comput. Electron. Agric. 2025, 229, 109724. [Google Scholar] [CrossRef]
- Aboutalebi, M.; Torres-Rua, A.F.; Allen, N. Multispectral remote sensing for yield estimation using high-resolution imagery from an unmanned aerial vehicle. In Autonomous Air and Ground Sensing Systems for Agricultural Optimization and Phenotyping III; SPIE: Washington, DC, USA, 2018; pp. 140–149. [Google Scholar]
- Cheng, H.; Damerow, L.; Sun, Y.; Blanke, M. Early yield prediction using image analysis of apple fruit and tree canopy features with neural networks. J. Imaging 2017, 3, 6. [Google Scholar] [CrossRef]
- Patel, H.N.; Jain, R.K.; Joshi, M.V. Automatic segmentation and yield measurement of fruit using shape analysis. Int. J. Comput. Appl. 2012, 45, 19–24. [Google Scholar]
- He, L.; Fang, W.; Zhao, G.; Wu, Z.; Fu, L.; Li, R.; Majeed, Y.; Dhupia, J. Fruit yield prediction and estimation in orchards: A state-of-the-art comprehensive review for both direct and indirect methods. Comput. Electron. Agric. 2022, 195, 106812. [Google Scholar] [CrossRef]
- Ariante, G.; Del Core, G. Unmanned aircraft systems (UASs): Current state, emerging technologies, and future trends. Drones 2025, 9, 59. [Google Scholar] [CrossRef]
- Carrio, A.; Sampedro, C.; Rodriguez-Ramos, A.; Campoy, P. A review of deep learning methods and applications for unmanned aerial vehicles. J. Sens. 2017, 2017, 3296874. [Google Scholar] [CrossRef]
- Guo, Y.; Liu, Y.; Oerlemans, A.; Lao, S.; Wu, S.; Lew, M.S. Deep learning for visual understanding: A review. Neurocomputing 2016, 187, 27–48. [Google Scholar] [CrossRef]
- Kapach, K.; Barnea, E.; Mairon, R.; Edan, Y.; Ben Shahar, O. Computer vision for fruit harvesting robots–state of the art and challenges ahead. Int. J. Comput. Vis. Robot. 2012, 3, 4–34. [Google Scholar] [CrossRef]
- Pereira, C.S.; Morais, R.; Reis, M.J.C.S. Recent advances in image processing techniques for automated harvesting purposes: A review. In 2017 Intelligent Systems Conference (IntelliSys); IEEE: New York, NY, USA, 2017; pp. 566–575. [Google Scholar]
- Patrício, D.I.; Rieder, R. Computer vision and artificial intelligence in precision agriculture for grain crops: A systematic review. Comput. Electron. Agric. 2018, 153, 69–81. [Google Scholar] [CrossRef]
- Lee, Y.-J.; Kim, K.-D.; Lee, H.-S.; Shin, B.-S. Vision-based potato detection and counting system for yield monitoring. J. Biosyst. Eng. 2018, 43, 103–109. [Google Scholar]
- Boatswain Jacques, A.A.; Adamchuk, V.I.; Park, J.; Cloutier, G.; Clark, J.J.; Miller, C. Towards a machine vision-based yield monitor for the counting and quality mapping of shallots. Front. Robot. AI 2021, 8, 627067. [Google Scholar] [CrossRef] [PubMed]
- Redmon, J.; Divvala, S.; Girshick, R.; Farhadi, A. You only look once: Unified, real-time object detection. In Proceedings of the IEEE Conference on Computer Vision and Pattern Recognition, Las Vegas, NV, USA, 27–30 June 2016; pp. 779–788. [Google Scholar]
- Ren, S.; He, K.; Girshick, R.; Sun, J. Faster R-CNN: Towards Real-Time Object Detection with Region Proposal Networks. In Advances in Neural Information Processing Systems; Curran Associates, Inc.: Red Hook, NY, USA, 2015. [Google Scholar]
- Koirala, A.; Walsh, K.B.; Wang, Z.; McCarthy, C. Deep learning for real-time fruit detection and orchard fruit load estimation: Benchmarking of ‘MangoYOLO’. Precis. Agric. 2019, 20, 1107–1135. [Google Scholar] [CrossRef]
- Lv, Y.; Lu, S.; Liu, X.; Bao, J.; Liu, B.; Chen, M.; Li, G. LDC-PP-YOLOE: A lightweight model for detecting and counting citrus fruit. Pattern Anal. Appl. 2024, 27, 114. [Google Scholar] [CrossRef]
- Kang, R.; Huang, J.; Zhou, X.; Ren, N.; Sun, S. Toward real scenery: A lightweight tomato growth inspection algorithm for leaf disease detection and fruit counting. Plant Phenomics 2024, 6, 0174. [Google Scholar] [CrossRef]
- Ma, Z.; Dong, N.; Gu, J.; Cheng, H.; Meng, Z.; Du, X. STRAW-YOLO: A detection method for strawberry fruits targets and key points. Comput. Electron. Agric. 2025, 230, 109853. [Google Scholar] [CrossRef]
- Jing, X.; Wang, Y.; Li, D.; Pan, W. Melon ripeness detection by an improved object detection algorithm for resource constrained environments. Plant Methods 2024, 20, 127. [Google Scholar] [CrossRef]
- Dehais, J.; Anthimopoulos, M.; Shevchik, S.; Mougiakakou, S. Two-view 3D reconstruction for food volume estimation. IEEE Trans. Multimed. 2016, 19, 1090–1099. [Google Scholar] [CrossRef]
- Hassannejad, H.; Matrella, G.; Ciampolini, P.; De Munari, I.; Mordonini, M.; Cagnoni, S. A new approach to image-based estimation of food volume. Algorithms 2017, 10, 66. [Google Scholar] [CrossRef]
- Rahman, M.H.; Li, Q.; Pickering, M.; Frater, M.; Kerr, D.; Bouchey, C.; Delp, E. Food volume estimation in a mobile phone based dietary assessment system. In 2012 Eighth International Conference on Signal Image Technology and Internet Based Systems; IEEE: New York, NY, USA, 2012; pp. 988–995. [Google Scholar]
- Li, H.; Han, T. DeepVol: Deep fruit volume estimation. In International Conference on Artificial Neural Networks; Springer: Berlin/Heidelberg, Germany, 2018; pp. 331–341. [Google Scholar]
- Sa, I.; Ge, Z.; Dayoub, F.; Upcroft, B.; Perez, T.; McCool, C. Deepfruits: A fruit detection system using deep neural networks. Sensors 2016, 16, 1222. [Google Scholar] [CrossRef]
- Koirala, A.; Walsh, K.B.; Wang, Z.; McCarthy, C. Deep learning–Method overview and review of use for fruit detection and yield estimation. Comput. Electron. Agric. 2019, 162, 219–234. [Google Scholar] [CrossRef]
- Calixto, R.R.; Neto, L.G.P.; da Silveira Cavalcante Aragão, M.F.; de Oliveira Silva, E. A computer vision model development for size and weight estimation of yellow melon in the Brazilian northeast. Sci. Hortic. 2019, 256, 108521. [Google Scholar] [CrossRef]
- Otsu, N. A threshold selection method from gray-level histograms. Automatica 1975, 11, 23–27. [Google Scholar] [CrossRef]
- Chen, Y.; Lee, W.S.; Gan, H.; Peres, N.; Fraisse, C.; Zhang, Y.; He, Y. Strawberry yield prediction based on a deep neural network using high-resolution aerial orthoimages. Remote Sens. 2019, 11, 1584. [Google Scholar] [CrossRef]
- Zhao, T.; Yang, Y.; Niu, H.; Chen, Y.; Wang, D. Comparing U-Net convolutional networks with fully convolutional networks in the performances of pomegranate tree canopy segmentation. In Proceedings of the Multispectral, Hyperspectral, and Ultraspectral Remote Sensing Technology, Techniques and Applications VII, Honolulu, HI, USA, 24–26 September 2018. [Google Scholar]
- Kalantar, A.; Edan, Y.; Gur, A.; Klapp, I. A deep learning system for single and overall weight estimation of melons using unmanned aerial vehicle images. Comput. Electron. Agric. 2020, 178, 105748. [Google Scholar] [CrossRef]
- Dashuta, A.; Klapp, I. Melon recognition in UAV images to estimate yield of a breeding process. In Optics and Photonics for Energy and the Environment; Optica Publishing Group: Washington, DC, USA, 2018; p. ET4A-2. [Google Scholar]
- Hunt, E.R., Jr.; Hively, W.D.; Fujikawa, S.J.; Linden, D.S.; Daughtry, C.S.T.; McCarty, G.W. Acquisition of NIR-green-blue digital photographs from unmanned aircraft for crop monitoring. Remote Sens. 2010, 2, 290–305. [Google Scholar] [CrossRef]
- Aasen, H.; Honkavaara, E.; Lucieer, A.; Zarco-Tejada, P.J. Quantitative remote sensing at ultra-high resolution with UAV spectroscopy: A review of sensor technology, measurement procedures, and data correction workflows. Remote Sens. 2018, 10, 1091. [Google Scholar] [CrossRef]
- Bronshtein, I.N.; Semendyayev, K.A.; Musiol, G.; Muehlig, H. Handbook of Mathematics; Springer: Berlin/Heidelberg, Germany, 2007. [Google Scholar]


Disclaimer/Publisher’s Note: The statements, opinions and data contained in all publications are solely those of the individual author(s) and contributor(s) and not of MDPI and/or the editor(s). MDPI and/or the editor(s) disclaim responsibility for any injury to people or property resulting from any ideas, methods, instructions or products referred to in the content. |
© 2026 by the authors. Licensee MDPI, Basel, Switzerland. This article is an open access article distributed under the terms and conditions of the Creative Commons Attribution (CC BY) license.